For the first step, I would use 1 µL of the stock solution diluted into 499 µL of water to make 500 µL of a 10,000 µM solution. Then for the next step, I would use 1 µL of the 10,000 µM dilution, diluted into 99 µL of water to make 100 µL of a 100 µM solution.
Dilution practice 2
The stock concentration of a mystery substance (MS) is 5 M. If the molar mass of MS is 532 g/mol, what’s the concentration of the stock concentration in g/mL?
$$ 5 M = 5 \frac{mol}{L} $$
$$ 5 \frac{mol}{L} * 532 \frac{g}{mol} = 2,660 \frac{g}{L} $$
$$ 2,660 \frac{g}{L}* \frac{1L}{1,000 mL} = 2.66 \frac{g}{mL} $$
You will perform a serial dilution to get 100 uM of MS. Devise a plan to dilute a 5 M MS solution to 100 uM. How many dilution steps will we need? Which tubes should we use? Which pipettes? We will need two empty microtubes. For the first step, we’ll use a P20 for the stock solution, and a P1000 for the water. For the second step, we’ll use a P20 for dilution 1, and a P200 for the water.
graph LR;
  A[stock solution 5M] -->|1µL stock into 499µL water| B[dilution 1: 10,000µM]
  B -->|1µL dilution1 into 99µL water| C[final dilution: 100 µM]
Fill out the following chart to prepare a final reaction with 60 uL reaction volume. Why did we make 100 uM MS if we actually need 40 uM MS? Why not prepare 40 uM in serial dilutions?
If we had 40 µM MS, then when we added the loading dye, it would be diluted below 40 µM. So we need to have a high enough concentration of MS, that we can add loading dye to 1X concentration and still reach a final MS concentration of 40 µM.
Lab
Part 1: Mixing Color
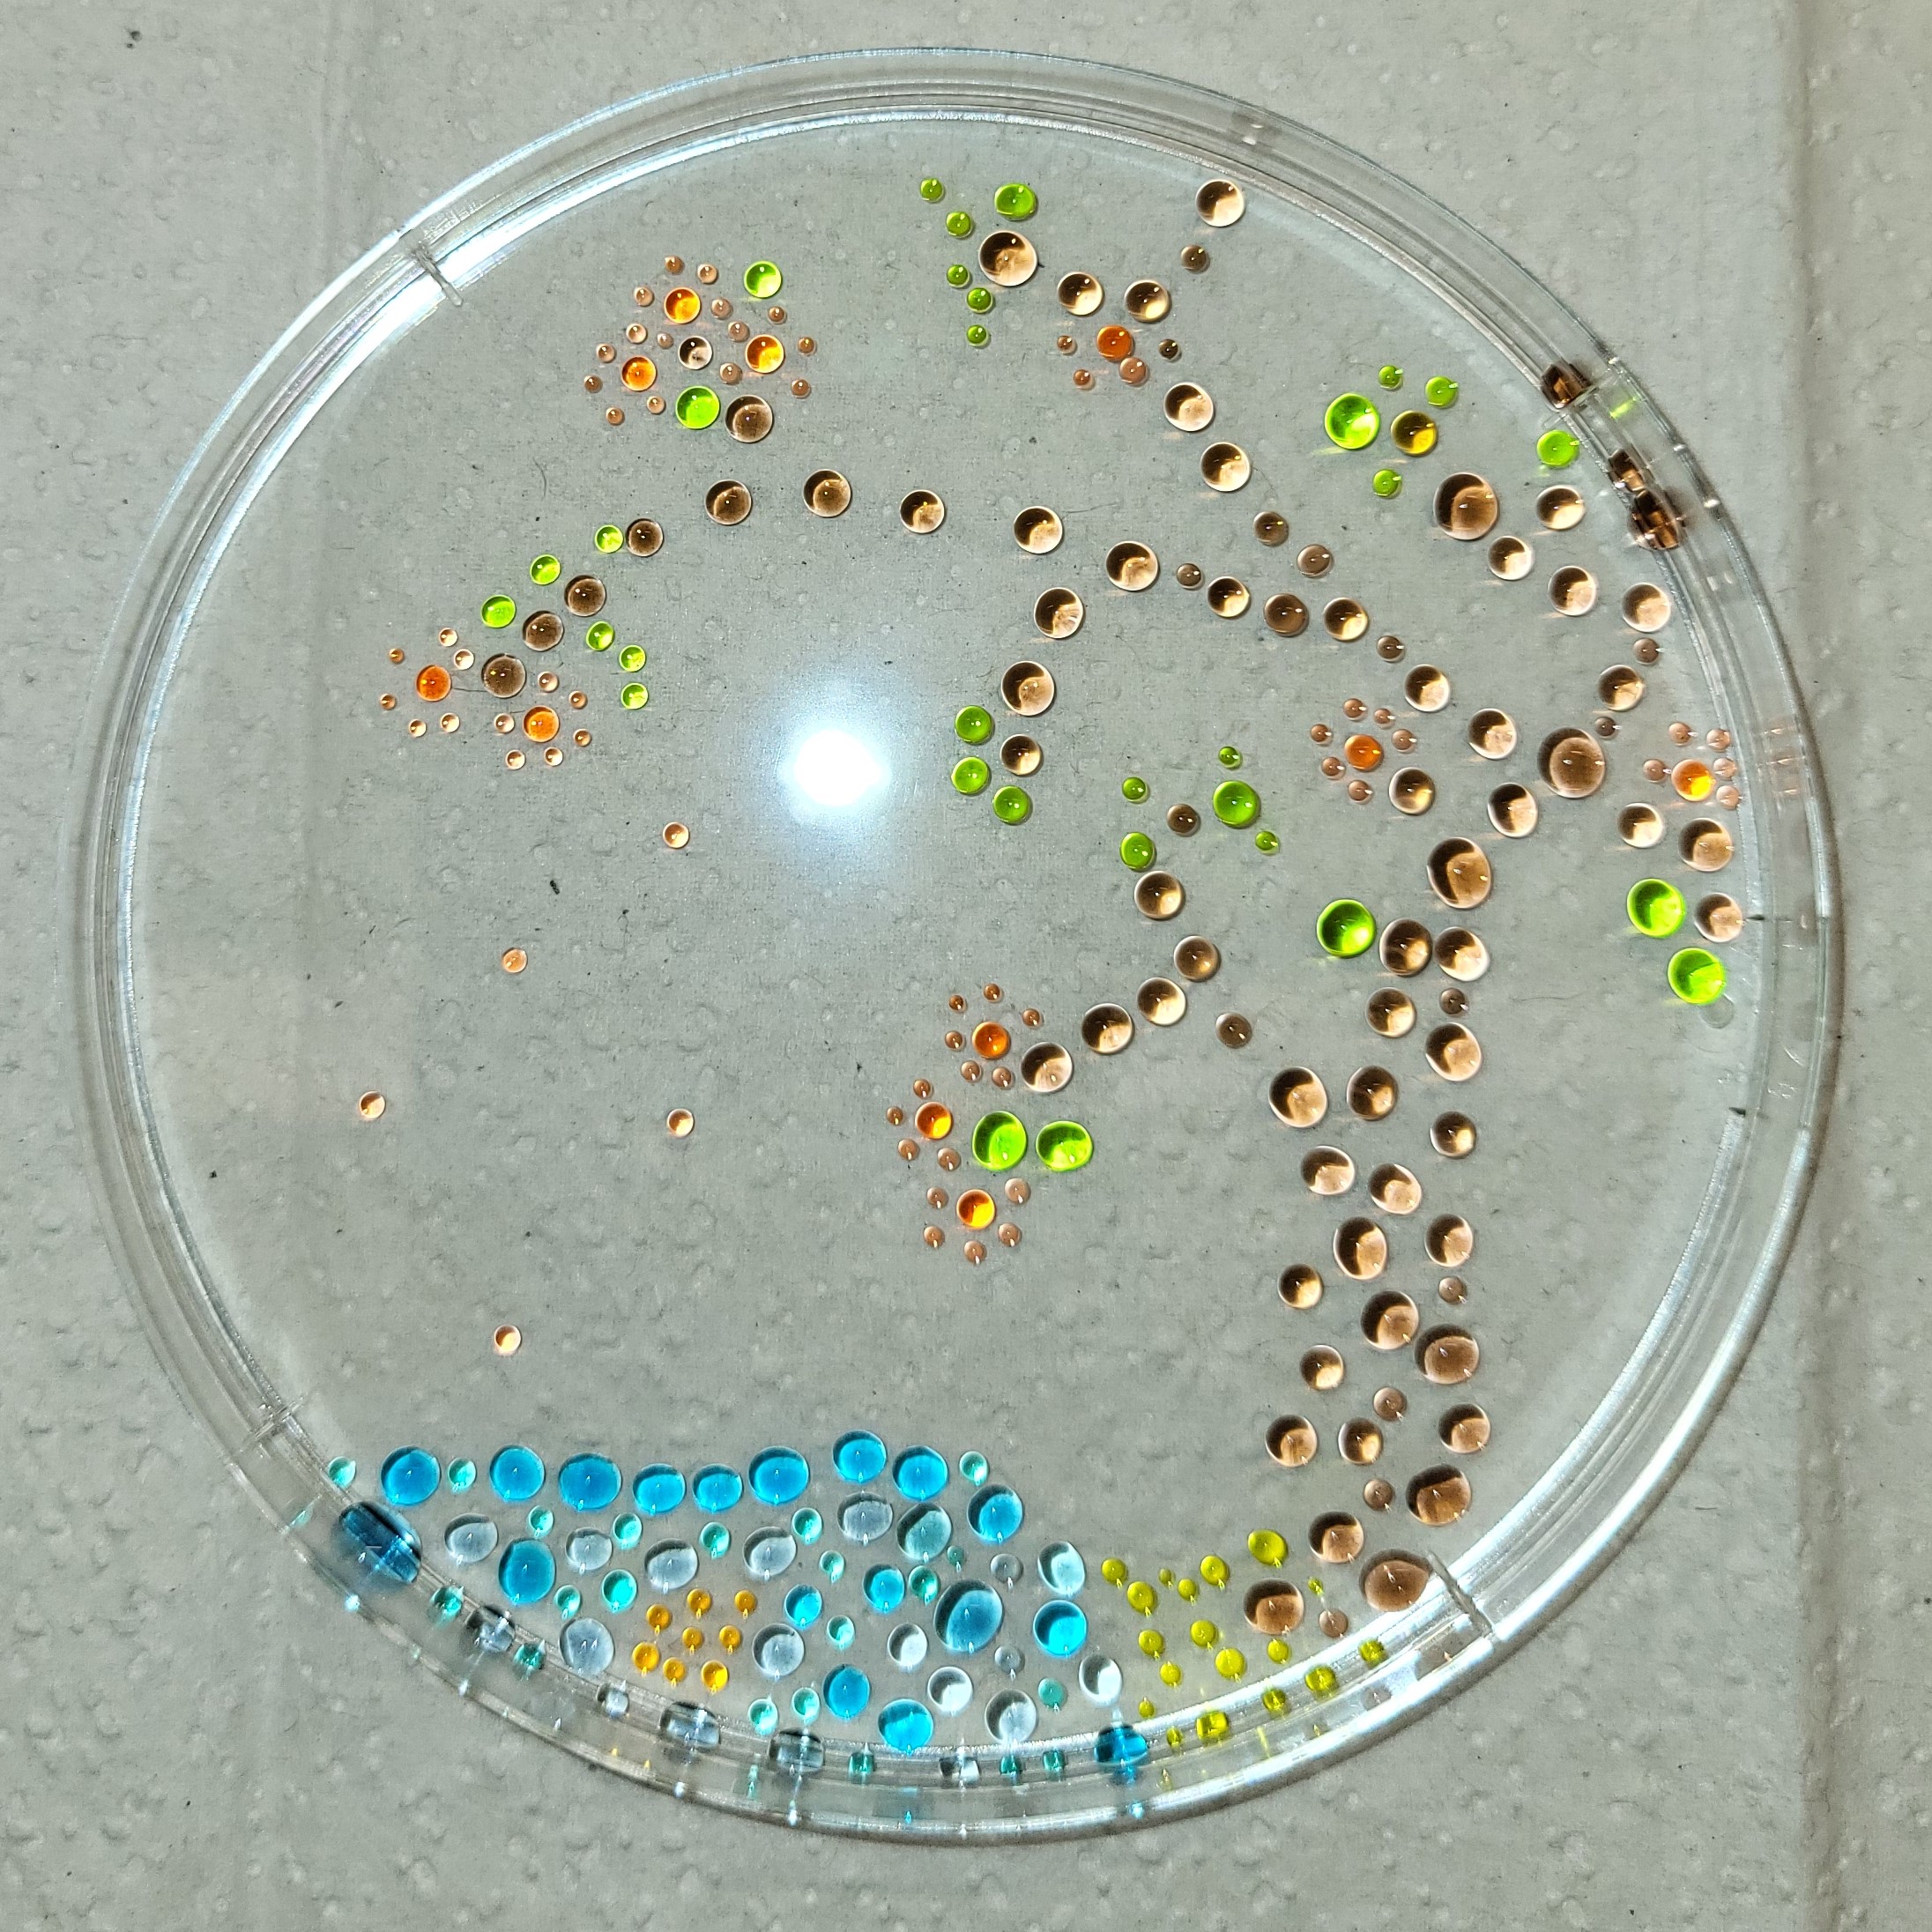
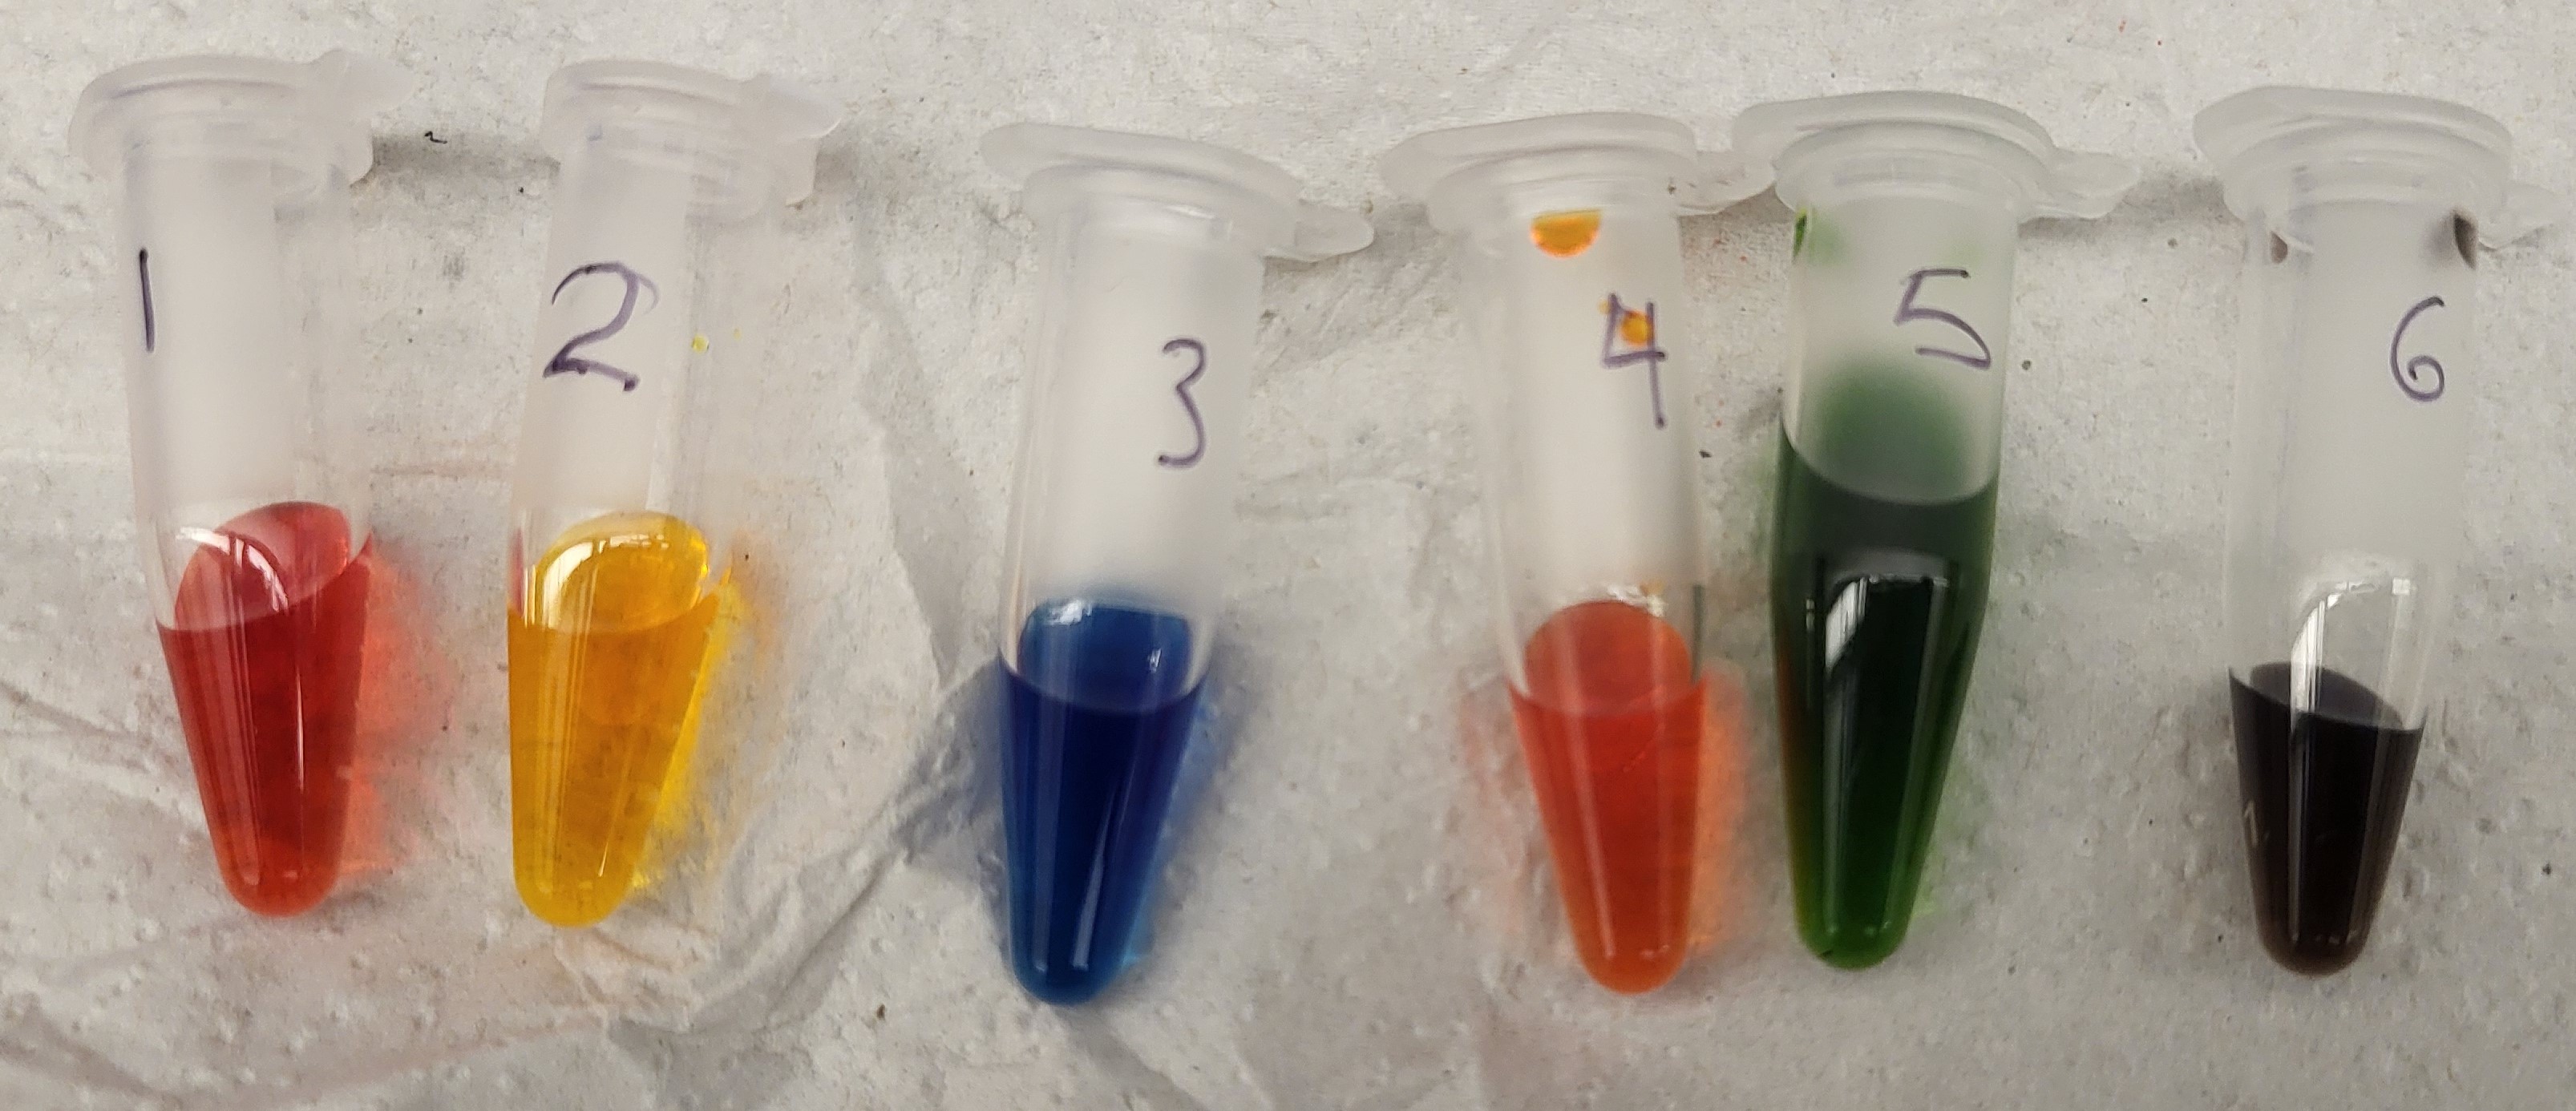
I made my stock color solutions by adding dye to approximately 5 ml water in three different 12 ml test tubes: 3 drops of yellow dye, 1 drop of blue dye, 2 drops of red dye, and then vortexing to mix.
Following the protocol, I obtained 6 colors. Step 4 was done with P20 and P200 in steps as described; steps 5 and 6 were done in single steps with the P1000 and P200 respectively.
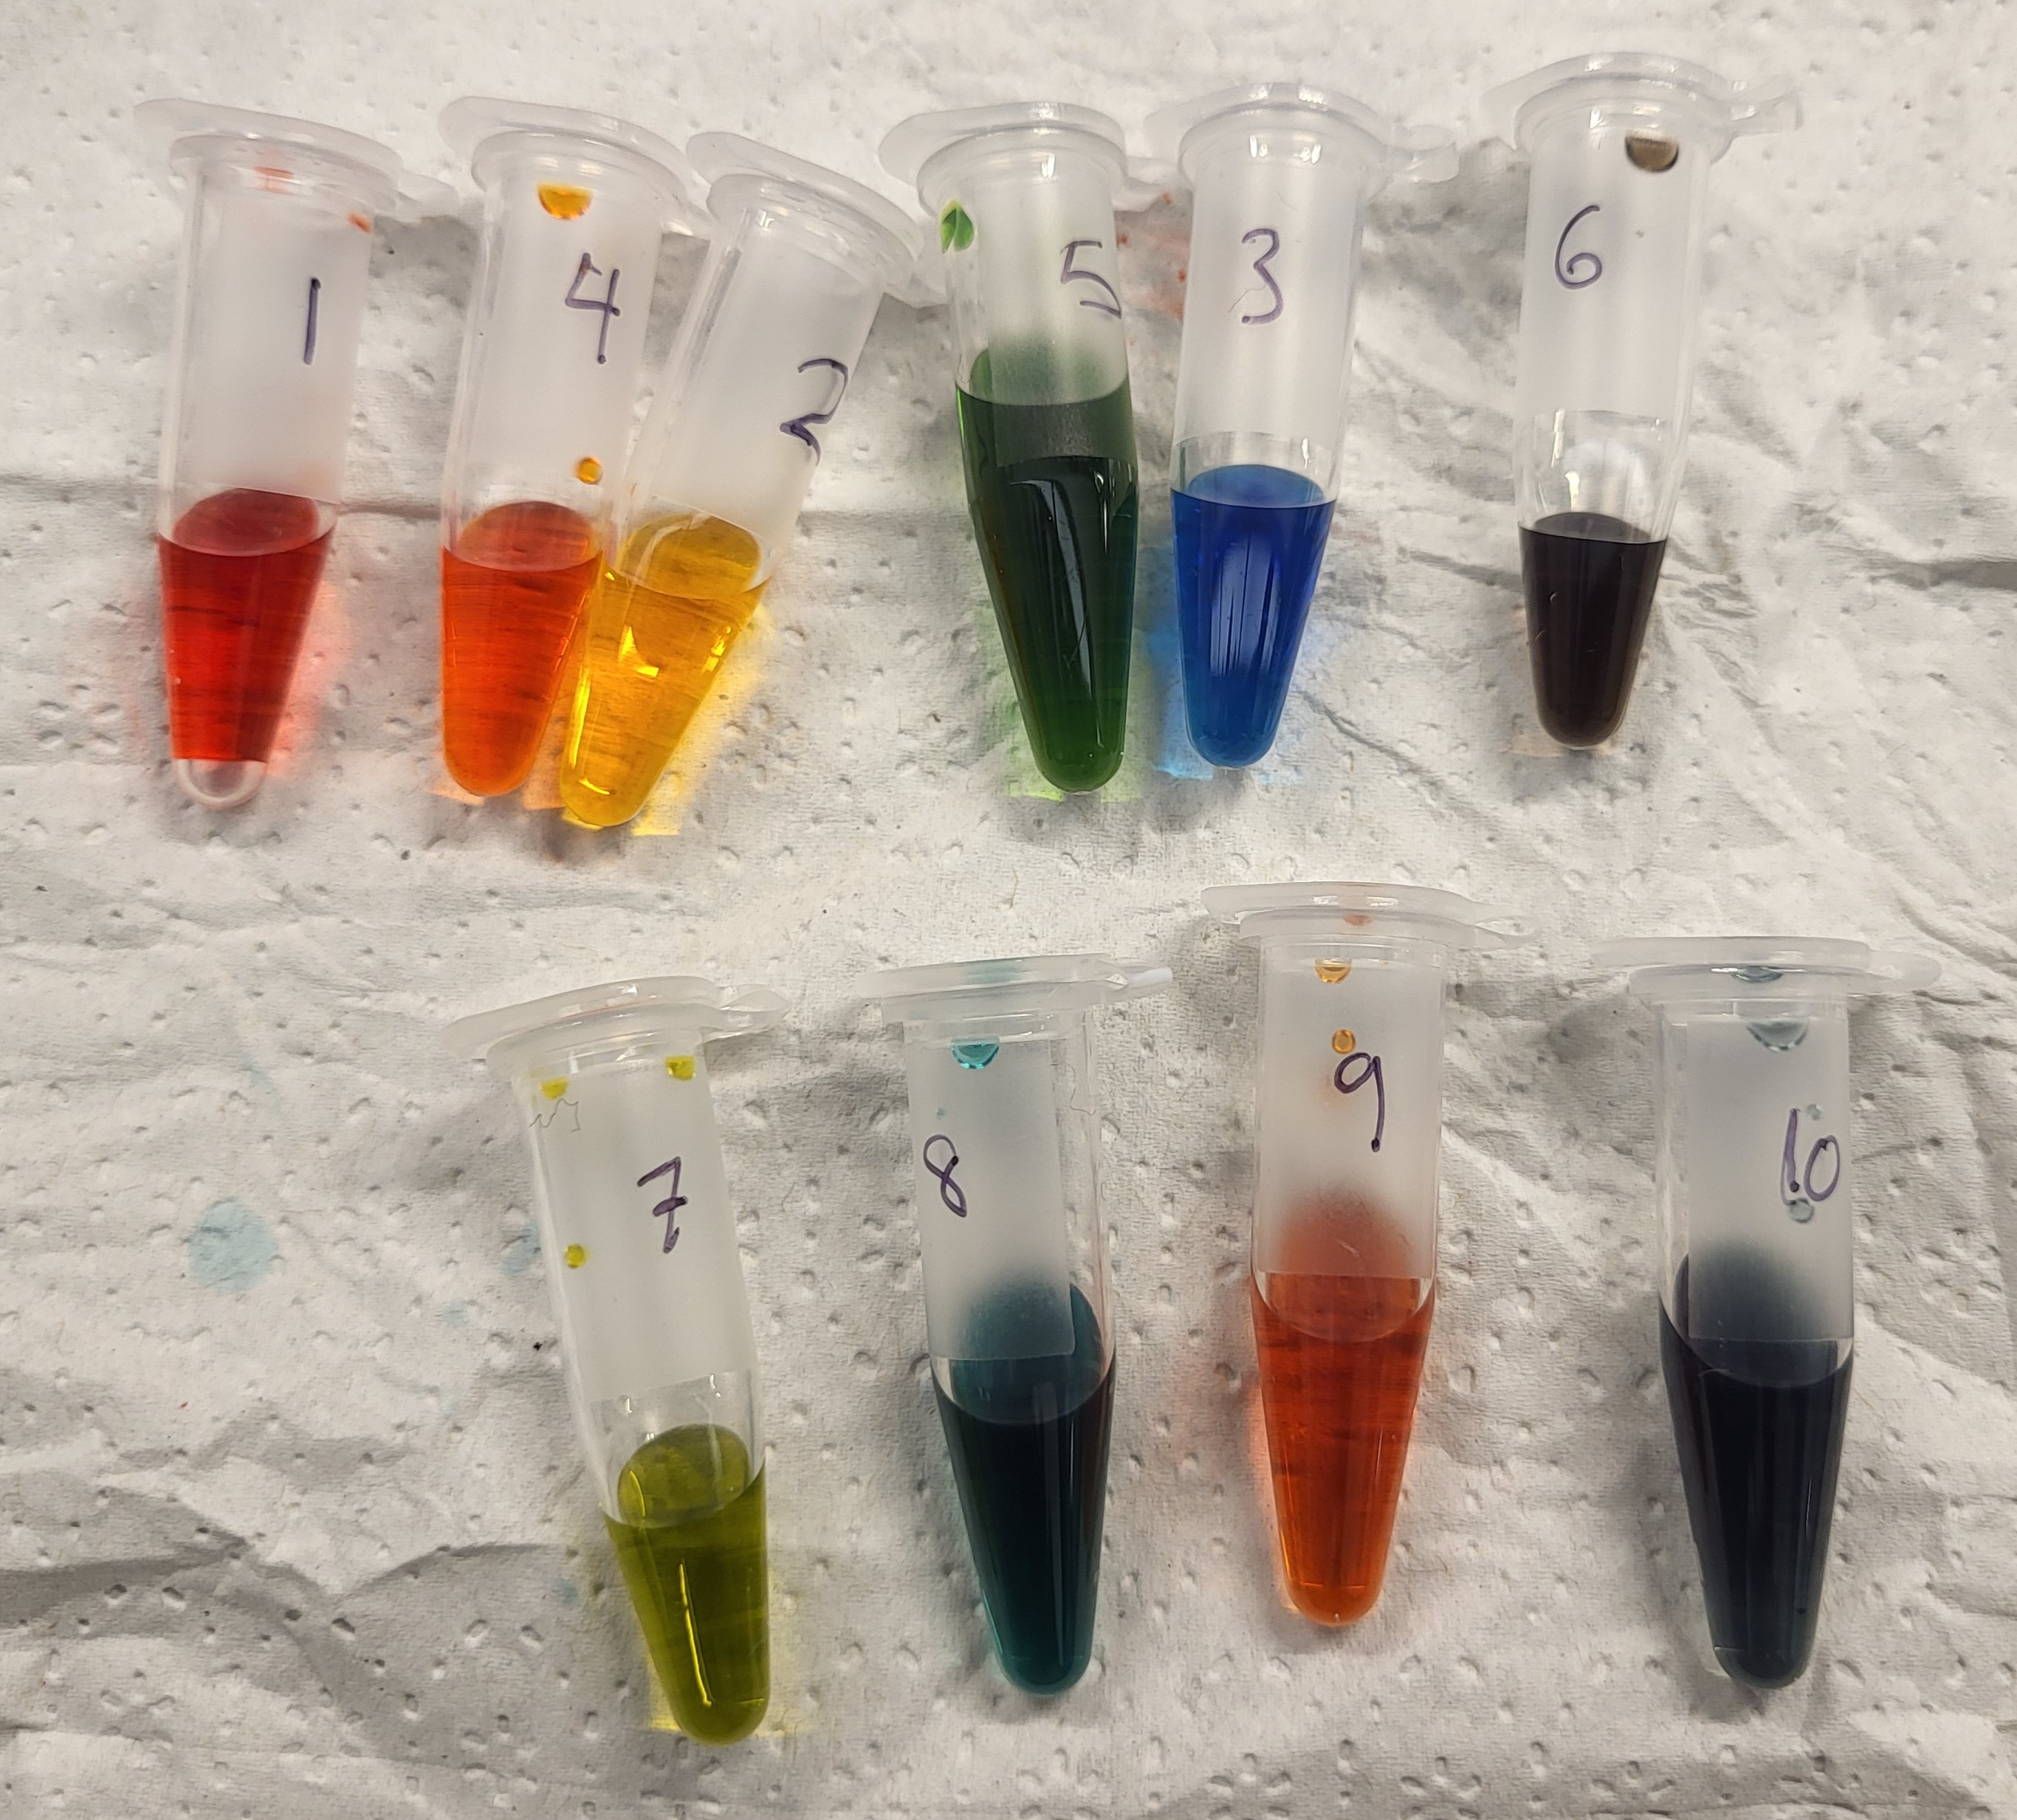
I made an additional 4 colors as follows:
Lime: 300 ul yellow, 50 ul blue
Teal: 25 ul yellow, 600 ul blue
Coral: 300 ul red, 50 ul yellow, 25 ul blue, 300 ul water
Slate: 100 ul red, 300 ul blue, 300 ul water
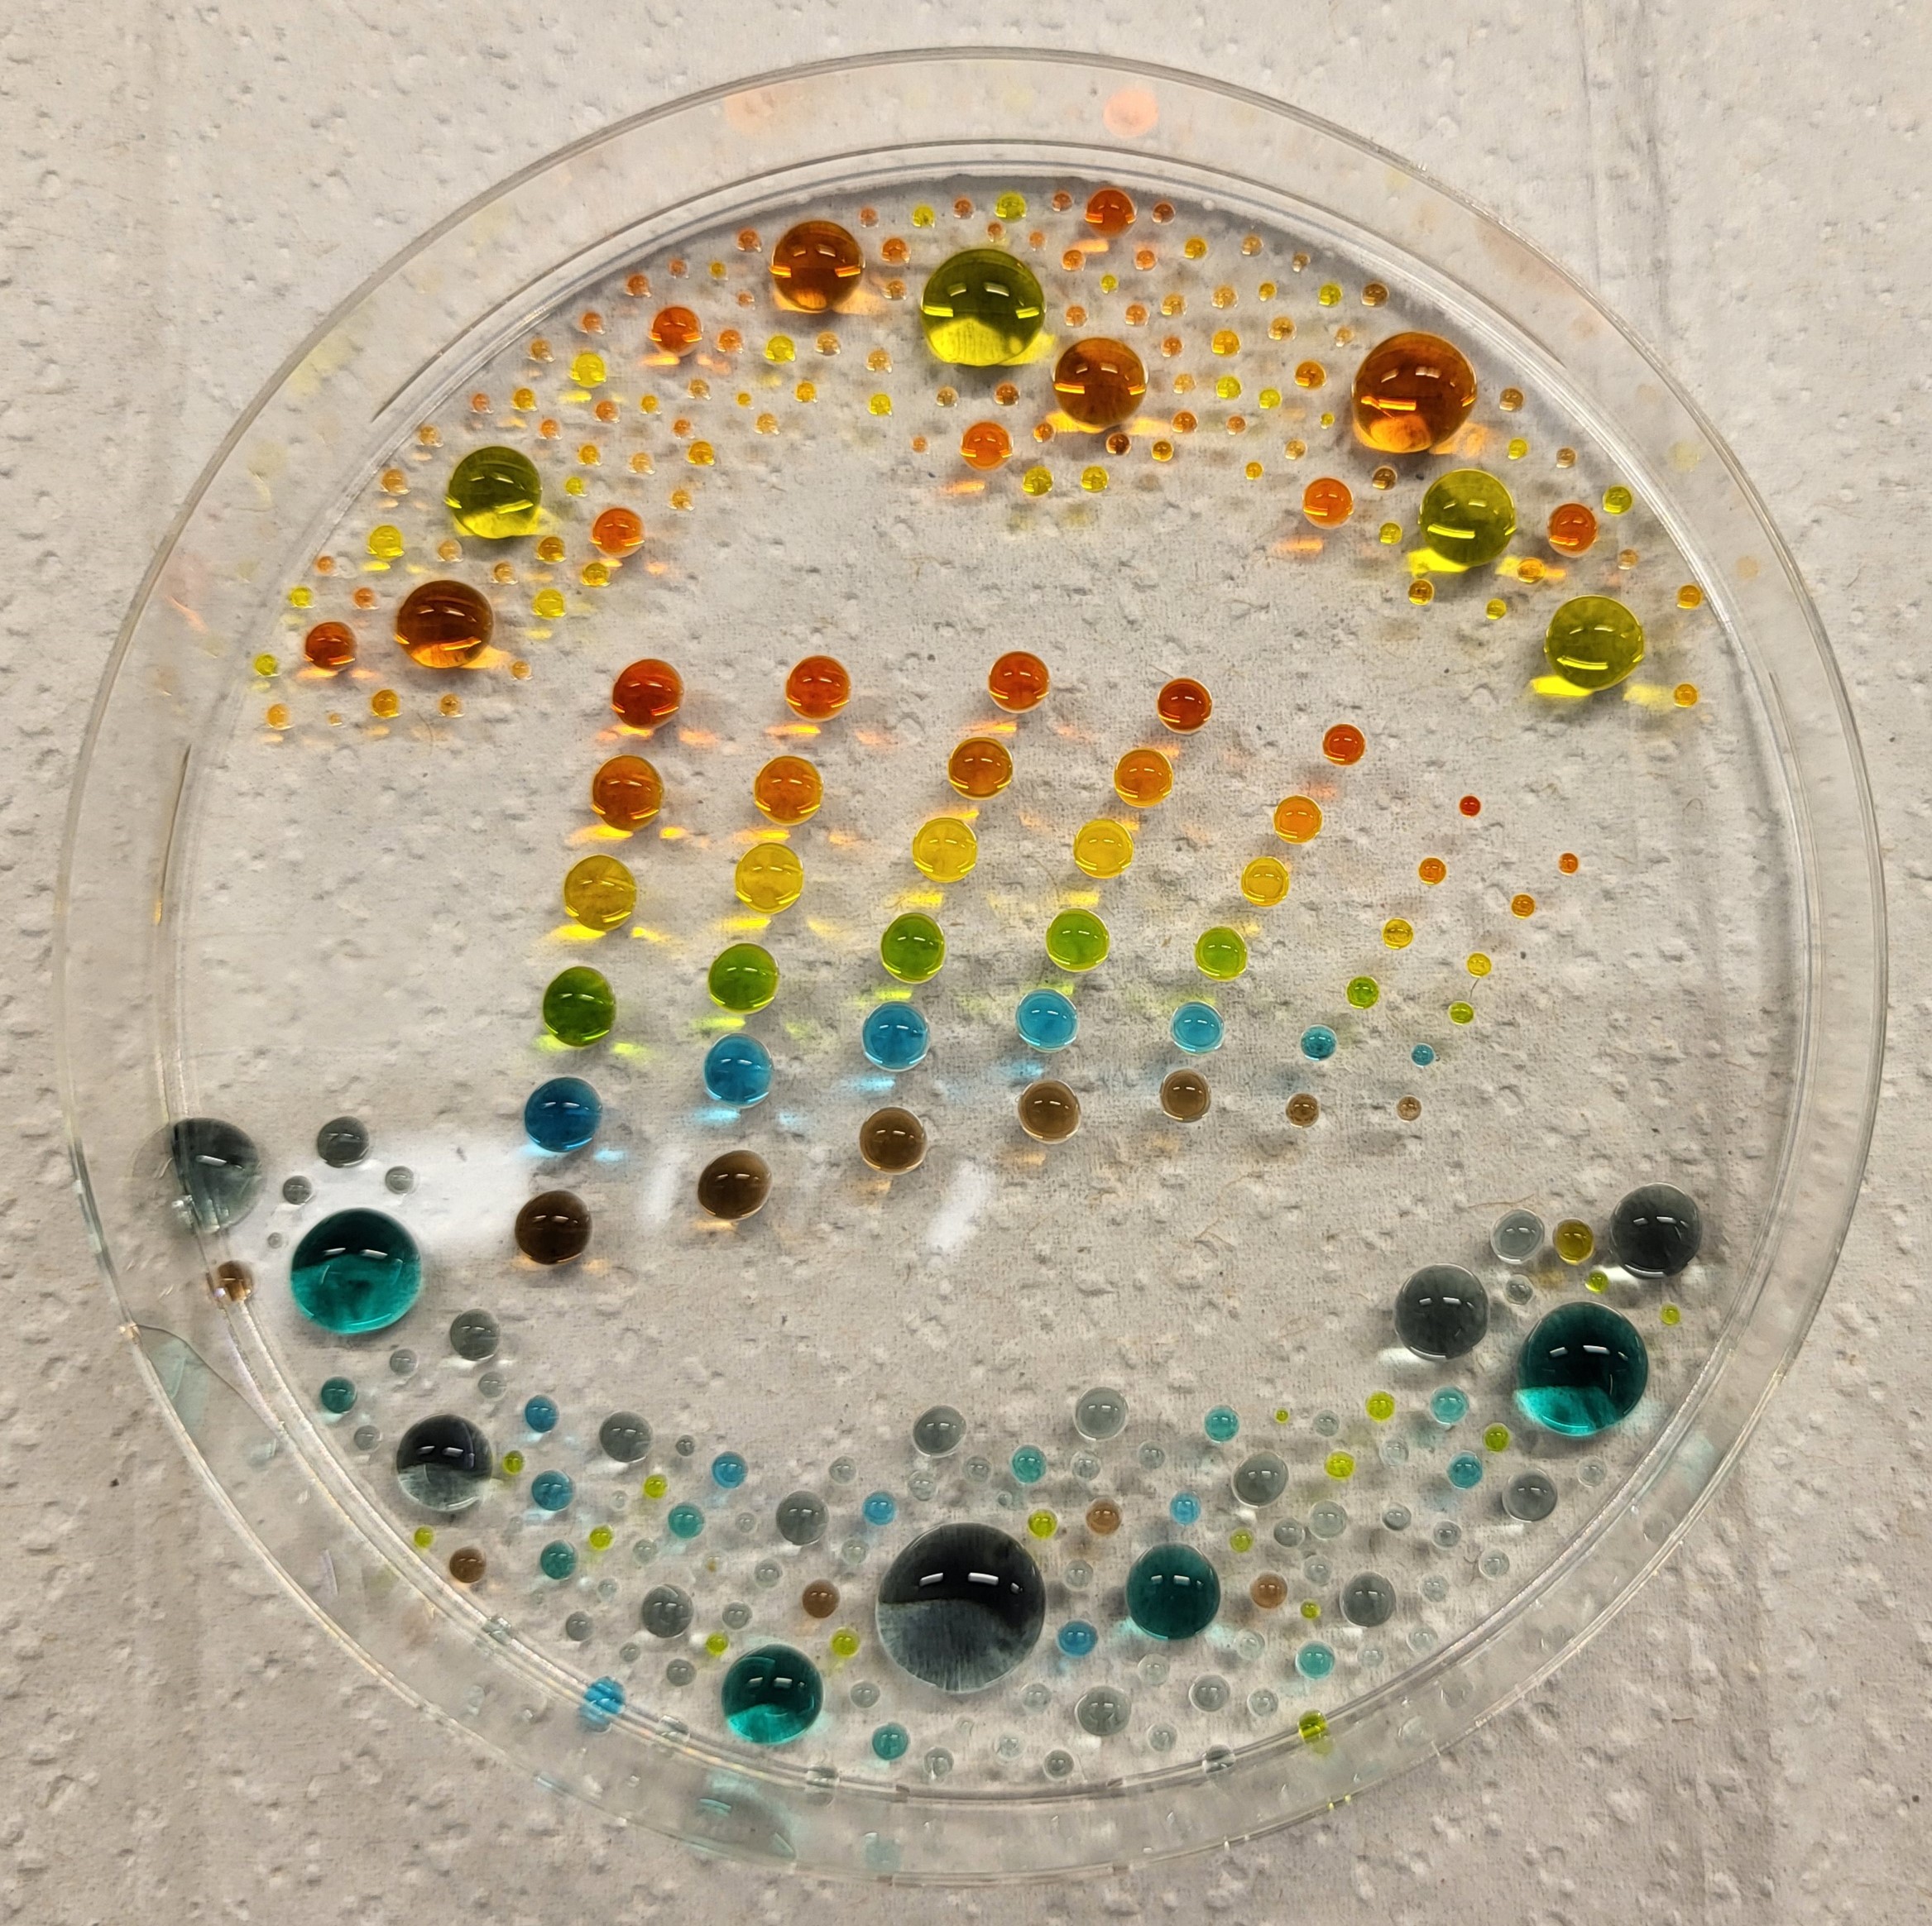
My step 7 artwork is below and also the above cover image.
Part 2: Performing Serial Dilution
I don’t know what the Mystery Substance (MS) is supposed to be. I used some purified pUC19 plasmid, at a concentration of 197 ng/ul because that’s something I had available. It’s a double-stranded DNA, so the molecular weight would be around 660 g/mol per base pair, or a total of $660 \frac{g/mol}{bp} * 2.7 kb = 1,800 kg/mol$ approximately. Therefore, my stock concentration is $ 0.197 \frac{g}{L} * \frac{mol}{1,800,000 g} = 1.094E-7 mol/L = 0.11 uM = 110 nM$.
To get an arbitrarily chosen 1 nM stock, I did the following serial dilution:
graph LR;
  A[0.11 uM stock solution ] -->|4.5 uL stock into 45.5 uL water| B[dilution: 0.01 uM]
Then I made the final solution according to the table. Again, the MS desired concentration was chosen arbitrarily.
Reagent
Stock concentration
Desired concentration
Volume
Loading dye
6X
1X
10 µL
MS
10 nM
1 nM
6 µL
dH2O
n/a
n/a
44 µL
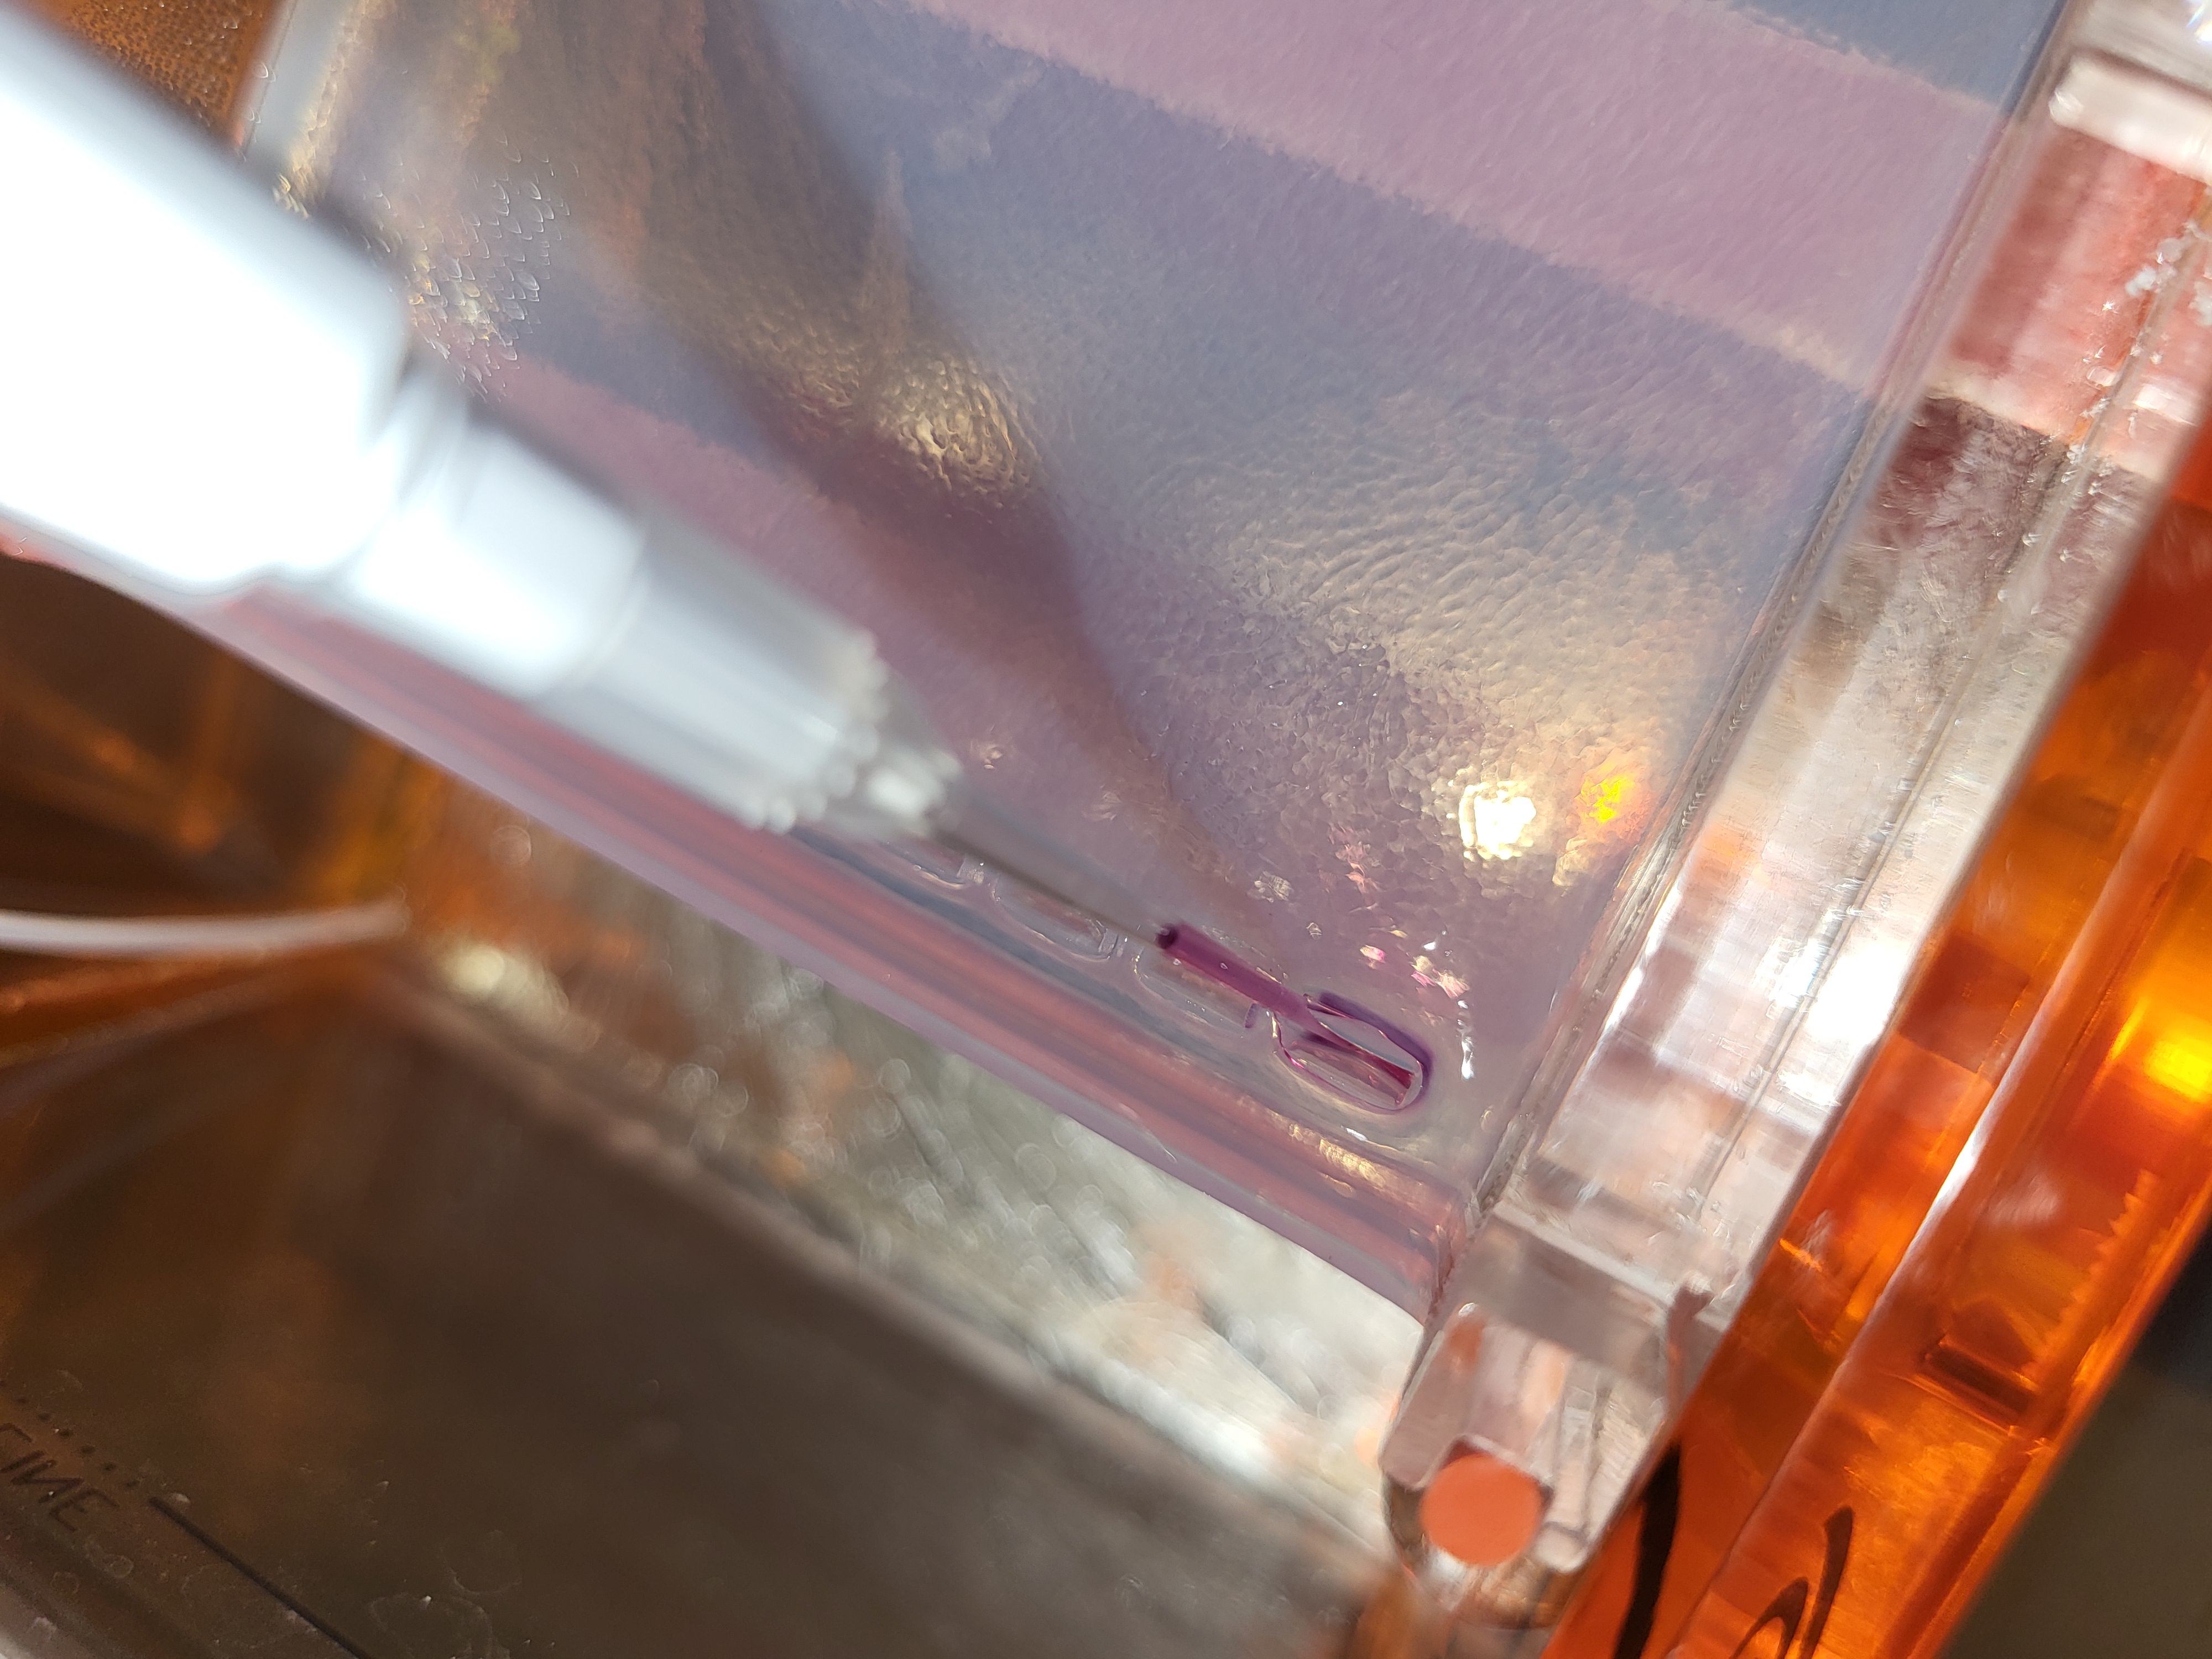
I added 20 ul of the final solution to an agarose gel (1% w/v). I made the agarose gel by measuring out 0.5 g of agarose, and adding it to 50 ml of 1x TAE buffer, then microwaving until melted. I poured it into a gel mold with a well comb and let set fully before putting into the electrophoresis set-up to practice loading into a well.
i don’t have lambda DNA, but i do have Escherichia coli BL21 genomic DNA and a small collection of various plasmids and PCR products of varying rates.
we also have a handful of restriction enzymes but not a lot, and mostly not common ones.
i think my strategy is going to be:
sketch out a design
run a restriction digest on the E. coli genomic DNA to get a bunch of different-sized fragments. doesn’t particularly matter which one i think.
run the digest on a gel, and purify out the fragments of the size i want with a Qiagen or NEB kit; note: i am going to have to elute with pretty small volumes to keep them concentrated enough to show up in subsequent gels.
run a new gel with the purified fragments based on the design (possibly augmenting with PCR products if desired for brightness/intensity).
take photo to show off
for whatever reason, neither uploading Genbank files and downloading accession files for the E. coli genomic assembly in Benchling is working for me. i suspect it probably has to do with the size of the files and speed (or lack thereof) of my internet. so i can’t do much in-silico planning and testing. but i think my plan will work without it. it just means i’ll have to do more testing during instead of thinking/planning prior.
Lab Prep:
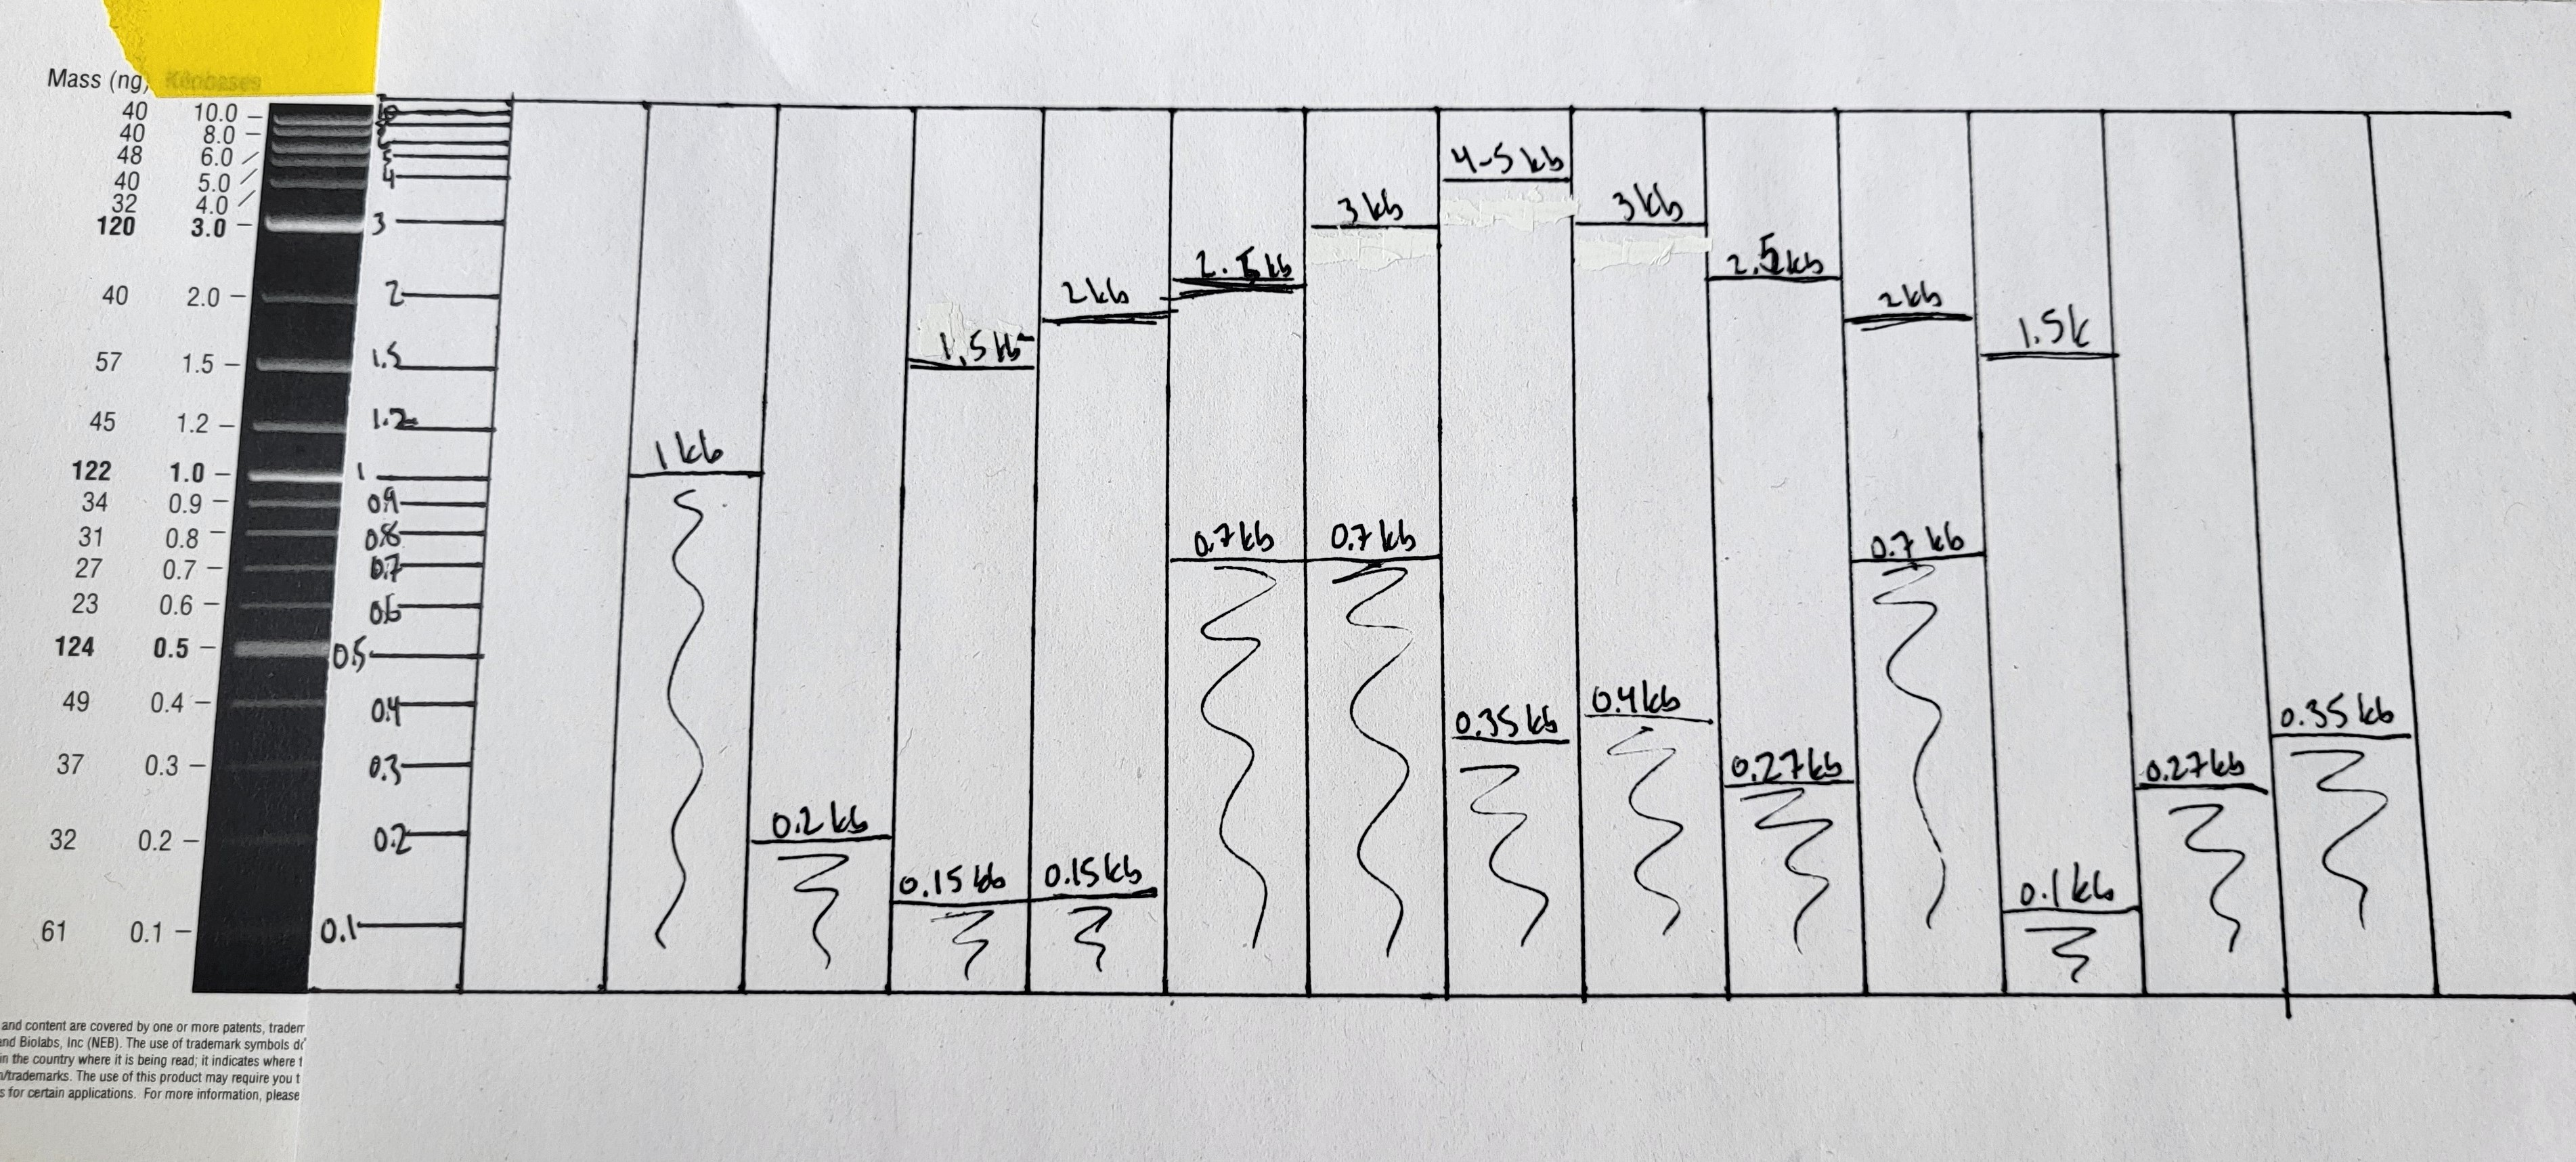
Sketch out a design. I found a photo of the Portland skyline with Mt. Hood in the background from the City of Portland’s Instagram. Photo credit: @james.is.jumbled. I traced the lines of primary visual components to get a line art style drawing, and then split it into a grid of 16 columns, for the 16 wells for the largest gel comb I have available. I recreated the gridded line art, scaled to a printout of the 1kb+ gel ladder, to approximate the size DNA fragments I would need in each column.
Restriction digest E. coli gDNA.
10 ul E. coli BL21 gDNA (125 ng/ul)
5 ul rCutSmart buffer
1 ul MspI (2018)
1 ul SpeI-HF (2015)
1 ul XbaI (2015)
2 ul NdeI (2009)
34 ul ultra-pure water
Combined the above components in a microtube (50 ul total reaction volume) and vortexed to mix. Incubated at 37C for an hour. Note that all enzymes are from NEB and are all past their expiration dates, but have been stored in a -20C freezer the whole time.
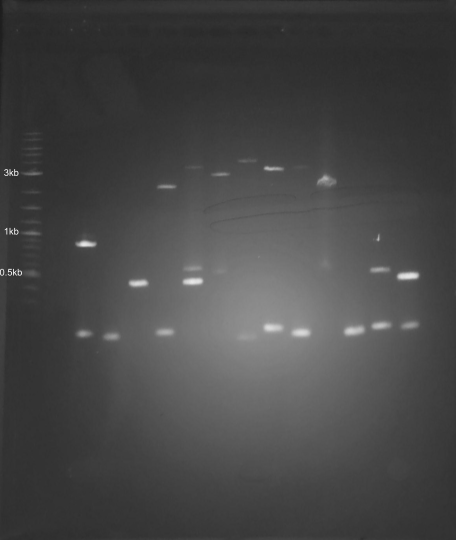
Gel purification of DNA fragments. I re-used an old gel for this first run. I combined 3ul of ladder with 2ul SYBR Green I dilution (diluted 1:50) and around 0.5ul loading dye on a scrap of parafilm, and loaded this mixture into well 5. I added 6ul of SYBR Green I dilution into the restriction digest along with 10ul of loading dye. I loaded around 33ul each into 2 lanes. I ran this electrophoresis for 40 minutes at 180mV.
Lanes:
1kb+ ladder (NEB)
Multi-enzyme digested E. coli gDNA
Multi-enzyme digested E. coli gDNA
PCR product
PCR product
PCR product
It was just smears, which I suppose isn’t too surprising, considering that I started with gDNA and all my enzymes were expired. From this gel, I cut out smears from the multi-enzyme digests at the following ranges: 1-0.1kb, 0.7-0.1kb. Using a Qiagen Qiaquick gel purification kit, I purified these semars individually. All purifications were eluted with 30 ul of elution buffer. I added these to tubes of PCR products for my gel art palette.
To another gel, I loaded the following into the wells, mixing each with 1ul of loading dye on parafilm prior to loading:
ladder
10ul A
2ul A
1ul A
linearized plasmid
15ul B
2ul B
1ul B
5ul A
These are not super clear, but I cut out additional smears from lanes 1, 6, and 9 at the following ranges: 0.5-0.1kb, 0.2-0.1kb. Eluted these with 25ul of elution buffer. Added these to my palette above: tubes .
This left me with the following palette (all sizes and size ranges are approximate):
A. PCR product: 6kb
B. PCR product: 5kb
C. PCR product: 4kb
D. PCR product: 3kb
E. PCR product: 1kb
F. PCR product: 700bp
G. PCR product: 650bp
H. PCR product: 500bp
J. PCR product: 200bp
K. PCR product: 100bp
L. smear from 100bp-1kb
M. smear from 100bp-700bp
N. smear from 100bp-500bp
O. smear from 100bp-200bp
Note that J and K are low concentration, and the smears didn’t show up well on the test plate, so I’m going to use larger volumes of those than I am for the rest.
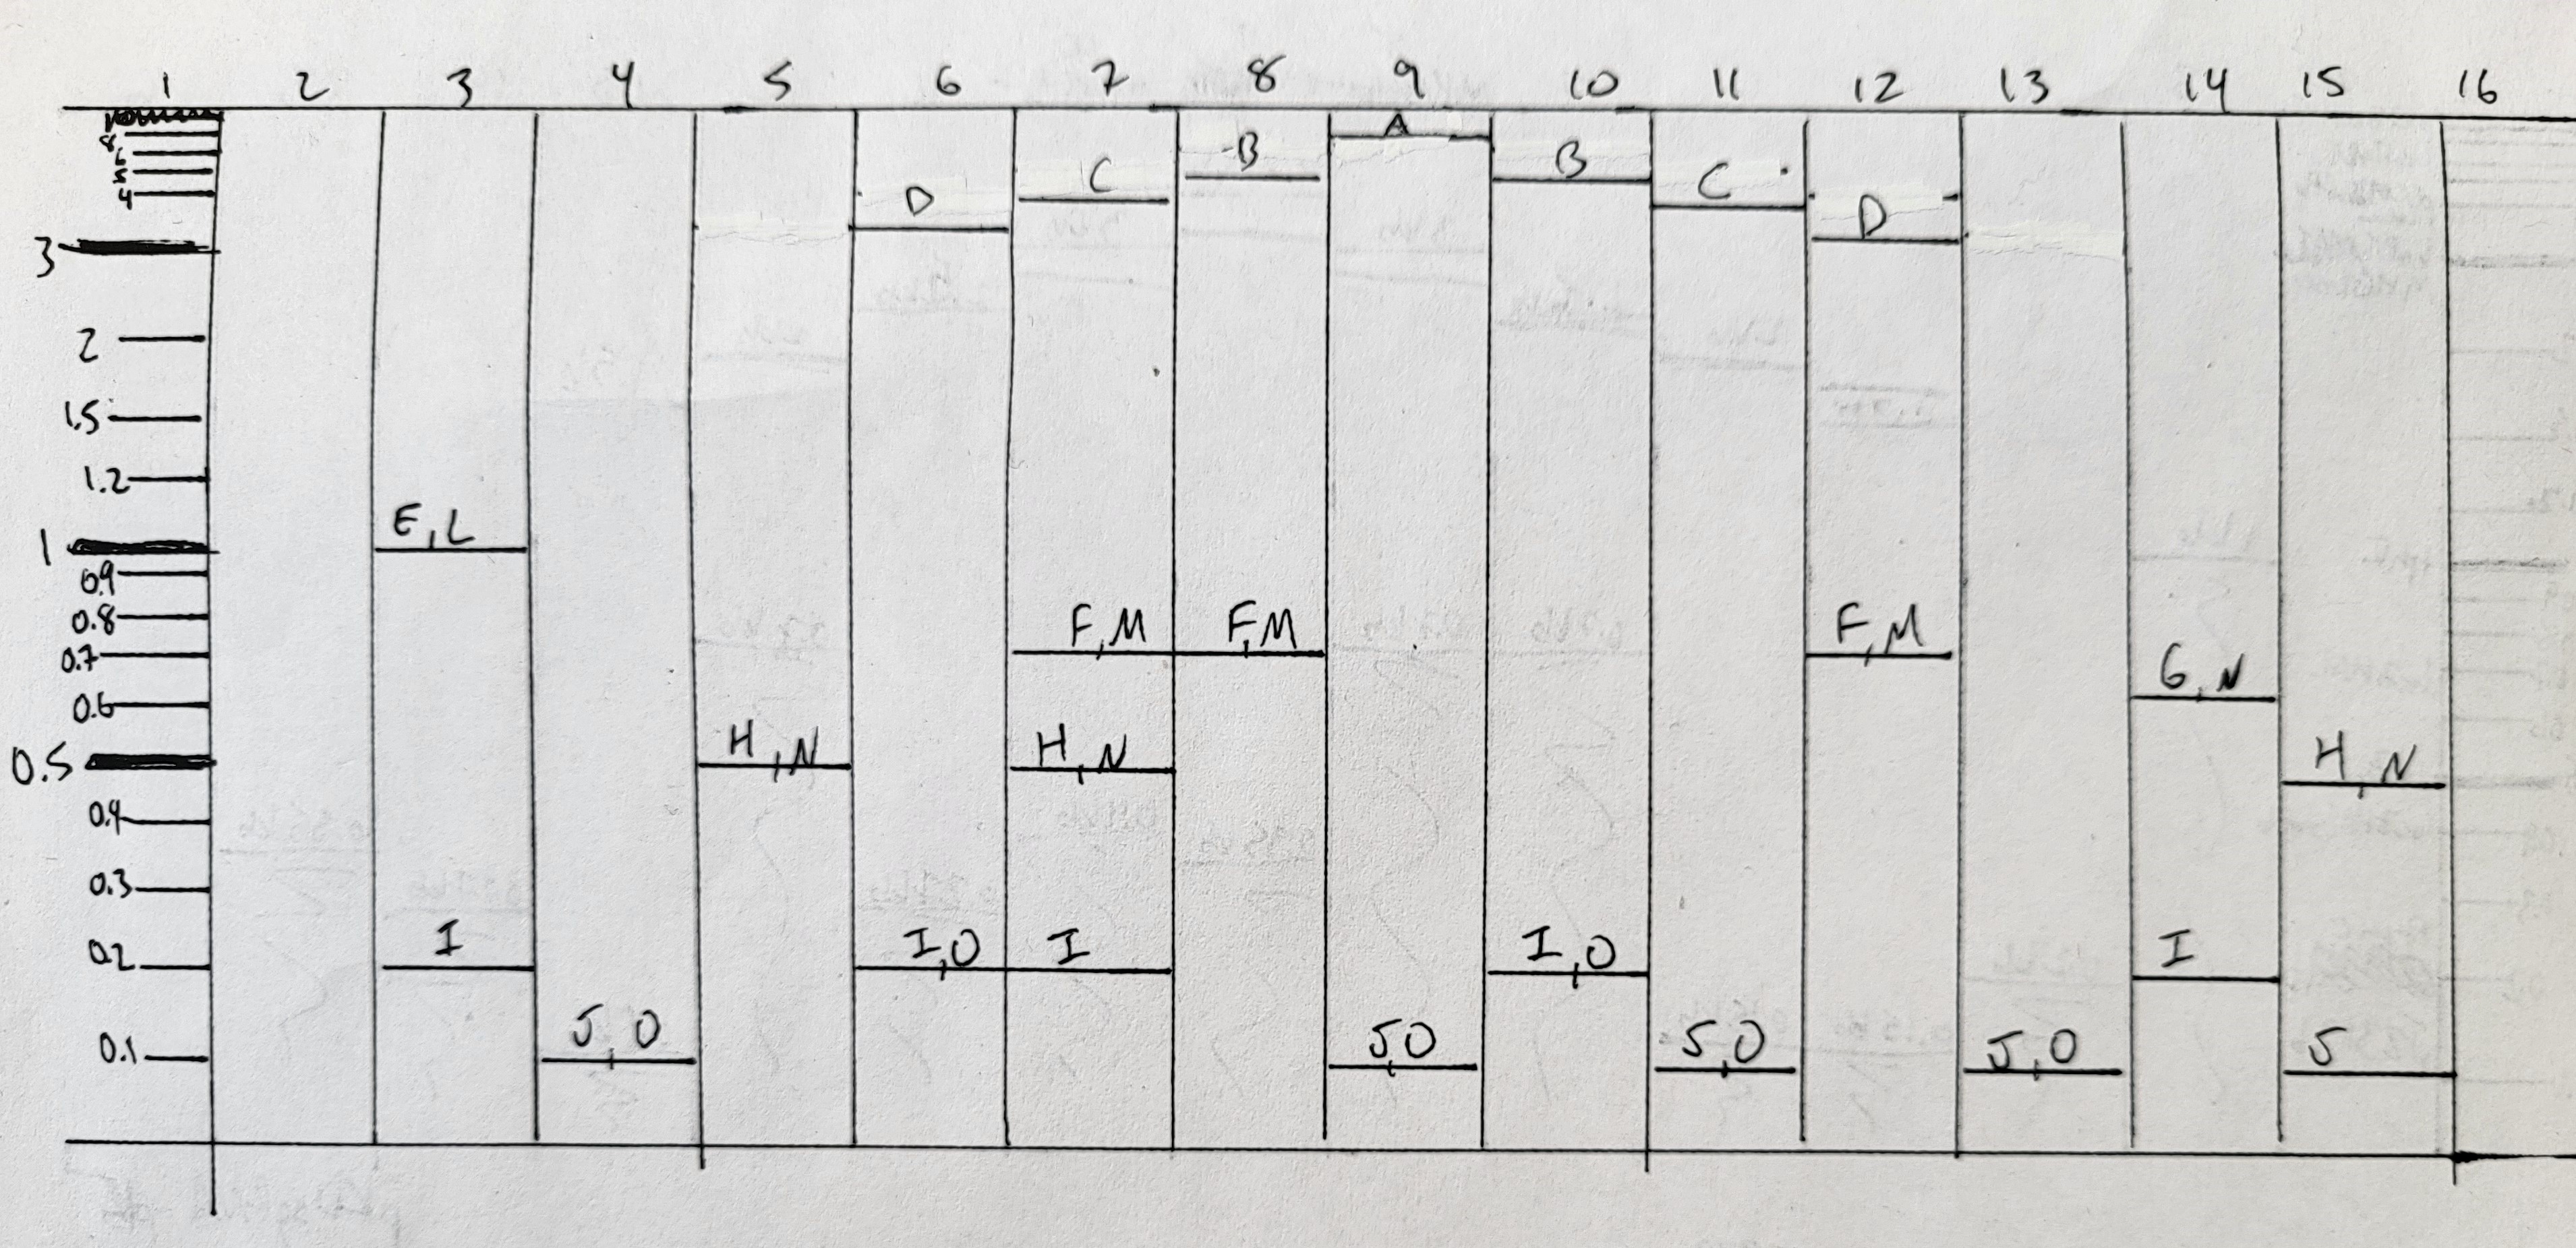
I re-drew my gridded lineart with the PCR products that I know I have.
Gel Art lab
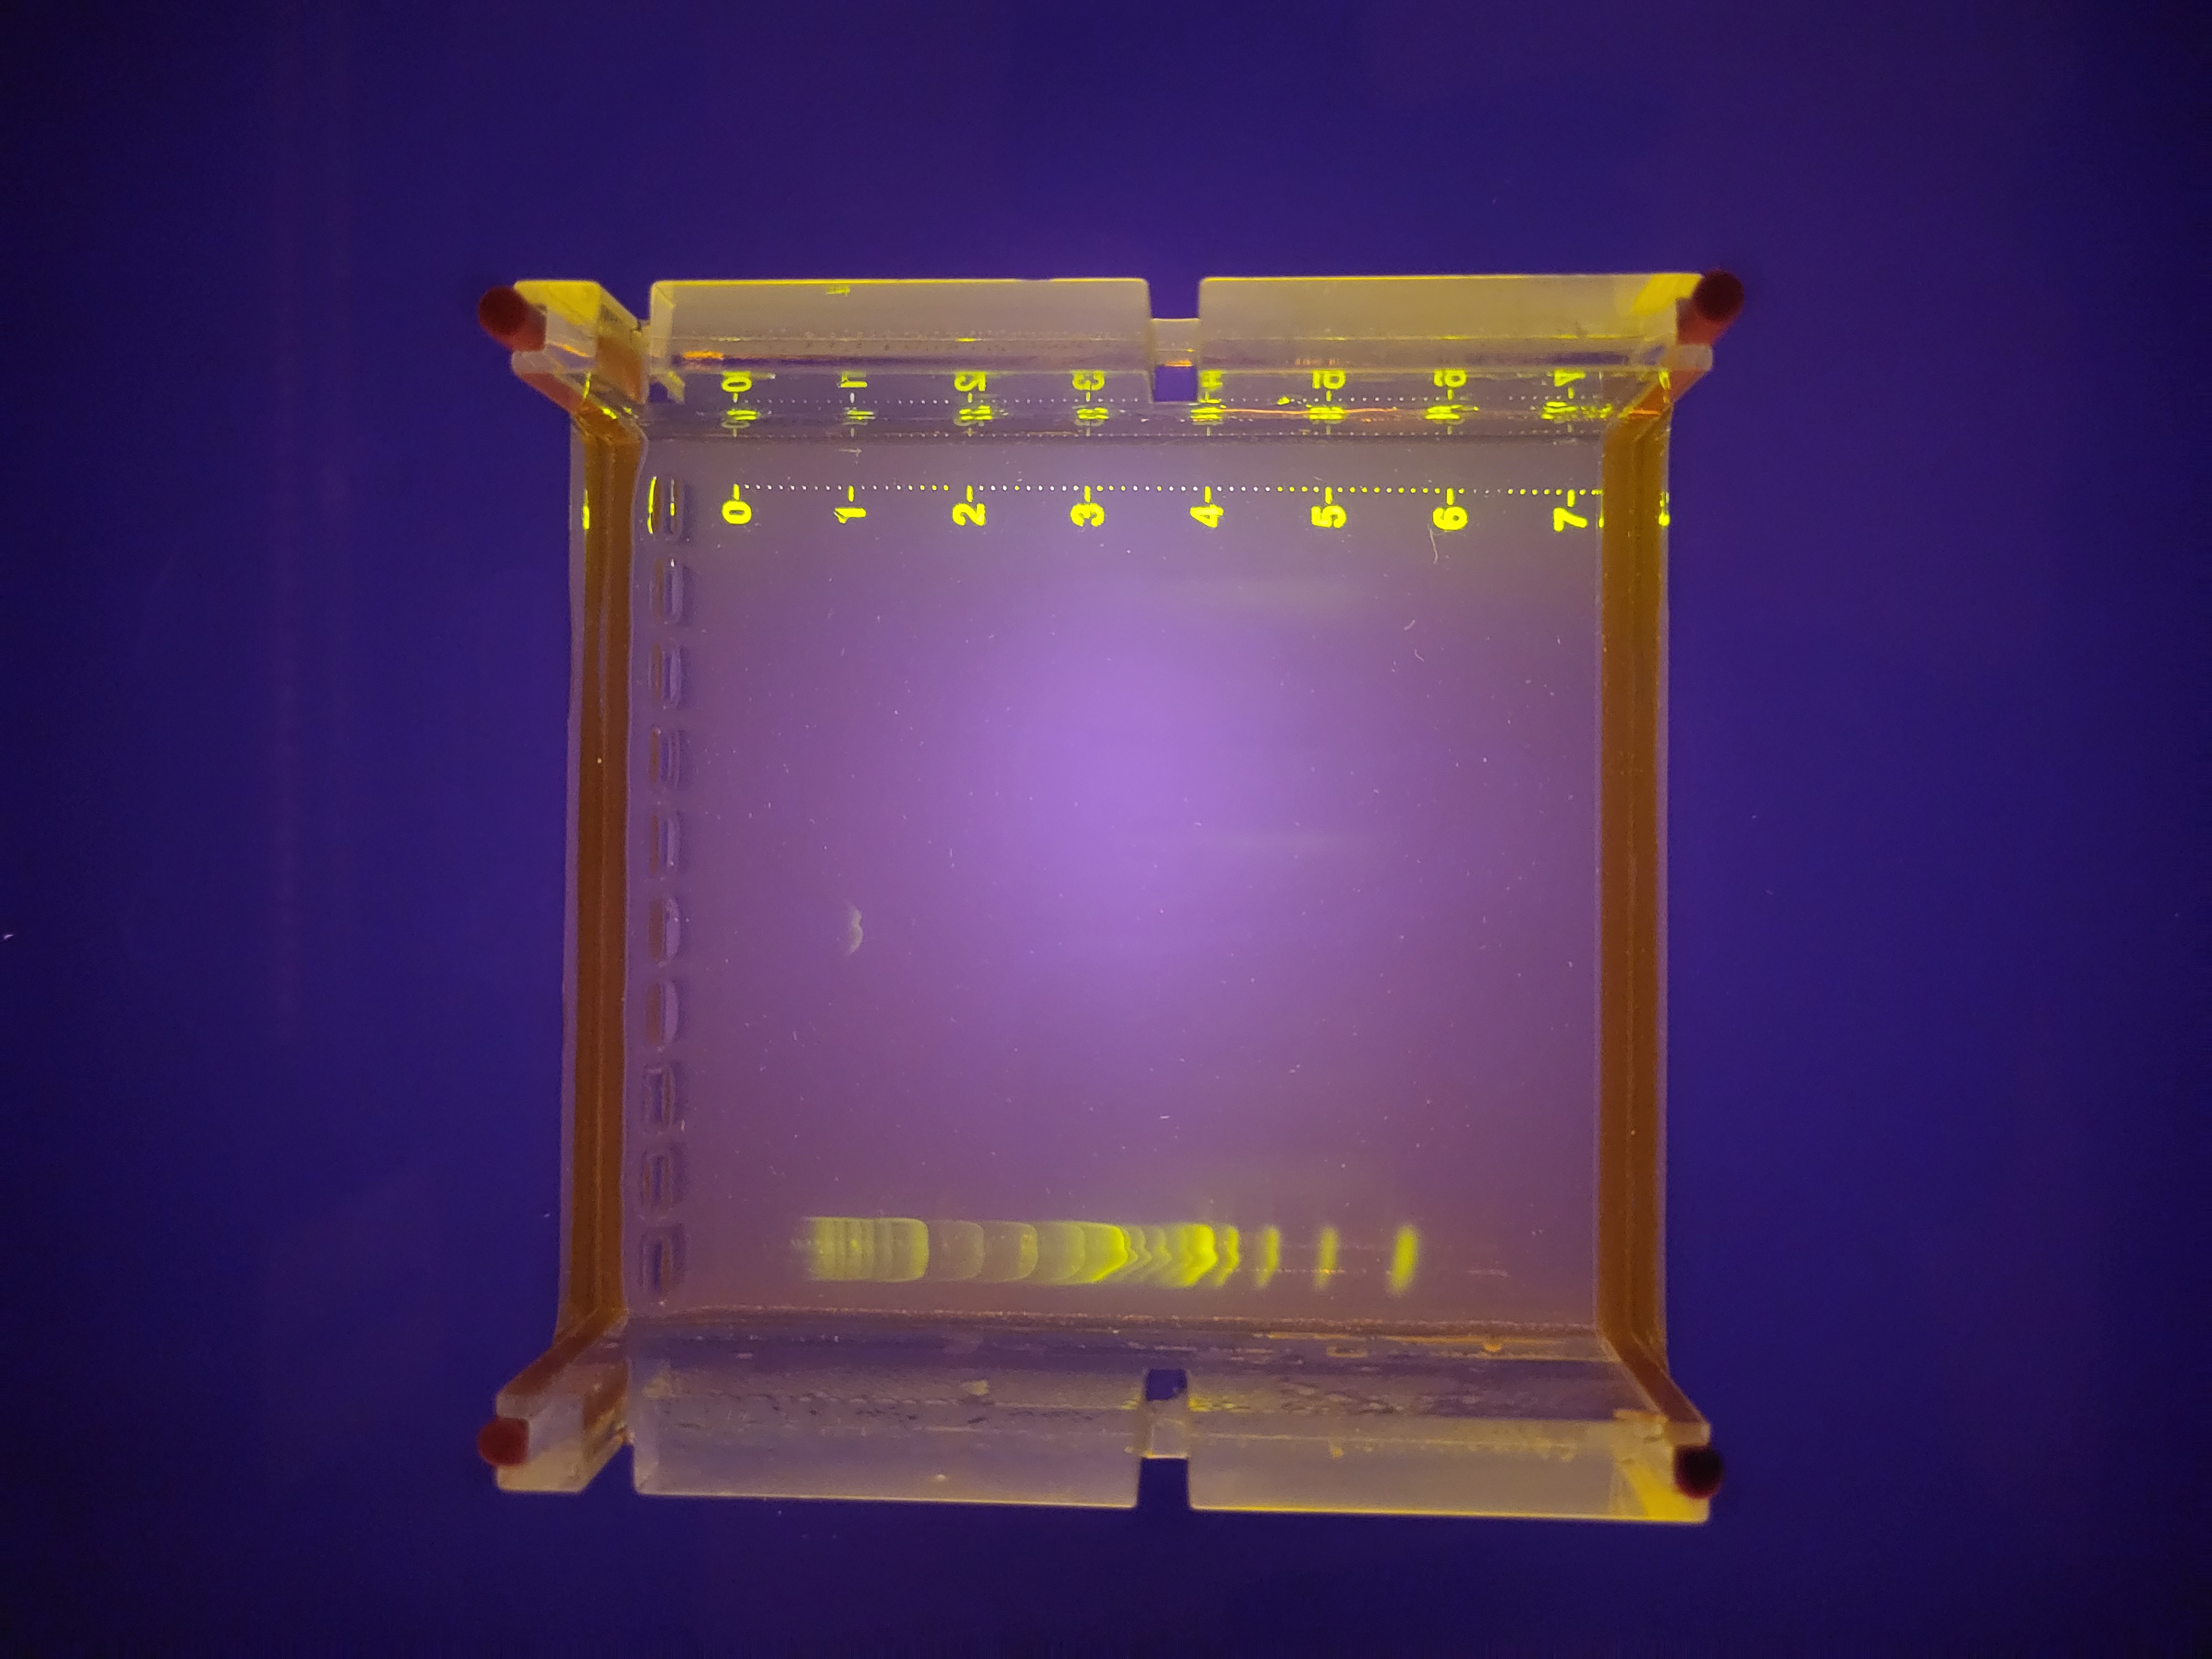
I cast a new electrophoresis gel by dissolving 1.3g agarose in 130ml 1x TAE, and pouring into a larger gel mold. This fit a comb with 16 wells. I allowed this to set before transferring into an electrophoresis set-up filled with 1x TAE. I loaded the following combinations into the wells, mixing each on parafilm with both 2ul of SYBR GreenI (50x dil) and appropriate volumes of loading dye, prior to loading. PCR products were 2ul each, except J and K which were 4ul each. Smears (L, M, N, O) were all in the range of 4-10ul per well.
ladder
empty well
E, L, I
J, O
H, N
D, I, O
C, F, M, H, I
B, F, M
A, J, O
B, I, O
C, J, O
D, F, M
J, O
G, N, I
H, N, J
empty well
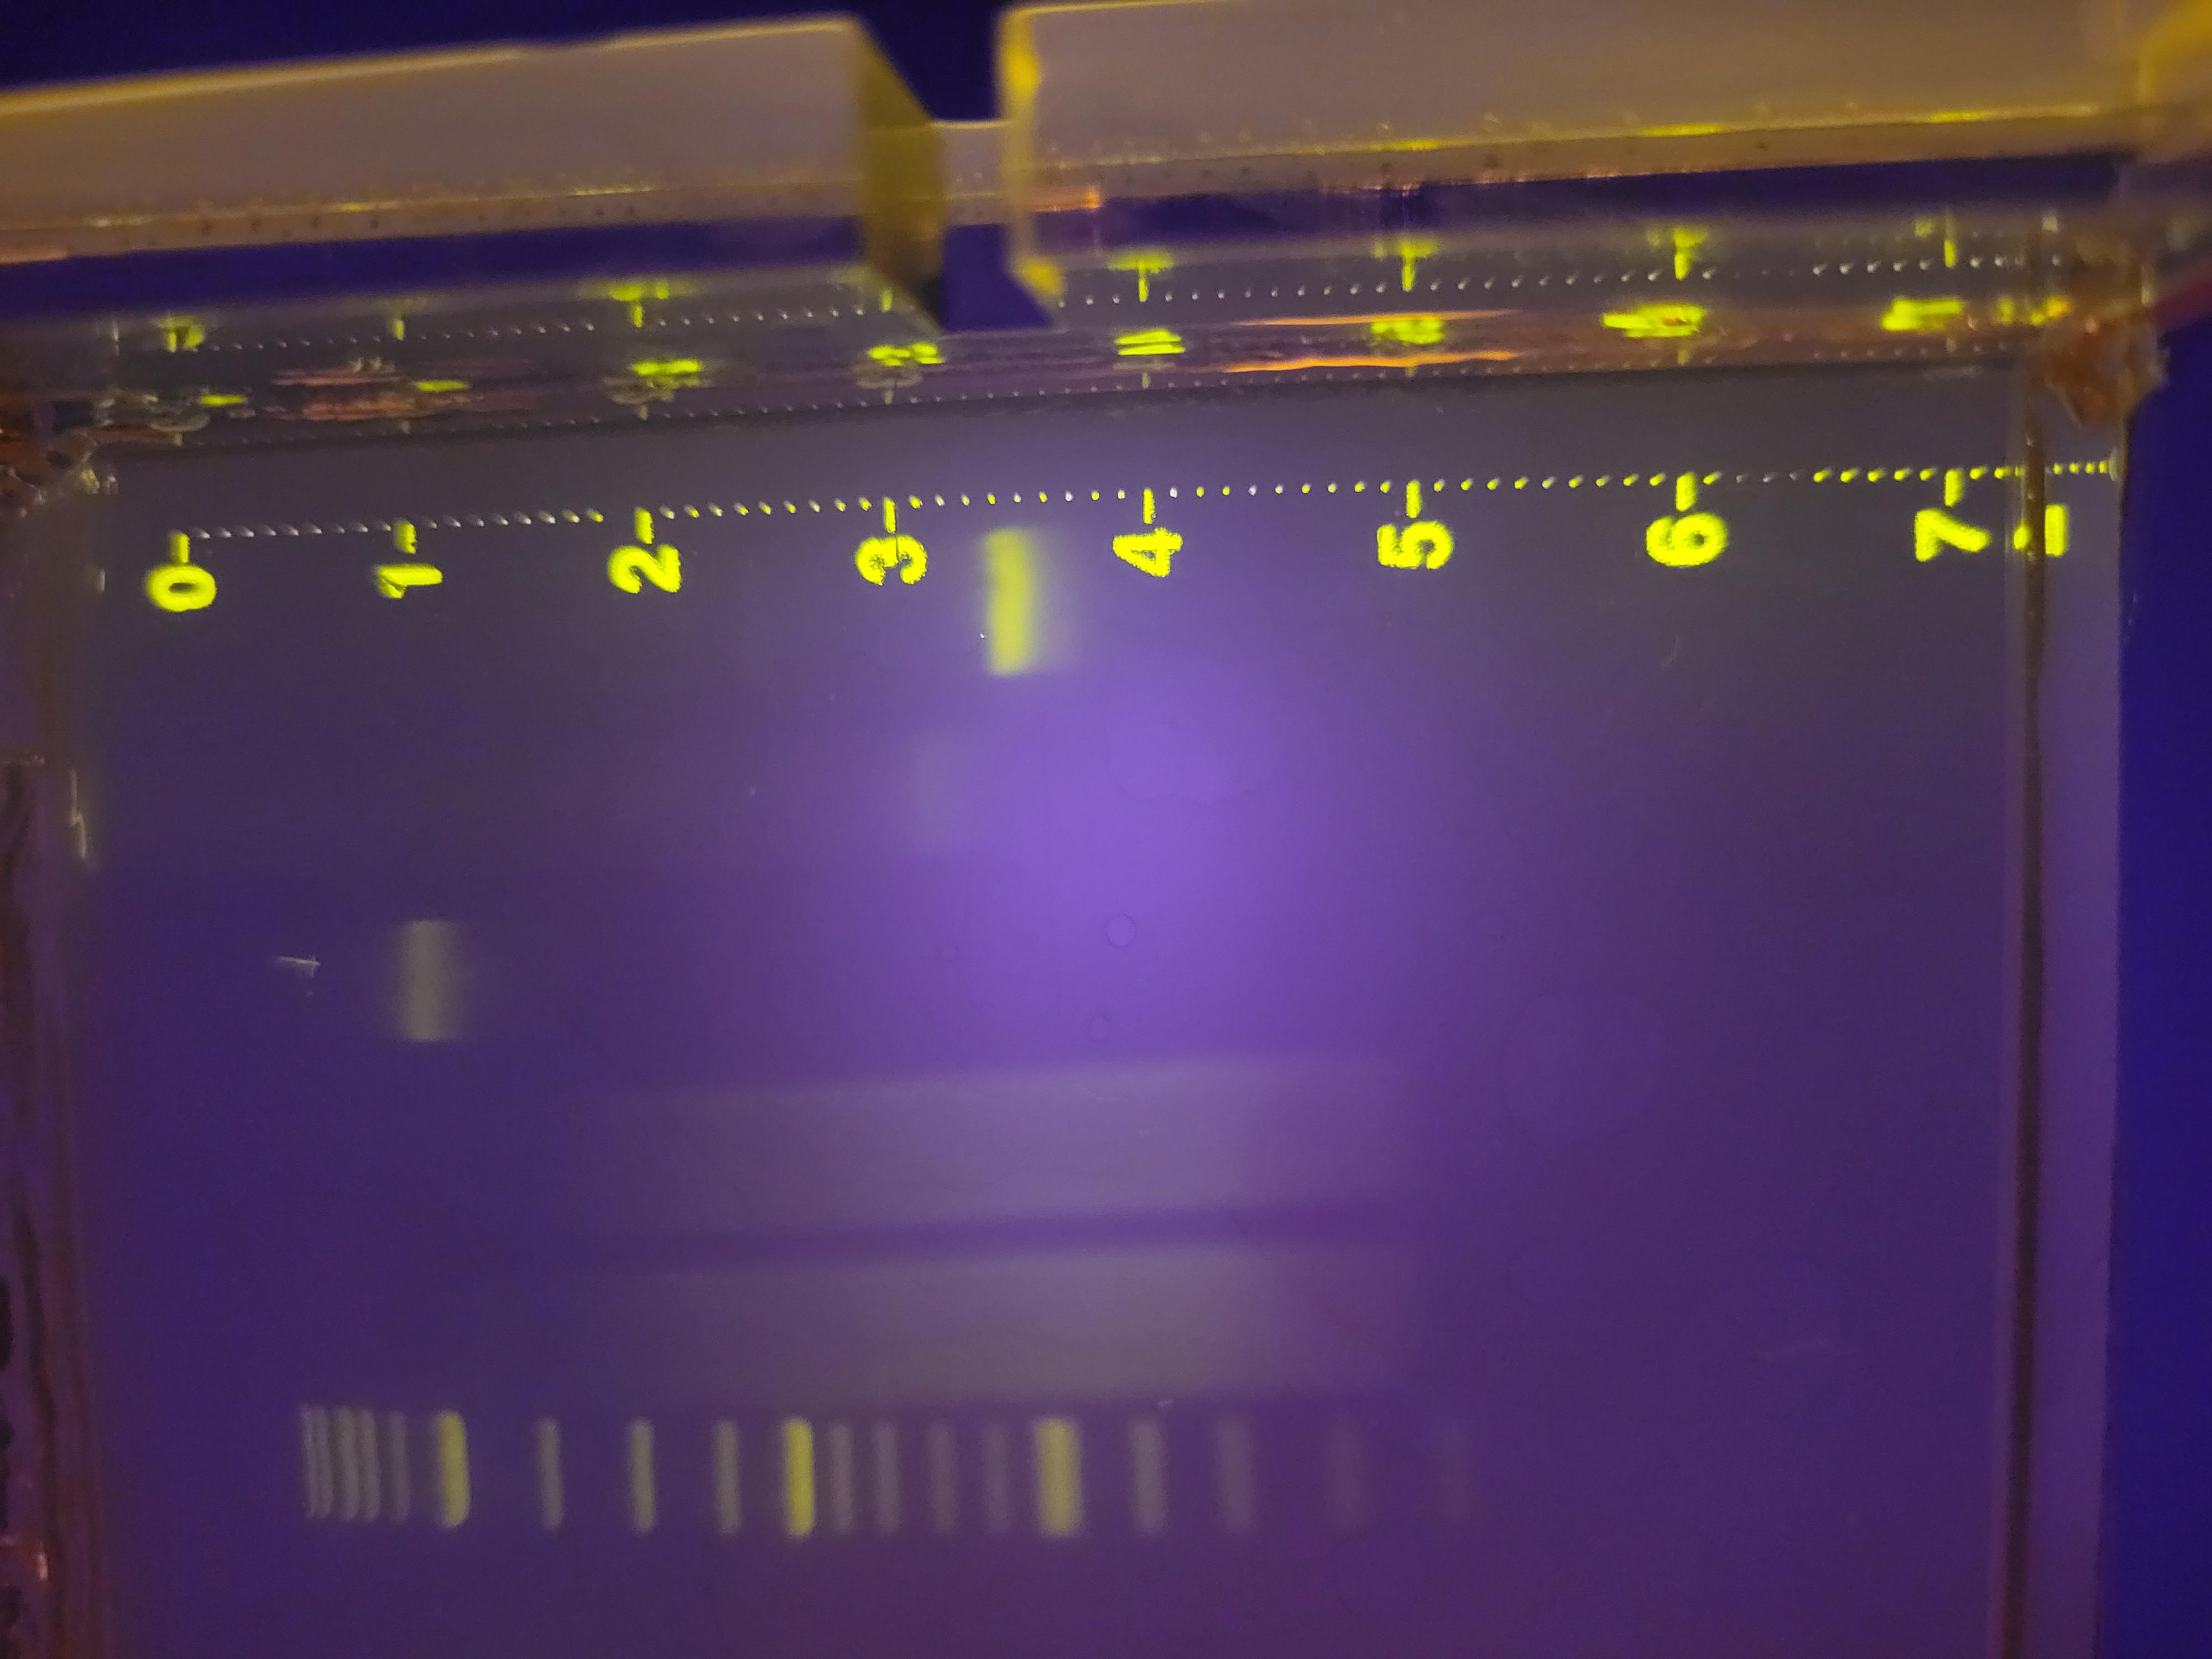
Ran gel at 200V for around a half hour.
Not all the bands are the same brightness, which I can probably attribute to the variable DNA concentration of my various PCR products. It also looks like I must’ve mixed up the 4kb and 5kb tubes. None of the smears showed up at all, which was a little disappointing. Overall though, the art turned out pretty well, I think, even if it was more trial and error than in-silico design and then execution.
Week 3 Lab: Opentrons Art
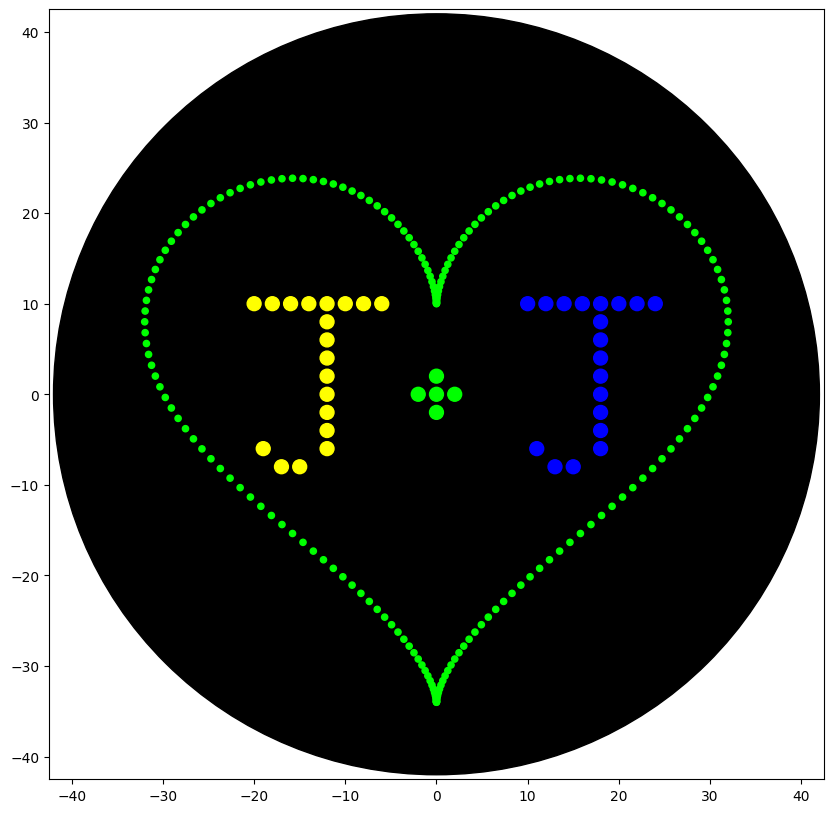
For my design, I decided to do a heart with my partner’s and my initials inside it (‘J+J’). The colors were chosen for personal significance.
I started by copying the heart-pattern from example in the Colab by Selin Sahin, only changing the color to green.
Then I wrote out the letters, working off the HTGAA example by Eyal Perry. I had to do some trial and error, frequently running my simulation until it looked how I wanted.
Final code block:
from opentrons import types

metadata = {    # see https://docs.opentrons.com/v2/tutorial.html#tutorial-metadata
    'author': 'JKS',
    'protocolName': 'heartJ',
    'description': 'writes the J+J inside a heart shape',
    'source': 'HTGAA 2026 Opentrons Lab',
    'apiLevel': '2.20'
}

##############################################################################
###   Robot deck setup constants - don't change these
##############################################################################

TIP_RACK_DECK_SLOT = 9
COLORS_DECK_SLOT = 6
AGAR_DECK_SLOT = 5
PIPETTE_STARTING_TIP_WELL = 'A1'

well_colors = {
    'A1' : 'Red',
    'B1' : 'Yellow',
    'C1' : 'Green',
    'D1' : 'Cyan',
    'E1' : 'Blue'       # if in a 24-well plate, this needs to be moved to e.g. D2
}

def run(protocol):
  ##############################################################################
  ###   Load labware, modules and pipettes
  ##############################################################################

  # Tips
  tips_20ul = protocol.load_labware('opentrons_96_tiprack_20ul', TIP_RACK_DECK_SLOT, 'Opentrons 20uL Tips')

  # Pipettes
  pipette_20ul = protocol.load_instrument("p20_single_gen2", "right", [tips_20ul])

  # Modules
  temperature_module = protocol.load_module('temperature module gen2', COLORS_DECK_SLOT)

  # Temperature Module Plate
  temperature_plate = temperature_module.load_labware('opentrons_96_aluminumblock_generic_pcr_strip_200ul',
                                                      'Cold Plate')
  # Choose where to take the colors from
  color_plate = temperature_plate

  # Agar Plate
  agar_plate = protocol.load_labware('htgaa_agar_plate', AGAR_DECK_SLOT, 'Agar Plate')  ## TA MUST CALIBRATE EACH PLATE!
  # Get the top-center of the plate, make sure the plate was calibrated before running this
  center_location = agar_plate['A1'].top()

  pipette_20ul.starting_tip = tips_20ul.well(PIPETTE_STARTING_TIP_WELL)

  ##############################################################################
  ###   Patterning
  ##############################################################################

  ###
  ### Helper functions for this lab
  ###

  # pass this e.g. 'Red' and get back a Location which can be passed to aspirate()
  def location_of_color(color_string):
    for well,color in well_colors.items():
      if color.lower() == color_string.lower():
        return color_plate[well]
    raise ValueError(f"No well found with color {color_string}")

  # For this lab, instead of calling pipette.dispense(1, loc) use this: dispense_and_detach(pipette, 1, loc)
  def dispense_and_detach(pipette, volume, location):
      """
      Move laterally 5mm above the plate (to avoid smearing a drop); then drop down to the plate,
      dispense, move back up 5mm to detach drop, and stay high to be ready for next lateral move.
      5mm because a 4uL drop is 2mm diameter; and a 2deg tilt in the agar pour is >3mm difference across a plate.
      """
      assert(isinstance(volume, (int, float)))
      above_location = location.move(types.Point(z=location.point.z + 5))  # 5mm above
      pipette.move_to(above_location)       # Go to 5mm above the dispensing location
      pipette.dispense(volume, location)    # Go straight downwards and dispense
      pipette.move_to(above_location)       # Go straight up to detach drop and stay high

  ###
  ### YOUR CODE HERE to create your design
  ###

  ### heart pattern taken from Selin Sahin (2023)
  def heart_pattern(n, r, color_string, center_location):
    # generate list of points forming the heart
    scaling_factor = -2/r  # calculate scaling factor to fit pattern within 40mm radius circle
    angle_step = 2*math.pi/n
    coords = []
    for i in range(n):
        angle = i * angle_step
        x = scaling_factor*r*(16*math.sin(angle)**3)
        y = scaling_factor*(-r*(13*math.cos(angle) - 5*math.cos(2*angle) - 2*math.cos(3*angle) - math.cos(4*angle)))
        coords.append((x, y))


####PICK UP TIP HERE####
    pipette_20ul.pick_up_tip()

    print_every = 1     # 1=print every point; 2=print every other point; 3=print every third...

    # now plot the points
    for i, (x,y) in enumerate(coords):
        #print(i,(x,y))
        if i % (100*print_every) == 0:  # 20uL/0.2uL = 100
            # every 20th point we're printing starting with the first, aspirate 20uL total from Well 1
            pipette_20ul.aspirate(min(20, math.ceil((len(coords)-i)/print_every)), location_of_color(color_string))
        # print every other point we've calculated (was too dense otherwise)
        if i % print_every == 0:
            adjusted_location = center_location.move(types.Point(x, y))
            dispense_and_detach(pipette_20ul, 0.2, adjusted_location)

    ####DROP TIP####
    pipette_20ul.drop_tip()

  ##################################
  #### DRAW PATTERN ####
  ##################################

  heart_pattern(200, 50, 'Green', center_location)

  ###### write
  # letter J1
  pipette_20ul.pick_up_tip()

  pipette_20ul.aspirate(8, location_of_color('Yellow'))

  cursor = center_location.move(types.Point(x=-20, y = 12))

  for i in range(8):
    dispense_and_detach(pipette_20ul, 1, cursor.move(types.Point(y=-2)))
    cursor = cursor.move(types.Point(x =2))

  cursor = cursor.move(types.Point(x=-10, y=-4))

  pipette_20ul.aspirate(8, location_of_color('Yellow'))
  for i in range(8):
    dispense_and_detach(pipette_20ul, 1, cursor.move(types.Point(x=2)))
    cursor = cursor.move(types.Point(y =-2))

  pipette_20ul.aspirate(3, location_of_color('Yellow'))
  for i in range(2):
    dispense_and_detach(pipette_20ul, 1, cursor.move(types.Point(x=-1)))
    cursor = cursor.move(types.Point(x =-2))

  cursor = cursor.move(types.Point(x=-1, y=2))
  dispense_and_detach(pipette_20ul, 1, cursor)

  pipette_20ul.drop_tip()

### +sign
  pipette_20ul.pick_up_tip()

  cursor = center_location.move(types.Point(x=-4))

  pipette_20ul.aspirate(5, location_of_color('Green'))
  for i in range(3):
    dispense_and_detach(pipette_20ul, 1, cursor.move(types.Point(x=2)))
    cursor = cursor.move(types.Point(x=2))

  cursor = cursor.move(types.Point(x=-2, y=2))
  dispense_and_detach(pipette_20ul, 1, cursor)

  cursor = cursor.move(types.Point(y=-4))
  dispense_and_detach(pipette_20ul, 1, cursor)

  pipette_20ul.drop_tip()

  # letter J2
  pipette_20ul.pick_up_tip()

  pipette_20ul.aspirate(8, location_of_color('Blue'))

  cursor = center_location.move(types.Point(x=10, y = 12))

  for i in range(8):
    dispense_and_detach(pipette_20ul, 1, cursor.move(types.Point(y=-2)))
    cursor = cursor.move(types.Point(x =2))

  cursor = cursor.move(types.Point(x=-10, y=-4))

  pipette_20ul.aspirate(8, location_of_color('Blue'))
  for i in range(8):
    dispense_and_detach(pipette_20ul, 1, cursor.move(types.Point(x=2)))
    cursor = cursor.move(types.Point(y =-2))

  pipette_20ul.aspirate(3, location_of_color('Blue'))
  for i in range(2):
    dispense_and_detach(pipette_20ul, 1, cursor.move(types.Point(x=-1)))
    cursor = cursor.move(types.Point(x =-2))

  cursor = cursor.move(types.Point(x=-1, y=2))
  dispense_and_detach(pipette_20ul, 1, cursor)

  pipette_20ul.drop_tip()
  # Don't forget to end with a drop_tip()
Simulation image:
Unfortunately, the Victoria node was not able to run the Opentrons lab remotely as planned, as of 05/27/2026. Hopefully we can run it sometime this summer and I can upload a photo of a real plate.
Unfortunately this lab is not available for remote participation.
Week 7 Lab: Neuromorphic Circuits
We started off our node’s discussion of the neuromorphic circuits based off of a couple example circuits developed by TA Steven with help from ClaudeAI. Because I feel like I don’t really understand the analog vs binary computing, I was most interested in the design that explored that aspect.
Option C: Competing Inhibitors
Concept: One dominant ERN (CasE, high dose) controls the whole network. It kills both Csy4 and the green output directly.
CasE (strong) ──kills──▶ Csy4 (weak, dies) ──kills──▶ mNeonGreen (green, OFF)
Csy4 (dead) ──can’t kill──▶ PgU (survives, but has nothing to do)
Group
Plasmid
Amount
Role
X1
CasE
200 ng
Dominant enzyme
X1
eBFP2
50 ng
Blue control light
X2
Csy4_rec_CasE
100 ng
Csy4, killed by CasE
X2
mMaroon1
50 ng
Maroon control light
X3
PgU_rec_Csy4
100 ng
PgU, freed because Csy4 is dead
Bias
CasE_rec_mNeonGreen
150 ng
Green, killed by CasE
Expected result: Blue ON, Maroon ON, Green OFF
Why it’s interesting: Shows that dosage (ng amounts) determines who wins. You could run a second experiment with CasE reduced to 50 ng to see if the outcome changes — demonstrating the analog nature of the circuit.
Worth noting that there was significant confusion over the way that Claude worded the “Roles” of the Enzyme_rec_output constructs. The correct interpretation is as follows: CasE_rec_mNeonGreen means that the plasmid encodes for mNeonGreen with a recognition site for CasE (therefore, it is amount of mNeonGreen minus amount of CasE to determine if fluorescent green is present).
I was interested in the analog/dosing aspect of this circuit, but I thought it might be more interesting to include a different color, so we would see either Green or a different fluorescence, depending on which enzyme there was more of.
My first attempt looked like this:
Circuit Name
Transfection Group
Contents
Concentration (ng/ul)
DNA wanted (ng)
JKScircuit-1
X1
PgU
50
200
JKScircuit-1
X1
eBFP2
50
100
JKScircuit-1
X2
PgU_rec_Csy4
50
50
JKScircuit-1
X2
mMaroon1
50
100
JKScircuit-1
Bias
PgU_rec_mNeonGreen
50
100
JKScircuit-1
Bias
CasE_rec_Csy4_rec_mKO2
50
100
I figured that if there was more PgU than Csy4, then it would output orange. But if there was more Csy4 than PgU then it would output green. This is because PgU subtracts from mNeonGreen output, Csy4 subtracts from mKO2 output, and PgU subtracts from Csy4 output. So if there is high PgU, then mNeonGreen is not expressed; there is not enough Csy4 to compete with the PgU, and since there is not Csy4, there is nothing to inhibit the mKO2 output. If there is high Csy4, then there is not enough PgU to inhibit mNeonGreen (because it is mostly used up in competing with Csy4), and the remaining Csy4 inhibits mKO2. I figured that since I don’t have any CasE expressed in my system, it doesn’t matter that CasE could also inhibit mKO2. eBBFP2 and mMaroon1 are controls to check for transfection efficiency. I had the unbalanced DNA amounts because that tests the analog computing that I was interested in.
Unfortunately, this first attempt gave an error when I tried to put it into the Neuromorphic Wizard tool. Looking through our forum discussion post, I was able to somewhat troubleshoot off of this explanation TA Steven got from ClaudeAI when he was trying to troubleshoot Jessica Wu’s circuit:
Why it failed:
The Predict API only accepts X1 + X2 groups (no OR, NOT, Bias etc.)
Each group must have exactly: marker + ERN + ERN_rec_output
Based off this, I changed the Transfection Group for the last two lines from Bias to X1 or X2; because even though that’s what was in the example given in the lab, this suggested that the Neuromorphic Wizard API could only accept X1 and X2. So my second attempt looked like this:
Circuit Name
Transfection Group
Contents
Concentration (ng/ul)
DNA wanted (ng)
JKScircuit-2
X1
PgU
50
200
JKScircuit-2
X1
eBFP2
50
100
JKScircuit-2
X2
PgU_rec_Csy4
50
50
JKScircuit-2
X2
mMaroon1
50
100
JKScircuit-2
X2
PgU_rec_mNeonGreen
50
100
JKScircuit-2
X1
CasE_rec_Csy4_rec_mKO2
50
100
Unfortunately, this still gave an error. I suspect that the PgU_rec_Csy4 and PgU_rec_mNeonGreen being in the same transfection group is outside the bounds of what the API could accept, but biologically, I don’t think this would be a problem. Essentially, I am using PgU_rec_Csy4 as an ERN instead of as a ERN_rec_output. The proper solution is probably to instead put PgU_rec_mNeonGreen into an X3 group instead of in X2 with the PgU_rec_Csy4, but we didn’t have enough colors to use as transfection controls since I wanted to use two colors as outputs.
TA Steven put my circuit into ClaudeAI to troubleshoot as well, and gave me this feedback:
Fixed. Here’s what changed:
Original
Fixed
Why
X2: PgU_rec_Csy4 (output, no ERN)
X2: Csy4 (ERN)
X2 needs a standalone ERN
X2: mMaroon1
X2: mKO2
API only recognizes eBFP2/mKO2 as markers
X1: CasE_rec_Csy4_rec_mKO2
X1: Csy4_rec_mNeonGreen
No CasE source existed; output should be mNeonGreen
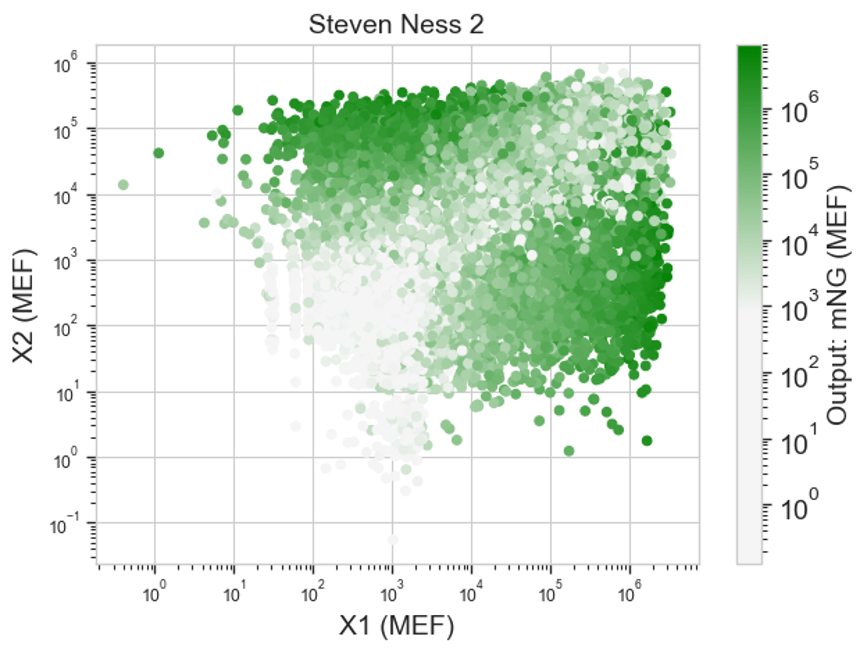
This is an asymmetric cross-inhibition — PgU is dosed 4x heavier than Csy4, so X1 should dominate the competition. The heatmap should show stronger suppression along the X1 axis.
Total DNA: 600ng (under limit).
This is frustrating because I’m pretty sure this is a limitation of the Neuromorphic Wizard API, and my circuit is biologically sound. The first one is what I suggested originally, that I am using PgU_rec_Csy4 as an ERN instead of as a ERN_rec_output. I’m not sure why X2 needs a standalone ERN. The second one is just that it doesn’t accept mMaroon1 as a marker, which is odd because it’s listed on the Parts list as an option. The third one is what I explained earlier; that since I don’t have any CasE expressed in my system, it doesn’t matter that CasE could also inhibit mKO2.
While I would have liked to see experimentally what would happen with my design, since I do think it’s valid biologically, we wanted to submit validated circuits only, since each node could only submit two circuits. So TA Steven submitted my circuit that was fixed by Claude because it was able to give a valid output on the Predict tab of the Neuromorphic Wizard.
Results:
I’m honestly not sure if this shows what I’d expect. I’m unclear on what these heatmaps are actually showing. Like I know that each dot is a cell that was transfected with the same things, but I’m not sure what exactly that means in regards to my circuit. I think I probably need to rewatch the lecture for clarity.
Week 9 Lab: Cell-Free Systems
Unfortunately, this lab is not available for remote participation.
Week 10 Lab: Mass Spectrometetry
Unfortunately, this lab was not available for remote participation. See this week’s homework for data analysis.
Which genes when transferred into E. coli will induce the production of lycopene and beta-carotene, respectively? Lycopene is produced from farnesyl diphosphate with the enzymes encoded by crtE, crtB, and crtL. Then to make beta-carotene, they need the additional enzyme encoded by crtY.
Why do the plasmids that are transferred into the E. coli need to contain an antibiotic resistance gene? The plasmids need an antibiotic resistance gene to ensure that the plasmid is retained. The plasmid is an extra metabolic cost for the cells to maintain, and culturing in antibiotics (that the plasmid has a resistance gene for) provides the pressure to keep and express the plasmid.
What outcomes might we expect to see when we vary the media, presence of fructose, and temperature conditions of the overnight cultures? With different culturing conditions, the cells might grow slower or faster, or produce more or less of the goal compounds.
Generally describe what “OD600” measures and how it can be interpreted in this experiment. OD600 is the measurement of optical density at 600 nm, which is generally used as a proxy for cell density because cells block light passing through the spectrophotometer. In this experiment, it can be interpreted into how well the cells grow.
What are other experimental setups where we may be able to use acetone to separate cellular matter from a compound we intend to measure? i’m not sure what this question is asking. like what other bioproduceable compounds are acetone-soluble?
Why might we want to engineer E. coli to produce lycopene and beta-carotene pigments when Erwinia herbicola naturally produces them? E. coli grows faster and is better studied, which means we have more genetic tools available to manipulate E. coli compared to E. herbicola and we know more about the metabolism so we might make more informed choices for metabolic engineering.
Post-lab questions (Committed Listeners)
Let’s get in touch with our metabolic pathway.
What are the enzymes of the carotene pathway? CrtE (geranylgeranyl diphosphate synthase), CrtB (phytoene synthase), CrtL (lycopene beta-cyclase), CrtY (lycopene cyclase), and CrtZ (beta-carotene hydroxylase).
Within this pathway, which is the rate determining step (the step that takes the longest)? Which enzyme is responsible for this step?
Notes for design of a DNA construct for bioproduction
The first thing to do is to decide what organism you are going to use for this (E. coli or S. cerevisiae) for production. Which would you choose and why (emphases on production differences)? I would choose E. coli for production because it has a faster growth rate and there are known bacterial genes for this biosynthesis pathway. I’d really only ever choose S. cerevisiae if my product required eukaryotic biosynthetic enzymes.
Now choose one of the enzymes and lets outline the parts of the construct for expression. I’ll go with CrtB.
What is the function of a promoter? The promoter is the RNA-polymerase recognition site that indicates the polymerase that this is the start of a gene and to begin transcription here.
What types of promoters do we have? There are constitutive, inducible, or repressible promoters of varying strengths. For E. coli, we would use bacterial or bacteriophage promoters (if the host strain contains phage polymerase).
If we wanted to turn off the transcription of a gene in response to a metabolite, what type of promoter would be most useful? What if we wanted this to increase in the presence of the metabolite? To turn off transcription in response to a metabolite, a repressible promoter would be more useful. To increase transcription in response to a metabolite, an inducible promoter would be more useful.
Now choose one of the genes of the metabolic pathway previously described (Carotene/lycopene )and choose one enzyme to make an expression construct. What promoter could you use for this? Why did you choose it? I would use a T7 promoter because it is a strong constitutive promoter, but it would have to be in an E. coli strain that includes T7 polymerase, such as BL21(DE).
What is the origin of replication? The origin of replication is the recognition point for DNA polymerase, for additional copies of the plasmid to be made - both for multiple copies within a single cell and for daughter cells in cell division.
What types of origin of replication do we have? Ori’s are relaxed if they are positively regulated by RNA or stringent if they are positively regulated by proteins. An ori is high-copy, medium-copy, or low-copy depending on the balance between positive and negative regulation. For plasmids that are produced in E. coli for transfection into another organism, the plasmid would need to have both an E. coliori and an ori for that other organism.
(Extra) What are compatibility groups? Compatibility groups refers to classifications of ori’s that are derived from the same sequence, and thus use the same cellular machinery for replication. For the most predictable and reproducible copy-numbers, plasmids with ori’s in the same compatibility group shouldn’t be used together in the same strain.
Now for the previously chosen promoter and gene what will be the best origin or replication? pMB1 ori is the ori in pUC plasmids, which is high-copy number, and therefore good for overexpression of an enzyme for increased biosynthesis.
(Mandatory for Global listeners, Optional MIT/Harvard) Elaborate further on other bioparts like RBS, terminators, operators you would use for a correct design and further bioproduction? For overexpression, I would use an RBS close to the consensus sequence, and probably a double terminator to prevent any leaky readthrough. Finally, I might add an operator like lacO (or fully replace my T7 promoter with an inducible promoter) to add inducible control over gene expression in case the high expression ended up producing a toxic amount of protein.
(Hot! Extra points) What are aptamers and riboswitches and how can they be used for metabolic tuning or engineering in prokaryotes? Aptamers and riboswitches are nucleic acid sequences that can bind to themselves and/or specific molecules, which allows for adding inducible control to promoters that are not typically inducible.
(Extra points) Now what approach can be used to join all these parts together? Make a quick analysis of their sequence in search of possibilities (search for restriction sites, etc) I’d probably use Gibson assembly to join all these parts so I don’t need to worry about designing restriction sites, just designing primers. However, Golden Gate assembly might work better if I want to be sub out different parts later.
(Extra Hot!!! Extra Points) Try to elaborate further on a biosynthetic pathway you would want to engineer in E. coli for production of a metabolite or product. What use could this bio-product have? Imagine dream applications!!!
(Extra points) For S. cerevisiae create an integration cassette for homologous recombination.
First let’s check some concepts of yeast engineering and homologous recombination this in this notes
As well as for prokaryotes, eukaryotic DNA designs need bioparts used for construction of a function design and further expresion. Now search for a biosynthetic pathway if interested and describe one of the genes of the pathway.
Now, remember that for making a functional construct there are a variety of biological parts needed for this, like ribosome binding sites or Kozak sequences, terminators, and promoters. List the ones you could use for DNA design.
In yeast engineering we use DNA construction designs for making genome integration. What chromosome site could you use for integration of these and why?
(Hot! Extra points) Following the next chart of how a DNA integration cassette should be designed and with the previously chosen parts elaborate the DNA sequence you could use to synthesize with Twist.