Week 10 HW: Advanced Imaging & Measurement Technology
Final Project
For your final project:
Please identify at least one (ideally many) aspect(s) of your project that you will measure. It could be the mass or sequence of a protein, the presence, absence, or quantity of a biomarker, etc.
Please describe all of the elements you would like to measure, and furthermore describe how you will perform these measurements.
What are the technologies you will use (e.g., gel electrophoresis, DNA sequencing, mass spectrometry, etc.)? Describe in detail.
Waters Part I — Molecular Weight
We will analyze an eGFP standard on a Waters Xevo G3 QTof MS system to determine the molecular weight of intact eGFP and observe its charge state distribution in the native and denatured (unfolded) states. The conditions for LC-MS analysis of intact protein cause it to unfold and be detected in its denatured form (due to the solvents and pH used for analysis).
Based on the predicted amino acid sequence of eGFP (see below) and any known modifications, what is the calculated molecular weight? You can use an online calculator like the one at https://web.expasy.org/compute_pi/
 eGFP Sequence:
 MVSKGEELFTG VVPILVELDG DVNGHKFSVS GEGEGDATYG KLTLKFICTT GKLPVPWPTL VTTLTYGVQC FSRYPDHMKQ HDFFKSAMPE GYVQERTIFF KDDGNYKTRA EVKFEGDTLV NRIELKGIDF KEDGNILGHK LEYNYNSHNV YIMADKQKNG IKVNFKIRHN IEDGSVQLAD HYQQNTPIGD GPVLLPDNHY LSTQSALSKD PNEKRDHMVL LEFVTAAGIT LGMDELYKLE HHHHHH
 Note: This contains a His-purification tag (HHHHHH) and a linker (the LE before it).
Theoretical pI/Mw: 5.90 / 27875.41 (monoisotopic) Theoretical pI/Mw: 5.90 / 27857.92
- Calculate the molecular weight of the eGFP using the adjacent charge state approach described in the recitation. Select two charge states from the intact LC-MS data (Figure 1) and:
- Determine z for each adjacent pair of peaks (n, n+1) using:
Let’s take the two largest peaks on the graph, labelled at m/zn = 903.7148 and m/zn+1 = 875.4421. z = 875.4421 / (903.7148 - 875.4421) = 30.96
- Determine the MW of the protein using the relationship between m/zn , MW, and z
MW = (n * m/zn - n) = (30.96 * 903.7148 - 30.96) = 27951.85
- Calculate the accuracy of the measurement using the deconvoluted MW from 2.2 and the predicted weight of the protein from 2.1 using: Figure 1. Mass Spectrum of intact eGFP protein from the Waters Xevo G3 LC-MS (a mass spectrometer with 30,000 resolution) with individual charge state peaks labeled with $\frac{m}{z}$ values.
Accuracy =|27951.85 - 27875.41| / 27875.41 = 0.002742 * 1,000,000 = 2742.545 ppm
- Can you observe the charge state for the zoomed-in peak in the mass spectrum for the intact eGFP? If yes, what is it? If no, why not?
No, I would need a second peak for the adjacent charge state approach. The second noticeable peak is not in the zoomed in photo, and I am skeptical that the small rise I see in the photo is considered a peak.
Waters Part II — Secondary/Tertiary structure (OPTIONAL)
We will analyze eGFP in its native, folded state and compare it to its denatured, unfolded state on a quadrupole time-of-flight MS. We will be doing MS-only analysis (no liquid chromatography, also known as “direct infusion” experiments) on the Waters Xevo G3-QToF MS.
Based on learnings in the lab, please explain the difference between native and denatured protein conformations. For example, what happens when a protein unfolds? How is that determined with a mass spectrometer? What changes do you see in the mass spectrum between the native and denatured protein analyses (Figure 2)? Figure 2. Comparison of the mass spectra between denatured (top) and native (bottom) eGFP standard on the Waters Xevo G3 QTof MS.
Zooming into the native mass spectrum of eGFP from the Waters Xevo G3 QTof MS (see Figure 3), can you discern the charge state of the peak at ~2800 m/z? What is the charge state? How can you tell? Figure 3. Native eGFP mass spectrum from the Waters Xevo G3 Q-Tof MS. The inset is a zoomed-in view of the charge state at ~2800 $\frac{m}{z}$ on a mass spectrometer with 30,000 resolution.
Waters Part III — Peptide Mapping - primary structure
- How many Lysines (K) and Arginines (R) are in eGFP? Please circle or highlight them in the eGFP sequence given in Waters Part I question 1 above. (Note: adding the sequence to Benchling as an amino acid file and clicking biochemical properties tab will show you a count for each amino acid).
MVSKGEELFTG VVPILVELDG DVNGHKFSVS GEGEGDATYG KLTLKFICTT GKLPVPWPTL VTTLTYGVQC FSRYPDHMKQ HDFFKSAMPE GYVQERTIFF KDDGNYKTRA EVKFEGDTLV NRIELKGIDF KEDGNILGHK LEYNYNSHNV YIMADKQKNG IKVNFKIRHN IEDGSVQLAD HYQQNTPIGD GPVLLPDNHY LSTQSALSKD PNEKRDHMVL LEFVTAAGIT LGMDELYKLE HHHHHH
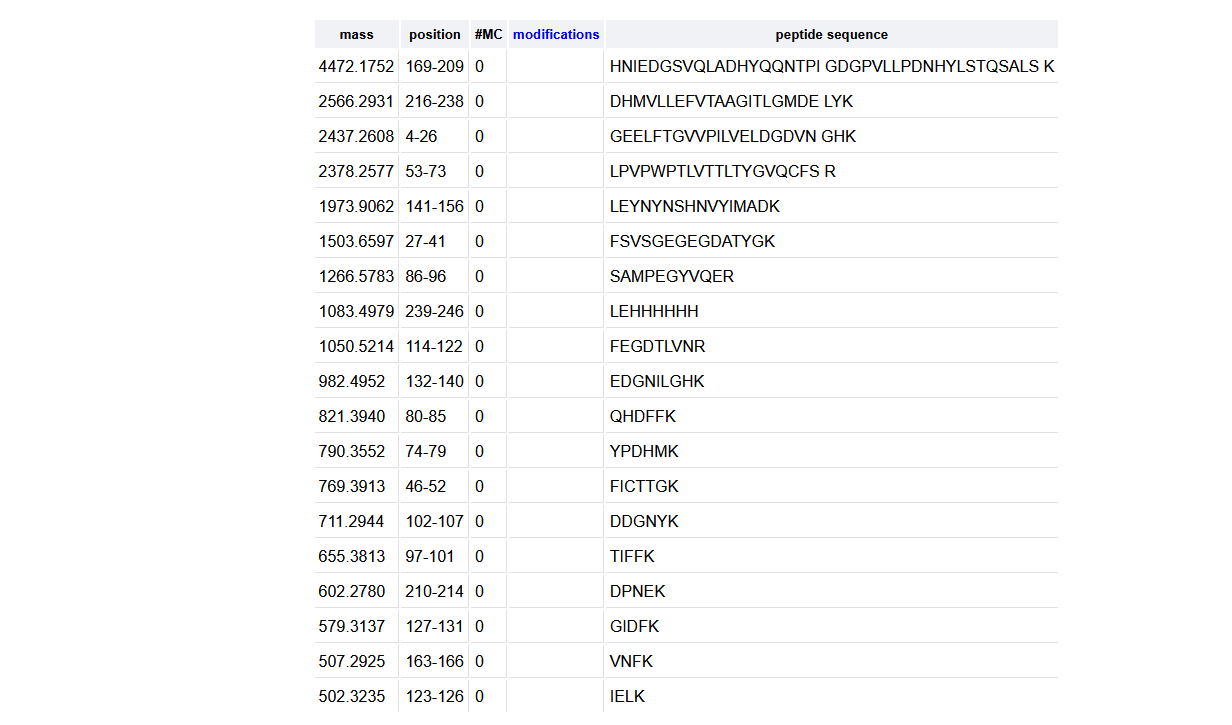
- How many peptides will be generated from tryptic digestion of eGFP?
19 peptides were generated as seen in the photo below.
- Based on the LC-MS data for the Peptide Map data generated in lab (please use Figure 5a as a reference) how many chromatographic peaks do you see in the eGFP peptide map between 0.5 and 6 minutes? You may count all peaks that are >10% relative abundance.
I counted 19 and used roughly 10% * 1.2e7 = 0.12e7 as a threshold (photo below).
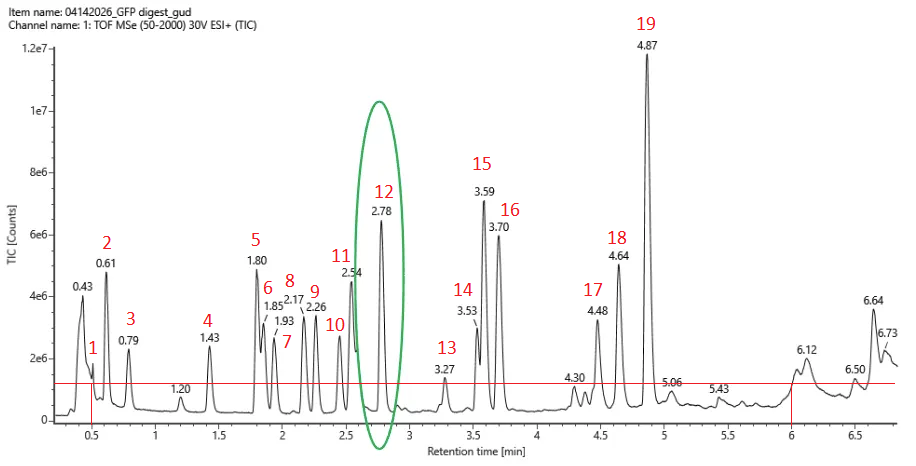
- Assuming all the peaks are peptides, does the number of peaks match the number of peptides predicted from question 2 above? Are there more peaks in the chromatogram or fewer?
It matches exactly. I’m pleasantly surprised!
- Identify the mass-to-charge (m/z) of the peptide shown in Figure 5b. What is the charge (z) of the most abundant charge state of the peptide (use the separation of the isotopes to determine the charge state). Calculate the mass of the singly charged form of the peptide ([M+H}+]) based on its m/z and z.
The m/z of the most abundant charge state is 525.76712, with the charge being z = 1/(Δm/z) = 1/(525.76712 - 526.25918) = 2.0322 ≈ 2
As a result, the mass is [M+H]+ = (m/z * z) - (z - 1) * H = 1051.53424 - 1.00727 = 1050.527
- Identify the peptide based on comparison to expected masses in the PeptideMass tool. What is mass accuracy of measurement? Please calculate the error in ppm.
It’s closest to FEGDTLVNR, which has a mass of 1050.5214. AccuracyFEGDTLVNR = |1050.527 - 1050.5214| / 1050.5214 = 5.30 ppm
- What is the percentage of the sequence that is confirmed by peptide mapping? (see Figure 6) Figure 6. Amino Acid Coverage Map of eGFP based on BioAccord LC-MS peptide identification data.
91.1% of my sequence is covered, not excluding peptides less than 500 Da.
Bonus Peptide Map Questions
- Can you determine the peptide sequence for the peptide fragmentation spectrum shown in Figure 5c? (HINT: Use your results from Question 2 above to match the peptide molecular weight that is closest to that shown in Figure 5b. Copy and paste its sequence into this tool online to predict the fragmentation pattern based on its amino acid sequence: http://db.systemsbiology.net/proteomicsToolkit/FragIonServlet.html. What is the sequence of the eGFP peptide that best matches the fragmentation spectrum in Figure 5c?
- Does the peptide map data make sense, i.e. do the results indicate the protein is the eGFP standard? Why or why not? Consult with Figure 6, which depicts the % amino acid coverage of peptides positively identified using their calculated mass and fragmentation pattern.
Waters Part IV — Oligomers
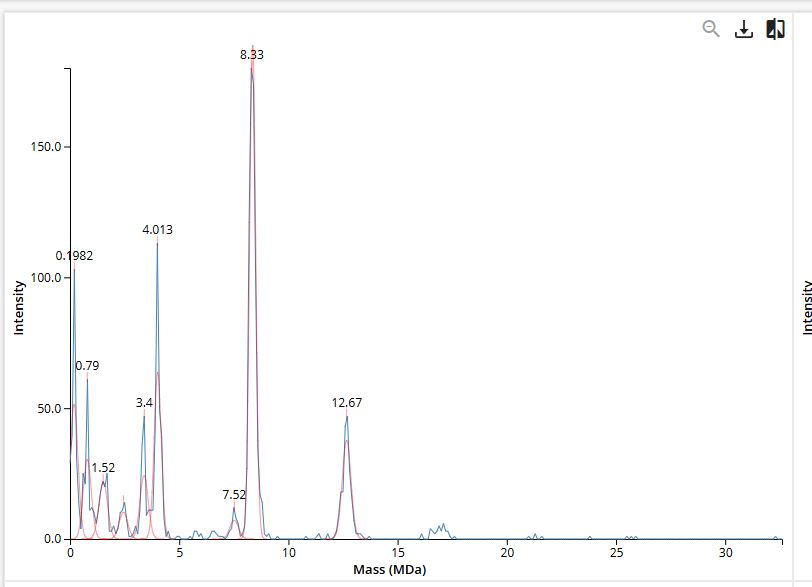
We will determine Keyhole Limpet Hemocyanin (KLH)’s oligomeric states using charge detection mass spectrometry (CDMS). Identify where the following oligomeric species are on the spectrum shown below from the CDMS:
For CDMS, calculation of mass is just a function of m/z * z. So for the following:
- 7FU Decamer → 340 kDa * 10 = 3.4 MDa
- 8FU Didecamer → 400 kDa * 20 = 8 MDa
- 8FU 3-Decamer → 400 kDa * 30 = 12 MDa
- 8FU 4-Decamer → 400 kDa * 40 = 16 MDa
Waters Part V — Did I make GFP?
This is from data given in the homework, not lab work.
| Theoretical | Observed/measured on the Intact LC-MS | PPM Mass Error | |
|---|---|---|---|
| Molecular weight (kDa) | 27875.41 | 27951.85 | 2742.545 ppm |
My error was unusually high for observed mass.