Week 7 Lab: NeuroMorphic Circuits
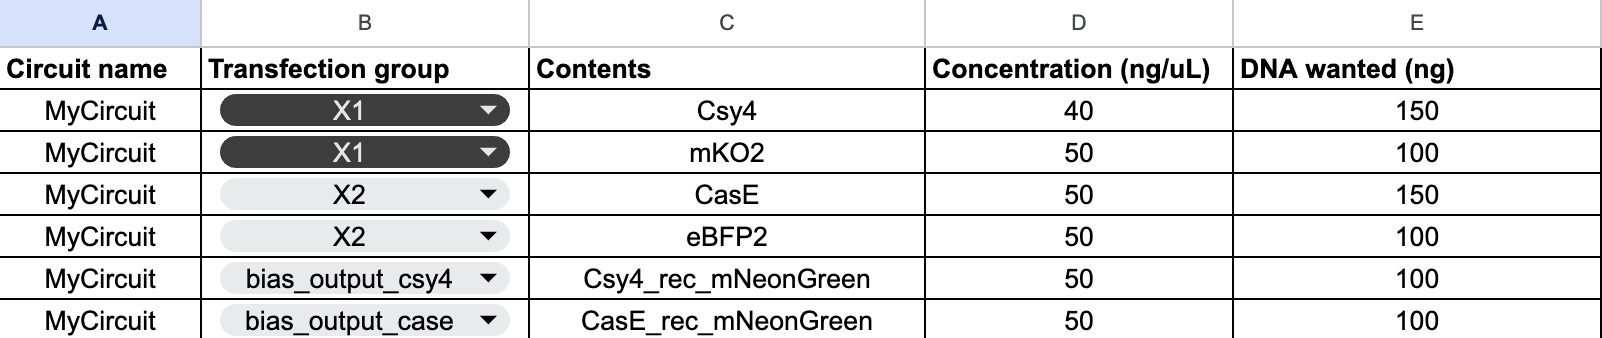
For the neuromorphic circuit, our group aimed to design a “L” shaped heatmap. We added two bias corresponding to X1 and X2 ERNs.
Looked perfect
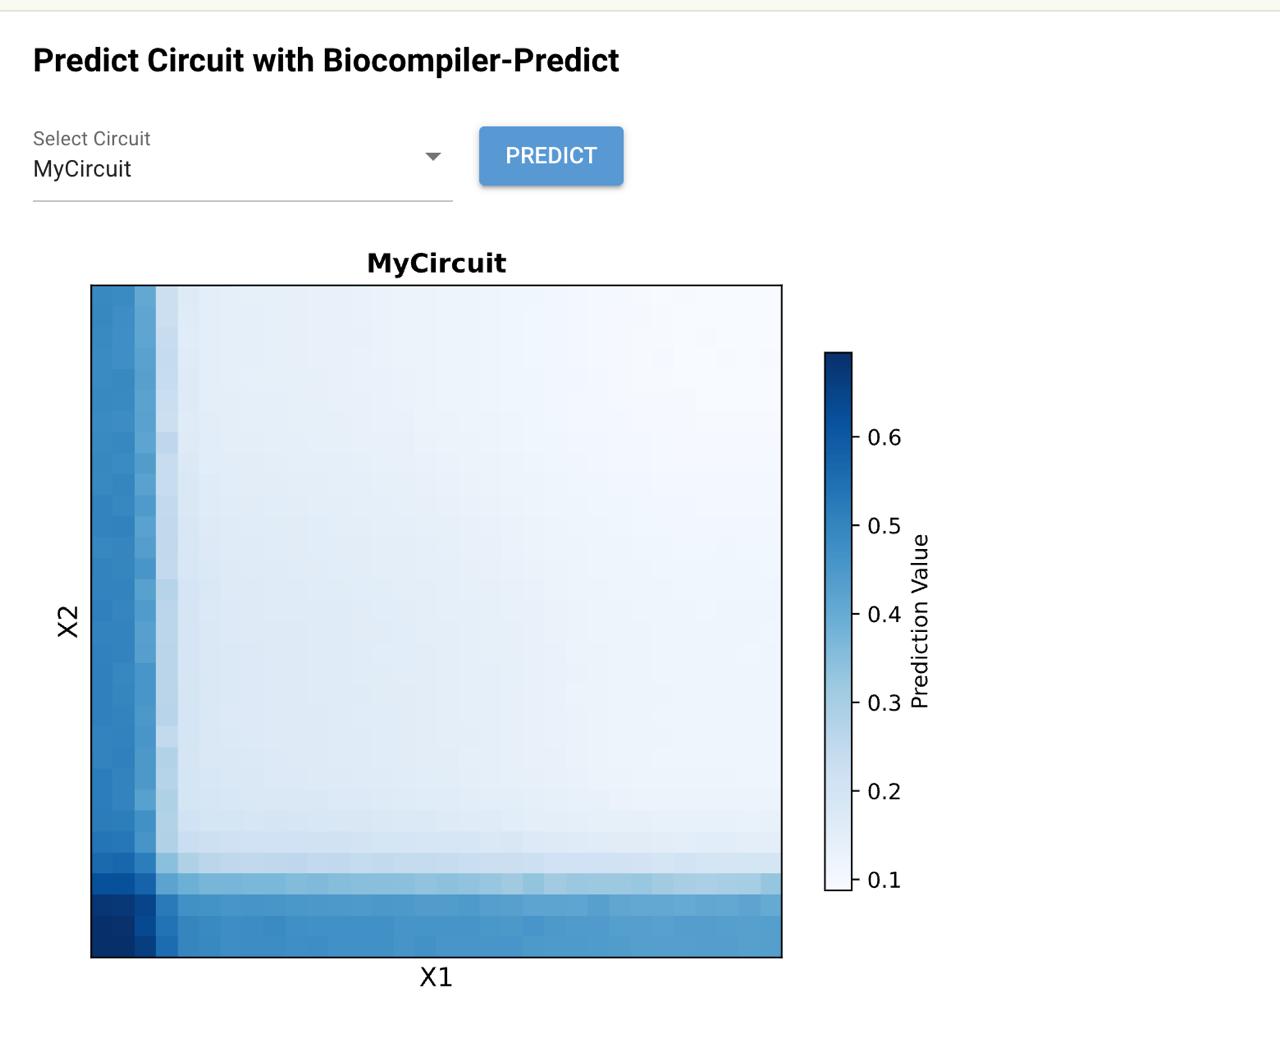
I think we might’ve submitted the wrong file ahahaha, so the final output only displayed the bottom part of the “L”
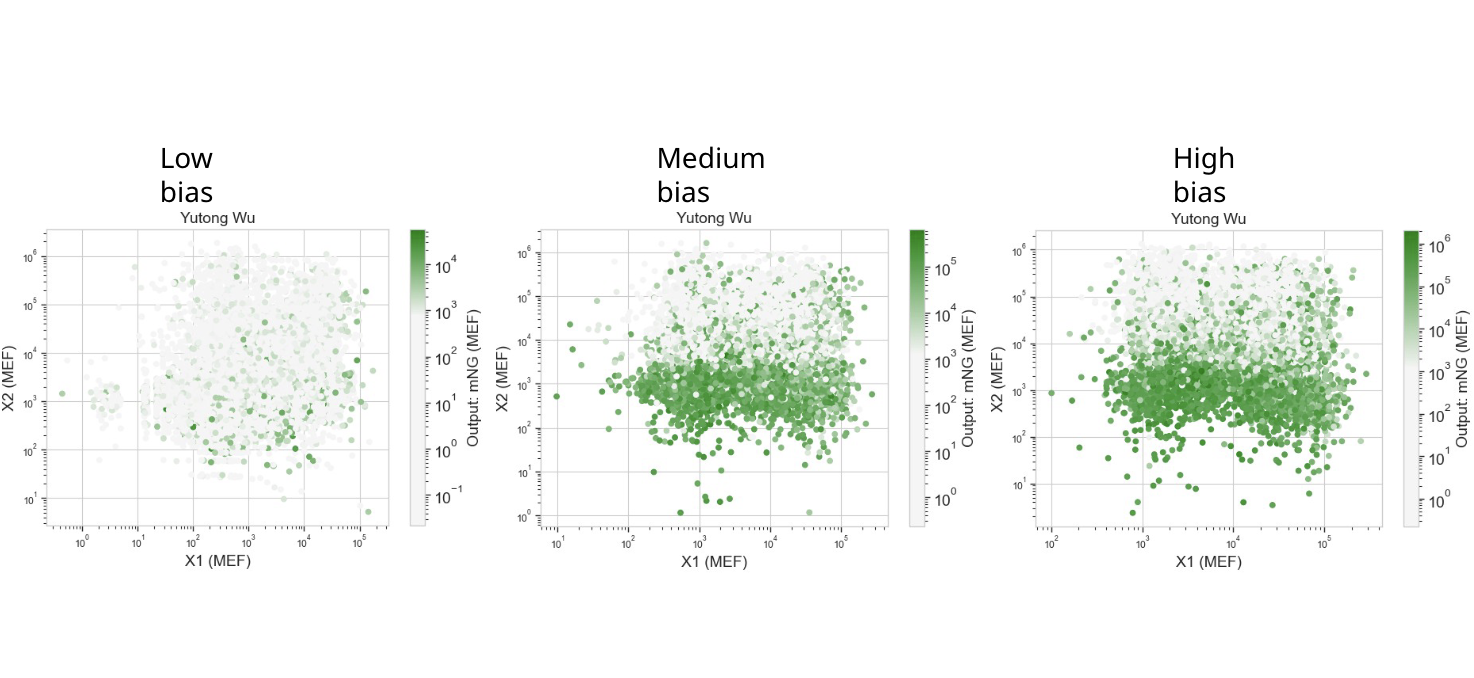
Each dot in these scatterplots represents a single human cell. The color shows the level of output (mNeonGreen) as a function of X1 and X2 and, optionally, varying levels of bias.