Individual Project
Bio-Tamagotchi Lab Documentation
PosmY-mCherry Induction
Project Overview & Construct Design
The bio-tamagotchi is an engineered bacterial system that communicates hunger through a visible fluorescence signal. Rather than programming a digital screen to display need, the bacteria themselves become the display, producing red fluorescent protein in direct proportion to their nutritional stress. The core idea is that the same molecular machinery bacteria use to respond to starvation can be hijacked to drive a reporter gene, turning an invisible biochemical state into something measurable and visible.
1. The PosmY-mCherry Construct
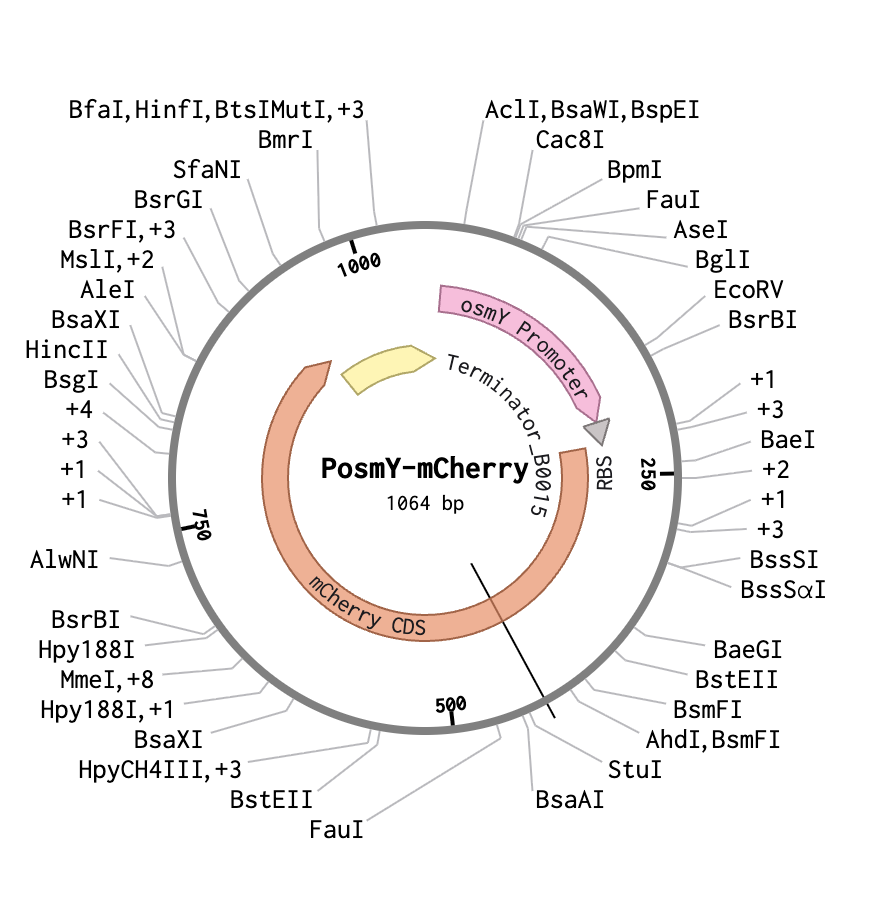 The construct consists of two functional parts joined together:
Plasmid backbone: Standard cloning vector with chloramphenicol resistance
Host organism: E. coli NEB 10-beta (DH5α background)
Note on DNA concentration: The Twist order arrived with 11,193 ng total DNA written on the tube. This is an extremely high total amount of DNA in a small volume, resulting in very high ng/µL concentration. This explains why: (1) only 1–2 µL of plasmid was needed for transformation, (2) colonies grew extremely densely on the agar plate, and (3) liquid cultures required very high dilution ratios (1:1000) to reach measurable OD600 readings.
OsmY (Osmotically inducible protein Y) is a naturally occurring E. coli gene that encodes a periplasmic protein expressed strongly under stress conditions. Its promoter, PosmY, is one of the most well-characterized stress-inducible promoters in E. coli and is the regulatory element used in this construct.
PosmY uses the host’s own RNA polymerase equipped with the RpoS (σS) sigma factor — making it a biological sensor rather than a chemically induced one.
2. Mechanism of PosmY
The PosmY promoter is controlled by RpoS (σS), known as the general stress response sigma factor in E. coli. Here is the step-by-step mechanism:
Under normal conditions (fed bacteria in rich LB media):
Under stress conditions (starved bacteria in M9 media):
What triggers RpoS accumulation (stress signals PosmY responds to):
- Nutrient starvation — carbon, nitrogen, or phosphate depletion (M9 minimal media)
- Osmotic stress — high salt concentration (NaCl induction used in validation)
- Stationary phase — when bacteria run out of nutrients and stop growing
- Low pH, temperature stress, oxidative stress — general stress conditions
This makes PosmY a multi-stress sensor rather than a single-input switch, which is ideal for a hunger-monitoring application since nutrient depletion triggers multiple overlapping stress pathways simultaneously.
3. mCherry Reporter
mCherry is a monomeric red fluorescent protein derived from DsRed of coral origin. It was chosen as the reporter for several reasons:
| Property | Value |
|---|---|
| Excitation maximum | 587 nm |
| Emission maximum | 610 nm |
| Color | Deep red/pink |
| Maturation time | ~30–60 min (needs oxygen) |
| Monomer | Yes — no aggregation artifacts |
| Visible to naked eye | Yes — pink/red tint in dense cultures |
The red color is particularly well-suited for this application because it is visually distinctive and spectrally separated from common sources of cellular autofluorescence (which tend to be blue/green), giving a cleaner signal-to-noise ratio.
Experimental Aim
The construct aims to demonstrate a proof-of-concept biosensor where:
Intermediate Aim
Characterise the dynamic hunger response of PosmY-mCherry and establish a quantitative fluorescence-to-hunger calibration
establish exactly when PosmY activates after starvation begins, how fast signal rises, and when it peaks — the hunger kinetics of the system
Visionary Aim
Engineer a self-contained, real-time biological hunger display — a living system that visually communicates its own nutritional state
a closed-loop system where bacteria signal hunger → device detects it → display shows it → user feeds system → bacteria recover → signal drops
Validation goal: Confirm the construct fluoresces at all and responds to osmotic stress (NaCl) as a proxy for general stress signaling.
Experimental goal: Demonstrate that bacteria in M9 minimal media (starved/hungry) produce significantly higher fluorescence than bacteria in LB broth (fed), establishing a hunger vs. satiety fluorescence contrast.
Workflow
May 9, 2026 (Transformation)
Objective: Introduce PosmY-mCherry plasmid into NEB 10-beta competent cells and select for successful transformants on antibiotic plates.
Step 1.1 — Thaw Competent Cells & Prepare Materials
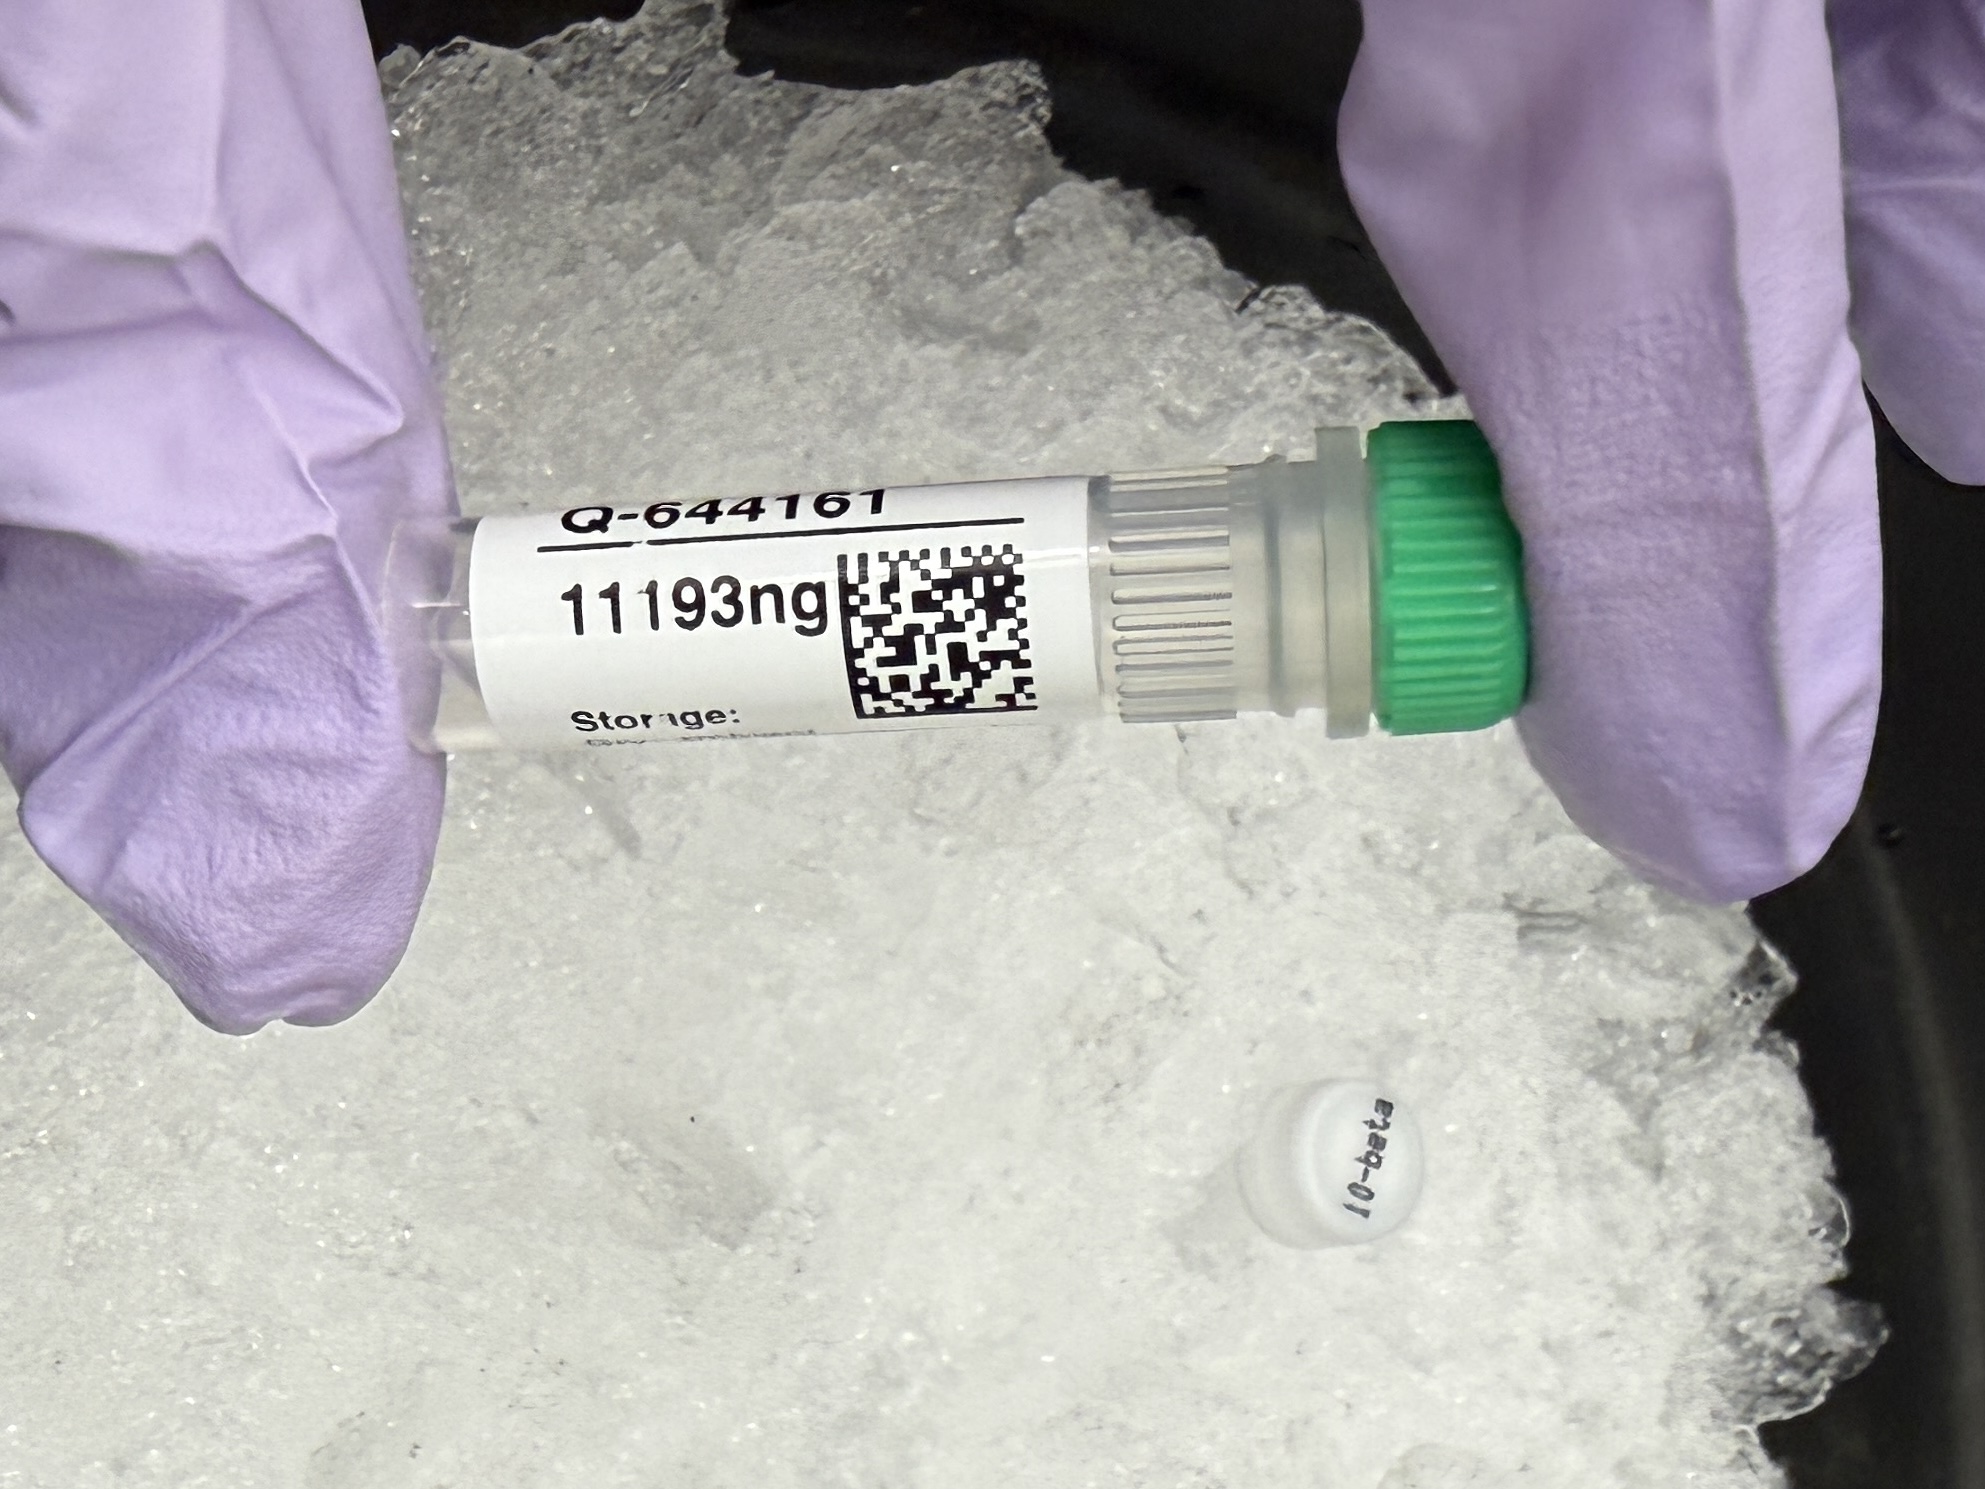
Fig 1. Twist Bioscience PosmY-mCherry plasmid stock (Q-644161), labeled 11,193 ng total, held on ice.
- Retrieved NEB 10-beta competent cell aliquot (~40 µL) from -80°C freezer
- Placed immediately in ice bucket and thawed slowly for 15 minutes on ice
- Thermal cycler pre-set to 42°C simultaneously
Note on plasmid stock: Label reads 11,193 ng total in a small volume — exceptionally high concentration. Only 2 µL was used for transformation. This directly explains the very dense colony growth observed the following morning.
Step 1.2 — Add Plasmid DNA to Competent Cells
- Pipetted 2 µL of PosmY-mCherry plasmid directly into the competent cell Eppendorf using a P20 pipette
- Mixed by gentle flicking 2–3 times — no vortexing (shear forces damage membrane and DNA)
- Returned immediately to ice
Step 1.3 — Incubation (30 minutes)
Purpose: Allows plasmid DNA to associate with the outer cell membrane surface before heat shock opens pores for DNA entry.
Step 1.4 — Heat Shock (42°C, 42 seconds)
- Transferred cell suspension into a PCR tube for the thermal cycler
- Ran thermal cycler: 42°C for exactly 42 seconds
- Immediately returned to ice for 2 minutes
Mechanism: Brief heat spike creates transient pores in the E. coli membrane, allowing plasmid DNA to enter the cell. Rapid return to ice seals the pores, trapping DNA inside.
Step 1.5 — Recovery in SOC/LB Broth (1 hour, 37°C)
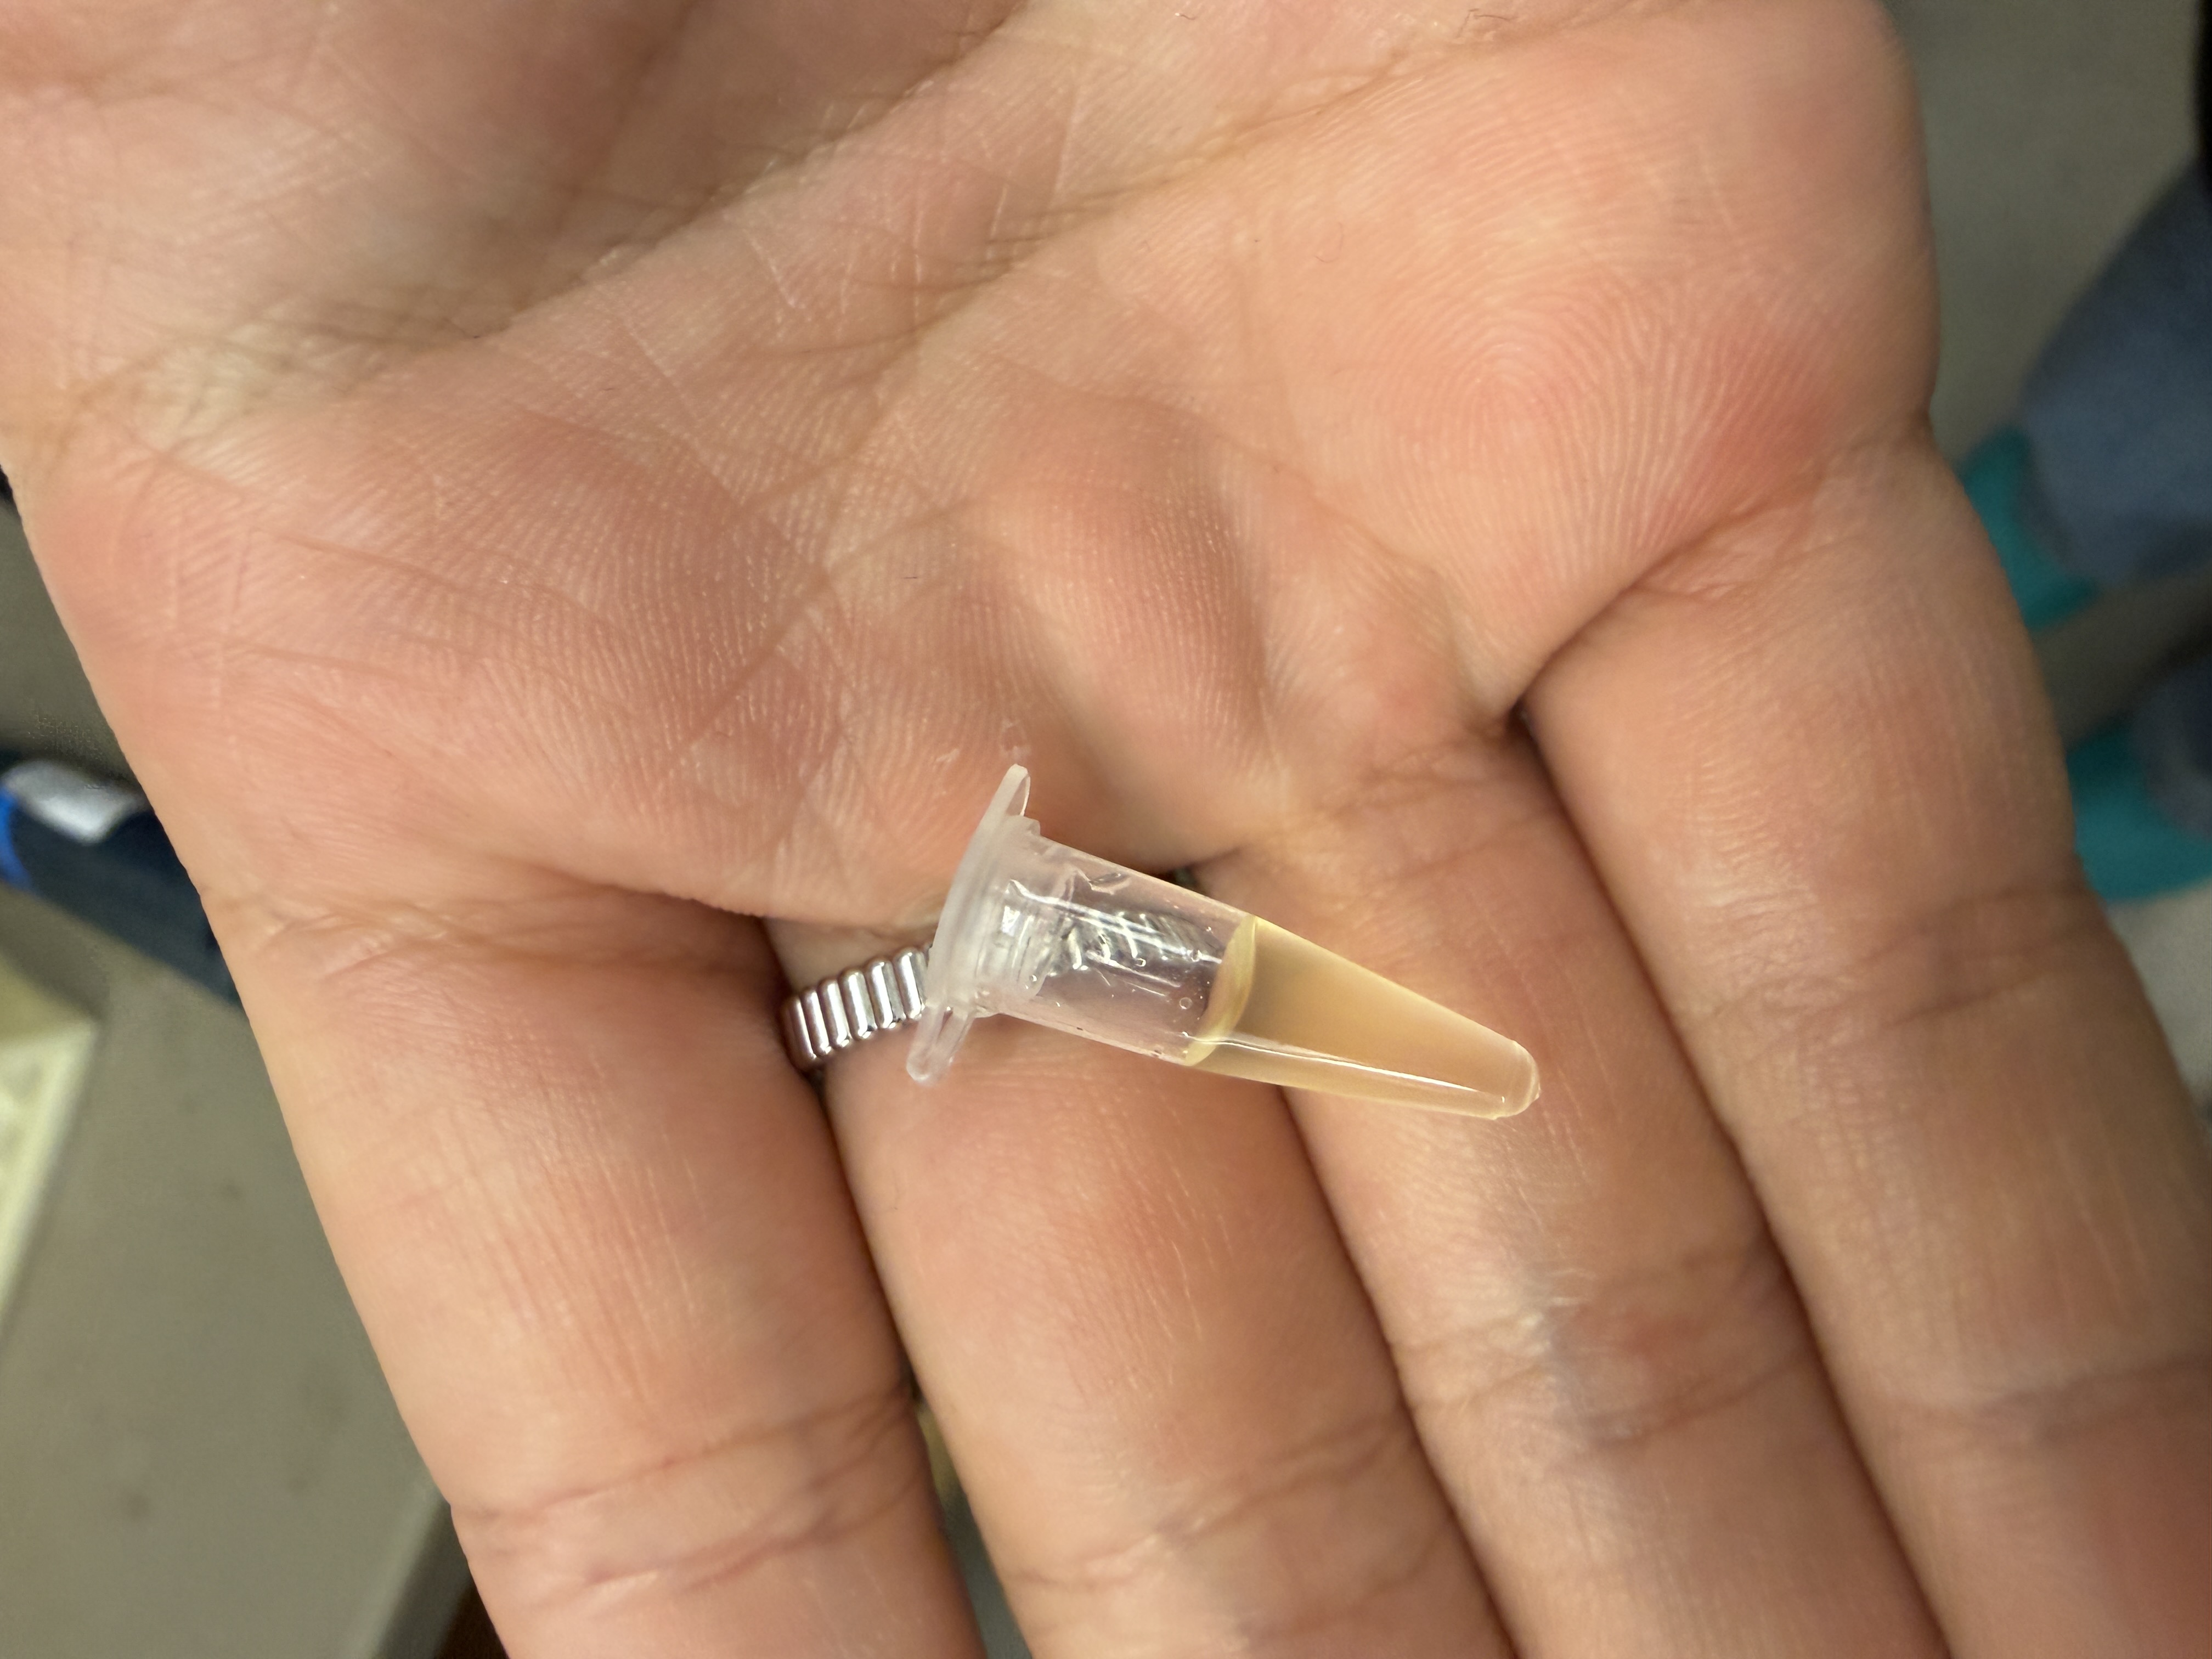
Fig 3. Eppendorf containing the cell + plasmid mixture in SOC recovery media, ready for the 1-hour shaker incubation.
- Transferred suspension back from PCR tube into a 1.5 mL Eppendorf
- Added 900 µL SOC/LB broth (no antibiotic)
- Placed on tube rotator at 37°C, 1 hour, cap loose for aeration
Why no antibiotic: Cells need time to express the chloramphenicol resistance gene before being challenged with antibiotic selection. Adding it immediately would kill all cells before resistance protein can be produced.
Step 1.6 — Plating on LB Agar + Chloramphenicol
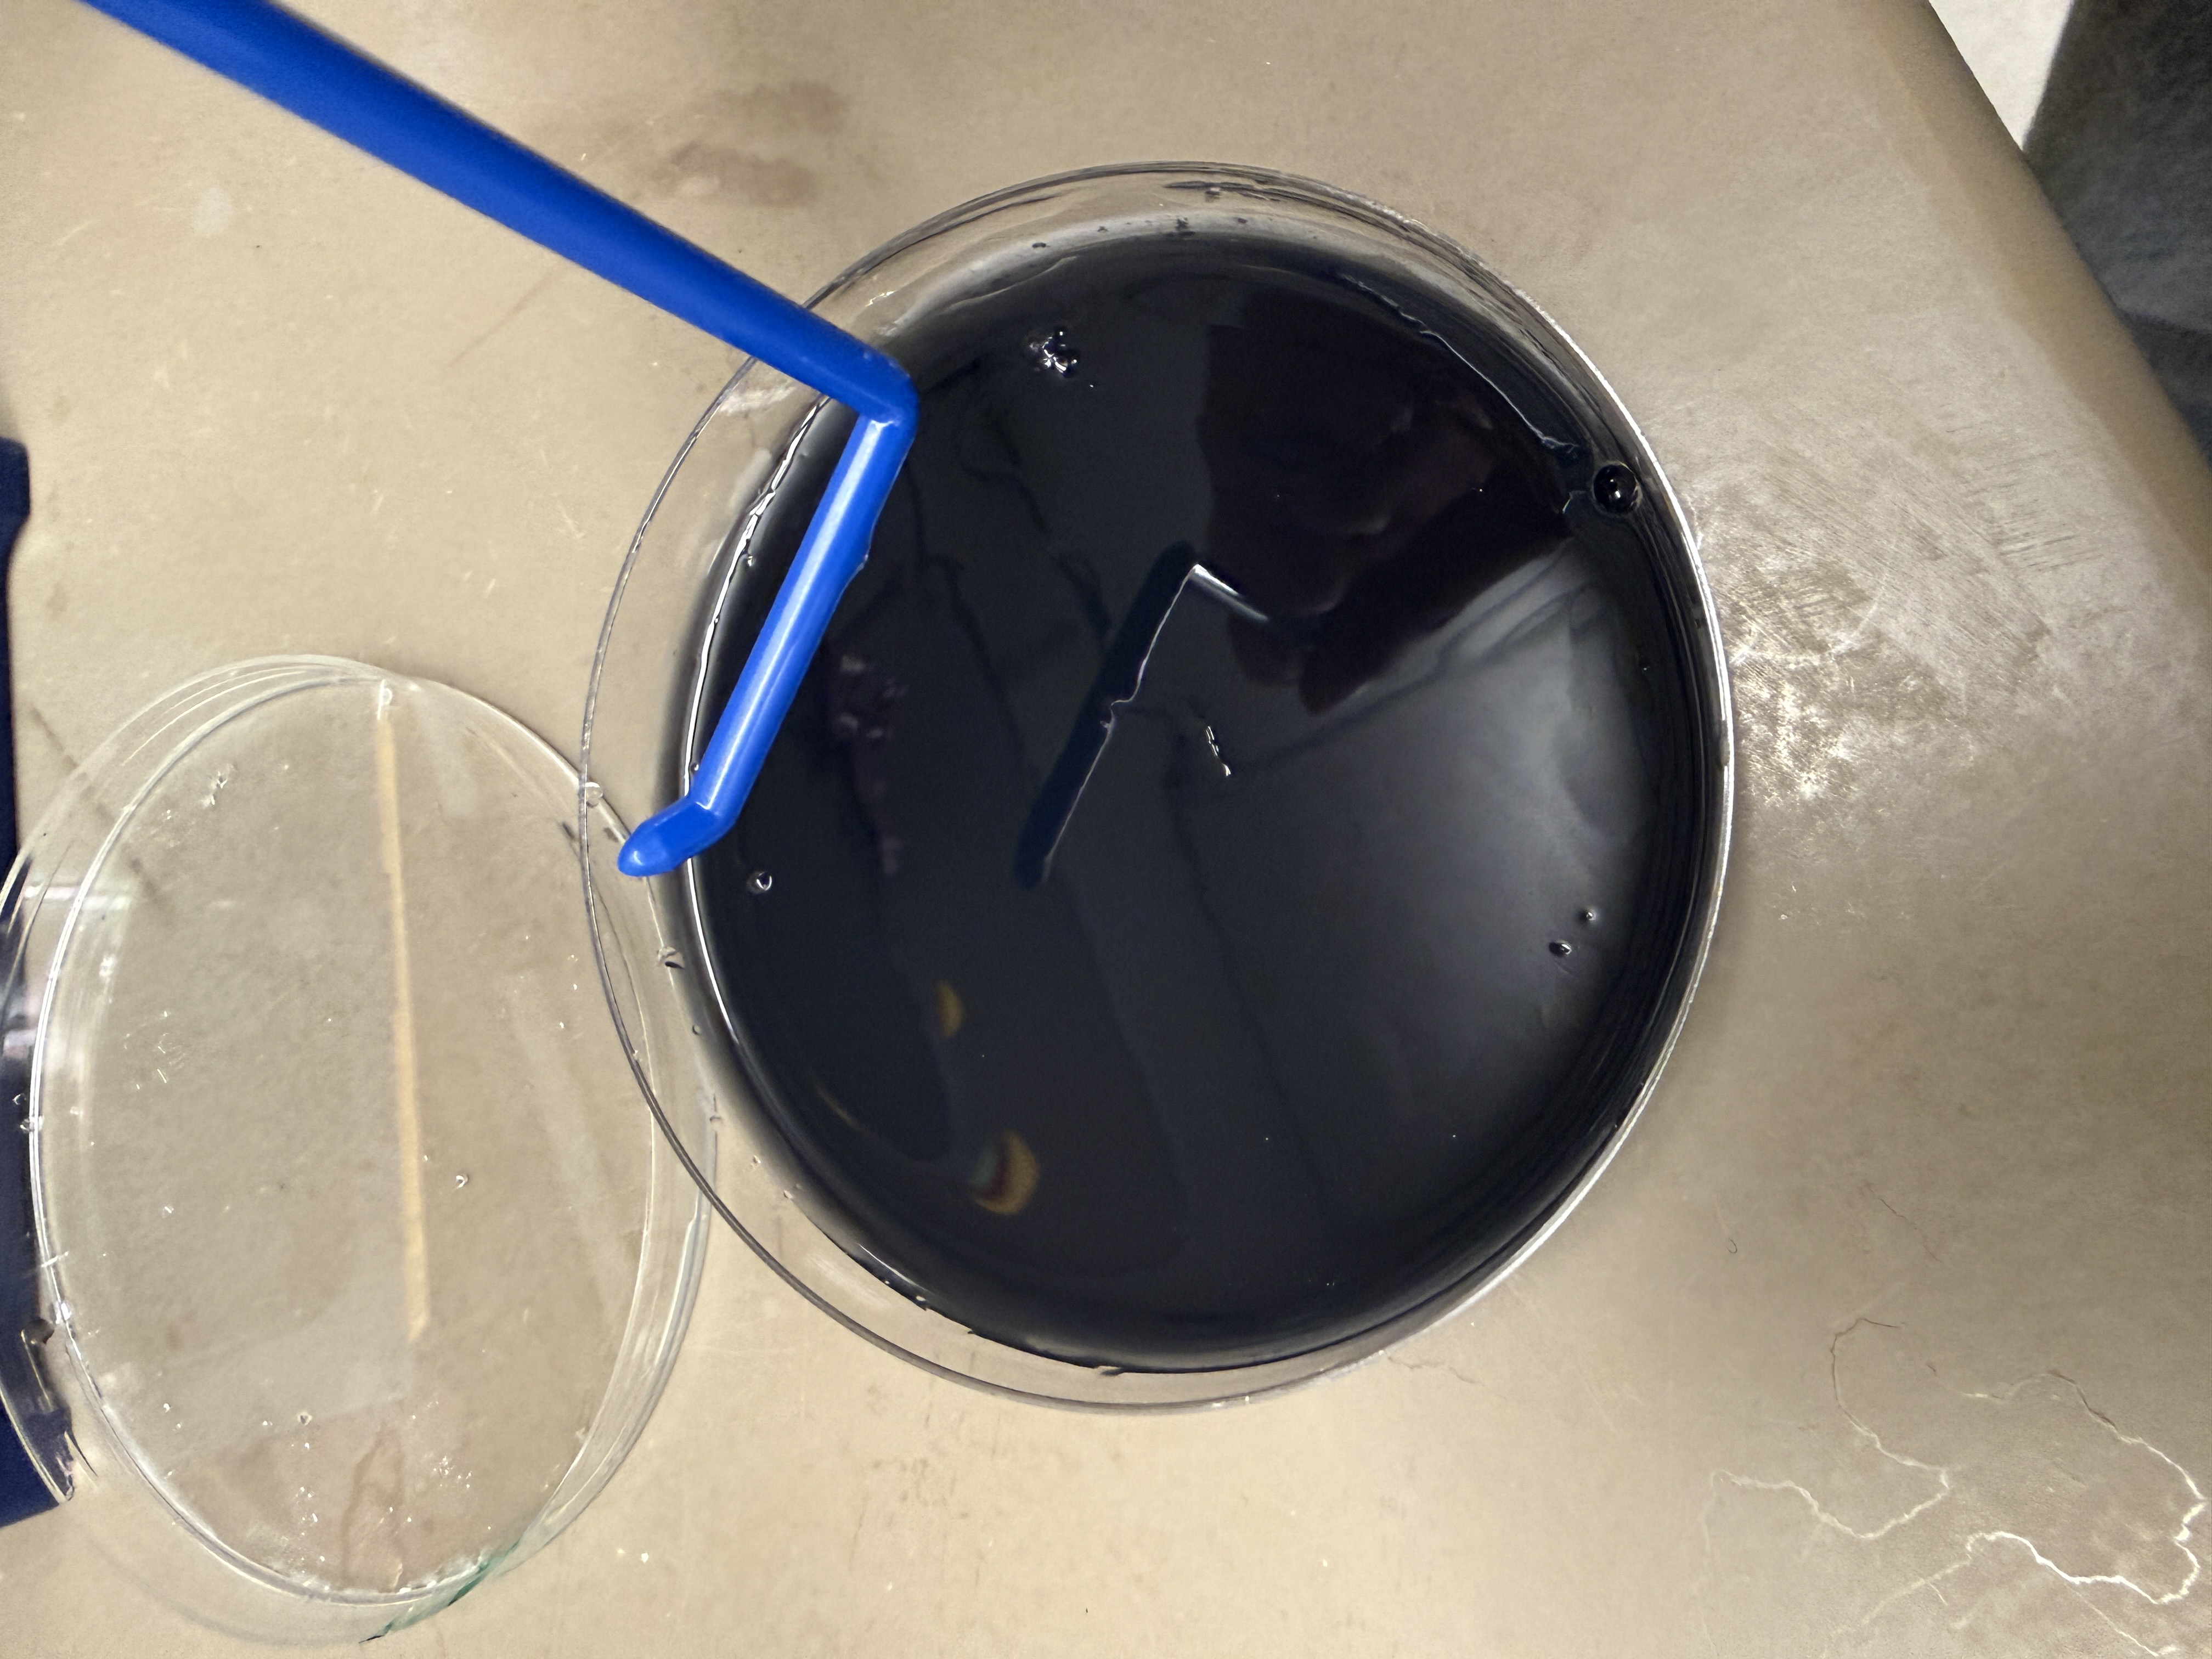
Fig 4. 100 µL of recovered cell suspension spread across LB agar + chloramphenicol plate using a sterile cell spreader.
- Pipetted 100 µL onto LB agar + chloramphenicol plate
- Spread evenly using sterile cell spreader
- Waited 2–3 minutes for liquid to absorb
- Flipped plate upside down (agar side up) — prevents condensation dripping onto colonies
- Incubated at 37°C overnight, 12–16 hours
- Labeled agar-side bottom: name, date (May 9), “PosmY-mCh”, “Chlor”
Result: Colony Growth (Sunday May 10, 2026)
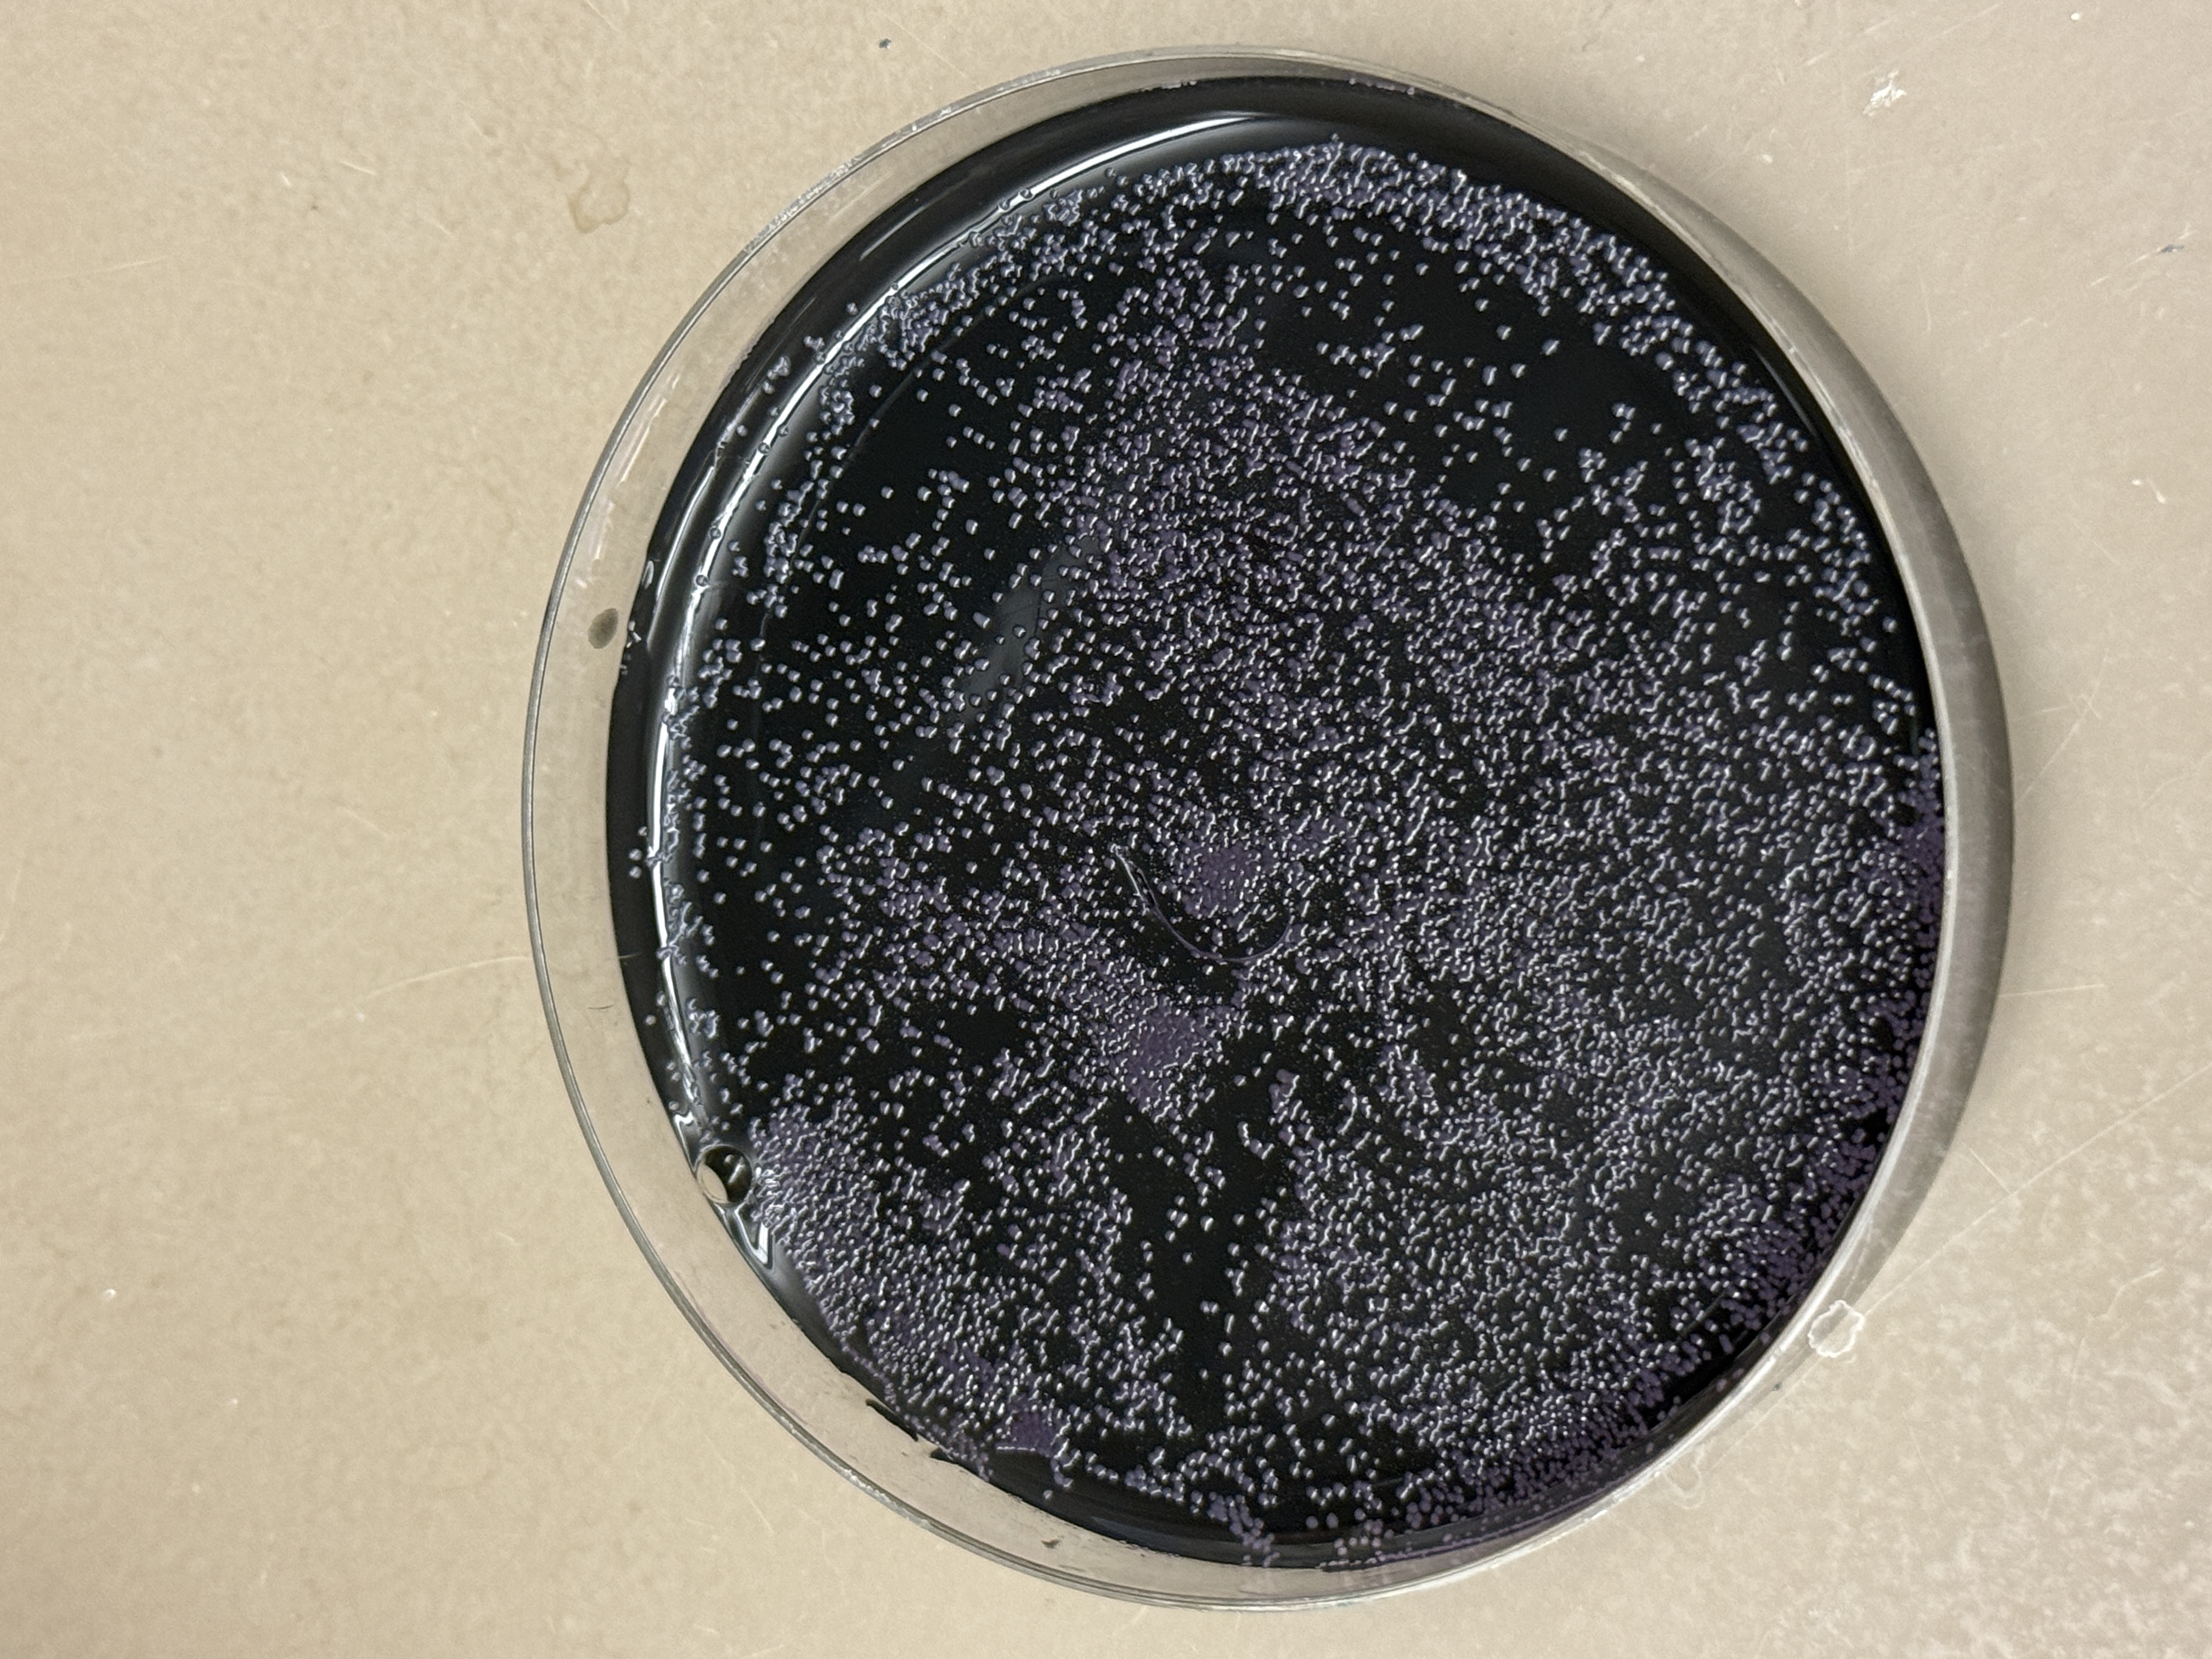
Fig 5. LB + chloramphenicol plate after overnight incubation at 37°C. Extremely dense colony growth confirms successful transformation.
Outcome: Transformation successful
Every visible colony represents a single E. coli cell that incorporated the PosmY-mCherry plasmid and survived chloramphenicol selection.
Colony density: Directly attributable to the high-concentration Twist plasmid stock — more available DNA = higher uptake probability per cell during heat shock.
Sunday, May 10, 2026 (Liquid Culture Inoculation)
Objective: Transfer single colonies from the agar plate into liquid media to grow a large, actively dividing population of transformed bacteria. Two media conditions were prepared in parallel — LB broth (fed/rich) and M9 minimal media (nutrient-poor/starvation) — representing the core experimental contrast of the bio-tamagotchi.
Step 2.1 — Inoculate Culture Tubes
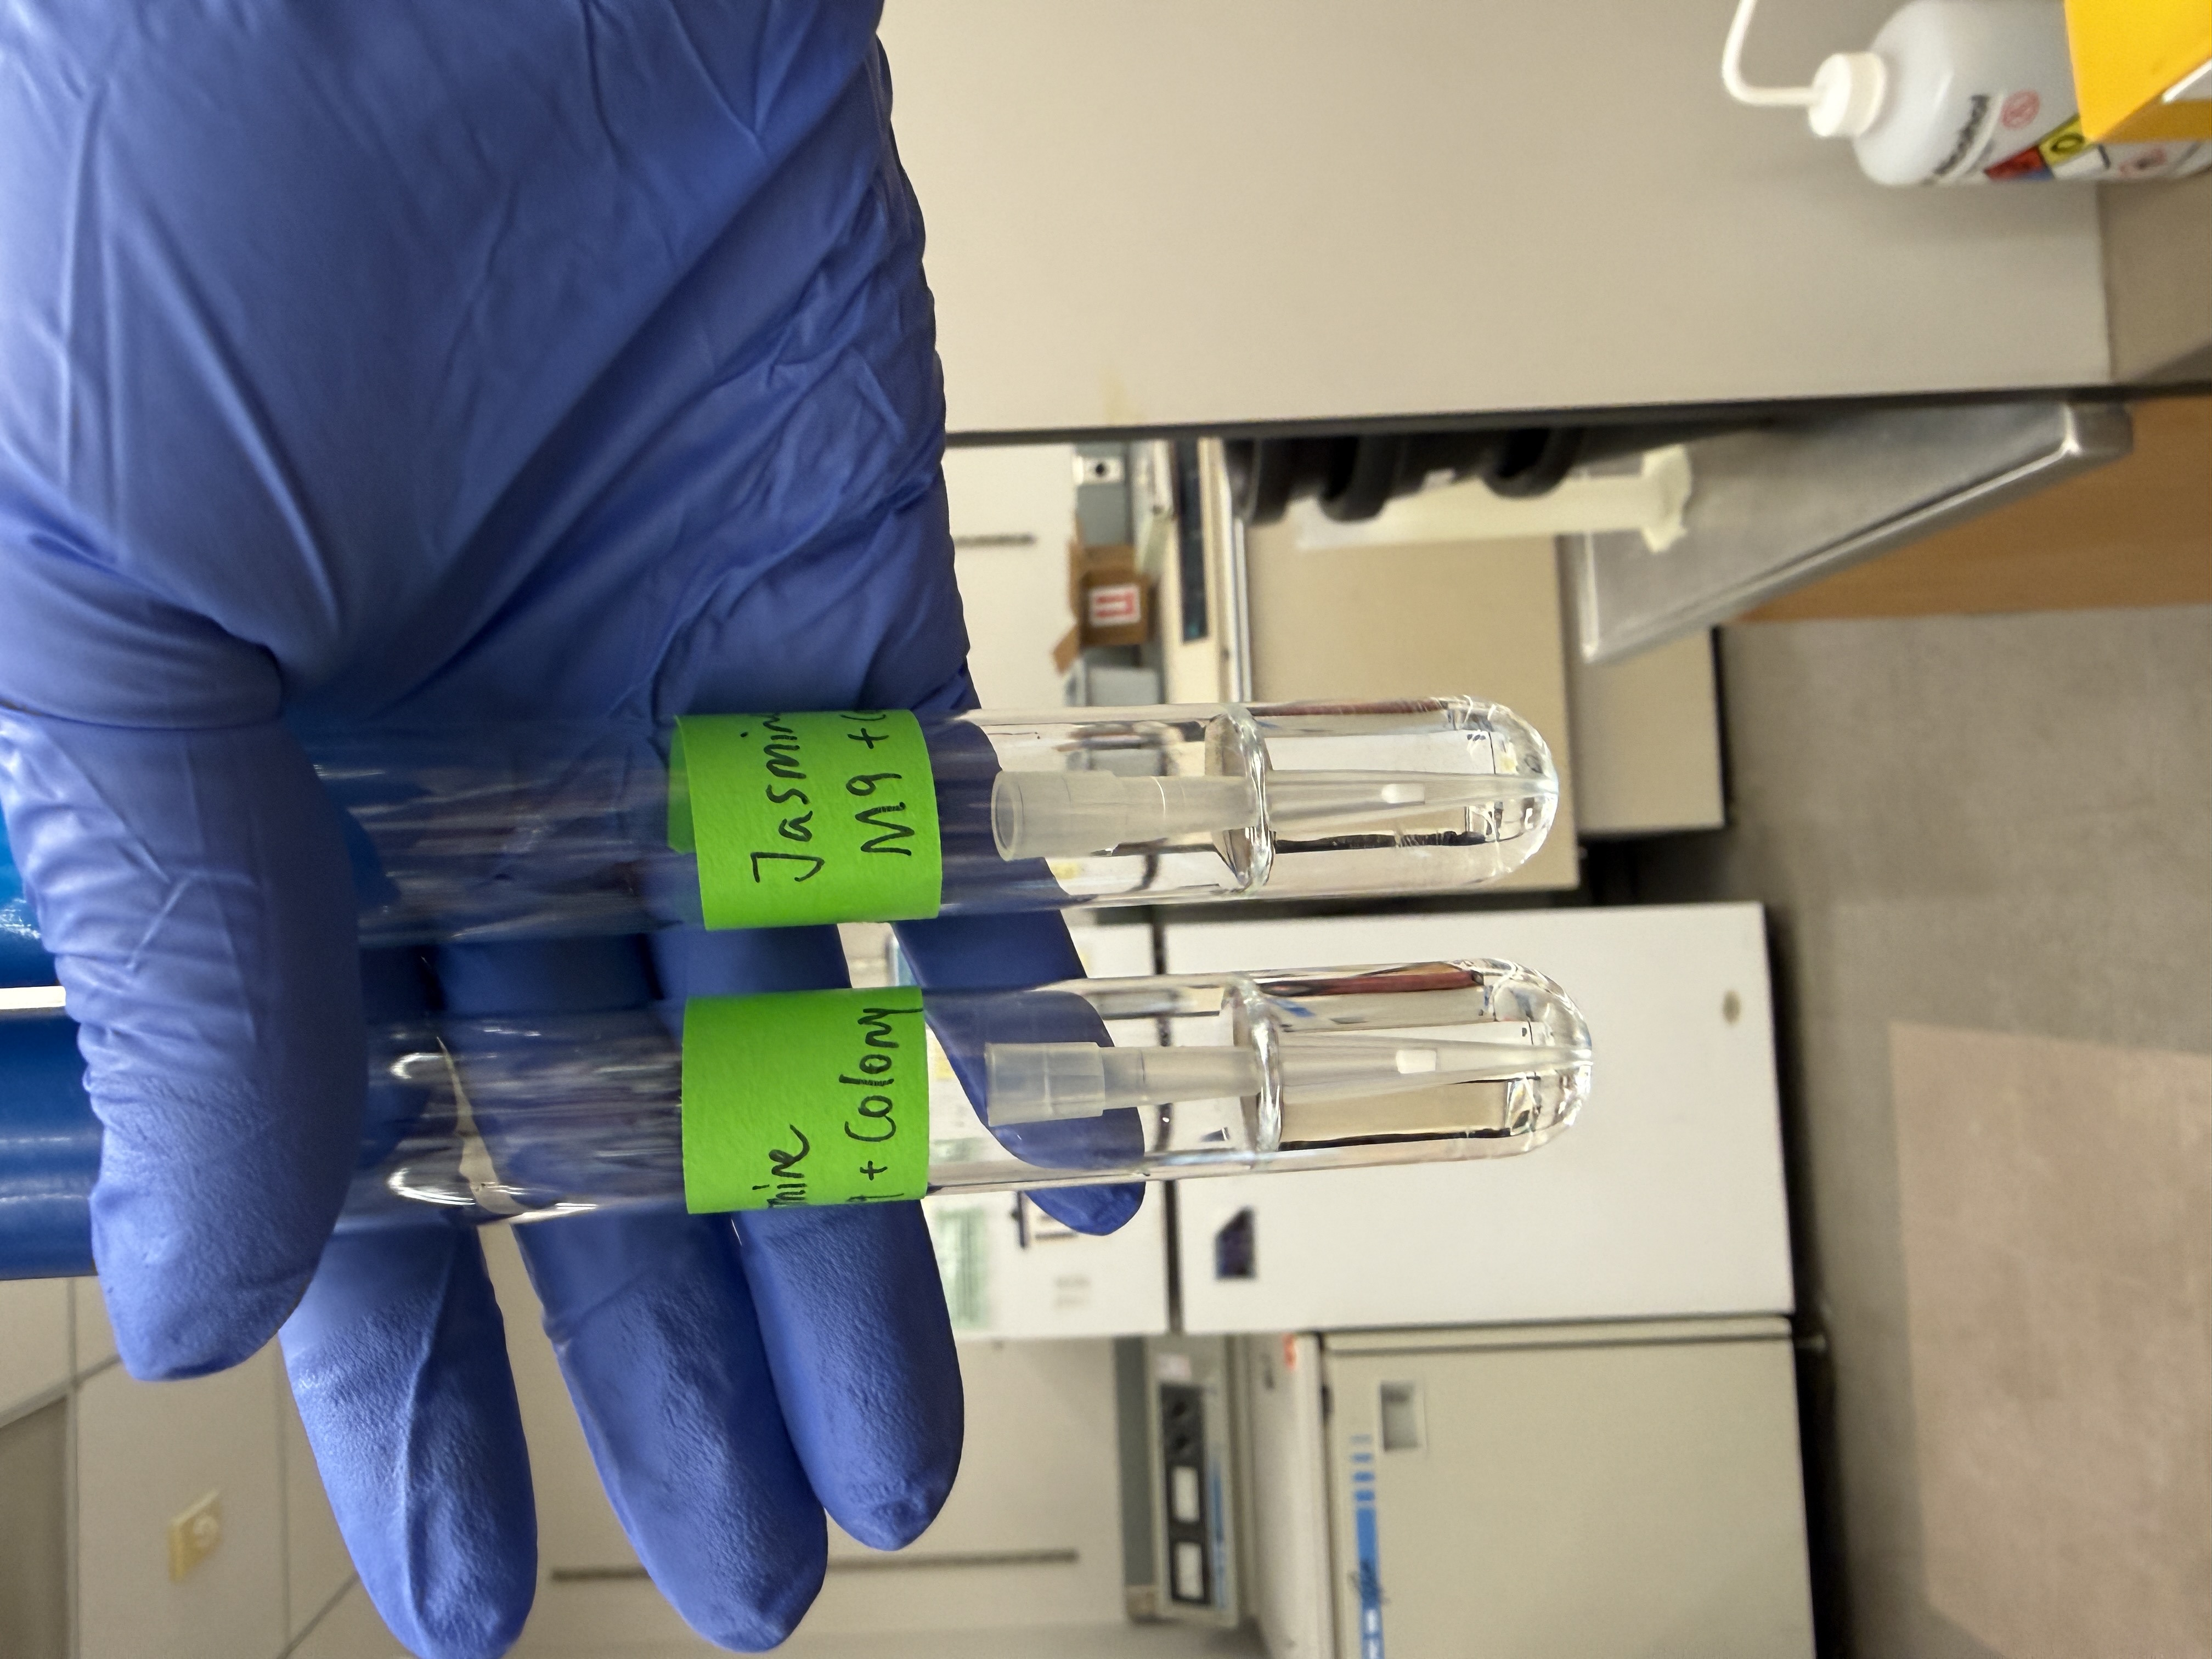
Fig 6. Freshly inoculated culture tubes immediately after colony picking: LB + Chloramphenicol + Colony (left) and M9 + Colony (right), labeled with name and condition. Both tubes are clear at this stage — bacterial growth not yet visible.
Two culture tubes were prepared using premixed LB + Chloramphenicol media (5 mL, provided by TA):
| Tube | Media | Volume | Inoculation |
|---|---|---|---|
| LB + Colony | LB + Chloramphenicol | 2000 µL | Single colony picked from plate |
| M9 + Colony | M9 minimal media | 2000 µL | Single colony picked from plate |
Colony picking method: Touched a single colony on the agar plate with a sterile pipette tip and swirled it directly into the media. A fresh tip was used for each tube. The pipette plunger was not pressed — the tip was used purely as a physical transfer tool.
Step 2.2 — Incubate on Tube Rotator (12+ hours, 37°C)
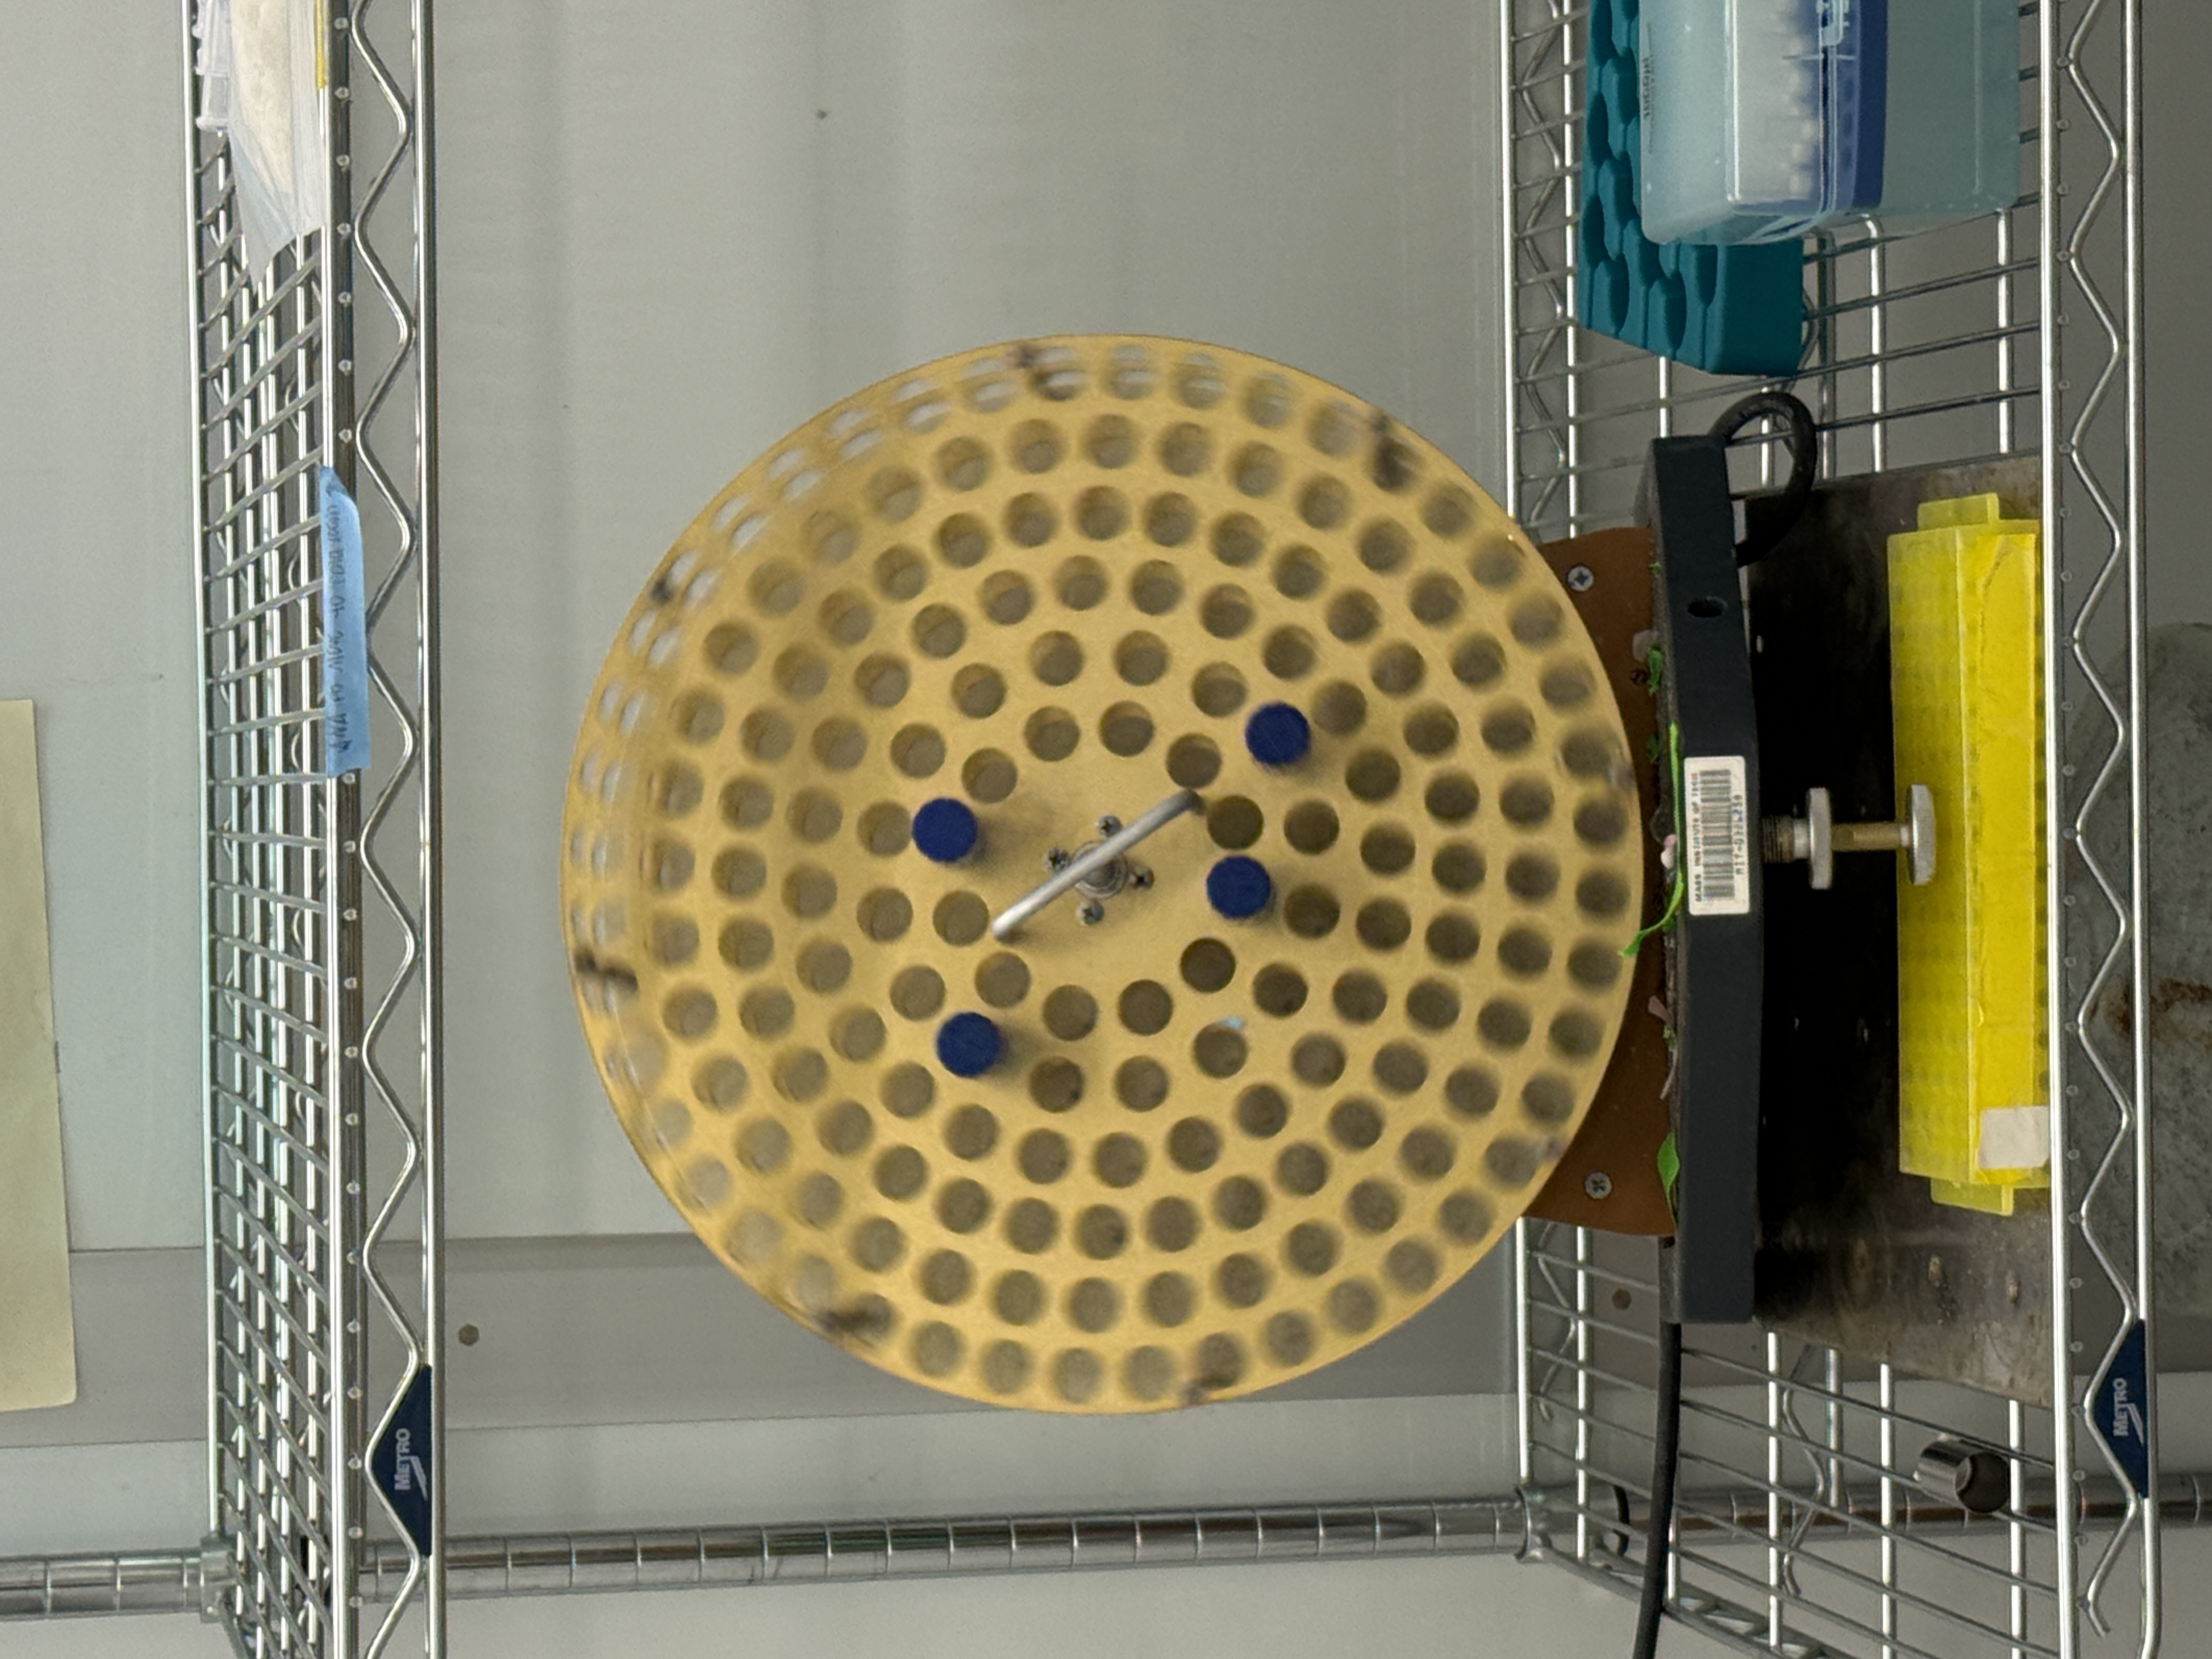
Fig 7. Tube rotator inside the 37°C warm incubator. Culture tubes mounted with caps loosely attached for aeration, rotating end-over-end throughout the incubation period.
- Placed both labeled tubes onto the tube rotator inside the 37°C warm incubator
- Caps kept loosely attached — bacteria require oxygen for growth and mCherry protein production; a sealed cap would cause suffocation
- Rotator kept tubes continuously mixing, ensuring even nutrient distribution and oxygenation
- Incubated for 12+ hours overnight
Why overnight: Initial culture volume (2 mL in 5 mL total tube) was more dilute than standard, requiring additional time to reach sufficient cell density. M9 media is also nutrient-poor by design, meaning bacteria in that tube grow considerably slower than in LB.
Step 2.3 — Assess Growth After Incubation
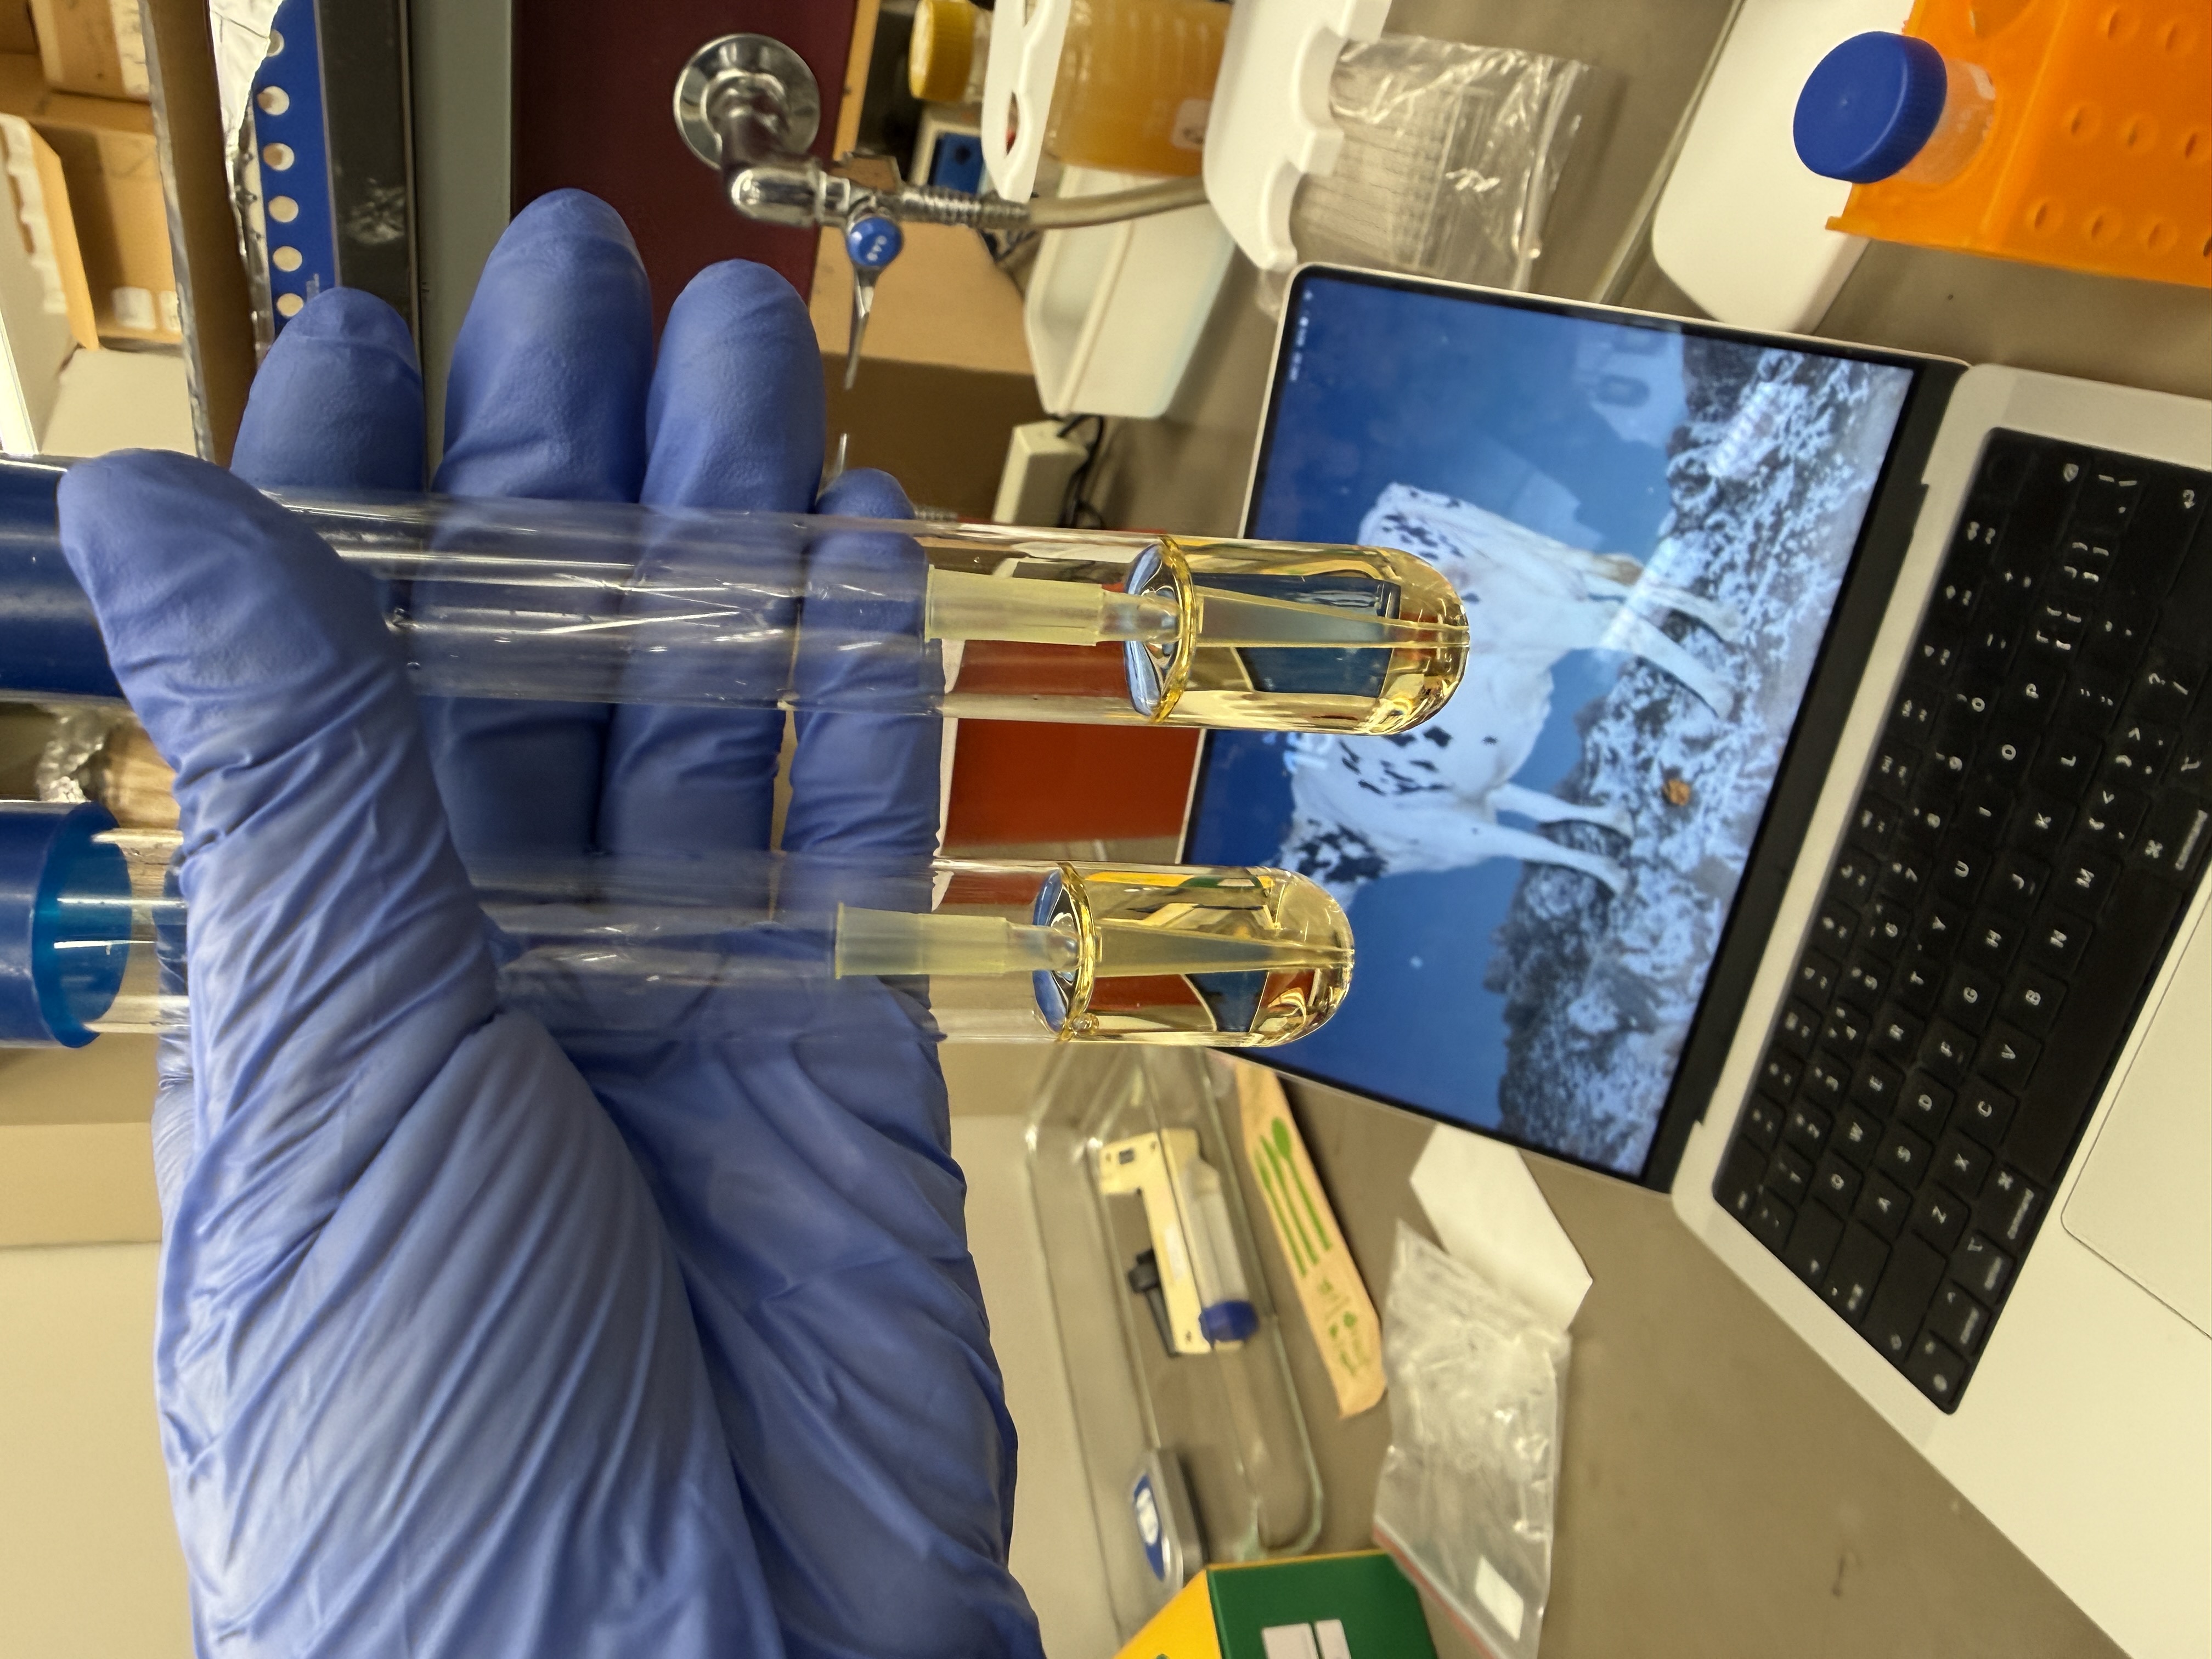
LB + Colony tubes: Visibly turbid with a golden-yellow color — confirms dense bacterial growth
M9 + Colony tube: Remained largely clear after the same incubation period. This is expected — M9 minimal media contains only the bare minimum nutrients, resulting in much slower bacterial growth compared to rich LB. This behavior is inherent to the starvation condition design.
Monday May 11, 2026 (OD600 Measurement, M9 and Stock Prep, 96-well setup)
Objective: Determine cell density of cultures before adding to 96-well plate. Ensures wells receive consistent, measurable cell numbers.
Method: Cultures were too dense to read directly — serial dilutions were made in fresh media, measured, then multiplied by the dilution factor to calculate real OD.
M9 Starvation Preparation — Centrifugation Method
Objective: Create starved bacterial population for the hunger experiment condition. Original M9 cultures failed to grow visibly — alternative starvation method used.
Rationale:
This method is scientifically equivalent or superior to gradual M9 growth — the sudden nutrient switch represents a larger stress signal than slow starvation adaptation.
Step 3.1 — Centrifuge LB Culture
- Transferred 1000 µL from the cloudy LB culture into a 1.5 mL Eppendorf tube
- Centrifuged at 6000 rpm for 2 minutes in the Eppendorf Centrifuge 5415C
- Two tubes processed in parallel — placed opposite each other in the rotor for balance
- After spinning: clear supernatant (LB broth) above a small pellet of bacterial cells at the bottom
Step 3.2 — Observe Pink Pellet: Key Qualitative Result
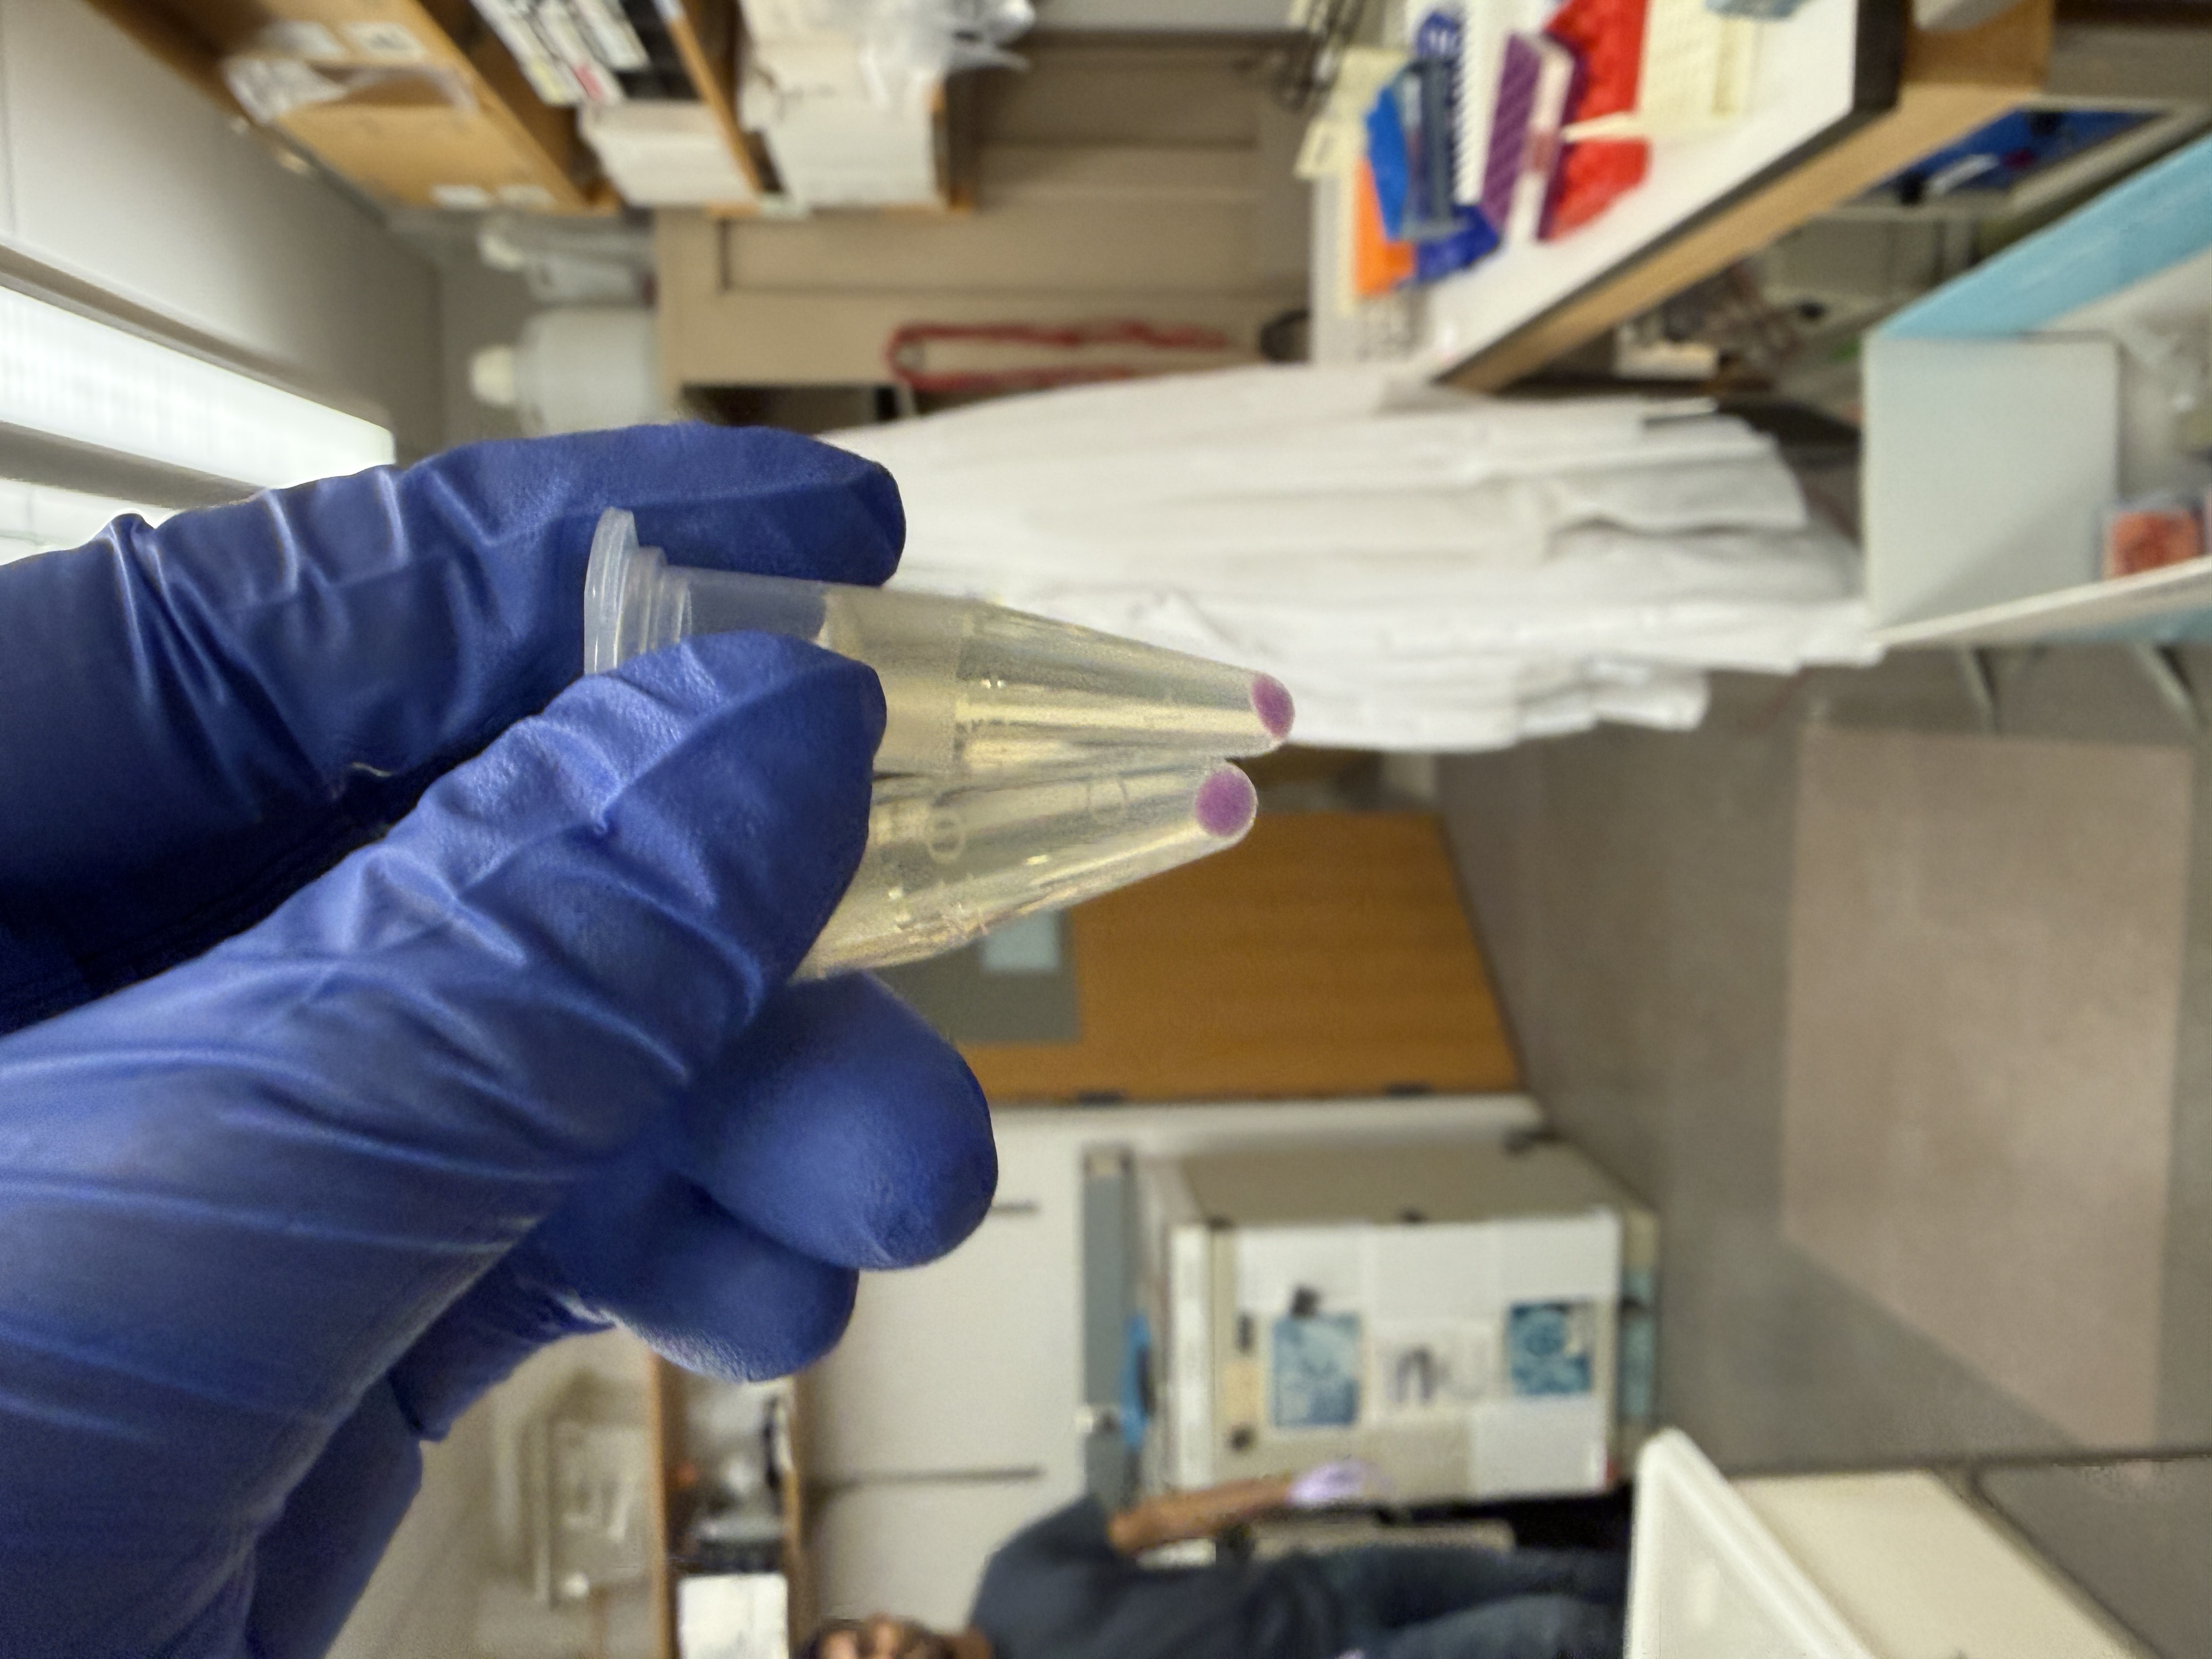
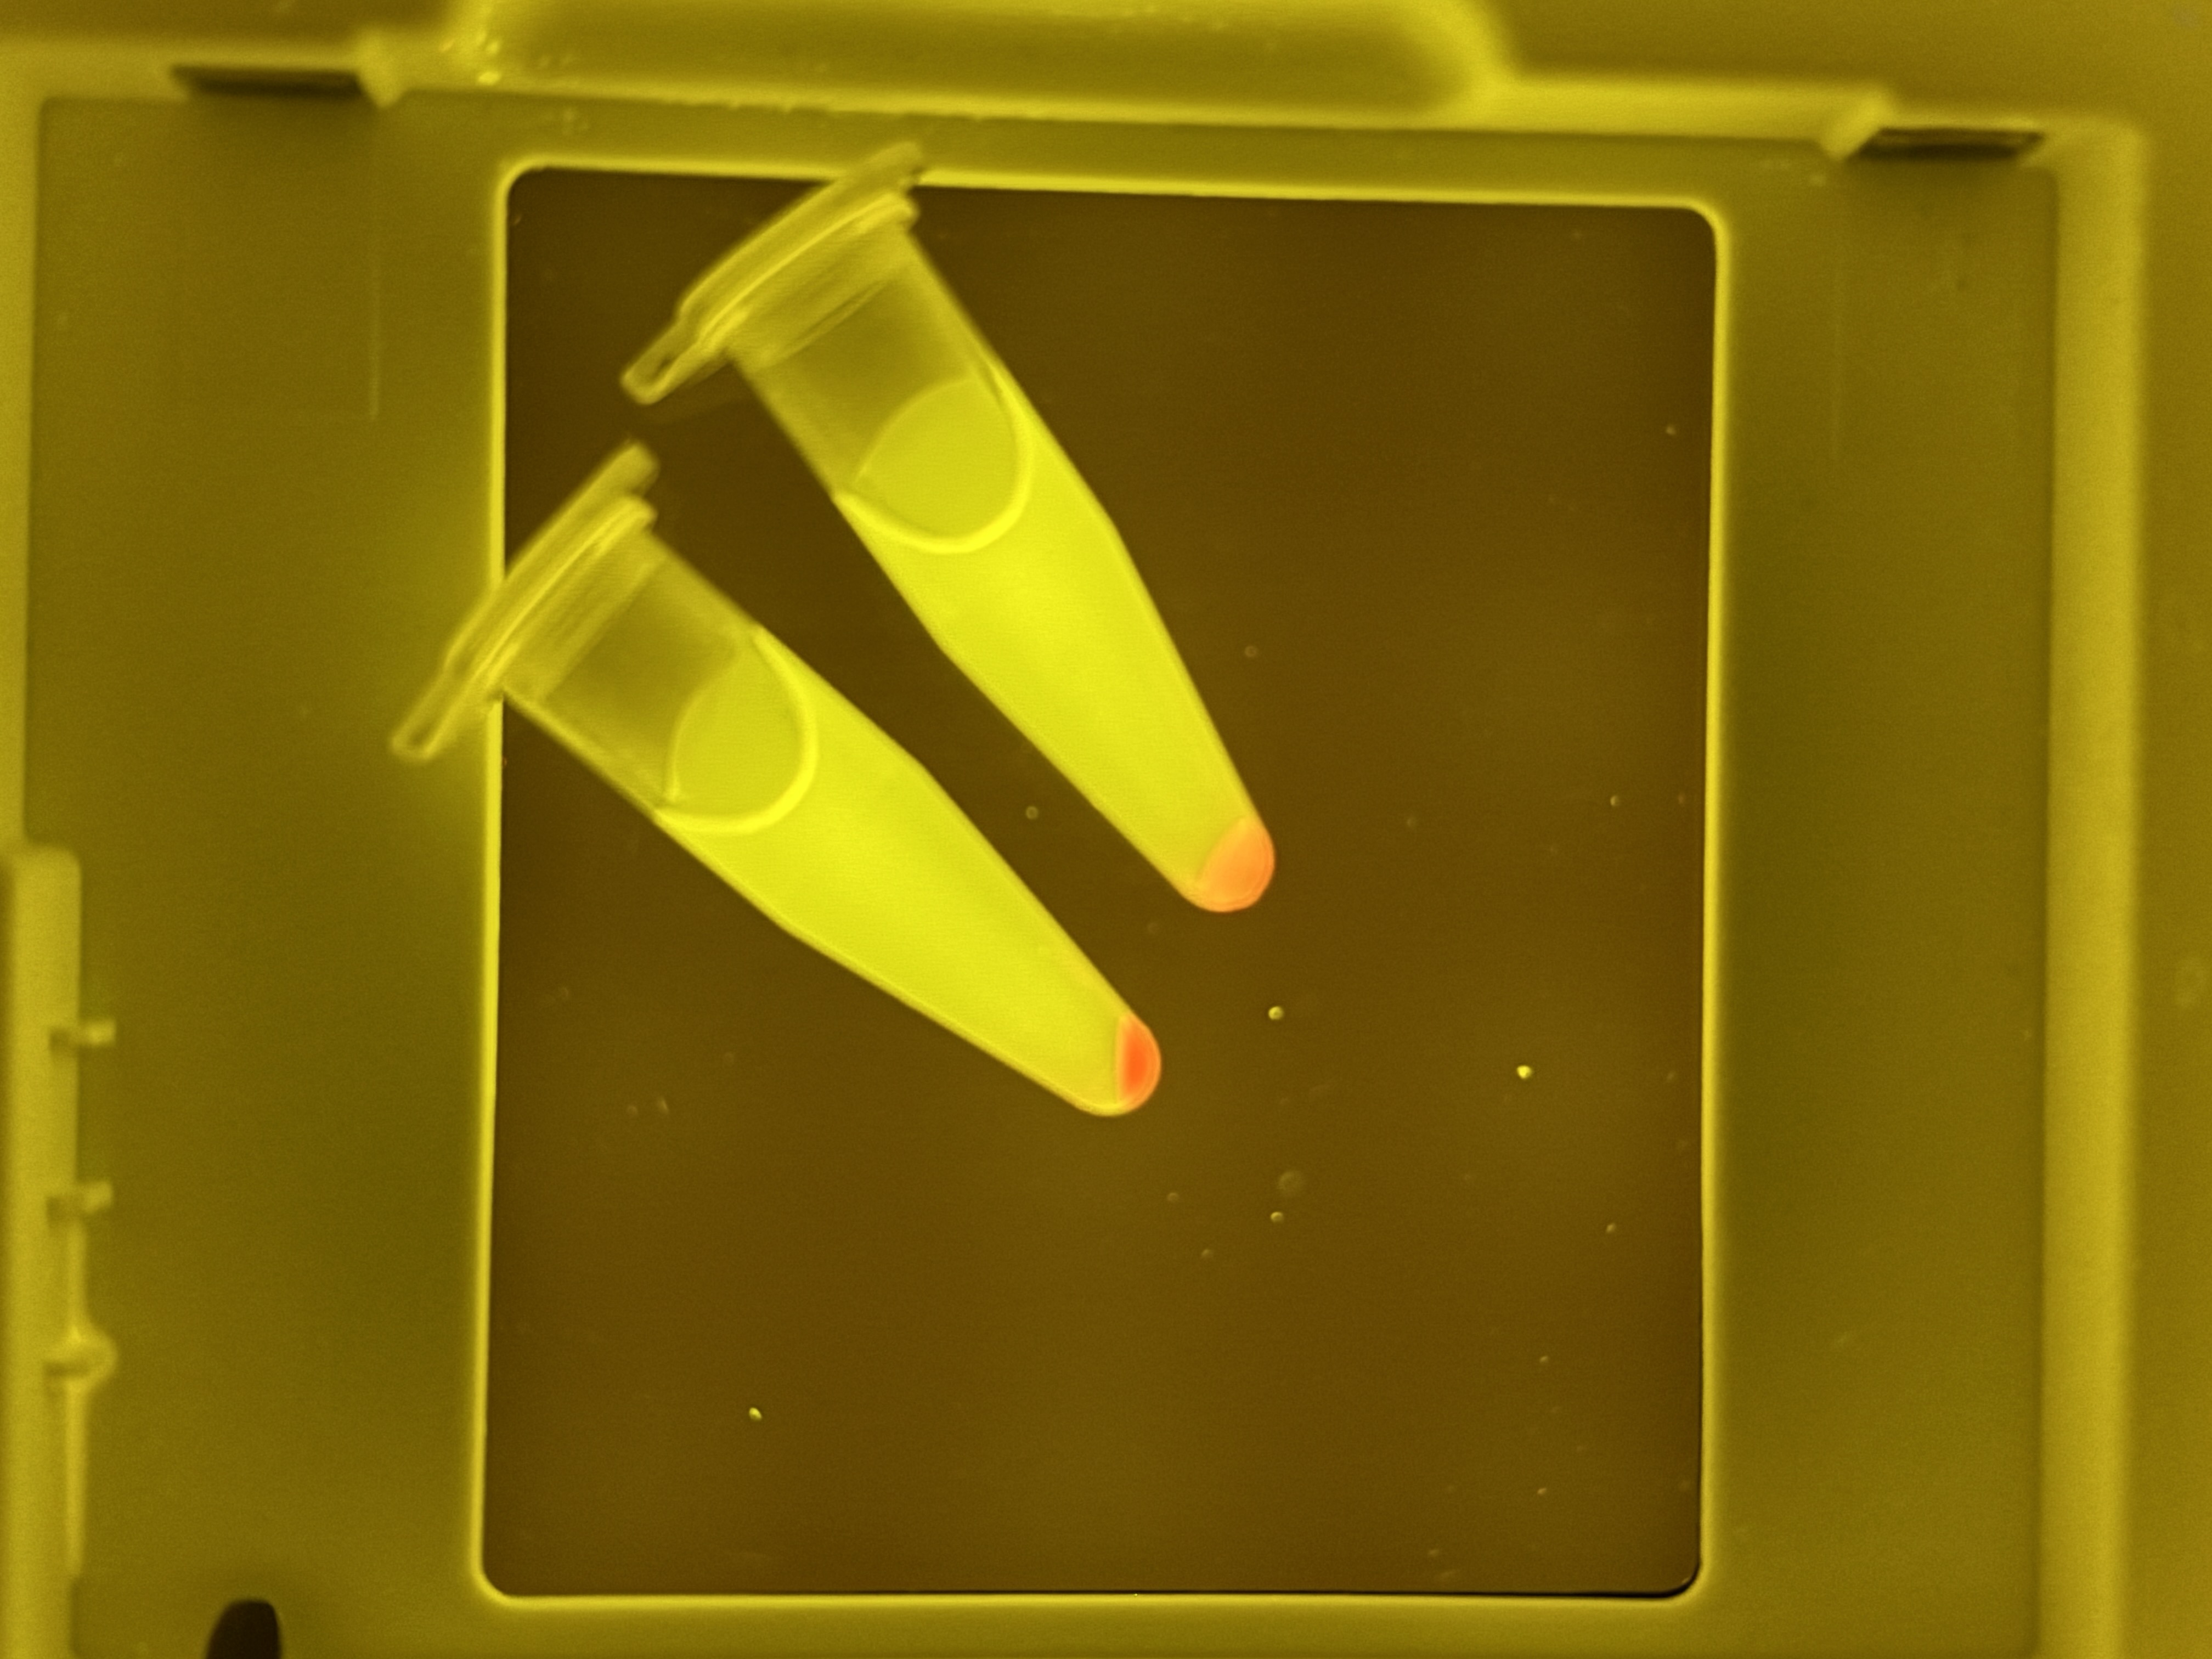
Fig 11 (left). Two Eppendorf tubes under ambient light after centrifugation of LB culture — pink/purple bacterial pellets visible at the base of each tube, confirming mCherry protein accumulation inside cells.
Fig 12 (right). Same two tubes viewed under blue light transilluminator — pellets emit a vivid orange-red fluorescence, directly visualising mCherry fluorescent protein under excitation light.
This is the most significant qualitative result of the entire experiment. The pink/red colour of the pellet — visible to the naked eye and strongly fluorescent under blue light — confirms:
- PosmY promoter is actively driving mCherry transcription
- mCherry protein is being produced and folding correctly into its fluorescent conformation
- The construct design is functional end-to-end
Even bacteria growing in nutrient-rich LB show baseline mCherry expression, consistent with mild stationary-phase stress activating the PosmY promoter at low levels after overnight growth.
Step 3.3 — Wash with M9 (Remove Residual LB Nutrients)
- Carefully removed ~950 µL of supernatant (LB broth) using P1000, leaving pellet intact
- Added 500 µL plain M9 media directly to the pellet
- Flicked tube gently until pellet fully resuspended — liquid appeared visibly cloudy and pink
- Centrifuged again at 6000 rpm for 2 minutes
- Removed supernatant again — discarded
Purpose of wash: Residual LB nutrients in the tube would partially satisfy the bacteria, blunting the starvation signal and reducing PosmY activation. Washing ensures a clean switch to minimal media conditions.
Step 3.4 — Resuspend in M9 Minimal Media
- Added 500 µL plain M9 media (no chloramphenicol — see note) to the washed pellet
- Flicked until uniformly cloudy and pink
- This pink M9 suspension is the starved/hungry cell stock used for Row F of the 96-well plate
Readings
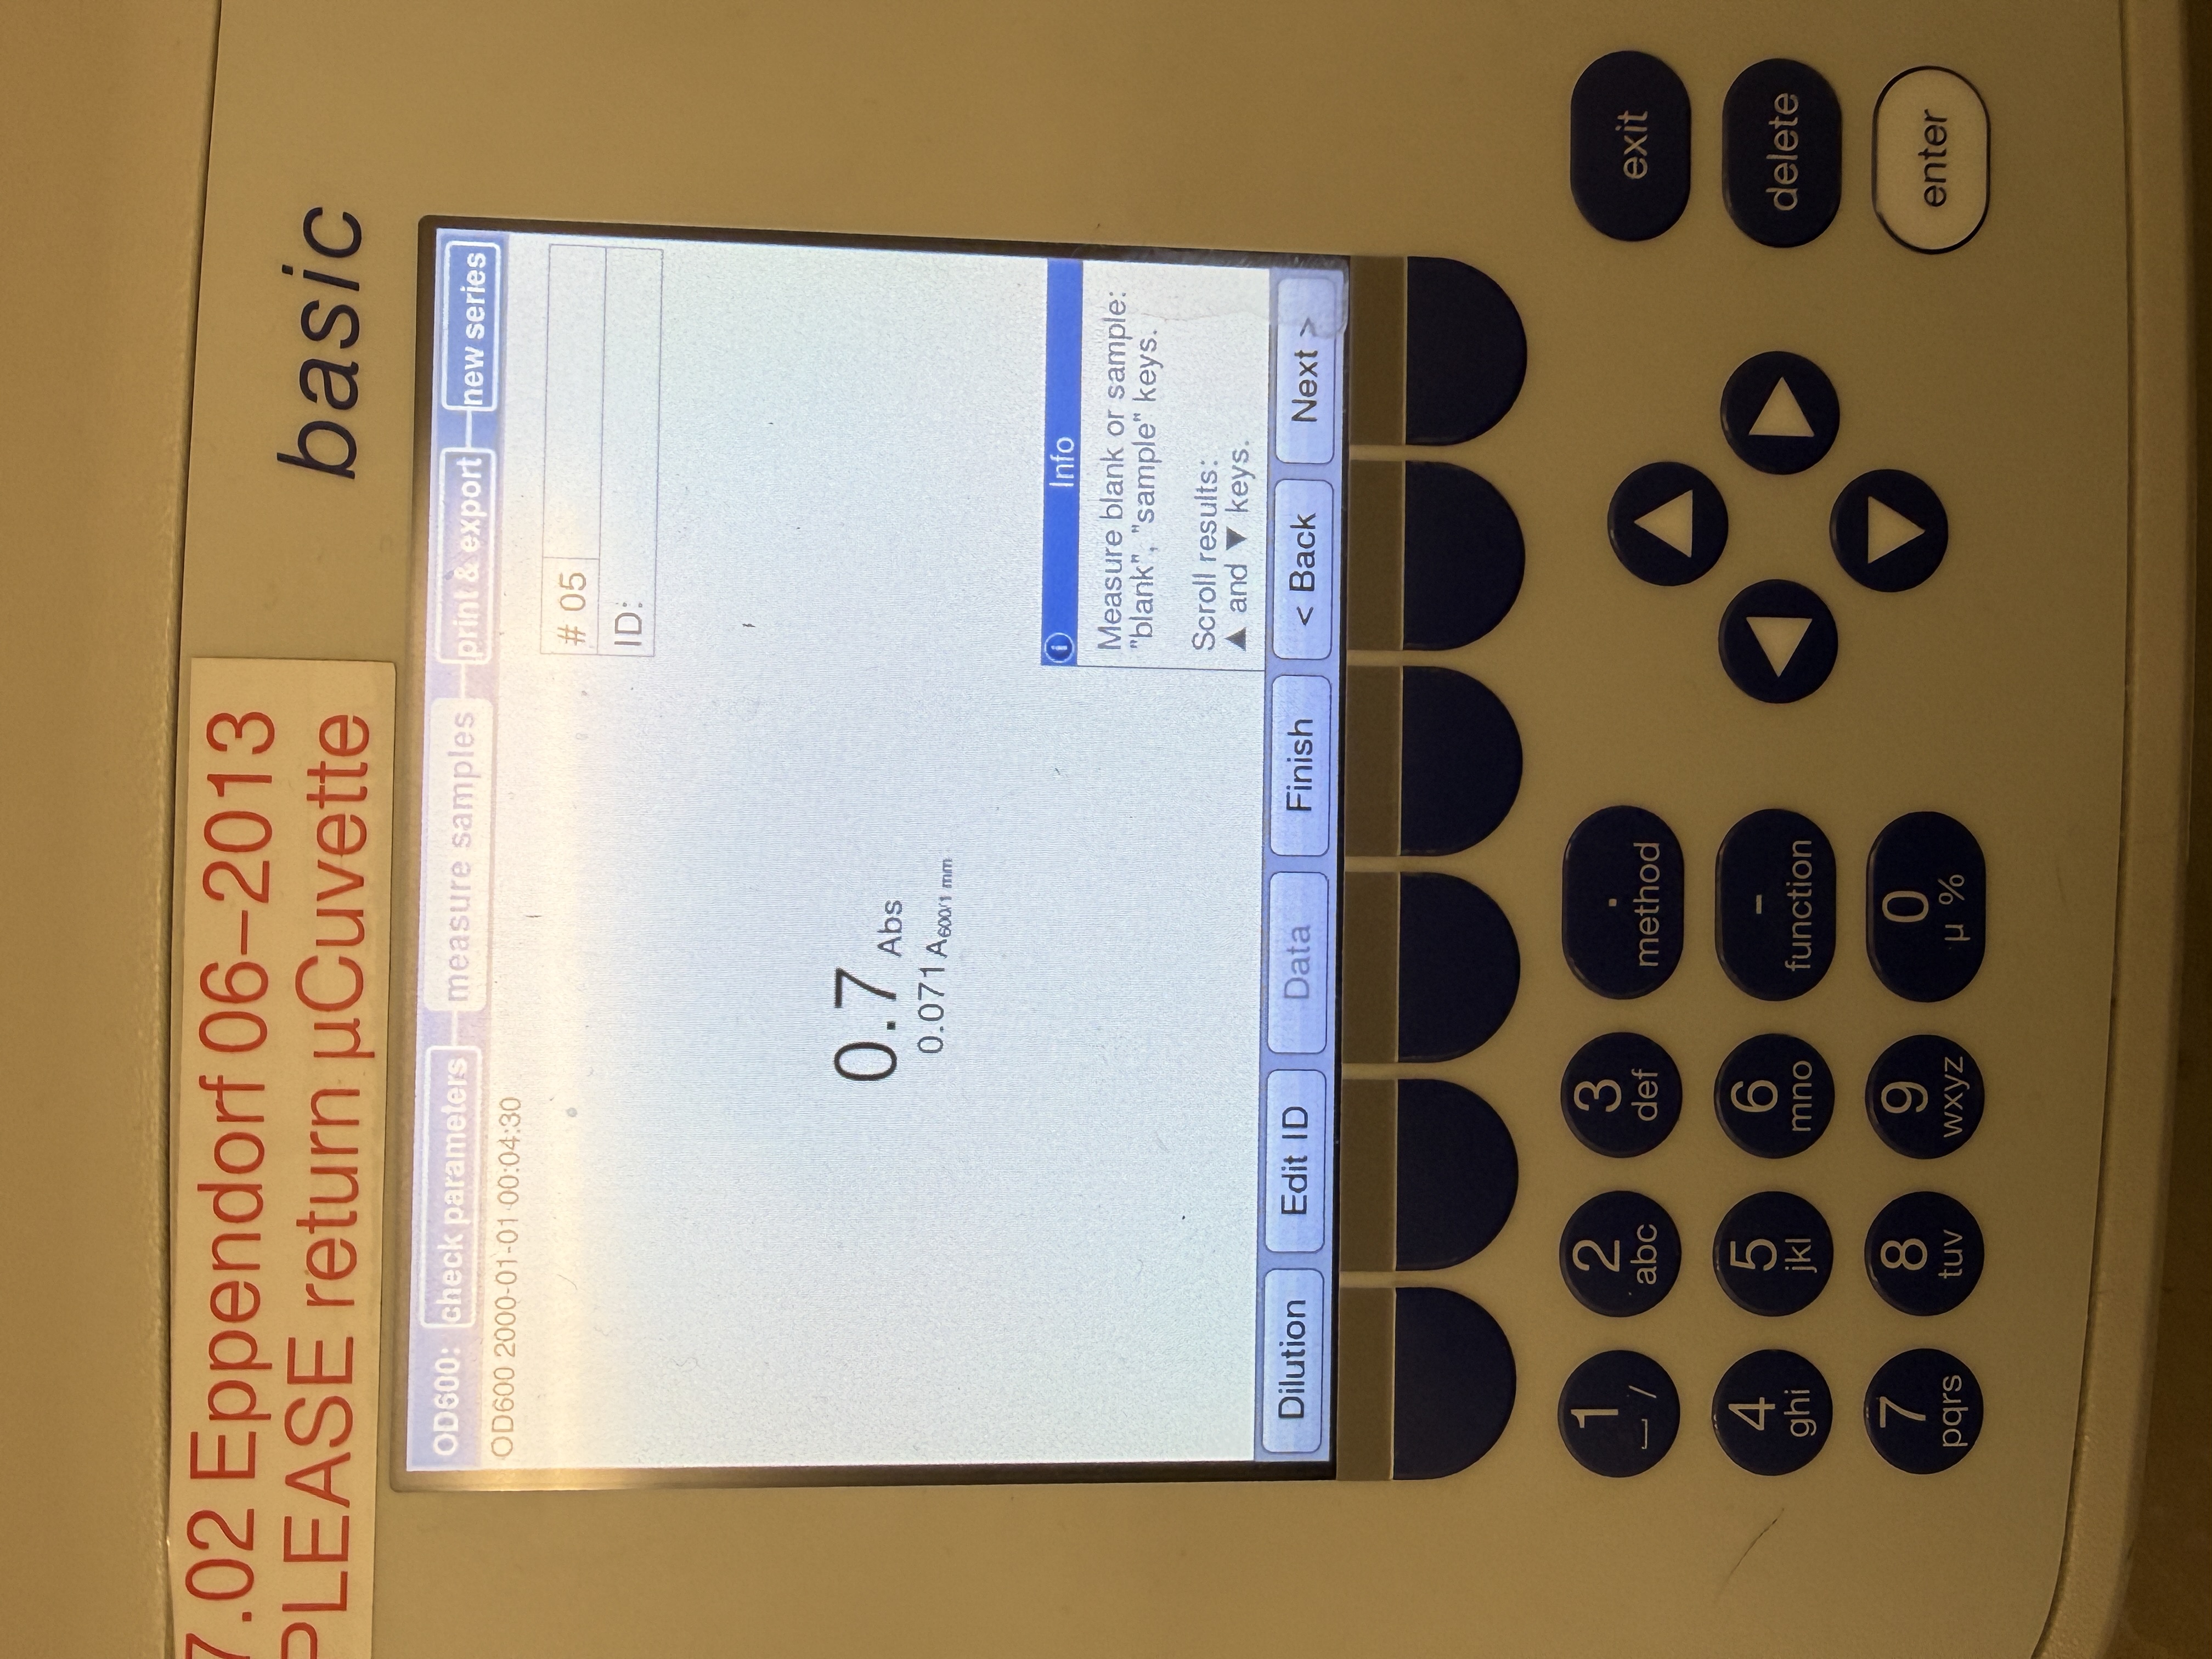 |  |
|---|---|
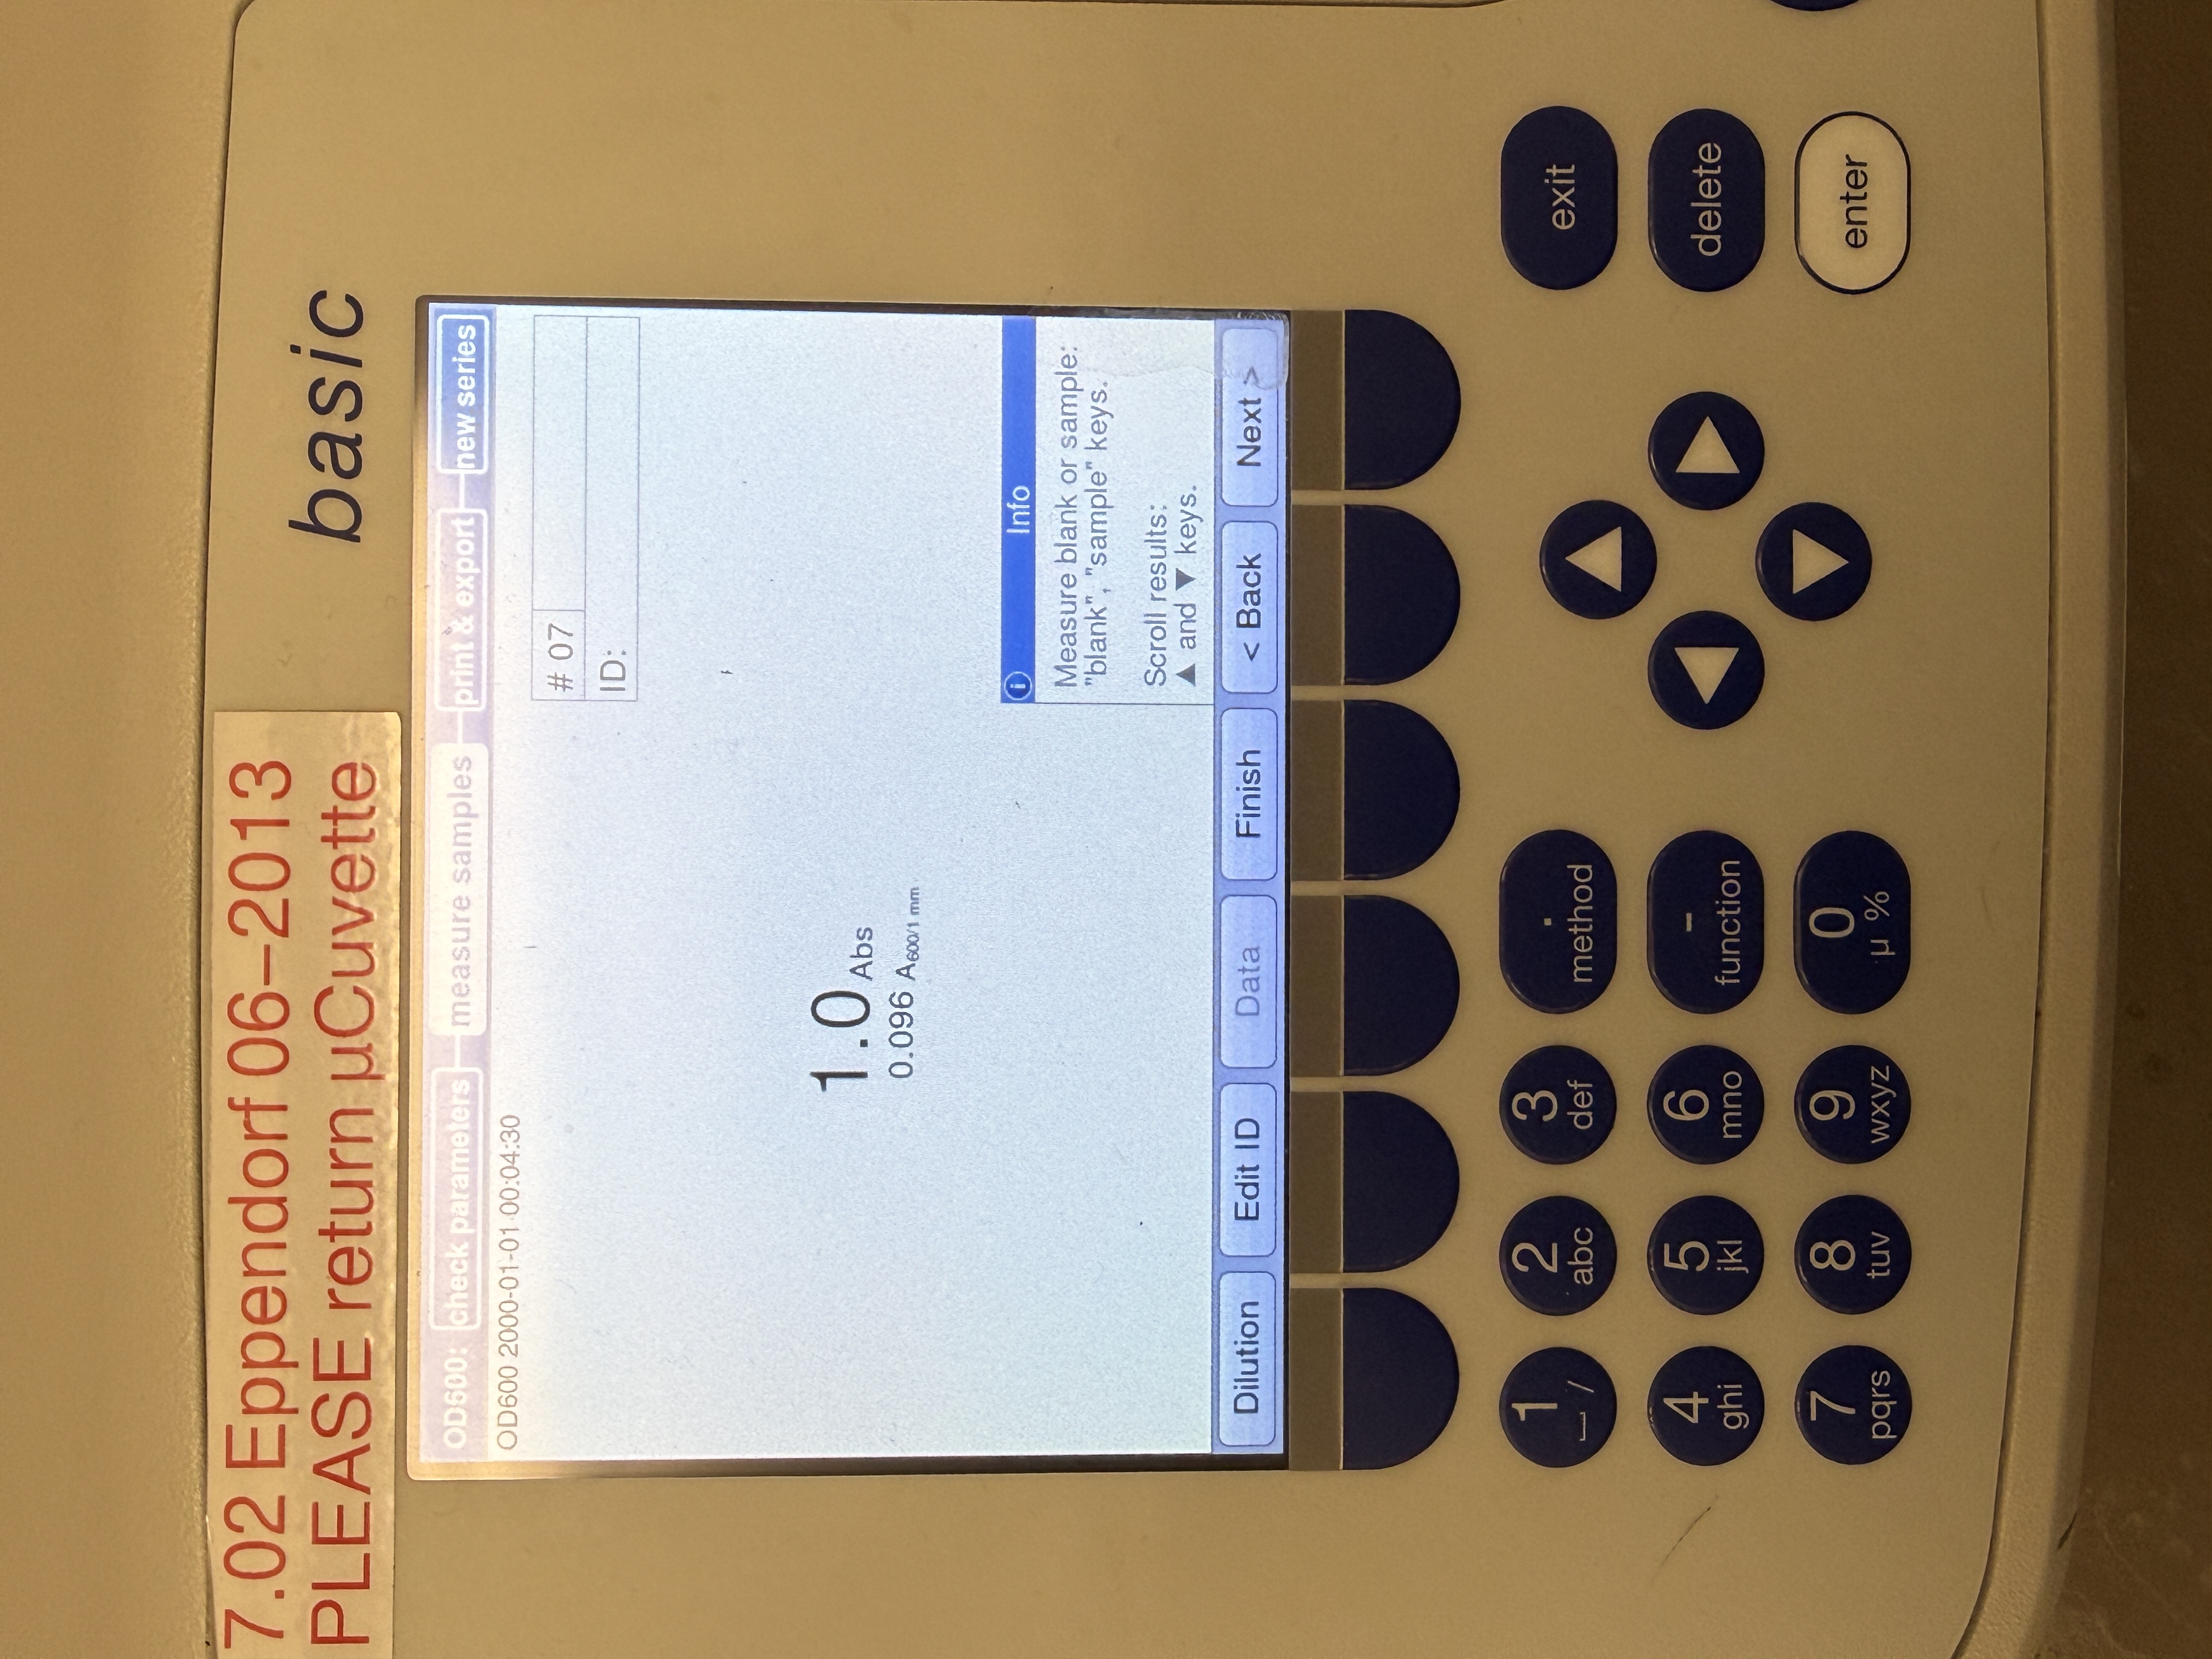
| Fig 9. OD600 reading for LB + Colony culture at 1:1000 dilution. Raw absorbance = 0.7 Abs | Fig 10. OD600 reading for M9 + Colony cells at 1:100 dilution. Raw absorbance = 1.0 Abs |
Results Summary
| Culture | Dilution used | Instrument reading | Estimated real OD | Interpretation |
|---|---|---|---|---|
| LB + Colony | 1:1000 (10 µL into 990 µL LB) | 0.7 Abs | ~700 | Extremely overgrown |
| M9 cells (post-spin) | 1:100 (10 µL into 990 µL M9) | 1.0 Abs | ~100 | Extremely overgrown |
Both cultures were far above the usable range of OD 0.4–0.6, confirming that significant dilution was required before use in the 96-well plate.
Action taken: Both cultures were diluted 1:100 in fresh media to prepare working stocks for the plate assay:
| Working stock | From | Into | Final volume |
|---|---|---|---|
| LB working stock | 10 µL LB culture | 990 µL plain LB | 1000 µL |
| M9 working stock | 10 µL M9 cells | 990 µL plain M9 | 1000 µL |
The plate reader independently measures OD600 for each well during the assay read, so the normalization formula (RFU ÷ OD600) corrects for any remaining cell density variation between wells.
NaCl Solution Preparation
Objective: Prepare osmotic stress solutions for validation conditions (Rows B and C).
Starting material: 5M NaCl aqueous solution (lab stock)
| Solution | 5M NaCl stock | Sterile water | Final volume | Concentration |
|---|---|---|---|---|
| Low stress | 60 µL | 940 µL | 1000 µL | 0.3M |
| High stress | 100 µL | 900 µL | 1000 µL | 0.5M |
Verification:
Stored in labeled Eppendorf tubes on bench until plate setup.
96-Well Plate Setup
Plate Layout:
Exact Volumes Per Row:
| Row | Condition | Role | Component 1 | Component 2 | Component 3 | Total |
|---|---|---|---|---|---|---|
| A | Uninduced | Validation control | 150 µL LB+Chlor | 50 µL LB cells | — | 200 µL |
| B | 0.3M NaCl | Validation low stress | 100 µL LB+Chlor | 50 µL 0.3M NaCl | 50 µL LB cells | 200 µL |
| C | 0.5M NaCl | Validation high stress | 100 µL LB+Chlor | 50 µL 0.5M NaCl | 50 µL LB cells | 200 µL |
| D | LB blank | Background subtraction | 200 µL plain LB | — | — | 200 µL |
| E | Fed cells | Experiment control | 150 µL LB+Chlor | 50 µL LB cells | — | 200 µL |
| F | Starved cells | Experiment condition | 150 µL plain M9 | 50 µL M9 pink cells | — | 200 µL |
| G | M9 blank | Background subtraction | 200 µL plain M9 | — | — | 200 µL |
Addition order for all wells: Media first → NaCl (if applicable) → cells last
Total wells filled: 21 of 96
Plate Incubation (Monday May 11, 2026 → Tuesday May 12, 2026)
Objective: Allow bacteria to sense their environment, activate PosmY, produce and fold mCherry protein to detectable levels.
Conditions: 30°C overnight (~12 hours)
Tuesday, May 12, 2026 (Plate Reader Measurement)
Instrument: BioTek Synergy · Software: Gen5 3.05
Read protocol configured:
| Read | Type | Parameters |
|---|---|---|
| Read 1 | Absorbance | 600 nm (OD600) |
| Read 2 | Emission spectrum scan | Ex 587 nm / Em spectrum |
| Read 3 | Fluorescence endpoint | Ex 587 nm / Em 618 nm |
Raw Plate Reader Outputs
Output A: OD600 — Cell Density
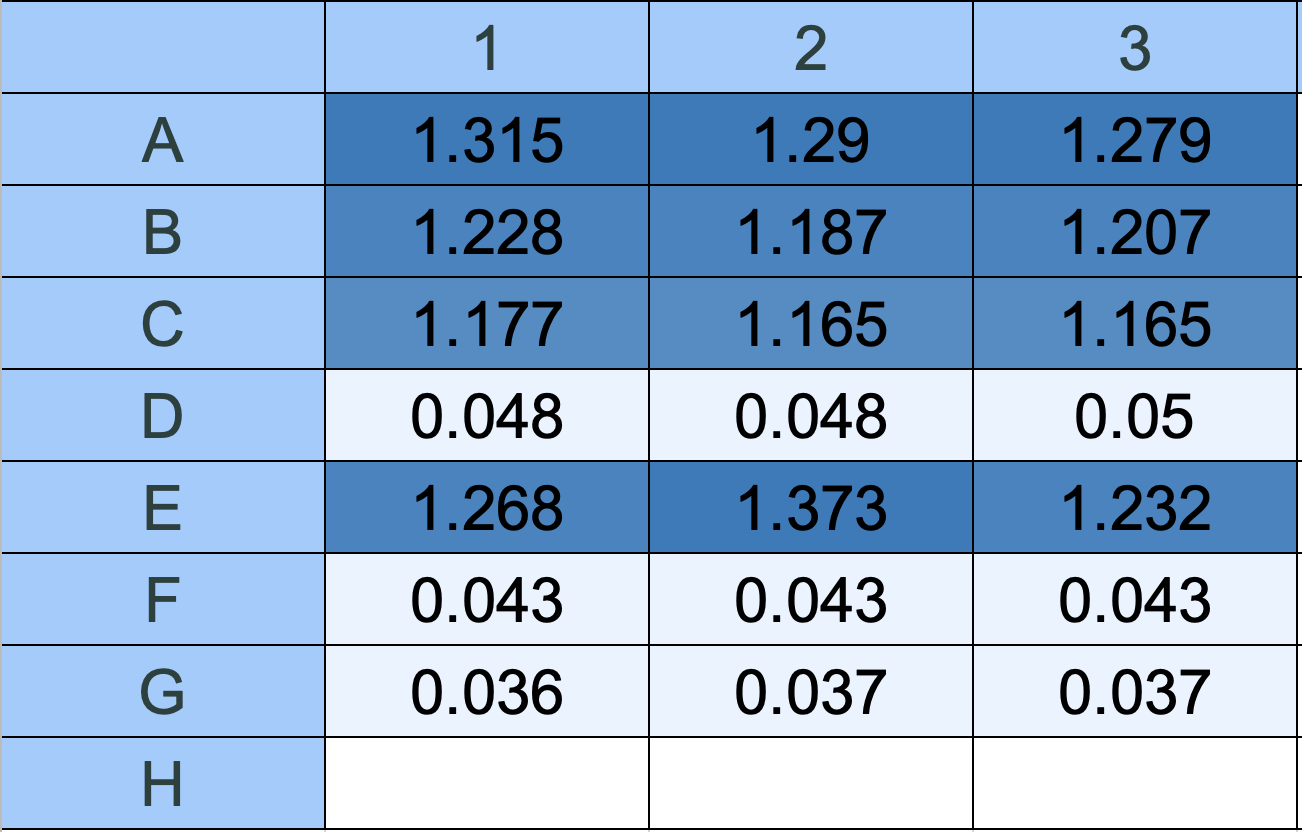
Fig 13. Gen5 matrix: OD600 absorbance values (Read 1:600). Dark blue = high cell density. Light blue/white = low cell density. Row F (Starved M9) = 0.043 — barely above the M9 blank (Row G = 0.037), indicating very few cells present in the starved wells after 1:100 dilution.
Raw OD600 values:
| Row | Condition | Well 1 | Well 2 | Well 3 | Mean | SD |
|---|---|---|---|---|---|---|
| A | Uninduced LB | 1.315 | 1.290 | 1.279 | 1.295 | 0.019 |
| B | 0.3M NaCl | 1.228 | 1.187 | 1.207 | 1.207 | 0.021 |
| C | 0.5M NaCl | 1.177 | 1.165 | 1.165 | 1.169 | 0.007 |
| D | LB blank | 0.048 | 0.048 | 0.050 | 0.049 | 0.001 |
| E | Fed LB | 1.268 | 1.373 | 1.232 | 1.291 | 0.073 |
| F | Starved M9 | 0.043 | 0.043 | 0.043 | 0.043 | 0.000 |
| G | M9 blank | 0.036 | 0.037 | 0.037 | 0.037 | 0.001 |
Absorbance at OD600 basically is the cell density and how cloudy it is, because I need to know whether one well glows more because it has more cells or because each cell is genuinely expressing more mCherry.
Output B: Emission Spectrum — Visual Curves
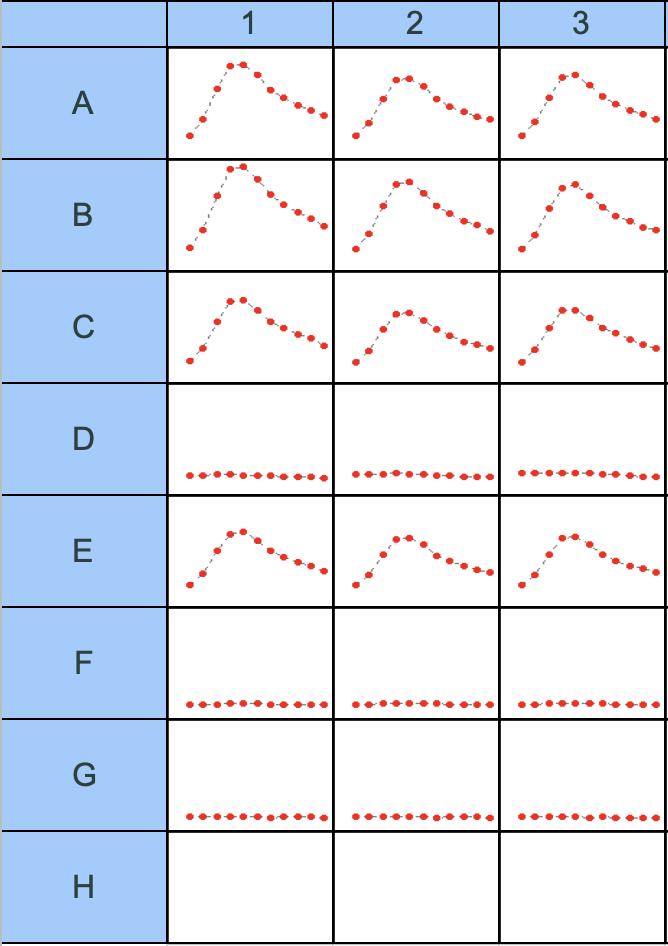
Fig 14. Gen5 emission spectrum matrix (Read 2: EM Spectrum — curve view). Mountain-shaped red curves = mCherry fluorescence peak. Flat dot lines = near-zero fluorescence. Rows A, B, C, E show clear peaks; Rows D, F, G are flat.
Emission spectrum scan is the machine shines a fixed wavelength, and then sweeps across a range of emission wavelengths and records how much light comes out at each one to get a full spectrum.
Output C: Emission Spectrum — Read #1 Values
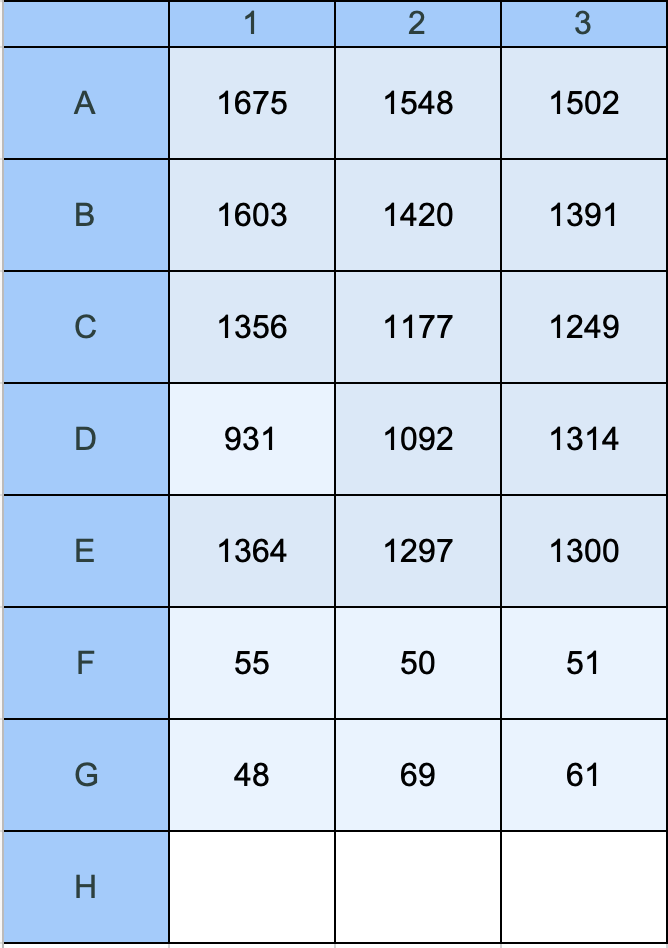
Fig 15. Gen5 matrix: first wavelength read values from the EM spectrum scan (Read 2: EM Spectrum Read#1). These are the fluorescence intensity values at the first emission wavelength measured during the spectral scan.
Raw EM Spectrum Read#1 values:
| Row | Condition | Well 1 | Well 2 | Well 3 | Mean | SD |
|---|---|---|---|---|---|---|
| A | Uninduced LB | 1675 | 1548 | 1502 | 1575 | 90 |
| B | 0.3M NaCl | 1603 | 1420 | 1391 | 1471 | 115 |
| C | 0.5M NaCl | 1356 | 1177 | 1249 | 1261 | 90 |
| D | LB blank | 931 | 1092 | 1314 | 1112 | 193 |
| E | Fed LB | 1364 | 1297 | 1300 | 1320 | 38 |
| F | Starved M9 | 55 | 50 | 51 | 52 | 3 |
| G | M9 blank | 48 | 69 | 61 | 59 | 11 |
Output D: Fluorescence Endpoint (Ex 587 / Em 618 nm)
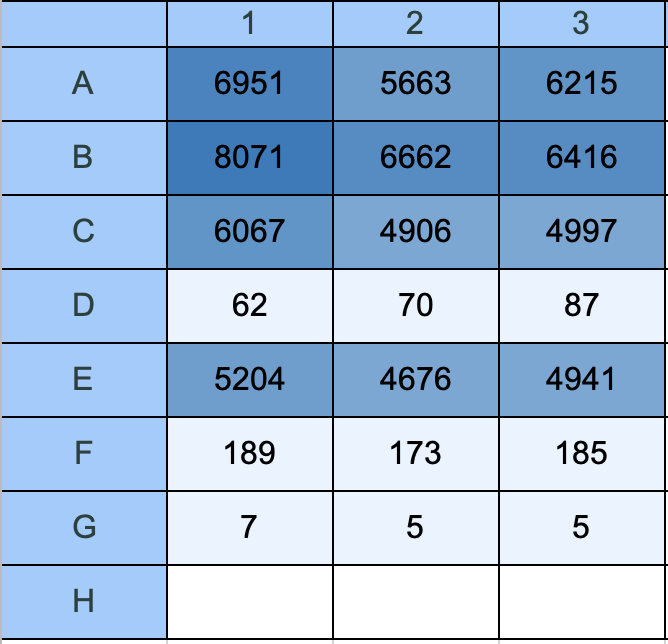
Fig 16. Gen5 matrix: raw fluorescence endpoint values in RFU (Read 3: Ex 587 / Em 618 nm). Darker blue = higher mCherry fluorescence. Rows A, B, C, E show strong signal. Rows D, F, G show near-background values.
Raw RFU endpoint values:
| Row | Condition | Well 1 | Well 2 | Well 3 | Mean | SD |
|---|---|---|---|---|---|---|
| A | Uninduced LB | 6951 | 5663 | 6215 | 6276 | 648 |
| B | 0.3M NaCl | 8071 | 6662 | 6416 | 7050 | 893 |
| C | 0.5M NaCl | 6067 | 4906 | 4997 | 5323 | 643 |
| D | LB blank | 62 | 70 | 87 | 73 | 13 |
| E | Fed LB | 5204 | 4676 | 4941 | 4940 | 264 |
| F | Starved M9 | 189 | 173 | 185 | 182 | 8 |
| G | M9 blank | 7 | 5 | 5 | 6 | 1 |
Florescence endpoint is just shining a fixed wavelength and then take a specific emission wavelength, tells me the relative florescence unit. Higher RFU = more mCherry protein present = PosmY promoter was more active = stronger stress/hunger signal detected by the cell.
Output E: Mean Max RFU from EM Spectrum
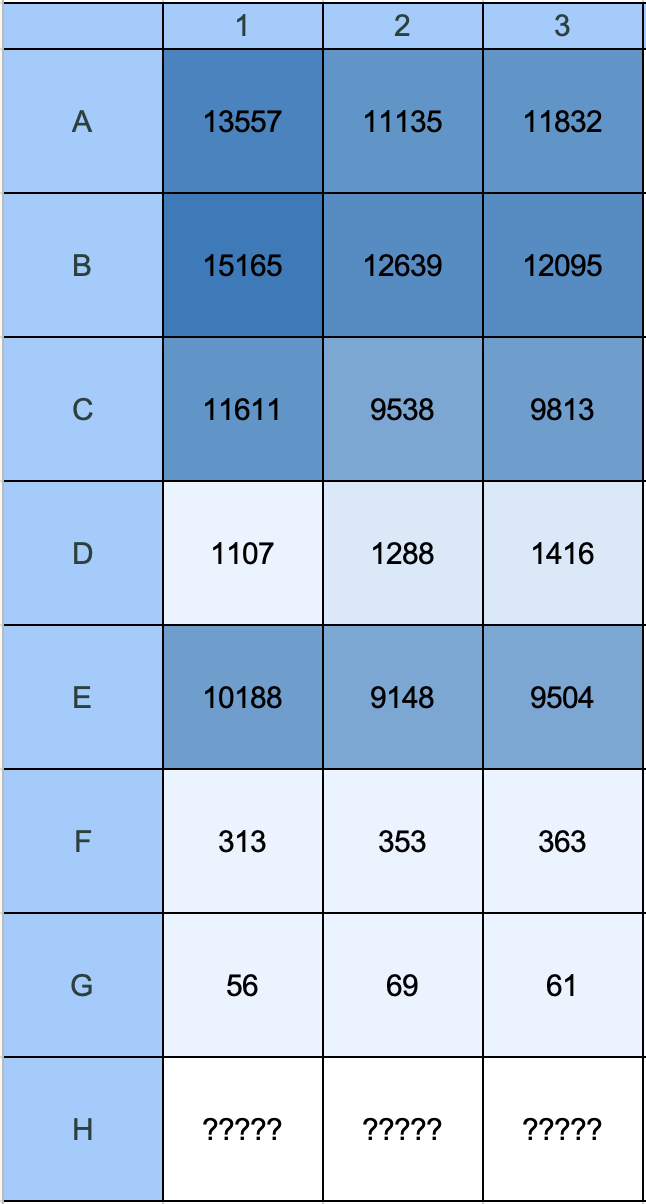
Fig 17. Gen5 matrix: Mean Max RFU values derived from the full emission spectrum scan — the peak fluorescence intensity across all scanned emission wavelengths per well. This is the most complete measure of total mCherry output as it captures the full emission curve peak rather than a fixed single wavelength.
Raw Mean Max RFU values:
| Row | Condition | Well 1 | Well 2 | Well 3 | Mean | SD |
|---|---|---|---|---|---|---|
| A | Uninduced LB | 13557 | 11135 | 11832 | 12175 | 1238 |
| B | 0.3M NaCl | 15165 | 12639 | 12095 | 13300 | 1618 |
| C | 0.5M NaCl | 11611 | 9538 | 9813 | 10321 | 1131 |
| D | LB blank | 1107 | 1288 | 1416 | 1270 | 156 |
| E | Fed LB | 10188 | 9148 | 9504 | 9613 | 529 |
| F | Starved M9 | 313 | 353 | 363 | 343 | 27 |
| G | M9 blank | 56 | 69 | 61 | 62 | 7 |
6.2 — Data Analysis & Charts
All charts generated from raw file data (Posmy-mCherry.xls). Error bars = 1 standard deviation across 3 replicates. Blank subtracted prior to normalization.
Chart 1: Cell Density (OD600)
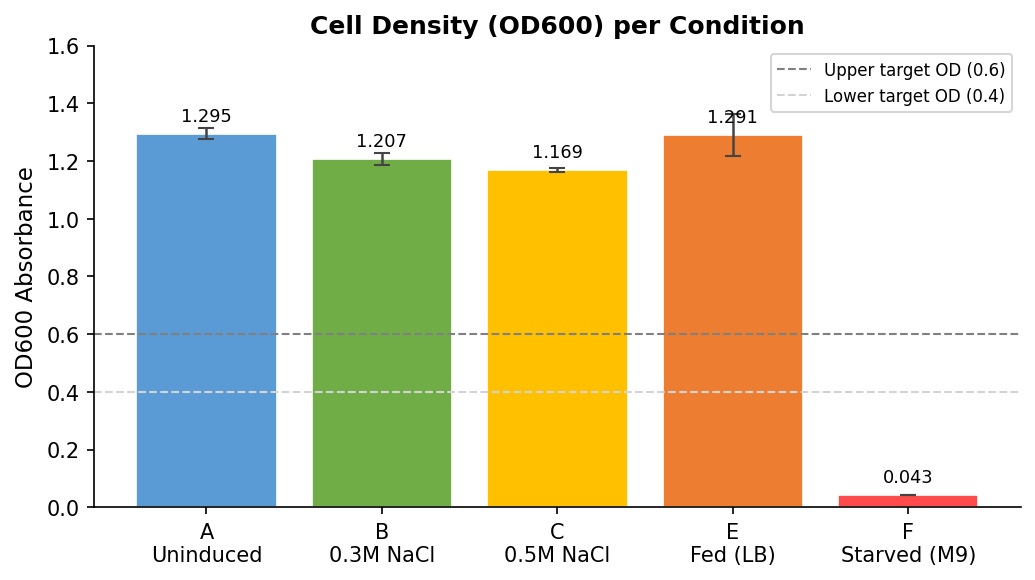
Fig 18. OD600 absorbance per condition. Dashed lines indicate standard working OD range (0.4–0.6). All LB conditions are well above range due to overnight incubation. Row F (Starved M9) OD = 0.043 — near the M9 blank, indicating very low cell density after 1:100 dilution.
Chart 2: Raw Fluorescence Endpoint (before normalization)
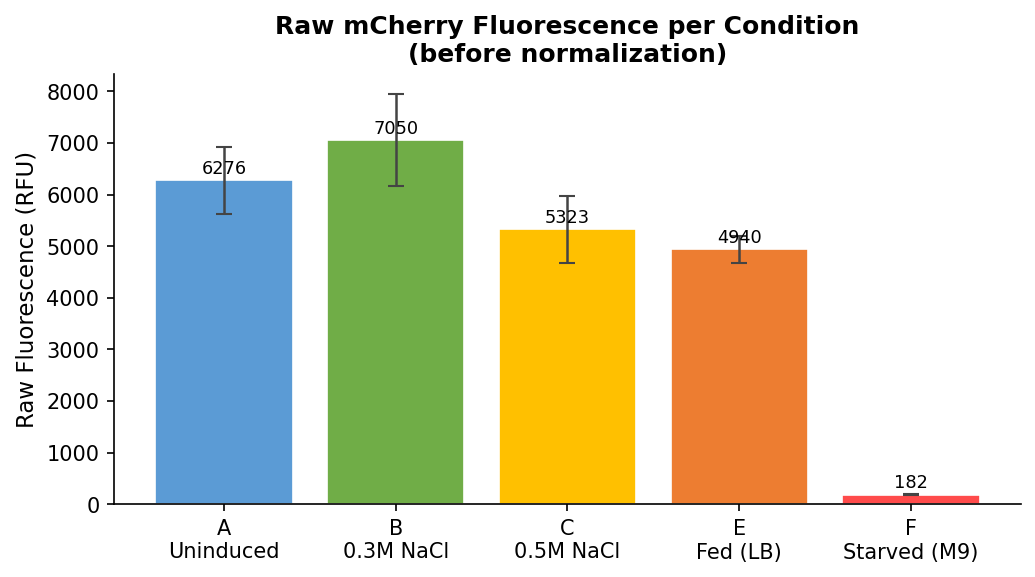
Fig 19. Raw RFU endpoint values (Ex 587 / Em 618 nm) per condition before normalization. Row F appears low in absolute terms purely because of very low cell count — normalization by OD600 corrects for this.
Chart 3: Normalized Fluorescence — Endpoint Read
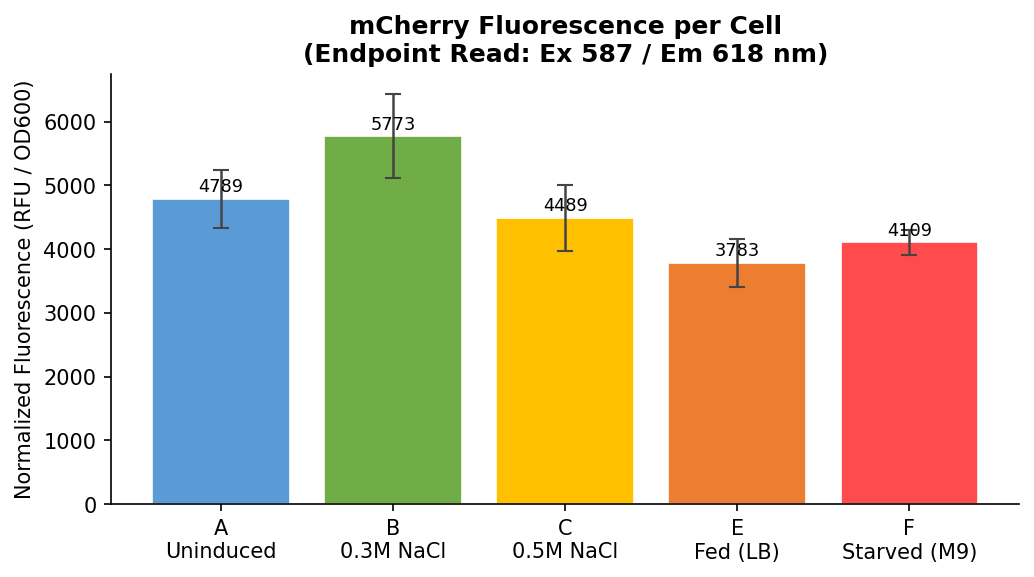
Fig 20. Normalized fluorescence (RFU ÷ OD600) per condition, endpoint read (Ex 587 / Em 618 nm). Error bars = 1 SD. This is the primary experimental result — fluorescence per cell, corrected for cell density differences between wells.
Normalized endpoint values:
| Row | Condition | Normalized RFU/OD | SD |
|---|---|---|---|
| A | Uninduced LB | 4789 | ±449 |
| B | 0.3M NaCl | 5773 | ±658 |
| C | 0.5M NaCl | 4489 | ±524 |
| E | Fed LB | 3783 | ±376 |
| F | Starved M9 | 4109 | ±194 |
Chart 4: Normalized Peak Emission (Mean Max RFU from EM Spectrum)
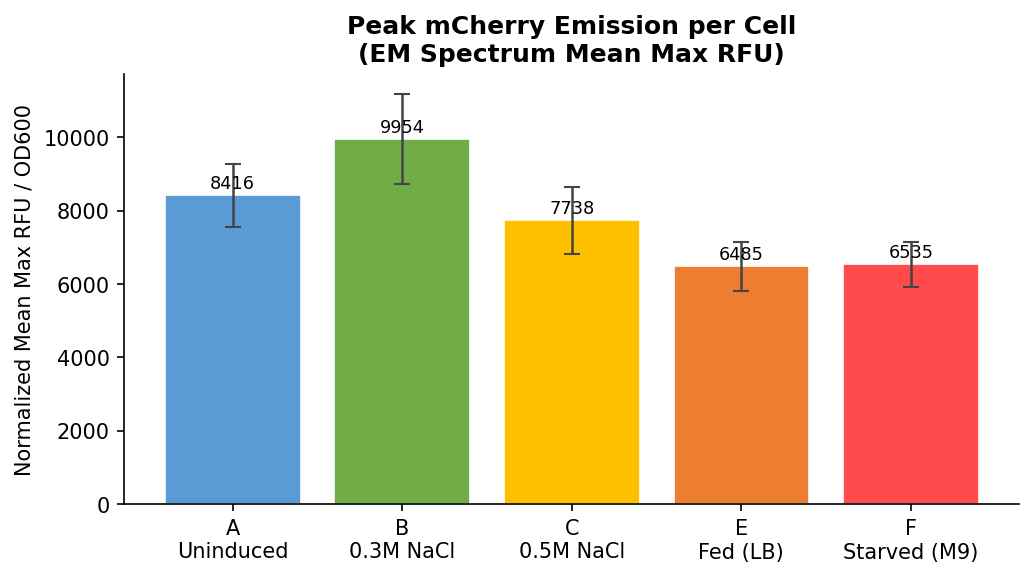
Fig 21. Normalized Mean Max RFU from the full emission spectrum scan, divided by OD600. Captures the true peak of the mCherry emission curve rather than a fixed wavelength — a more complete measure of total mCherry output per cell.
Normalized Mean Max values:
| Row | Condition | Normalized Mean Max RFU/OD | SD |
|---|---|---|---|
| A | Uninduced LB | 8416 | ±859 |
| B | 0.3M NaCl | 9954 | ±1218 |
| C | 0.5M NaCl | 7738 | ±915 |
| E | Fed LB | 6485 | ±670 |
| F | Starved M9 | 6535 | ±615 |
6.3 — Interpretation & Analysis
Finding 1: mCherry Construct is Functional
The emission spectrum (Fig 14) shows clear, consistent mountain-shaped fluorescence peaks in all LB cell-containing wells (Rows A, B, C, E), with peak emission centered at approximately 610–620 nm — the exact spectral signature of mCherry fluorescent protein.
Rows D and G (media blanks) are completely flat, confirming:
- The fluorescence signal originates entirely from the bacteria, not the media
- No autofluorescence or instrument artifact interferes with the data
- mCherry protein is being produced, correctly folded, and actively fluorescing inside E. coli cells
This is further corroborated by the pink/red pellet observed visually during centrifugation (Stage 4, Figs 11–12), providing independent visual confirmation of mCherry expression.
Finding 2: PosmY Activates Under Osmotic Stress
Comparing normalized RFU/OD across validation conditions:
Row B (0.3M NaCl) shows +20.5% higher normalized fluorescence per cell than the uninduced control, confirming that the PosmY promoter responds to osmotic stress as designed.
Row C (0.5M NaCl) falls slightly below Row A, consistent with known osmotic inhibition at higher salt concentrations — excess NaCl begins to impair cellular function, reducing mCherry output despite promoter activation. This finding suggests 0.3M NaCl is the optimal induction concentration for this construct.
Finding 3: Starvation Increases Fluorescence Per Cell
Endpoint read (Fig 20):
Mean Max RFU spectrum peak (Fig 21):
Both metrics show starved M9 cells with higher normalized fluorescence per cell than fed LB cells — directionally consistent with the bio-tamagotchi hypothesis that nutrient deprivation activates PosmY and drives mCherry expression. The endpoint read shows a more pronounced difference (+8.6%) while the spectrum peak measure shows a near-identical result between the two conditions (+0.8%).
Critical Caveat: Low Cell Density in Row F
Row F OD600 = 0.043 vs M9 blank = 0.037 — a difference of only 0.006 OD units, representing an extremely small number of cells. This occurred because the 1:100 dilution of the M9 resuspension was too aggressive, leaving barely any bacteria in the starved wells.
Consequences:
- The normalized fluorescence value for Row F carries high uncertainty — a very small OD denominator amplifies errors in the RFU numerator
- Row F emission spectrum (Fig 14) shows flat dots rather than a clear peak — insufficient cell density for a detectable spectral signature
- The 8.6% endpoint difference and 0.8% spectrum difference are directionally correct but cannot be stated with statistical confidence at this cell density
Raw data sourced from Gen5 3.05 export: Posmy-mCherry.xls
🙏 Acknowledgements
To the people who made this final project survivable

| 
|
| Dr. David S. Kong | Ronan |
| Course Director | Teaching Assistant |

| 
|
| Suvin | Alex |
| Teaching Assistant | Teaching Assistant |
This project would not have been possible without your guidance, patience, and willingness to answer Slack messages at unreasonable hours.