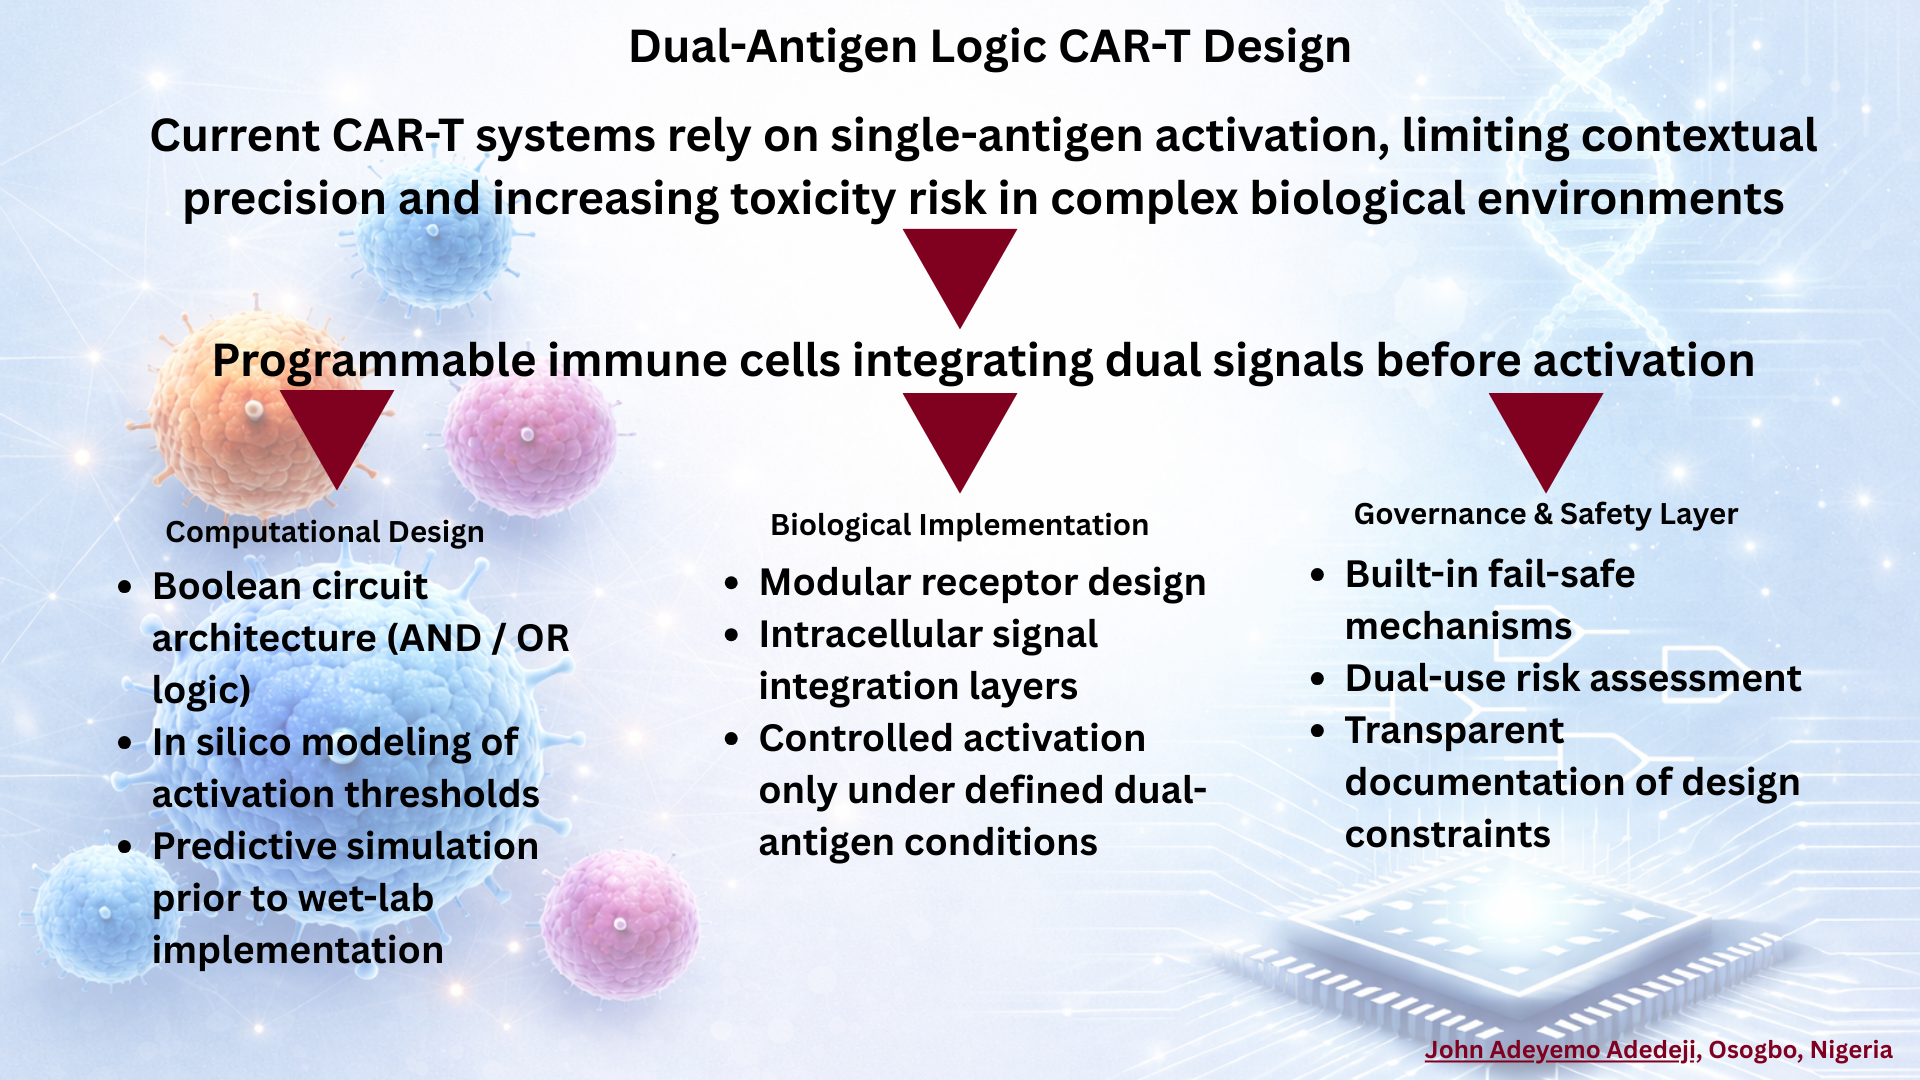
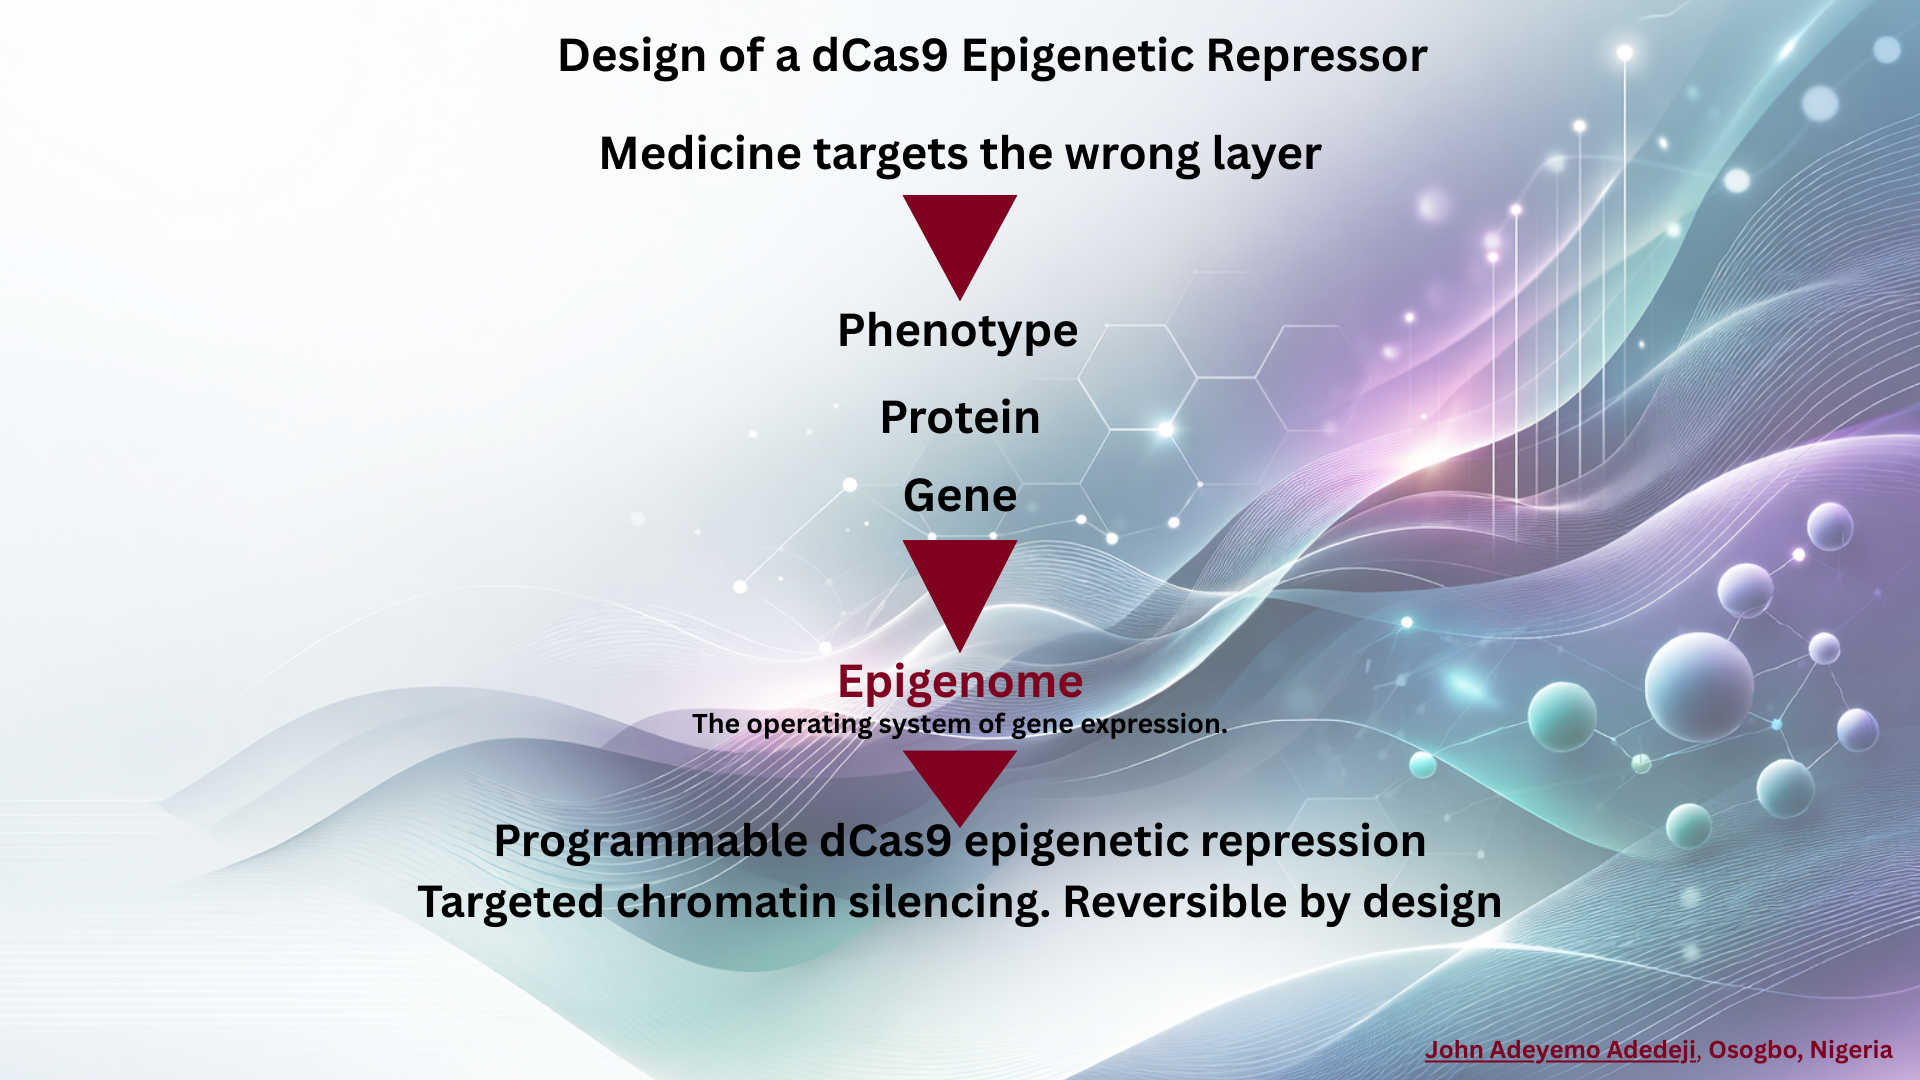
Subsections of Weeks
Week 1
Node participant note: I am a remote Genspace node listener based in Nigeria without onsite lab access. The Week 1 lab (Pipetting) was a physical bench session at Genspace nodes. I engaged with the conceptual and governance content of the week fully; the homework below represents my complete remote participation.
Class Assignment — Week 1
1) Biological Engineering Application
I aim to develop a computational and experimental platform for engineering metabolically constrained microbial systems designed for responsible real-world use. Inspired by clinical exposure to preventable infectious disease and my research at the intersection of microbiology and computational biology, the platform integrates genomic design rules, programmed auxotrophies, and environmental sensing circuits that couple microbial survival to defined ecological contexts.
The central principle is ecological boundedness. Survival and function are conditional, not assumed. Outside intended environments, persistence becomes biologically untenable. This approach supports applications ranging from gut-targeted probiotics to agricultural symbionts and environmental remediation strains.
Rather than optimizing microbes solely for performance, I want to encode responsibility at the level of metabolism. The goal is to expand synthetic biology into high-need contexts while ensuring that safety, containment, and contextual awareness are intrinsic design features, not external corrections imposed after deployment.
2) Governance and Policy Goals
My overarching governance goal is to embed non-malfeasance directly into biological architecture rather than relying exclusively on downstream regulation.
First, intrinsic containment standards should become normative. This includes requiring conditional survival mechanisms such as auxotrophies or environmental dependency circuits prior to field deployment, alongside independent validation of escape potential and evolutionary stability.
Second, dual-use mitigation must be integrated into design pipelines. Sequence screening, risk-tiered access controls, and transparent but bounded documentation standards can reduce misuse without stifling legitimate research.
Third, equity should shape access and deployment. Safety-audited open frameworks should remain available to researchers in low-resource settings, and deployment priorities should align with public health and ecological need rather than purely commercial incentives.
Together, these goals move governance upstream. Ethical alignment becomes encoded in design logic, enabling innovation that is both socially responsive and technically responsible.
3) Governance Actions
Option 1 — Conditional Deployment Requirement
Purpose: Shift from voluntary containment to mandatory intrinsic safeguards for field-deployable microbes.
Design: Regulators require documented metabolic constraints and third-party validation before approval. Academic labs and companies must comply.
Assumptions: Safeguards remain evolutionarily stable and measurable.
Risks: Overregulation may slow beneficial innovation; success may create complacency about residual risk.
Option 2 — Integrated Design-Screening Infrastructure
Purpose: Embed sequence screening and risk assessment into computational design tools.
Design: Tool developers, funders, and journals require automated biosecurity checks as part of research workflows.
Assumptions: Screening algorithms remain adaptive to emerging threats.
Risks: False positives could burden researchers; sophisticated actors might bypass systems.
Option 3 — Incentivized Safety Certification
Purpose: Encourage responsible innovation through market and funding incentives.
Design: Grant agencies and industry consortia prioritize projects meeting certified intrinsic-containment standards.
Assumptions: Financial incentives shape behavior effectively.
Risks: Certification may become symbolic rather than substantive if poorly enforced.
4) Scoring Governance Actions
| Criteria | Option 1 | Option 2 | Option 3 |
|---|---|---|---|
| Enhance Biosecurity (prevent incidents) | 1 | 1 | 2 |
| Enhance Biosecurity (respond) | 2 | 2 | 2 |
| Foster Lab Safety (prevent) | 1 | 2 | 2 |
| Protect Environment (prevent) | 1 | 2 | 2 |
| Minimize Burden | 3 | 2 | 1 |
| Feasibility | 2 | 1 | 1 |
| Not Impede Research | 3 | 1 | 1 |
| Promote Constructive Applications | 1 | 1 | 1 |
1 indicates strongest alignment.
5) Prioritization and Trade-offs
I would prioritize a combination of Option 2 and Option 3. Embedding screening directly into computational design tools makes safety habitual rather than exceptional, while incentive structures reinforce responsible norms without heavy-handed regulation.
Option 1 is powerful but risks slowing innovation in resource-constrained contexts where deployment urgency is high. My recommendation would target national research funders and international synthetic biology consortia, encouraging coordinated standards that scale globally.
Trade-offs include balancing speed with precaution and avoiding regulatory inequities that disadvantage researchers in low-income settings. Uncertainties remain regarding evolutionary stability of safeguards and adaptability of screening systems.
The central ethical concern that emerged for me is the illusion of control. Engineering containment does not eliminate uncertainty. Governance must remain adaptive, transparent, and humble, recognizing that biological systems are dynamic. Embedding responsibility into design is necessary, but continuous oversight and global dialogue remain essential.
Key Takeaways
Evolution is not theoretical. Population genetics, mutation rates, and selection coefficients are active in every gut. Any safeguard must assume adaptation under pressure.
Biology is programmable matter. DNA is a chemically precise information system. If we can write sequence, responsibility must be encoded at that same molecular layer.
Genetic recoding reshapes constraints. Codon reassignment and translational control can structurally limit horizontal gene transfer.
Design capacity is accelerating. Sequencing and synthesis technologies now scale faster than the institutions meant to guide them.
Design obeys physics. Protein folding, metabolic flux, and regulatory circuits follow thermodynamics and kinetics. Only systems stable under stress earn trust.
Works Cited
Church, G. M., & Regis, E. (2012). Regenesis: How Synthetic Biology Will Reinvent Nature and Ourselves. Basic Books.
Dana, G. V., Kuiken, T., Rejeski, D., & Snow, A. A. (2012). Four steps to avoid a synthetic-biology disaster. Nature, 483(7387), 29. https://doi.org/10.1038/483029a
Mandell, D. J., Lajoie, M. J., Mee, M. T., Takeuchi, R., Kuznetsov, G., Norville, J. E., Gregg, C. J., Stoddard, B. L., & Church, G. M. (2015). Biocontainment of genetically modified organisms by synthetic protein design. Nature, 518(7537), 55–58. https://doi.org/10.1038/nature14121
Rovner, A. J., Haimovich, A. D., Katz, S. R., Li, Z., Grome, M. W., Gassaway, B. M., Amiram, M., Patel, J. R., Gallagher, R. R., Rinehart, J., & Isaacs, F. J. (2015). Recoded organisms engineered to depend on synthetic amino acids. Nature, 518(7537), 89–93. https://doi.org/10.1038/nature14095
AI Prompts Employed (Claude AI)
- Design a governance scoring rubric that evaluates biosafety, equity, and feasibility without collapsing into a single axis
- Compare mandatory deployment requirements versus incentivised certification as governance mechanisms for synthetic biology containment
- What is the strongest argument against relying on intrinsic containment as a primary biosafety strategy
- Explain the Lysine Contingency as a metabolic governance mechanism, not just a biosafety patch
- How does codon reassignment structurally reduce horizontal gene transfer risk
Week 2
Class Assignment — Week 2 Preparation
1) Essential Amino Acids and the Lysine Contingency
The ten essential amino acids in animals are histidine, isoleucine, leucine, lysine, methionine, phenylalanine, threonine, tryptophan, valine, and arginine (essential in growing animals). Animals cannot synthesize these; survival depends on dietary supply.
This reframes the Lysine Contingency for me. It is not merely a clever containment device. Engineering microbes that require lysine creates a metabolic dependency aligned with a biological universal. Because animals cannot produce lysine, ecological persistence becomes tightly coupled to controlled supplementation. Survival becomes conditional, not autonomous.
I now see it less as a biosafety patch and more as a governance-embedded metabolic contract. The dependency encodes authority into biochemistry. Control is not enforced externally; it is written into the organism’s survival logic. That shift moves containment from policy language into molecular architecture.
2) Suggested Code for AA:AA Interactions
From the genetic code logic shown, base pairs have symmetry rules. Amino acids need something analogous. I would propose a layered interaction code:
First layer: chemical class (polar, nonpolar, charged, aromatic).
Second layer: interaction type (hydrophobic packing, hydrogen bonding, ionic pairing, pi stacking).
Third layer: geometry constraint (distance and orientation tolerance).
For example, NP-HYD-G1 could denote nonpolar hydrophobic packing within a defined geometric band. CH-ION-G2 could represent oppositely charged ionic interaction with specific spacing tolerance.
Such a code treats protein structure not as artistic folding but as readable and writable interaction grammar. If we can read polymers, we should also encode their interaction rules explicitly. That shift makes protein design less descriptive and more programmable.
3) Ethical Reflections
Biological systems do not respect borders. Political, institutional, even disciplinary lines dissolve in ecology. Framing safety as compliance feels incomplete because evolution does not comply. Good intentions are structurally irrelevant to selection pressures.
Governance must therefore treat evolution as a first-class design constraint. Safeguards must assume mutation, drift, and ecological leakage. Ethical assumptions should be embedded in design architectures, not appended through oversight committees.
I am increasingly drawn to resilience-based governance. Instead of trusting actors, we engineer systems that remain bounded even under failure. The goal is not perfect control but constrained adaptability. In living systems, humility is ethical. Governance must anticipate dynamics, not merely regulate behavior.
Class Assignment — Week 2
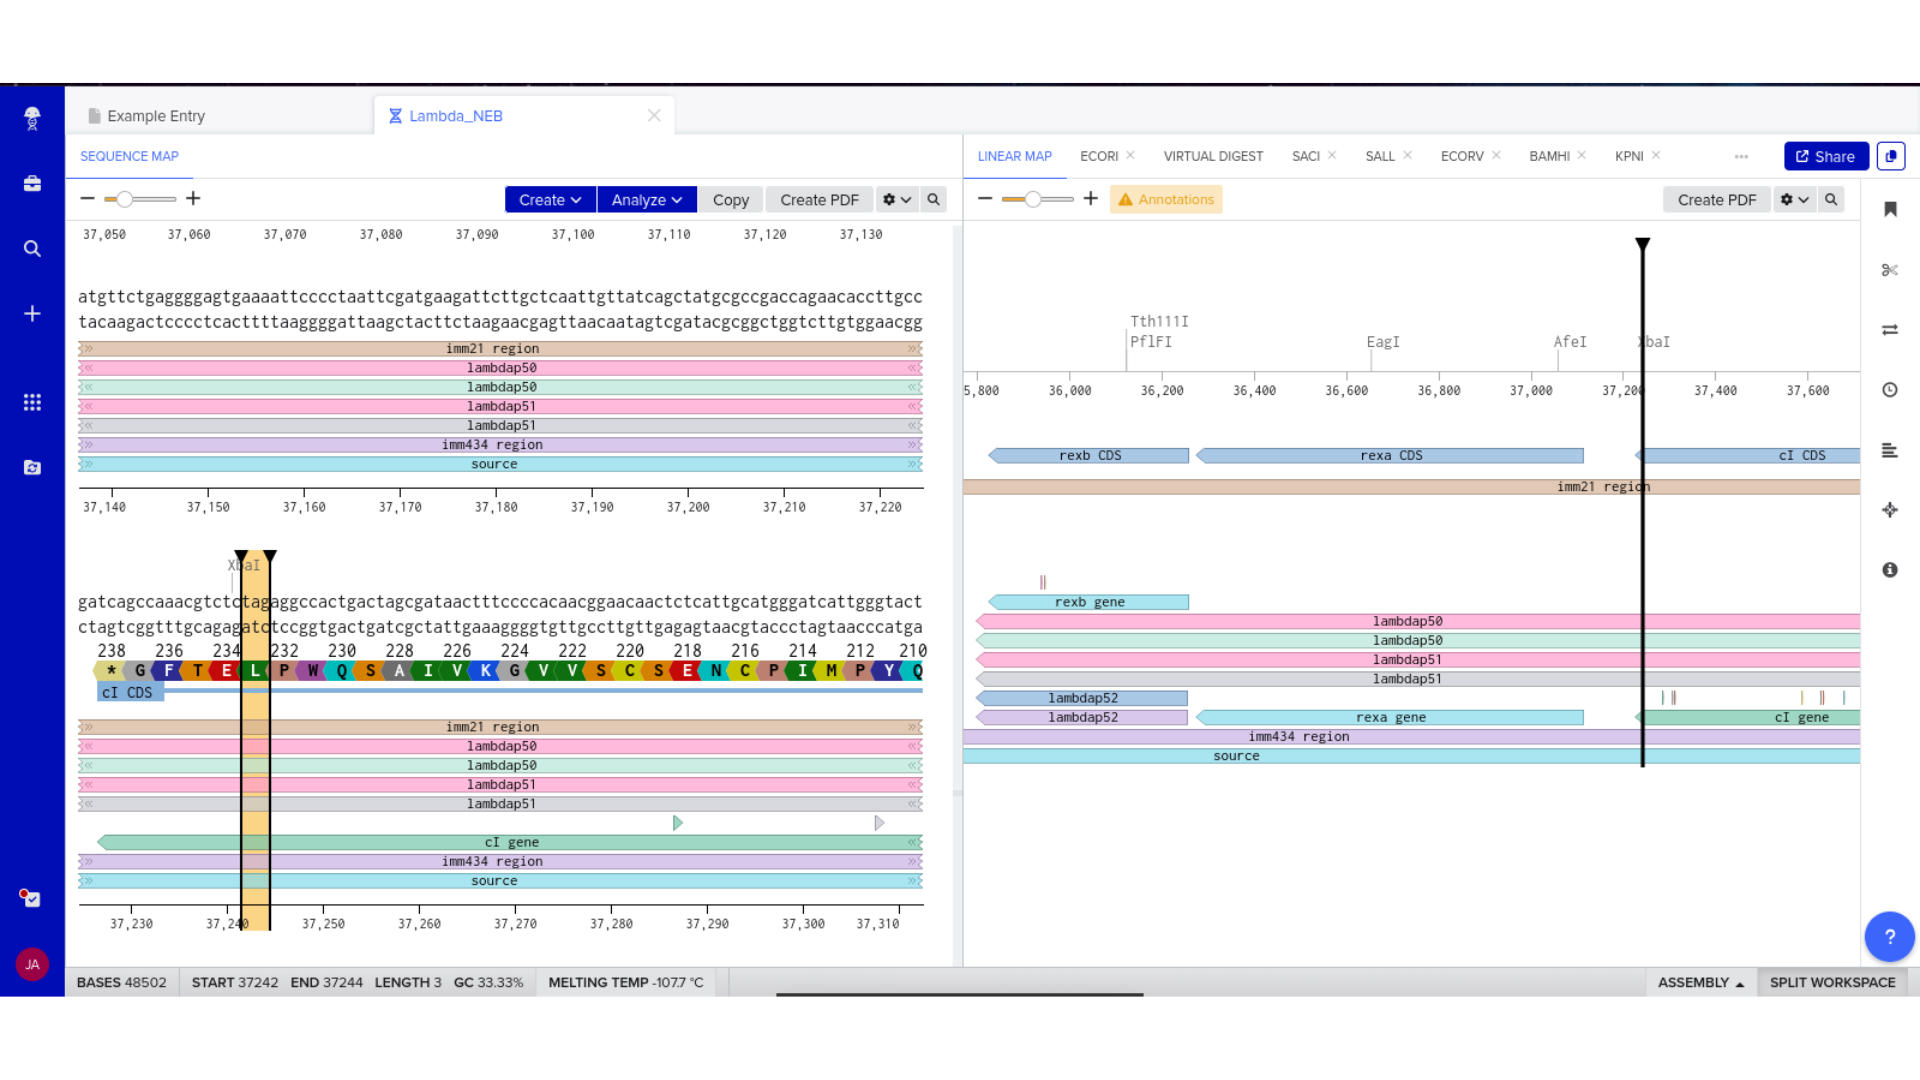
Node participant note: I am a remote Genspace node listener based in Nigeria without onsite lab access. The Week 2 lab (DNA Gel Art) was a physical bench session at Genspace nodes. In lieu of wet-lab access, I completed a virtual gel simulation of my Microcin M expression construct using Benchling’s restriction digest tool and documented the expected band pattern below.
Part 1 — Sequence Retrieval and Design Workflow
1) Sequence Retrieval and Benchling Initialization
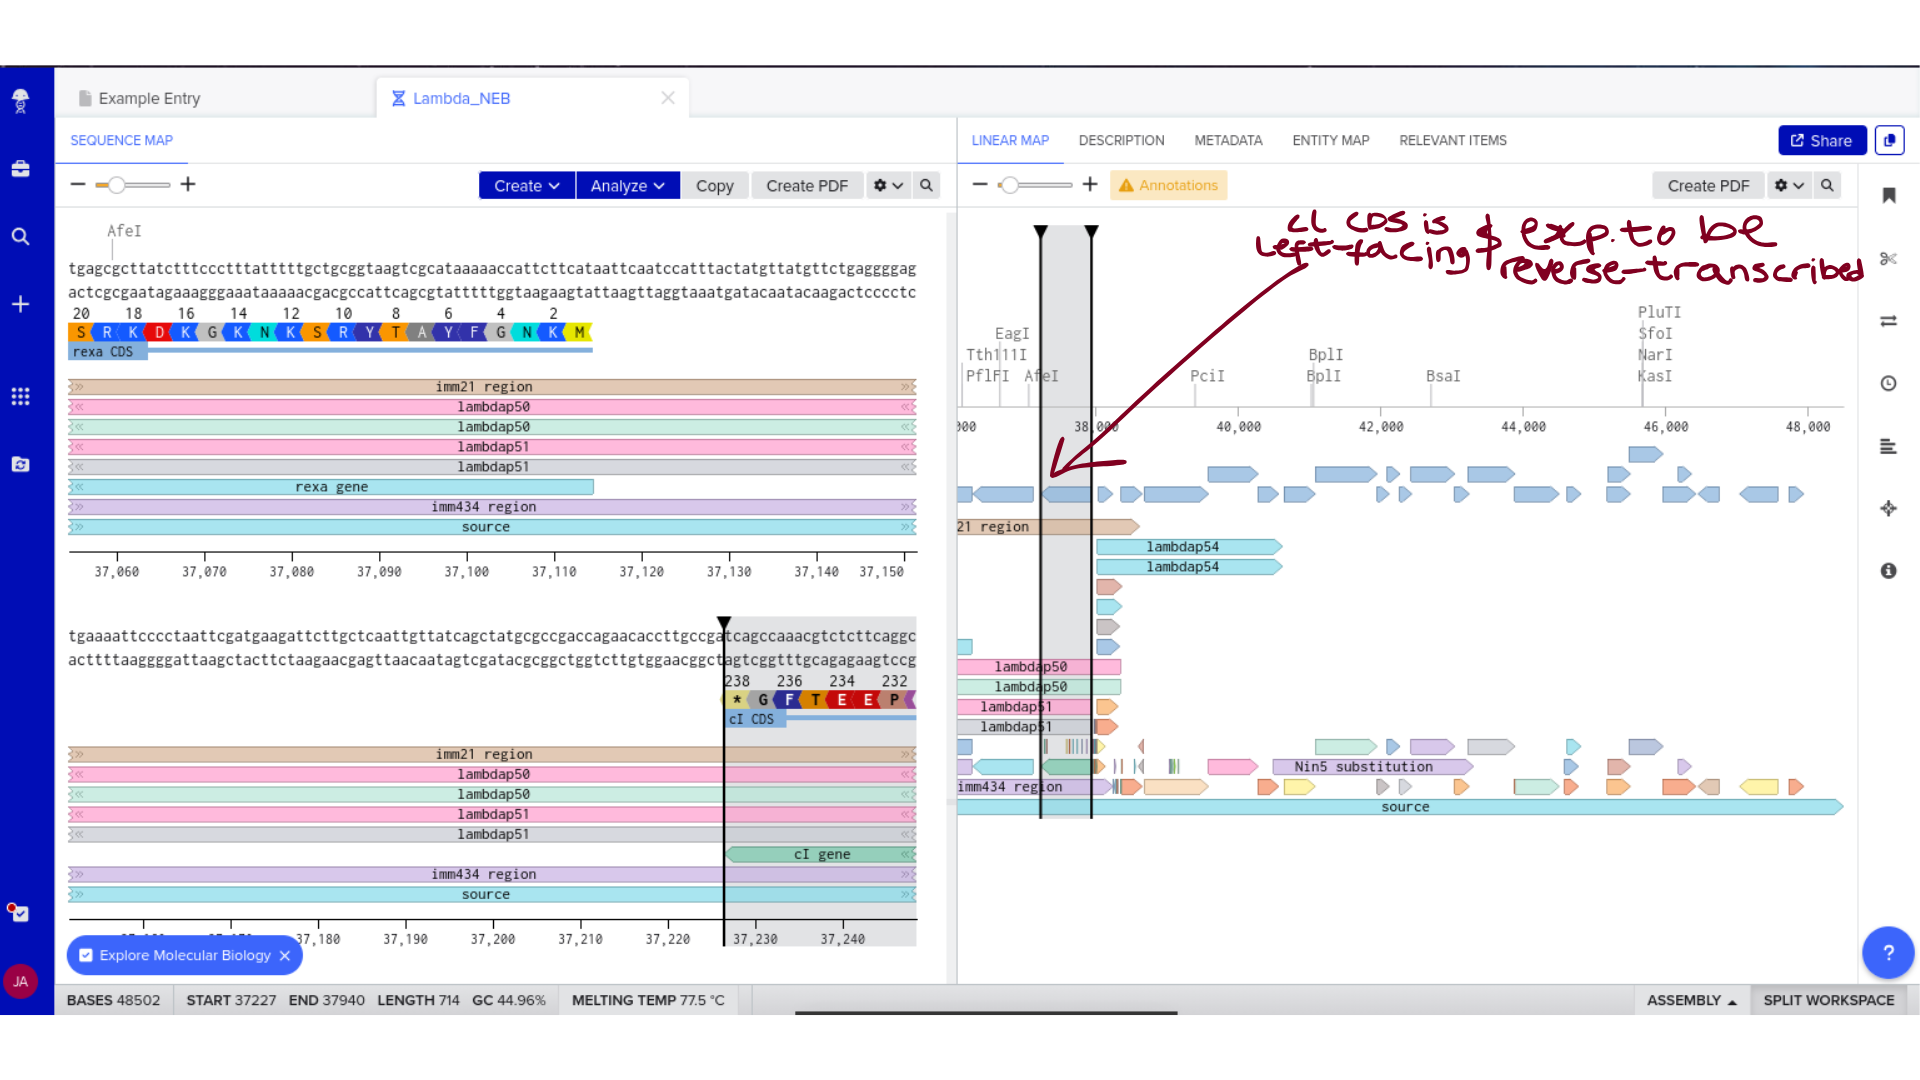
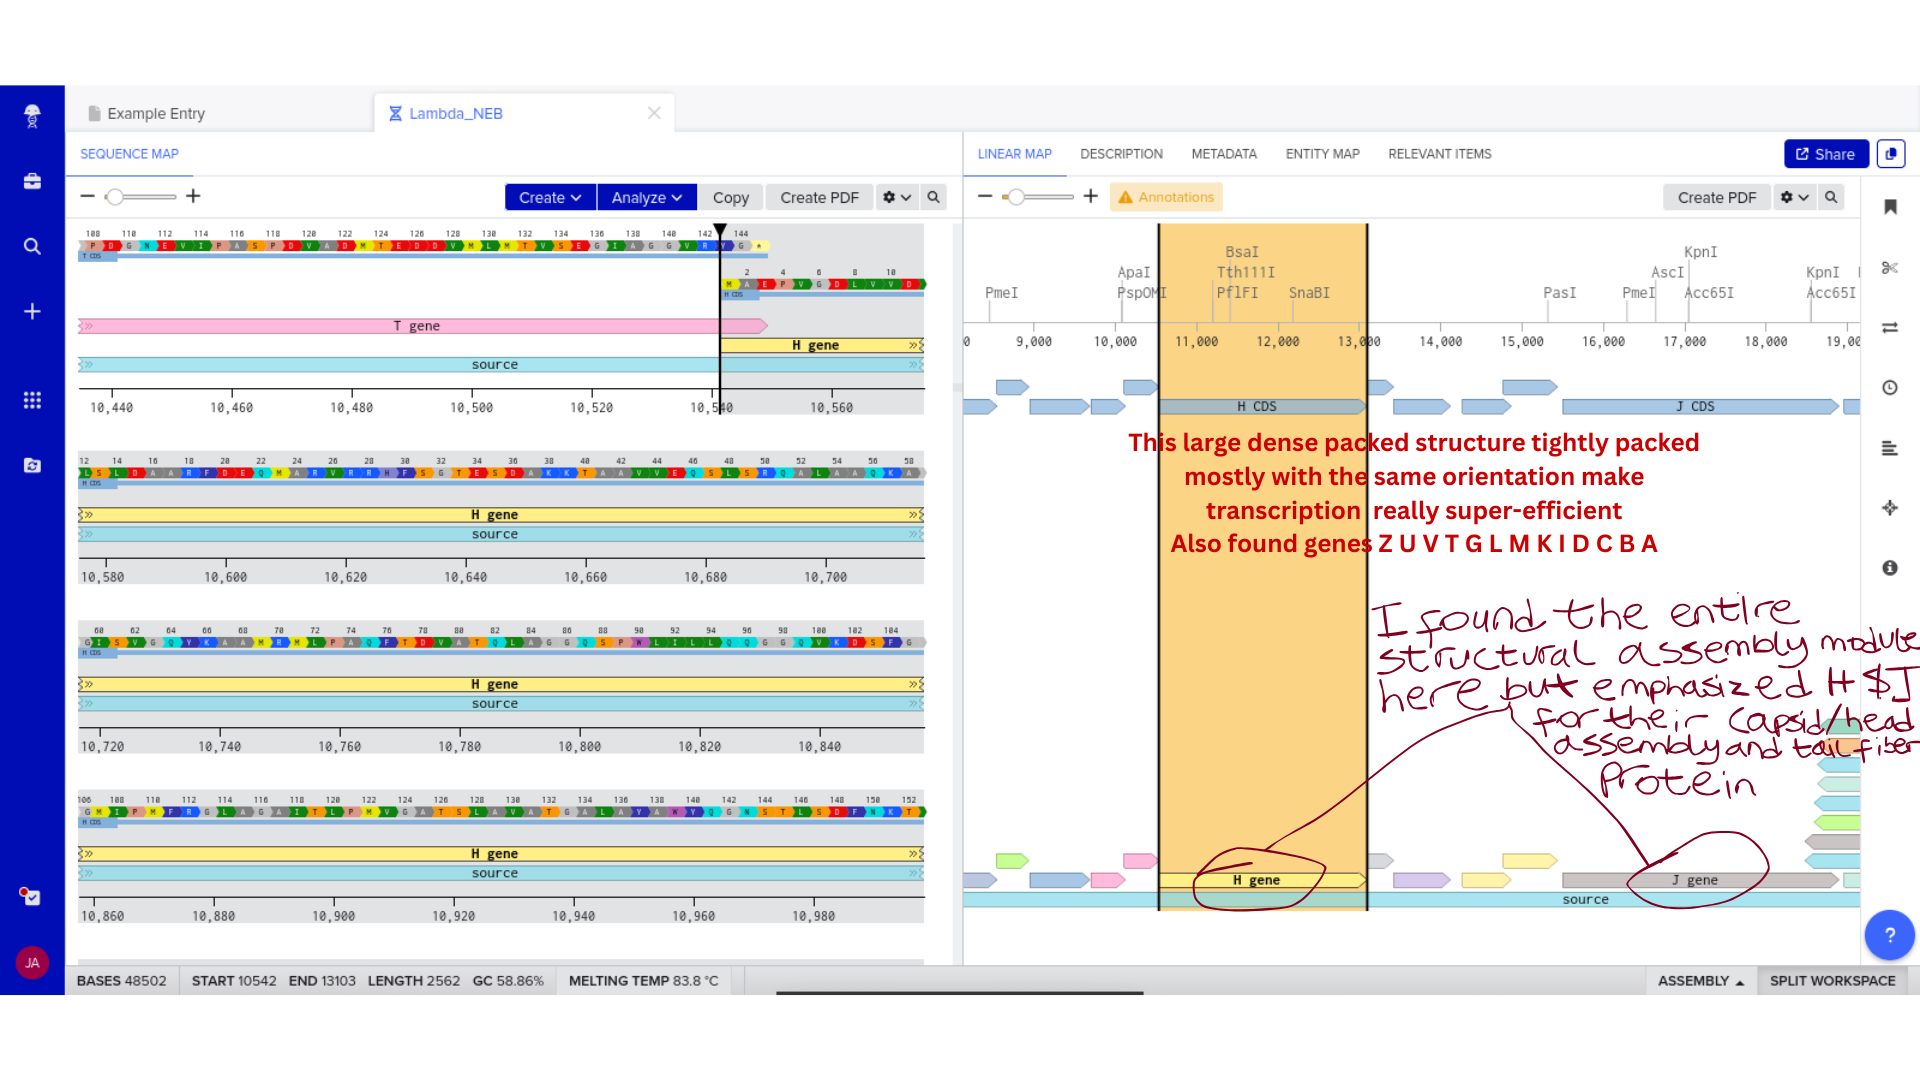
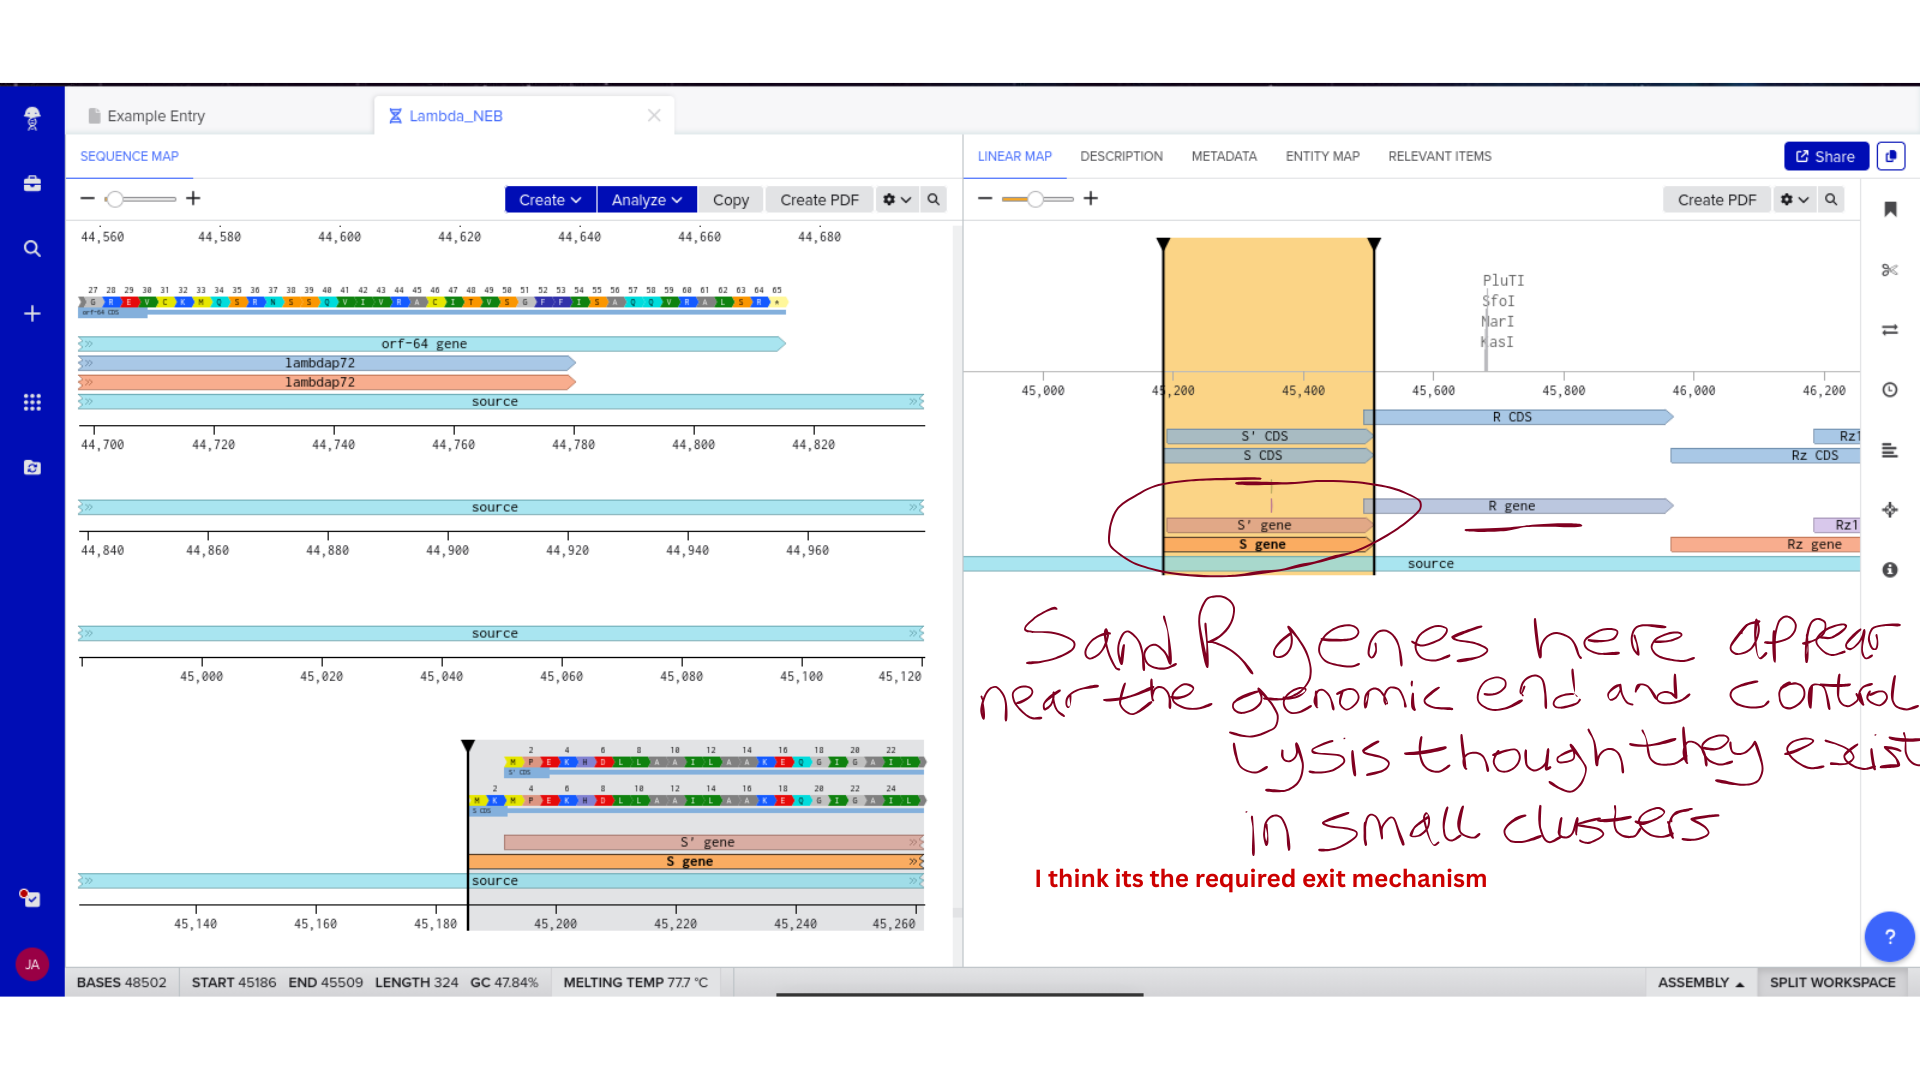
The process began with obtaining a Lambda GenBank file from New England Biolabs. After confirming the correct format, I imported the file into Benchling as a DNA sequence. Care was taken to ensure that the file was not mistakenly uploaded as RNA and that annotations displayed properly within the platform.
This step established a stable working environment before any design modifications were introduced. Confirming correct topology and annotation structure prevented downstream formatting or visualization issues.
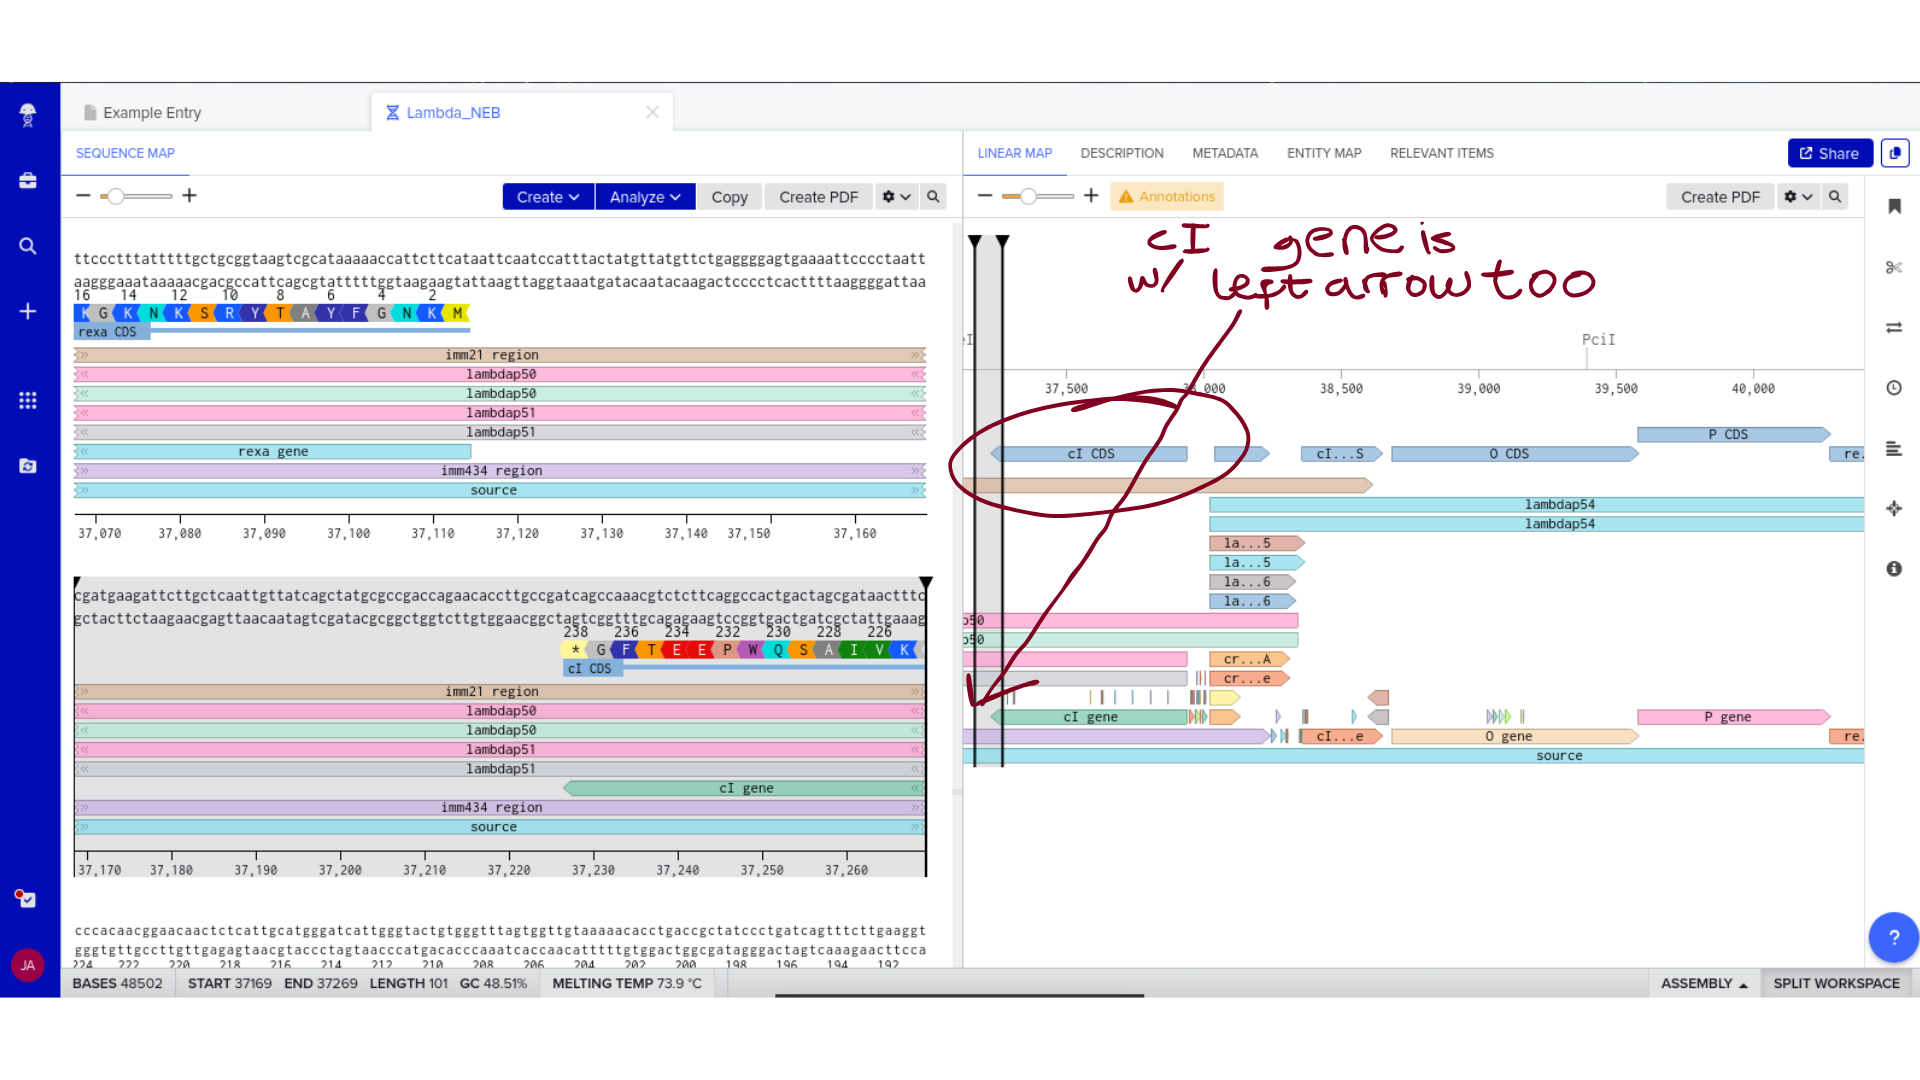
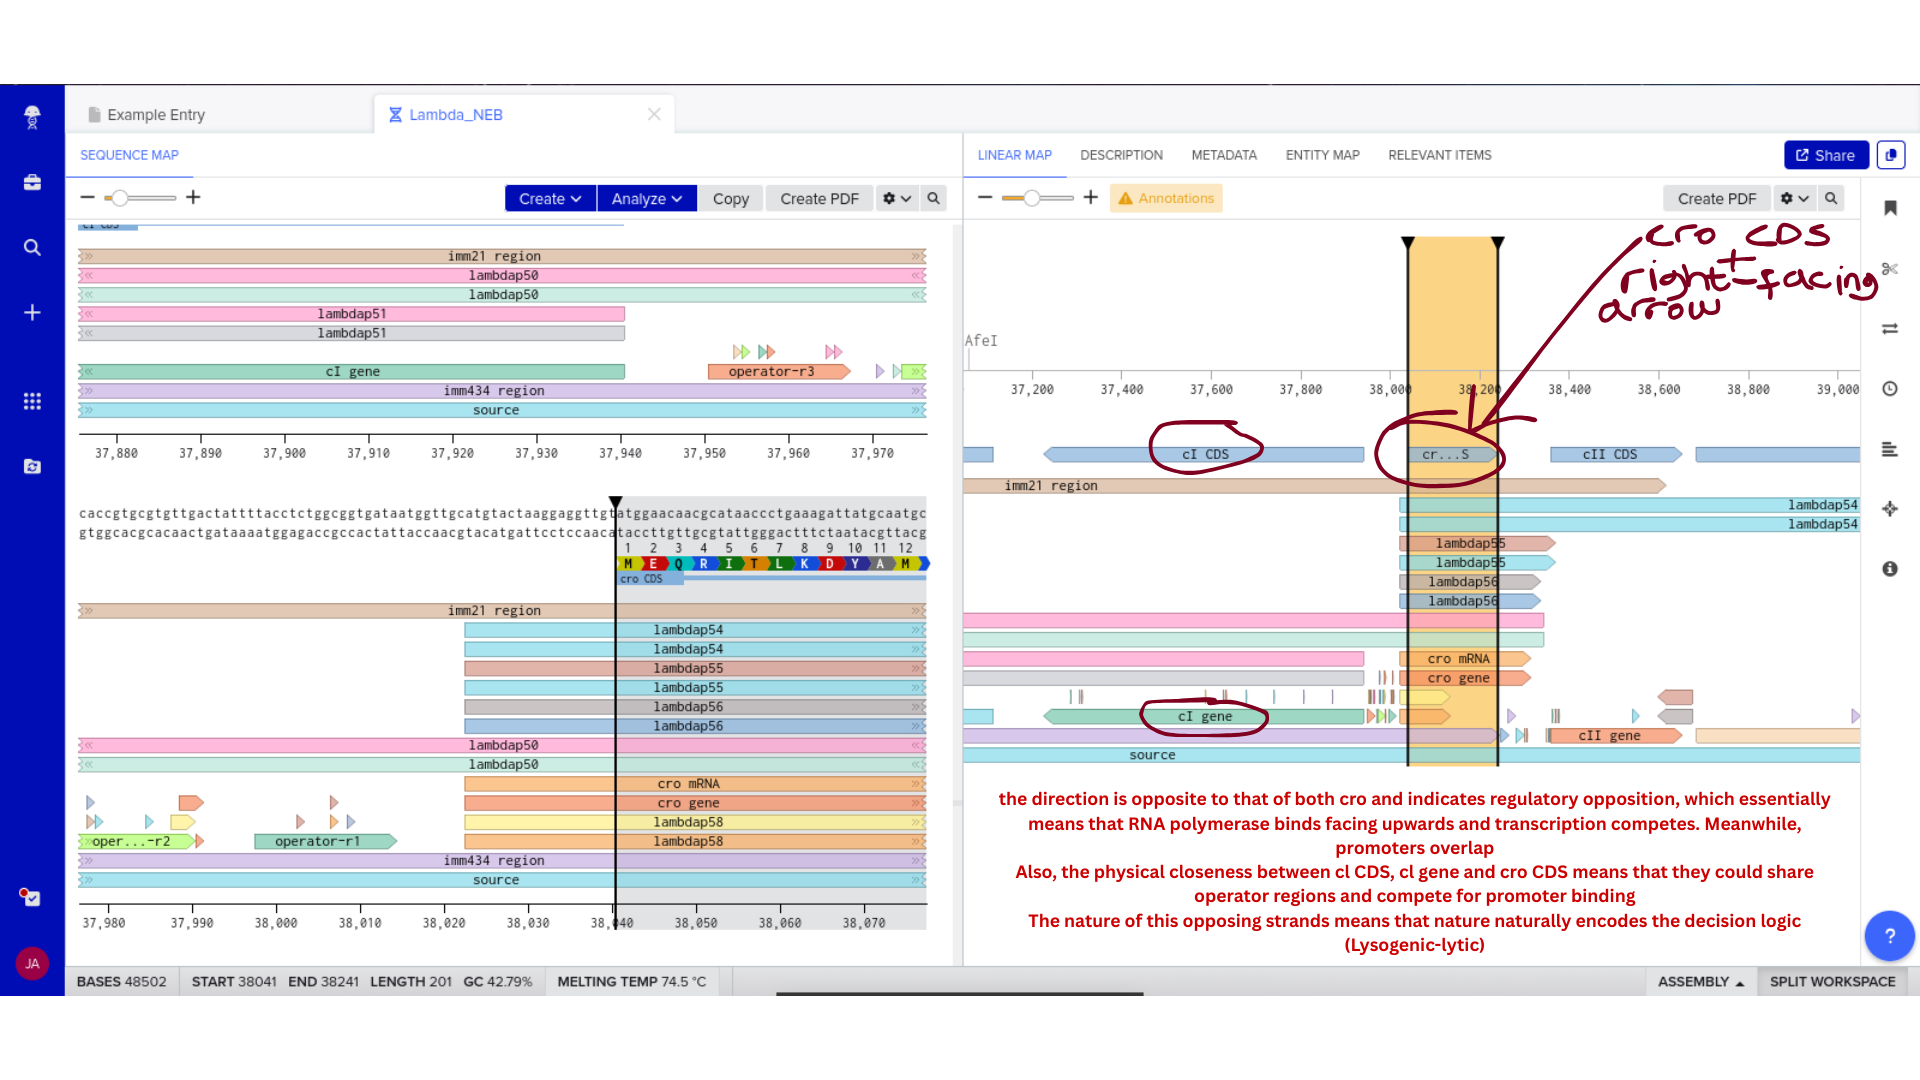
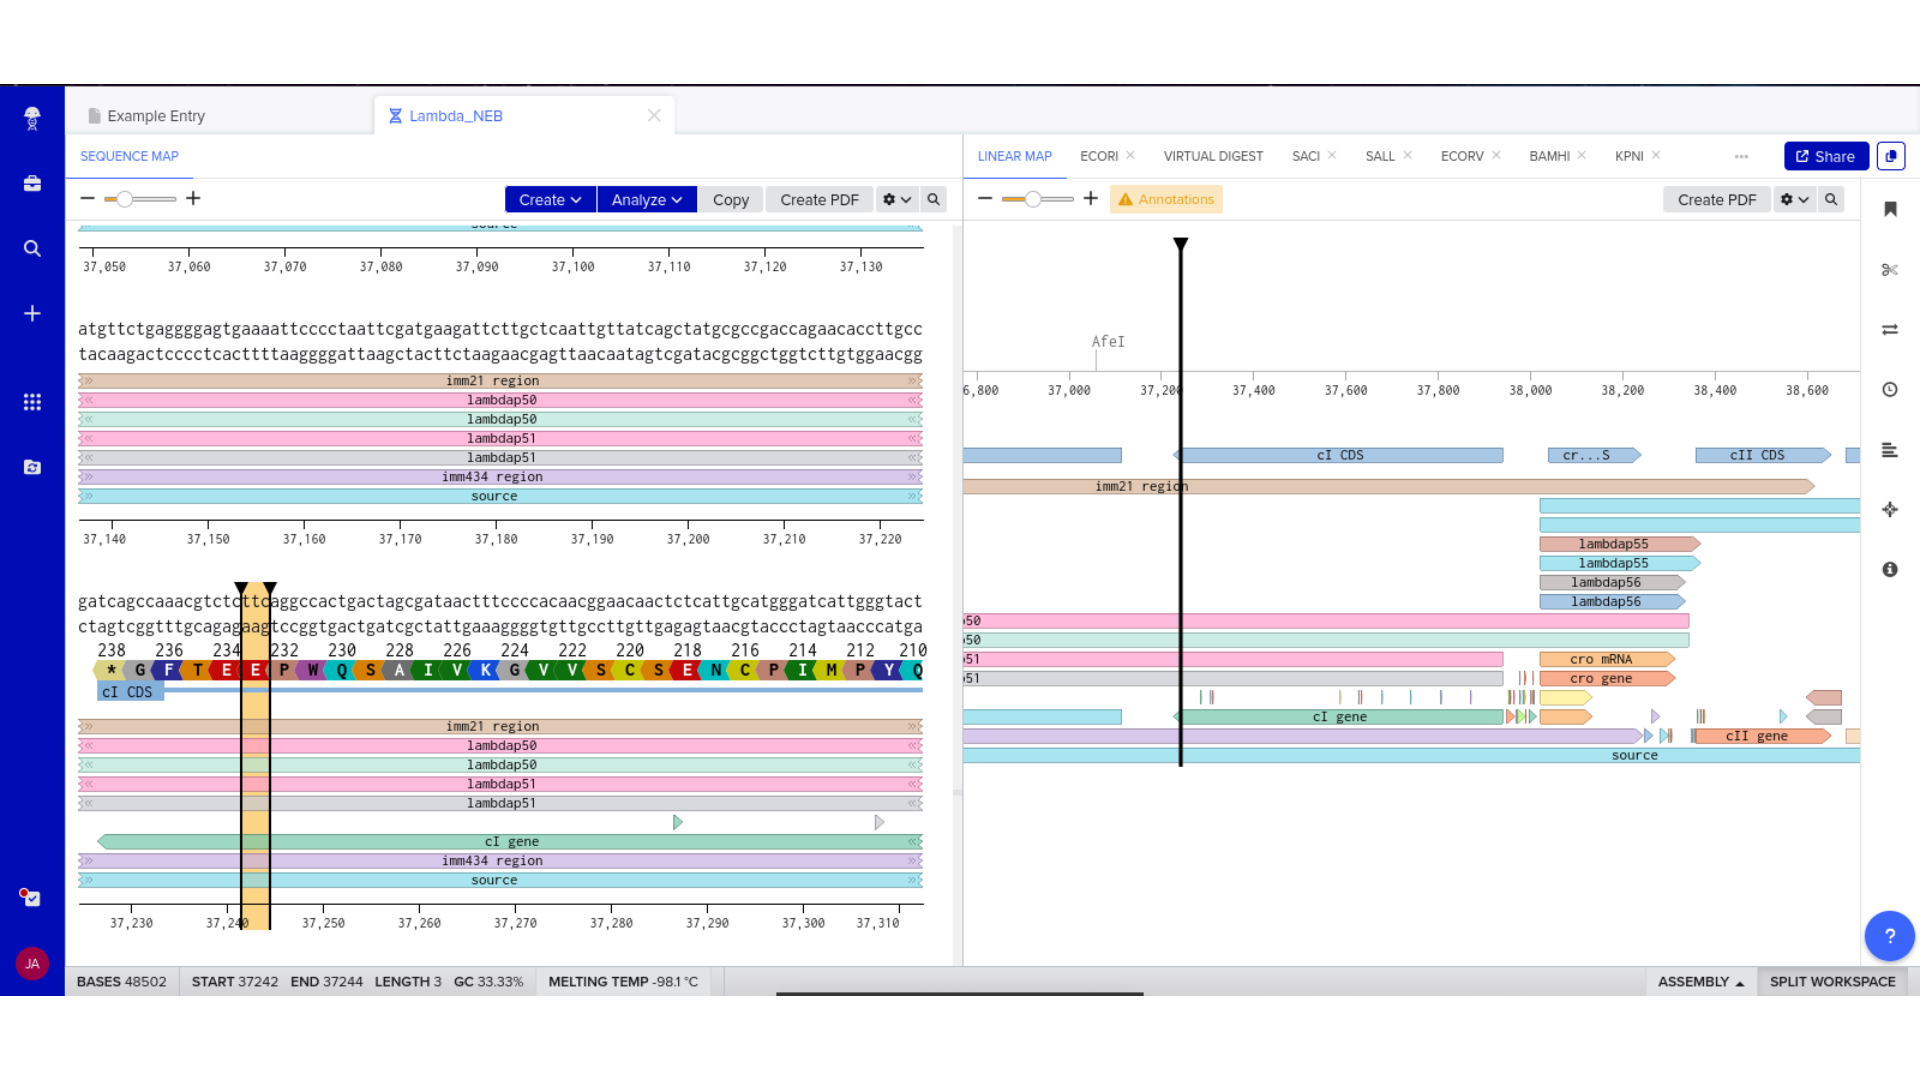
2) Genomic Exploration and Annotation Familiarization
Once imported, I explored the annotated regions of the Lambda genome within Benchling. This involved confirming gene orientation, identifying labeled regions, and understanding the graphical interface for both linear and circular visualization.
Although exploratory, this step reinforced familiarity with the design environment. It ensured that I could distinguish between expected gene clusters and annotation artifacts, and that I could confidently navigate the interface for subsequent editing.
3) Protein Selection and Sequence Acquisition
Furthermore, I selected Microcin M as the protein of interest. The choice aligned with my project, ÌṢỌ, which focuses on context-sensitive antimicrobial response within the gut ecosystem.
The selection criteria included:
- Narrow-spectrum antimicrobial activity
- Relevance to microbial competition
- Compatibility with a governed probiotic chassis
The amino acid sequence was retrieved in FASTA format from a reliable database (NCBI GenBank: CAE55705.1). I verified the header structure and ensured that the sequence corresponded exactly to the intended protein.
4) Reverse Translation
Using Benchling’s reverse translation functionality, I converted the amino acid sequence into a nucleotide sequence suitable for expression in Escherichia coli.
Key considerations included:
- Maintaining correct reading frame
- Ensuring inclusion of a start codon
- Confirming appropriate stop codon placement
- Selecting E. coli codon usage
The output DNA sequence was checked to ensure it translated back to the original protein sequence without truncation or frame shift.
5) Codon Optimization
Following reverse translation, codon optimization was performed for expression in E. coli. This step aimed to improve translational efficiency while minimizing expression burden and avoiding rare codons.
Optimization included:
- Aligning codon usage with host bias
- Avoiding problematic restriction sites
- Preserving protein sequence integrity
This stage reinforced that codon choice influences not only protein yield but also metabolic load and evolutionary stability.
Part 2 — Construct Assembly and Validation
6) Expression Cassette Assembly
The optimized coding sequence was integrated into a complete expression cassette using the assignment’s structural framework:
Promoter → Ribosome Binding Site → Start Codon → Codon-Optimized CDS → Optional His Tag → Stop Codon → Terminator
Each component was manually inserted and annotated within Benchling. Particular care was taken to ensure that the coding region replaced the example scaffold sequence rather than being appended to it.
Linear and circular map views were used to confirm structural continuity, annotation accuracy, and absence of unintended sequence artifacts.
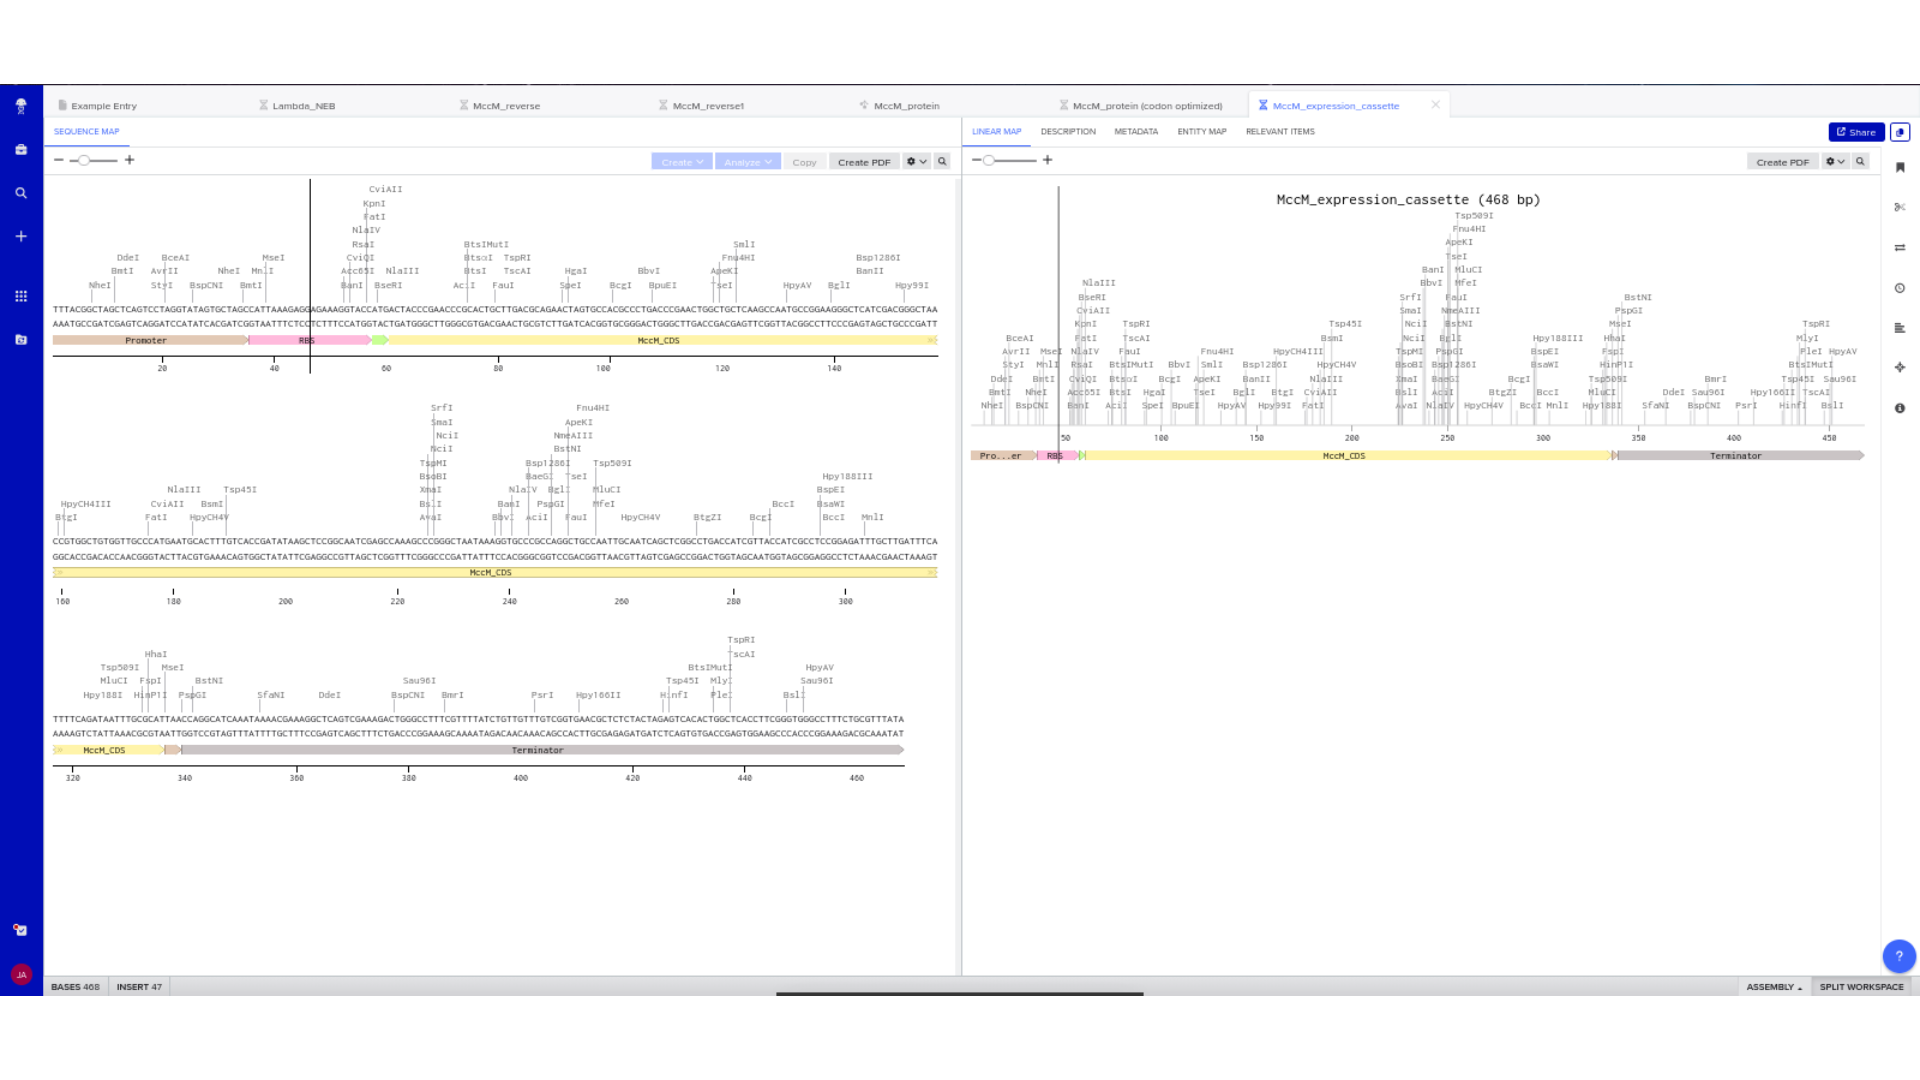
7) Virtual Digest and Gel Simulation
To validate construct integrity, I performed a virtual digest within Benchling and obtained predicted fragment sizes. These fragment sizes were then visualized using an external gel simulation tool.
This step confirmed that the construct behaved as expected under restriction enzyme analysis and reinforced my understanding of plasmid verification workflows.
8) FASTA Export and Synthesis Preparation
The completed expression cassette was exported in FASTA format for potential synthesis ordering. Care was taken to ensure:
- Correct header formatting beginning with the greater-than symbol
- No extraneous spaces or formatting characters
- Proper file extension
Although synthesis ordering through Twist was initiated, access was restricted to verified institutional accounts at the time: a common barrier for researchers at nodes outside North America and Europe. I pivoted toward generating a complete plasmid visualisation within Benchling instead.
9) Plasmid Map Generation
To simulate a complete plasmid construct, the sequence topology was converted to circular within Benchling. Circular map visualization confirmed clear annotation of promoter, ribosome binding site, coding sequence, and terminator.
This produced a plasmid map without requiring external synthesis confirmation. The visualization ensured structural coherence and clear representation of the engineered construct.
Technical Milestones Achieved
- Successful import and annotation of GenBank files
- Accurate reverse translation from protein to DNA
- Codon optimization aligned with host expression
- Proper construction of an annotated expression cassette
- Verified FASTA export formatting
- Simulated plasmid visualization in circular topology
- Integration of molecular workflow with ecological design philosophy
Backbone Vector Documentation
The Microcin M expression cassette was designed for cloning into pUC19, a high-copy ColE1-origin plasmid carrying ampicillin resistance. pUC19 was selected primarily for its well-characterised cloning sites and broad compatibility with standard E. coli transformation protocols — practical considerations given that the immediate goal is sequence verification rather than stable expression. The MccH47 insert is flanked by EcoRI and HindIII sites for directional cloning into the multiple cloning site. The complete annotated construct is deposited in the class Benchling folder as MccH47_pUC19_EcN_construct.
For downstream ÌṢỌ deployment, the cassette would need migration to a lower-copy backbone — pSC101 or a chromosomal integration vector — to reduce metabolic burden on the EcN chassis and improve evolutionary stability under selection.
Referenced from Week 7, Part 3
Design Integration
Throughout the experience, I maintained alignment with the core principles of ÌṢỌ:
- Fitness cost is a primary design variable
- Selection operates continuously
- Expression burden affects evolutionary stability
- Containment must be intrinsic to architecture
- Models inform design boundaries
This reframed it for me from a cloning exercise into a constraint-aware engineering process.
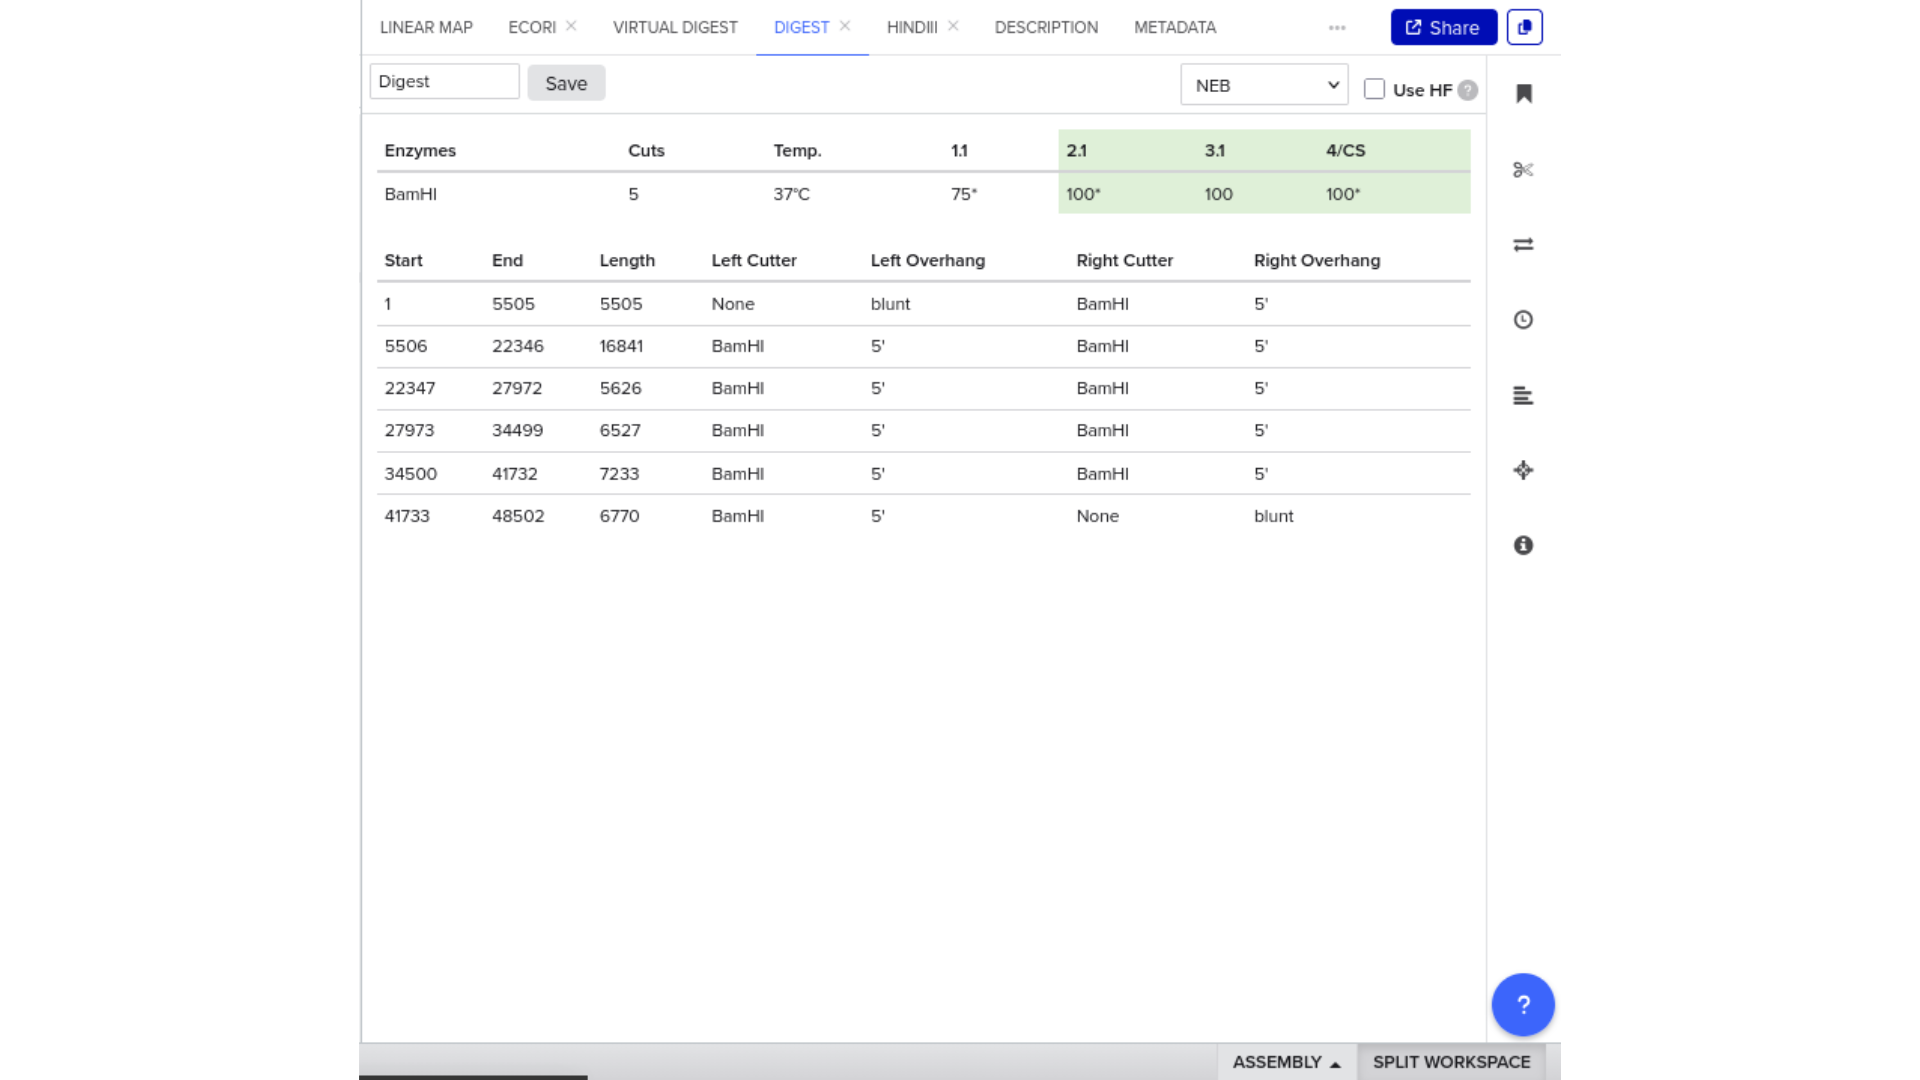
Virtual Gel Simulation — Microcin M Expression Cassette
As a remote participant, I completed a virtual digest and gel simulation of the Microcin M expression cassette in place of the physical DNA Gel Art lab.
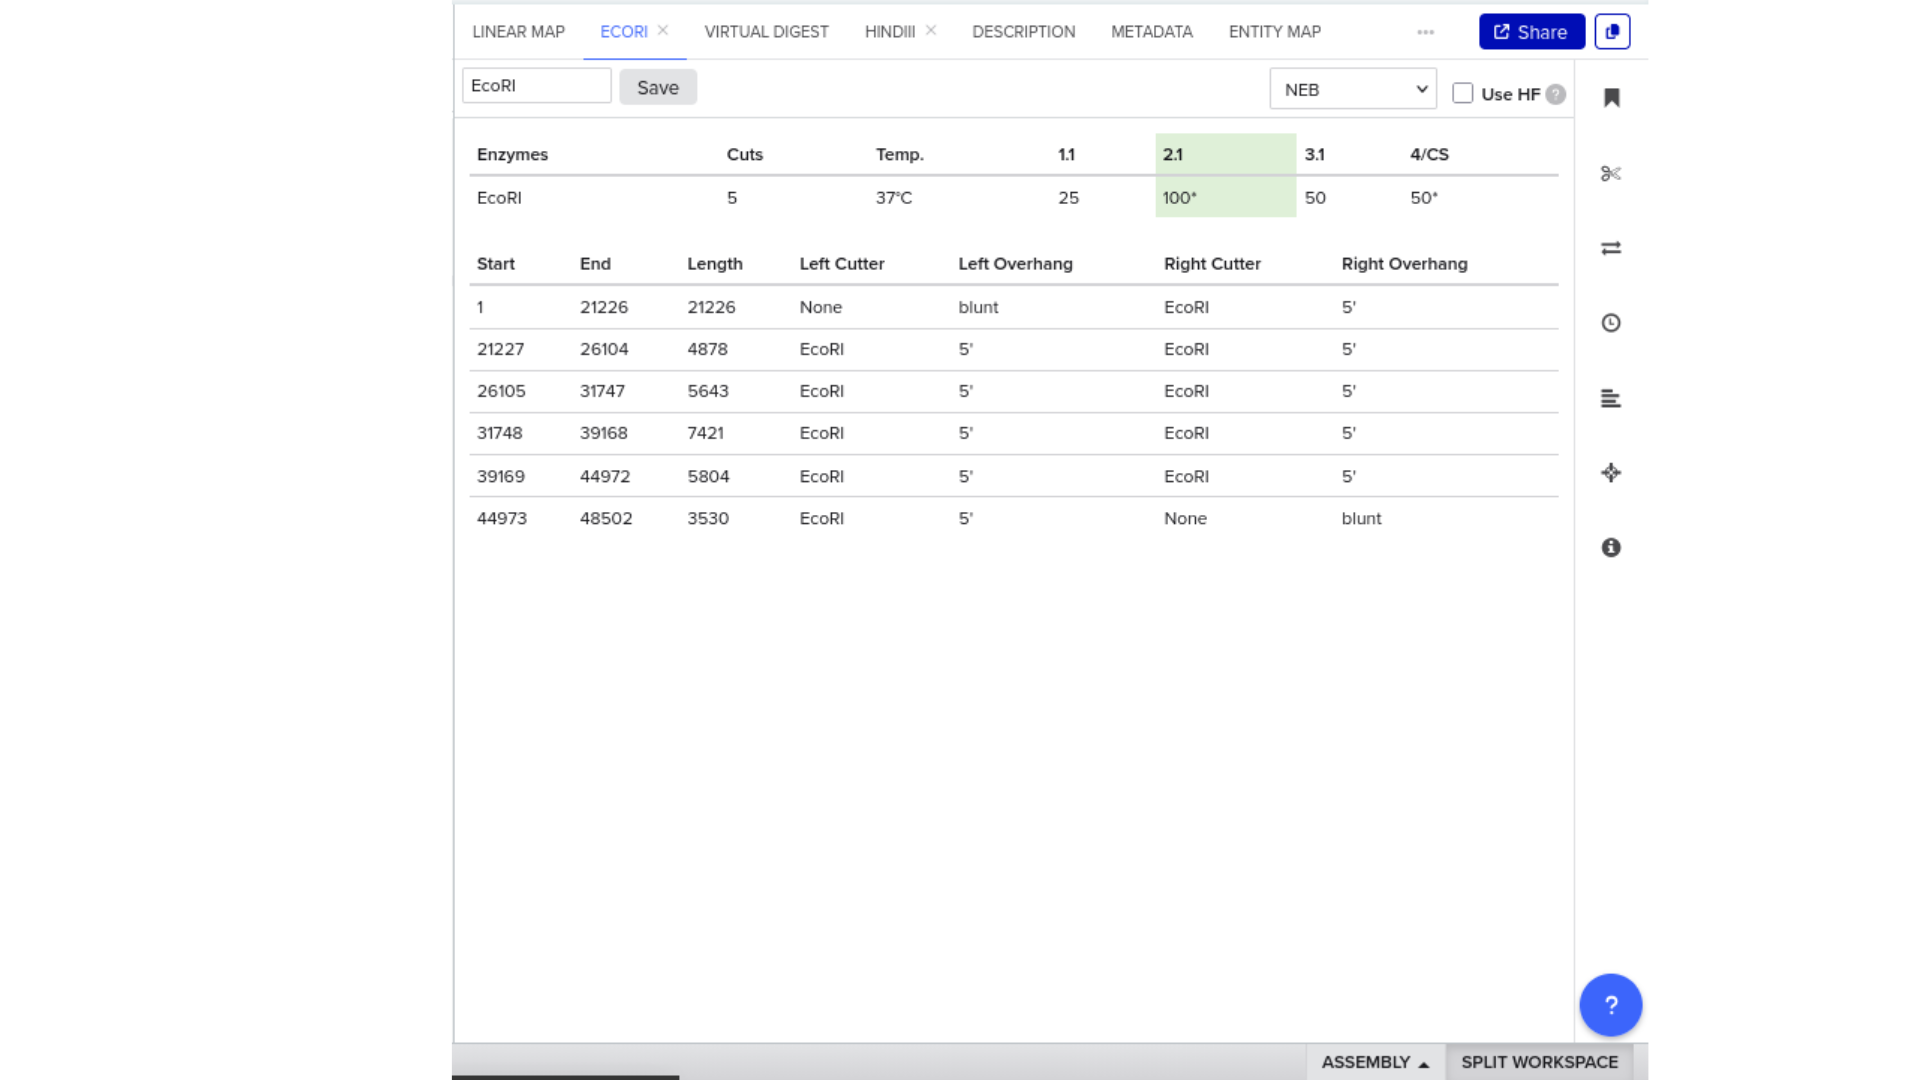
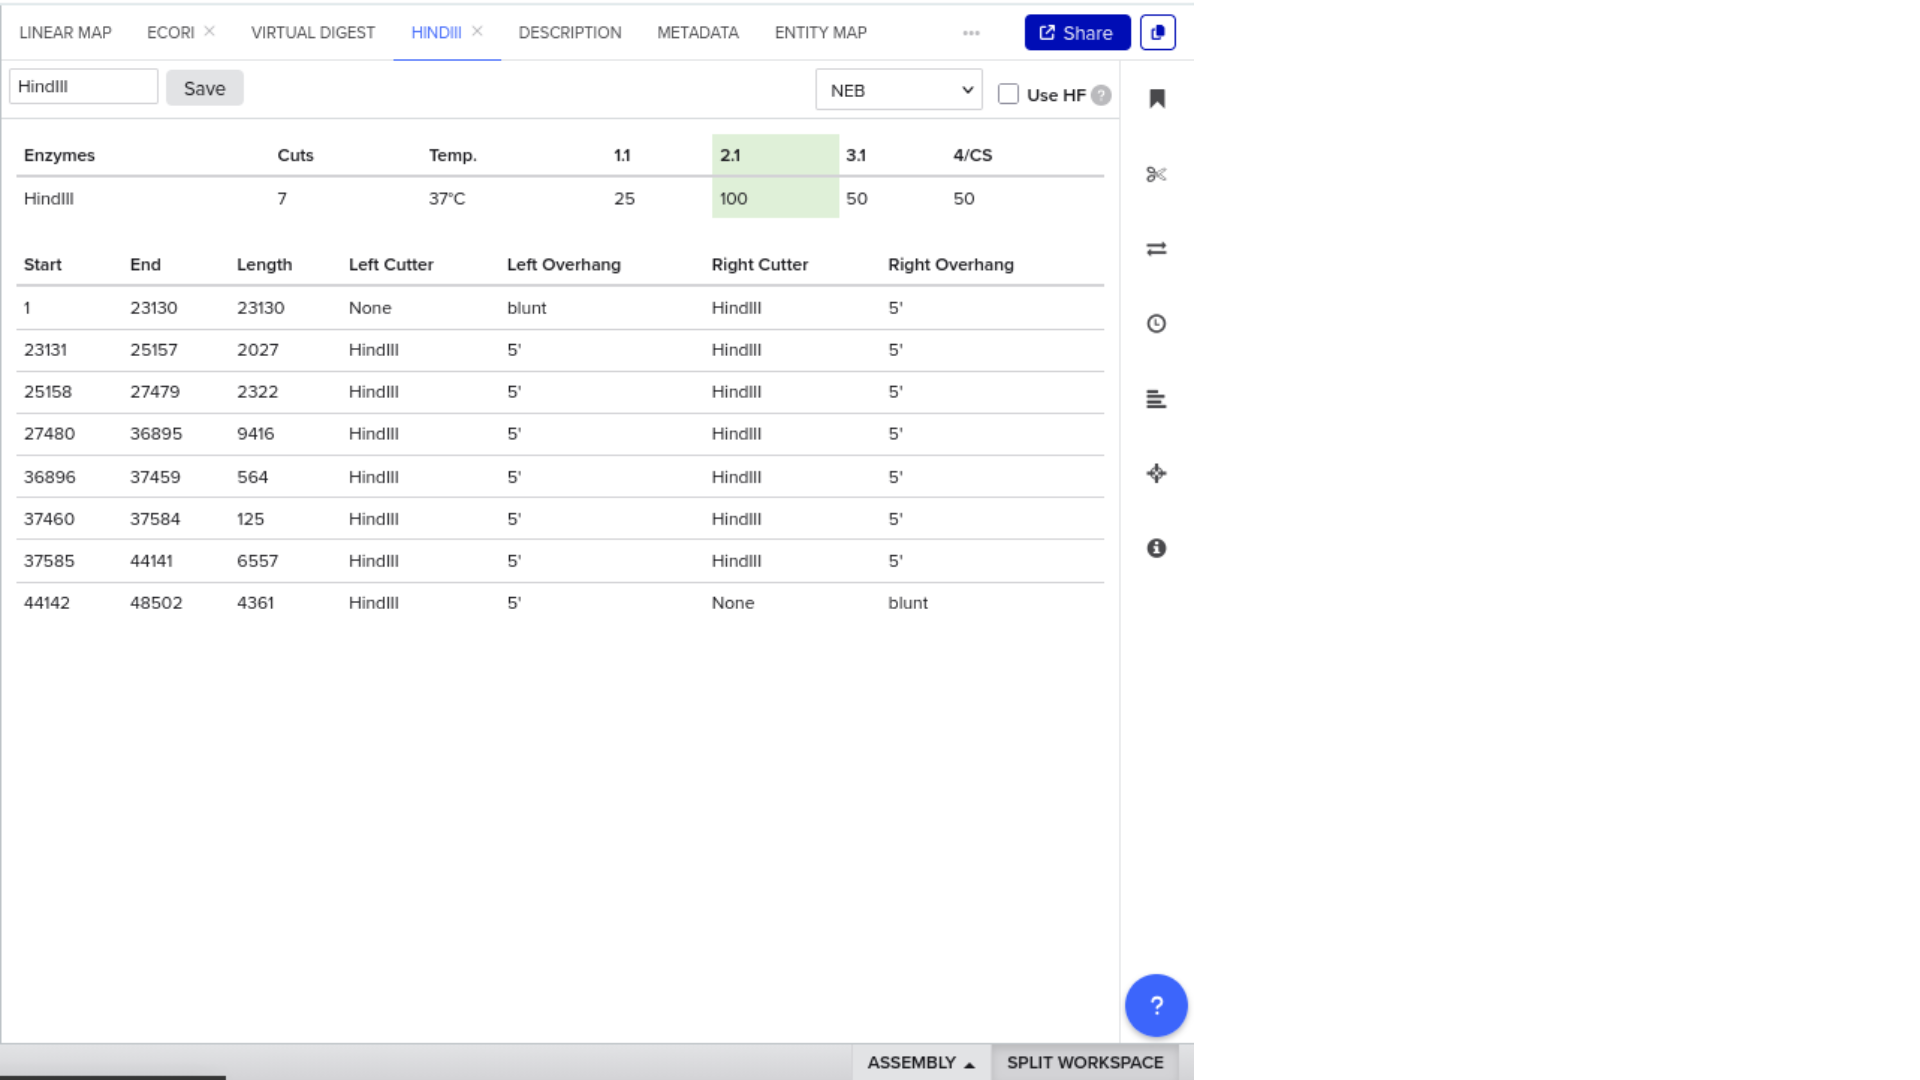
Construct: Microcin M CDS (codon-optimised for E. coli) in pUC19 backbone, directionally cloned between EcoRI and HindIII sites in the multiple cloning site.
Digest: Double digest with EcoRI and HindIII.
Expected fragments:
| Fragment | Expected size | Corresponds to |
|---|---|---|
| Vector backbone | ~2,686 bp | pUC19 linearised |
| Insert | ~250 bp | Microcin M CDS + RBS + terminator |
The gel simulation confirmed two clean bands at the expected sizes with no additional bands, consistent with a correct single-insert construct. The ~250 bp insert band sits just above the lowest visible range for a standard 1% agarose gel, which is worth noting as a practical consideration — a 1.5% gel would give better resolution at this size.
This exercise reinforced that gel verification is not just a confirmation step. The band pattern encodes structural information: the insert size confirms that the coding sequence was not duplicated or rearranged, and the vector size confirms that no additional fragments were incorporated during ligation. Reading a gel is reading a design.
Process Reflections
The workflow required iterative verification at each stage. Formatting, reading frame integrity, codon usage, annotation accuracy, and topology conversion each presented potential points of error and addressing them incrementally reduced compounding mistakes.
More importantly, it reinforced that biological engineering is not simply about inserting genes. It requires contextual awareness, ecological humility, and structural foresight.
Sequence design is only the beginning. Stability under pressure determines whether a system is viable outside controlled conditions.
This process strengthened both my technical fluency and design discipline, linking molecular implementation to ecological responsibility.
Works Cited
Addgene. (2024). Benchling: Molecular biology software for sequence design and analysis. https://www.addgene.org/protocols/benchling/
National Center for Biotechnology Information. (2024). GenBank entry CAE55705.1: Microcin M precursor peptide [Escherichia coli]. https://www.ncbi.nlm.nih.gov/protein/CAE55705.1
New England Biolabs. (2024). Lambda DNA (GenBank J02459). https://www.neb.com/en-us/tools-and-resources/genomic-dna/lambda-dna
AI Prompts Employed (Claude AI)
- Walk me through reverse translation from amino acid sequence to nucleotide in Benchling, step by step
- What does codon optimisation actually change, and what does it preserve
- How do I confirm reading frame integrity after inserting a coding sequence into an expression cassette
- What are the expected fragment sizes if I digest my construct with EcoRI and HindIII
- Why would a FASTA export fail to synthesise and what should I check before ordering
Week 3
Node participant note: I am a remote Genspace node listener based in Nigeria without onsite lab access. The Week 3 lab (Opentrons Art) was a physical session at Genspace nodes. I engaged with the automation content computationally, simulating a protocol design for ÌṢỌ’s combinatorial screening workflow as documented below.
Class Assignment — Week 3
1) Opentrons Artwork
1) Opentrons Artwork
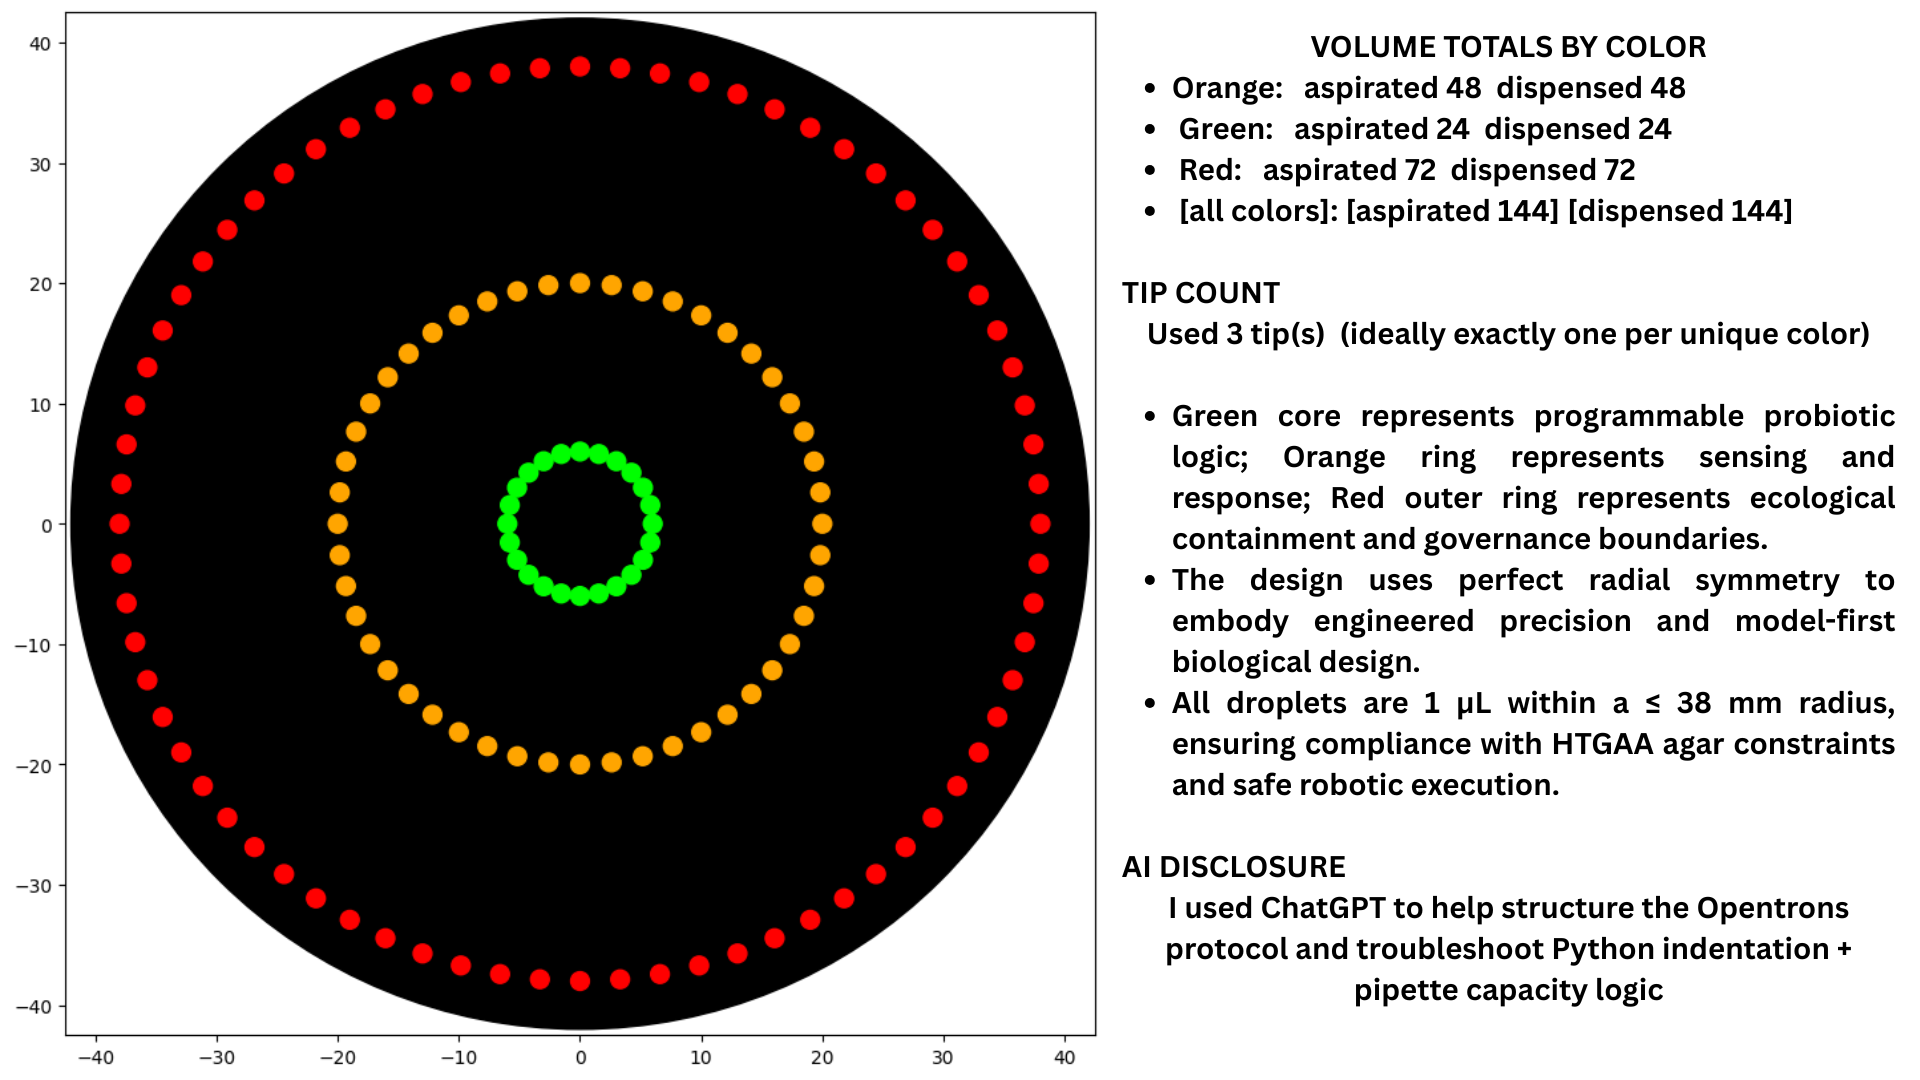
The artwork above was generated by simulating a gradient dispensing protocol across a 96-well plate layout, with each well receiving a defined volume corresponding to a pixel intensity value mapped from a source image. As a remote participant I designed the protocol logic rather than executing it physically, the plate layout encodes a pattern across four quadrants using differential dispensing volumes rather than four distinct dye colours. The design exercise forced a concrete engagement with what “precision” means at the liquid-handling level: volume accuracy at sub-microlitre scale is what separates a recognisable image from noise, which is the same constraint that governs any quantitative biological assay run on the same platform.
2) Published Papers Utilizing Automation
LabscriptAI — Autonomous Liquid-Handling Robotics Scripting
Gao et al., 2025 introduce LabscriptAI, a multi-agent framework that translates natural language experimental descriptions into validated Python scripts for heterogeneous liquid-handling robots, including Opentrons platforms.
The system integrates:
- Hierarchical task planning
- Platform-specific simulation validation
- A precise refactoring engine for targeted debugging
- Domain-specific knowledge retrieval
- Human-in-the-loop safety checkpoints
Experimental validation included:
- Cross-platform fluorescence calibration
- Automated cell-free expression and screening of 298 GFP variants
- Distributed enzyme engineering involving hazardous substrates
The central contribution is not pipetting precision alone. It is structured experimental execution with embedded validation and safety logic. Automation becomes reproducible, cross-platform, and governable.
Active Learning Directed Evolution (ALDE)
Active Learning Directed Evolution which integrates machine learning uncertainty estimation with iterative experimental screening to guide protein engineering efficiently was introduced by Yang, Lal, Arnold, et al. 2025.
ALDE automates experimental decision-making by:
- Training predictive sequence–function models
- Quantifying uncertainty across unexplored sequence space
- Selecting optimal next-round variants
- Iteratively refining search trajectories
Rather than brute-force screening, ALDE navigates design space intelligently, minimizing experimental waste while maximizing functional discovery.
Together, these systems represent complementary layers:
- ALDE enables intelligent experimental proposal
- Robotic scripting platforms enable validated execution
Automation becomes both cognitive and mechanical.
3) Automation Architecture for ÌṢỌ — Sentinel EcN
ÌṢỌ is a fitness-aware engineered probiotic system designed to sense gut context, produce targeted antimicrobial responses, and remain bounded through intrinsic containment.
Automation enables a structured Design–Build–Test–Learn loop.
A) Combinatorial Genetic Circuit Screening (requires automation)
Objective: Evaluate sensor–effector variants under growth constraints.
Automated workflow:
- Dispense transformation master mix into 96-well plate
- Add plasmid constructs into defined coordinates
- Perform serial dilution plating
- Inoculate colonies into induction gradient
- Measure OD600 for growth
- Measure fluorescence for reporter output
- Normalize fluorescence by growth to assess fitness-aware performance
Example Opentrons pseudocode:
This enables reproducible and remotely deployable transformation workflows.
B) Cell-Free Circuit Screening
To decouple metabolic burden from host growth:
- Echo transfer DNA constructs into 384-well plate
- Stamp CFPS master mix
- Dispense lysate to initiate expression
- Incubate at 37°C
- Measure fluorescence
This permits rapid high-throughput screening prior to in vivo validation.
C) Active Learning Integration
After first-round screening:
- Fit sequence–function predictive model
- Quantify uncertainty across design space
- Propose next construct library
- Upload variants for synthesis or robotic cloning
- Repeat screening
This reduces combinatorial explosion and focuses experimentation where information gain is highest.
D) 3D Printed Hardware Integration (requires automation)
To approximate ecological realism:
- Custom 96-well anaerobic incubation adapter
- Microfluidic gradient diffusion holder
- Plate alignment fixtures for reproducible layout
These hardware additions introduce environmental constraint into automated pipelines rather than assuming ideal laboratory conditions.
E) Use of Ginkgo Nebula
For larger combinatorial libraries:
- Upload sequence designs
- Automated synthesis and cloning
- High-throughput transformation
- Automated phenotyping
- Structured dataset return
Cloud laboratories enable distributed execution while preserving structured feedback into the design loop.
Summary
Automation within ÌṢỌ operates at two levels:
- Cognitive layer: uncertainty-aware experimental selection
- Execution layer: validated robotic implementation
Together, they form a closed-loop, governable engineering system that prioritizes stability under ecological pressure rather than maximal output under ideal conditions.
Works Cited
Yang, J., Lal, R. G., Bowden, J. C., et al. (2025). Active learning-assisted directed evolution. Nature Communications, 16, 714. https://doi.org/10.1038/s41467-025-55987-8
Gao, Y., Luo, Y., Li, W., Lan, Y., Jiang, H., Chen, Y., Yi, X., Li, B., Alinejad-Rokny, H., Wang, T., Fu, L., Yang, M., & Si, T. (2025). Autonomous liquid-handling robotics scripting for accessible and responsible protein engineering. bioRxiv. https://doi.org/10.1101/2025.09.30.679666
Proposed Final Project Ideas
Process Reflections
This week shifted my understanding of automation from technical convenience to systems architecture.
Initially, I approached the assignment by identifying a strong automation framework in LabscriptAI. However, as I explored complementary tools such as ALDE, it became clear that robotic precision alone is insufficient. Scalable biological engineering requires structured exploration, specifically uncertainty-aware active learning to navigate sequence and design space intelligently.
The key insight was recognizing that automation operates on two layers:
- Cognitive layer deciding what experiment to run next
- Execution layer safely and reproducibly running it
By combining both, my thinking moved beyond pipetting workflows toward a closed-loop, governable Design–Build–Test–Learn system. This reframing aligns directly with ÌṢỌ, which requires ecological realism, fitness awareness, and safety constraints.
Another important shift was recognizing the role of governance. Automation increases capability, but without structured safety checkpoints, biosecurity screening, and human oversight, it becomes fragile or irresponsible. Designing the automation architecture required explicit consideration of containment, ecological competition, and reproducibility.
This process strengthened three core skills:
- Systems-level integration rather than tool-level selection
- Designing for constraint rather than brute-force optimization
- Framing automation as a platform rather than a procedure
Ultimately, I realized that my final project is not only an engineered probiotic. It is a structured, uncertainty-aware engineering pipeline for responsible biological deployment.
Works Cited
Gao, Y., Luo, Y., Li, W., Lan, Y., Jiang, H., Chen, Y., Yi, X., Li, B., Alinejad-Rokny, H., Wang, T., Fu, L., Yang, M., & Si, T. (2025). Autonomous liquid-handling robotics scripting for accessible and responsible protein engineering. bioRxiv. https://doi.org/10.1101/2025.09.30.679666
Yang, J., Lal, R. G., Bowden, J. C., et al. (2025). Active learning-assisted directed evolution. Nature Communications, 16, 714. https://doi.org/10.1038/s41467-025-55987-8
AI Prompts Employed (Claude AI)
- Compare ALDE and LabscriptAI to see if they work well together as a system
- Design a closed-loop setup where AI chooses experiments and robots run them
- List what I would automate for ÌṢỌ (Sentinel EcN)
- Draft simple Opentrons-style pseudocode for running transformation reactions
- Integrate 3D printed tools, cloud labs, and governance into the automation workflow
Week 4
Node participant note: I am a remote Genspace node listener based in Nigeria without onsite lab access. The Week 4 lab (Protein Design I) was fully computational — ESMFold inference, ESM2 mutational scanning, latent space analysis, ProteinMPNN inverse folding — and I completed all exercises remotely using Google Colab and local tools. The outputs documented below represent my complete engagement with the lab material.
Class Assignment — Week 4
Part A. Conceptual Questions
1) How many molecules of amino acids do you take with a piece of 500 grams of meat?
Assumptions: lean meat is ~20% protein by mass, average amino acid residue ~100 Da (≈100 g/mol).
Step 1: Protein mass in 500 g meat
500 g × 0.20 = 100 g protein
Step 2: Convert to moles of amino acid residues
100 g ÷ (100 g/mol) = 1 mole
Step 3: Convert moles to molecules
1 mole = 6.022 × 10²³ molecules
Answer: approximately 6.0 × 10²³ amino acid molecules (about 600 sextillion) which is actually the Avogadro’s Number in chemistry, or one mole of water
2) Why do humans eat beef but do not become a cow, eat fish but do not become fish?
Because eating provides raw materials, not biological identity. Digestion breaks proteins, fats, and nucleic acids into small molecules such as amino acids and fatty acids. By the time nutrients enter the bloodstream, they are no longer “cow” or “fish,” they are shared chemical building blocks used by all life.
What determines what we become is our genome and regulatory systems. Human cells assemble human proteins because human DNA encodes the instructions. Food is like construction material. The same bricks can build different structures depending on the blueprint.
3) Why are there only 20 natural amino acids?
The “20” is an evolutionary, chemical, and informational compromise. The standard amino acids provide enough chemical diversity for folding, catalysis, and signaling while keeping translation machinery stable and error-tolerant. Expanding beyond this set would require major coordinated changes to tRNAs, aminoacyl-tRNA synthetases, and ribosomes, which coul possibly be evolutionarily costly.
Also, the genetic code has 64 codons, which comfortably encodes 20 amino acids plus stop signals. The system stabilized around a set that is chemically sufficient and operationally efficient.
Notably, the set is not absolutely fixed. Biology also uses selenocysteine and pyrrolysine via specialized mechanisms, and synthetic biology can incorporate many noncanonical amino acids in engineered systems.
4) Can you make other non-natural amino acids? Design some new amino acids.
Yes. Chemists and synthetic biologists have created many noncanonical amino acids. Conceptually, you keep the standard amino acid backbone and alter the side chain to introduce new properties. Below are conceptual designs (structural ideas, not synthesis instructions):
Fluoro-leucine variant
Replace a leucine side-chain hydrogen with fluorine to increase stability and hydrophobicity.Photo-switch amino acid
Add a light-responsive group (azobenzene-like) that changes shape under light, enabling reversible control of protein behavior.Metal-binding amino acid
Design a side chain with a strong chelating motif to coordinate metals more tightly than histidine, enabling engineered metalloenzymes.Redox-active amino acid
A side chain designed for reversible electron transfer beyond cysteine/tyrosine chemistry, expanding redox options.Bulky steric-block amino acid
A large aromatic side chain that can restrict folding paths or block active sites to tune structure and function.Synthetic polar-gradient amino acid
A side chain with donor/acceptor geometry not present in the canonical set to enable new hydrogen-bonding patterns.
Practical considerations for synthetic possibility include recognition by synthetases, ribosomal fit, folding effects, toxicity, and translational fidelity.
5) Where did amino acids come from before enzymes and before life started?
Amino acids can arise through prebiotic chemistry. Three common sources are:
Atmospheric chemistry: Early Earth gases plus energy (lightning, UV, heat) can generate amino acids (supported by classic Miller–Urey-type results).
Hydrothermal vents: Mineral surfaces, heat, and gradients can promote organic synthesis and concentration of building blocks.
Extraterrestrial delivery: Meteorites such as Murchison contain amino acids, showing formation can occur beyond Earth and be delivered.
Life later evolved enzymes to produce amino acids more efficiently and selectively.
6) If you make an α-helix using D-amino acids, what handedness would you expect?
A polypeptide made of D-amino acids would form a left-handed α-helix. Natural α-helices are right-handed because proteins use L-amino acids; mirroring chirality mirrors the preferred helix.
7) Can you discover additional helices in proteins?
Within natural peptide chemistry, backbone geometry is constrained by peptide bond planarity, allowed φ/ψ angles, and hydrogen bonding rules. However, we can still expand what we call “helical forms” in practice by:
- identifying less common helical geometries in known proteins
- designing novel helices computationally
- engineering sequences that stabilize alternative helix types under specific conditions
So “new helices” are often new realizations within physical constraints rather than completely new backbone physics.
8) Why are most molecular helices right-handed?
Because biological polymers are built from chiral monomers that life selected early. L-amino acids favor right-handed α-helices; D-sugars in DNA favor right-handed B-DNA. Once one chirality dominated, evolution locked in downstream structural preferences across biology.
9) Why do β-sheets tend to aggregate? What is the driving force?
β-sheets aggregate because their edges expose backbone hydrogen bond donors and acceptors that can be satisfied by forming intermolecular hydrogen bonds. Aggregation is further stabilized by:
- Backbone hydrogen bonding networks across molecules
- Hydrophobic packing as β-strands often present with alternating polar/hydrophobic patterns
- Planar stacking geometry enabling tight van der Waals packing
These same stabilizing forces underlie amyloid formation when misregulated.
Part B. Protein Analysis and Visualization
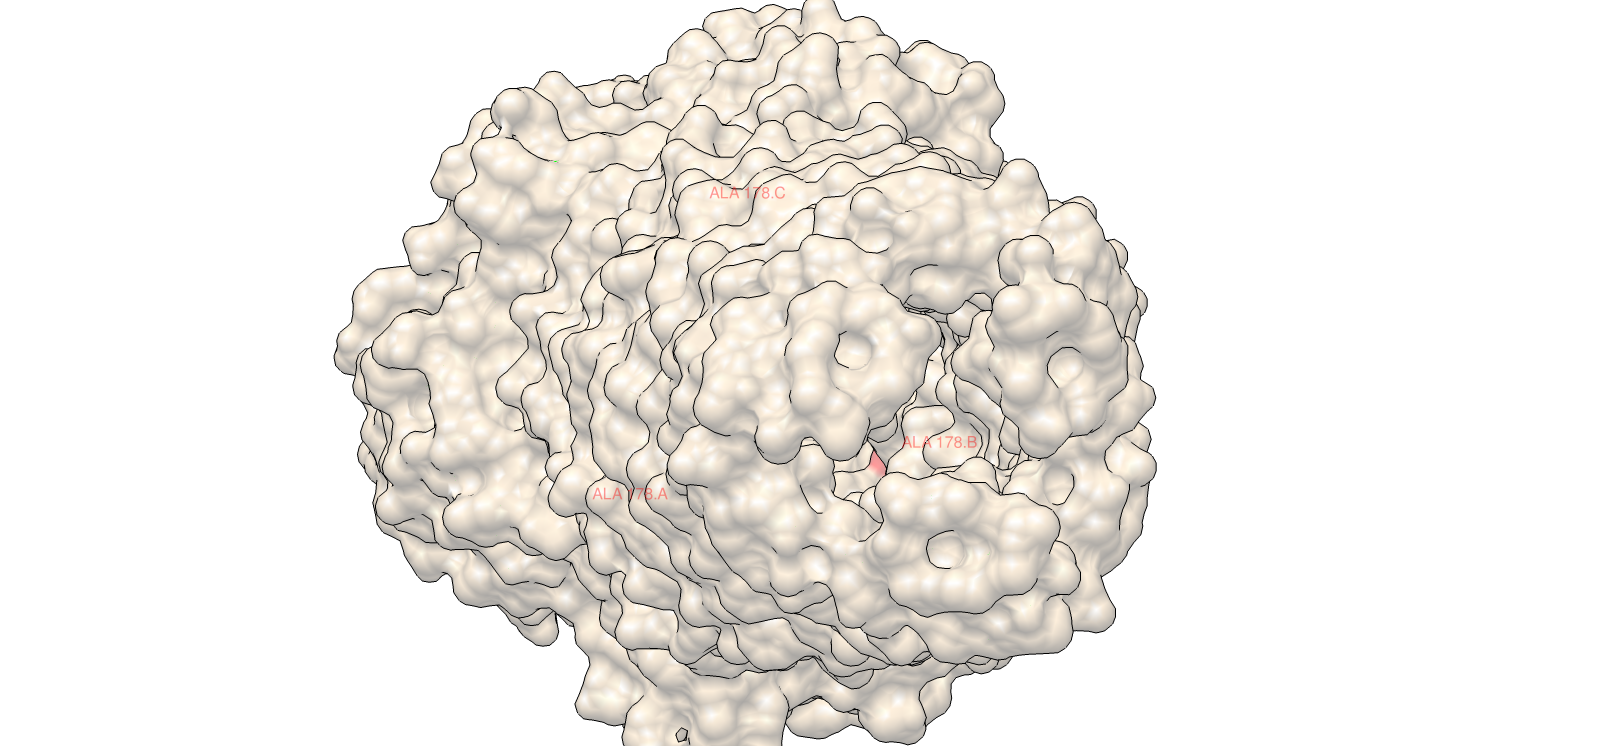
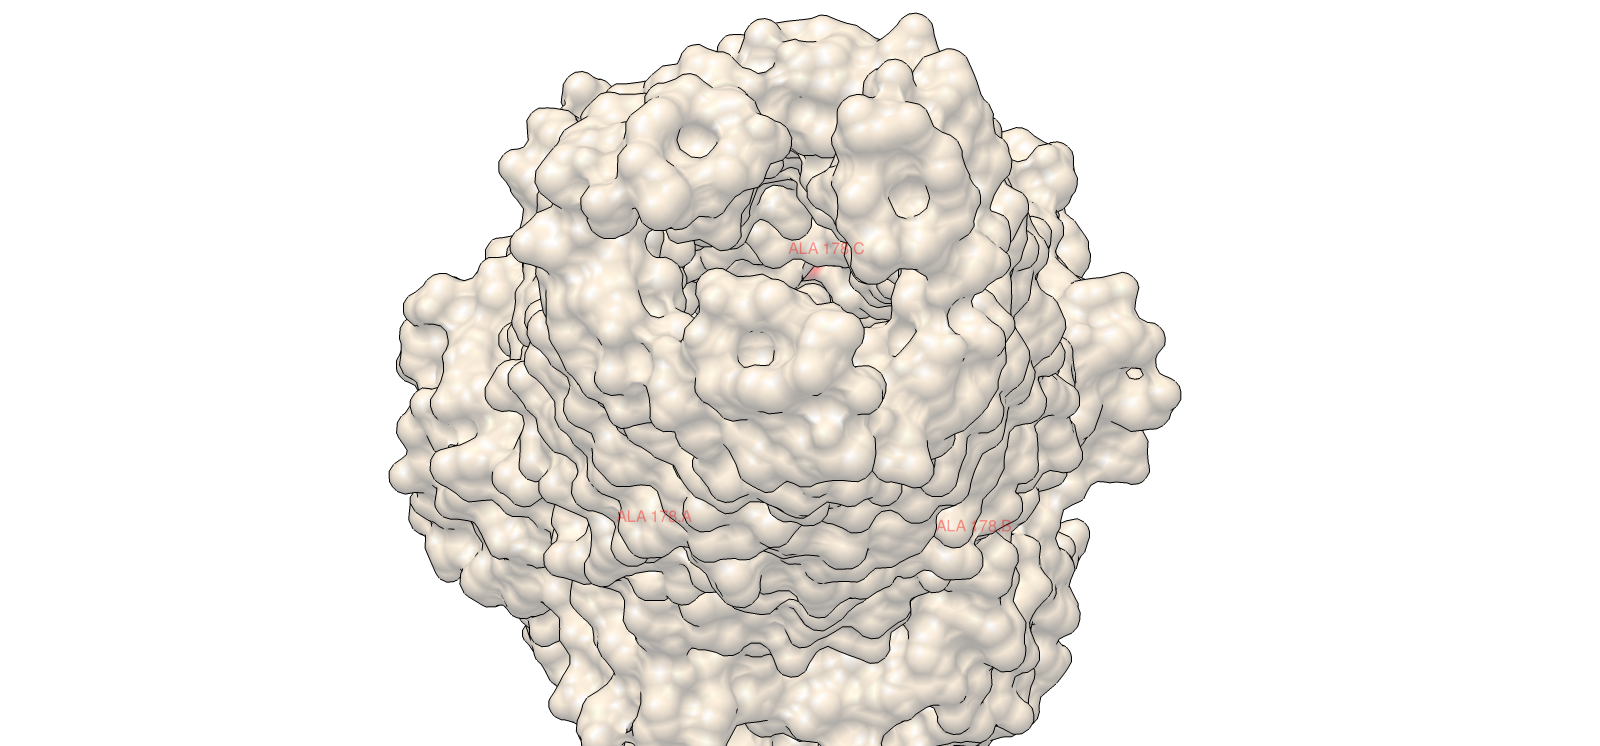
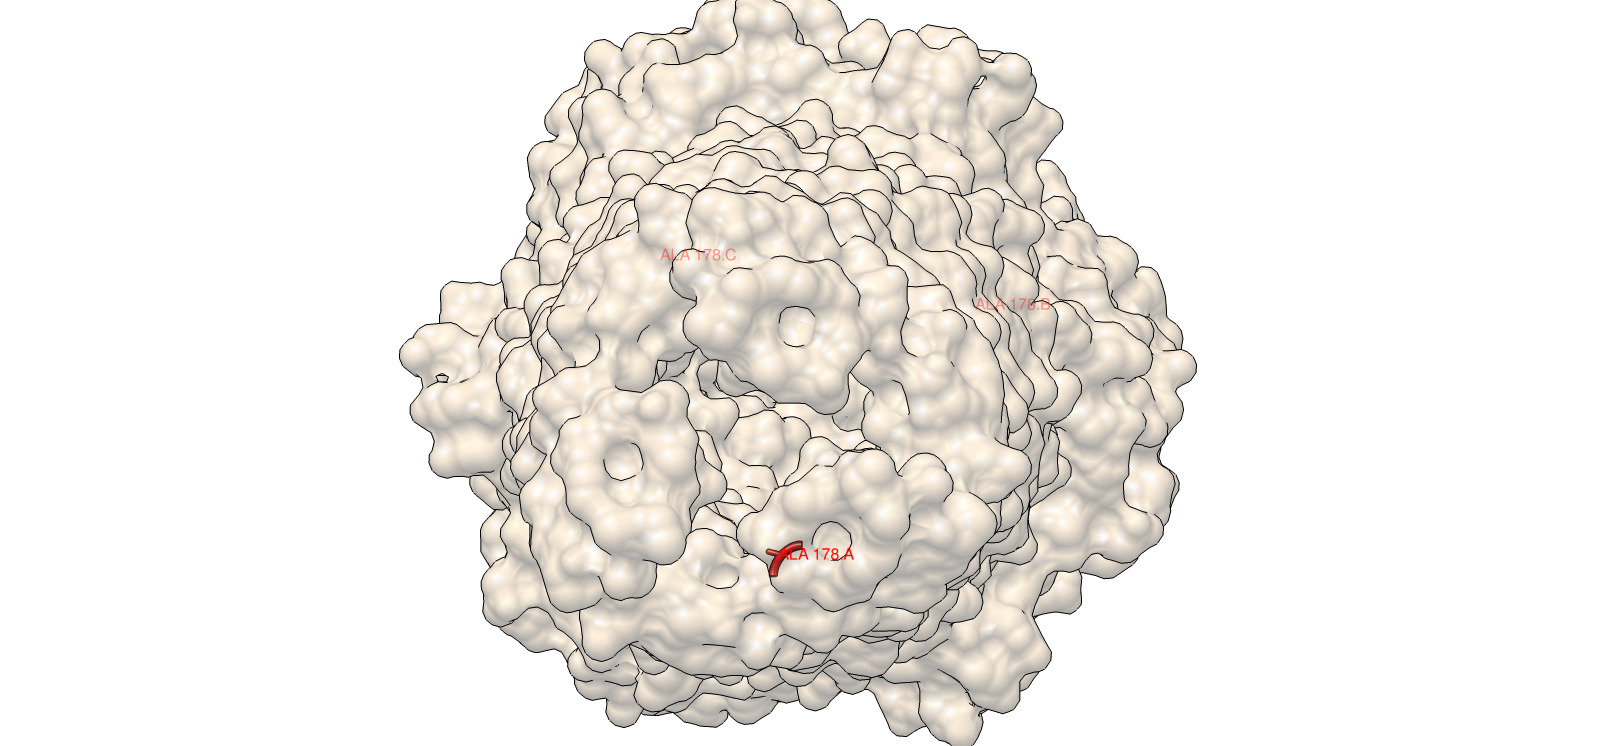
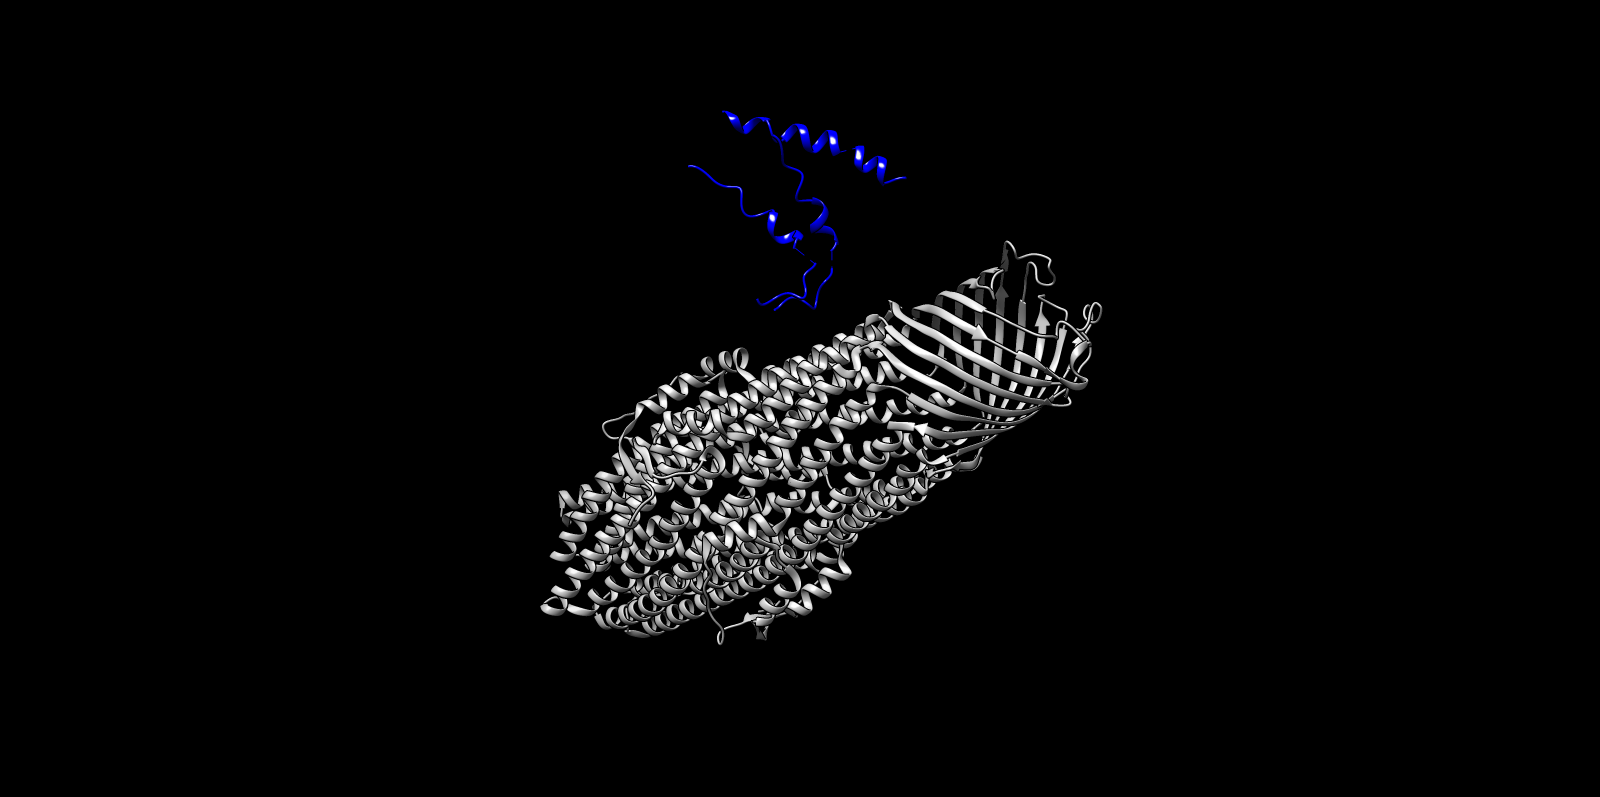
1) Why TolC: Structural Proxy for MccM
MccM (the current ÌṢỌ effector candidate) lacks a solved crystal structure in the PDB, making it unsuitable as the direct target for structure-guided computational exercises requiring an experimental backbone. TolC was selected as the structural anchor because it is the confirmed outer membrane export channel for MccH47 and related microcins, is crystallographically well-resolved at 2.10 Å (PDB: 1EK9), and represents a biologically justified choice for studying the efflux arm of the same microcin system I am engineering.
2) Amino acid sequence and basic properties
Sequence (73 AA):
MRKLSENEIKQISGGDGNDGQAELIAIGSLAGTFISPGFGSIAGAYIGDKVHSWATTATVSPSMSPSGIGLSS
- Length: 73 amino acids
- Molecular weight (calculated): ~8.03 kDa
- Most frequent amino acids: Serine(S) and Glycine(G) both occuring 12 times
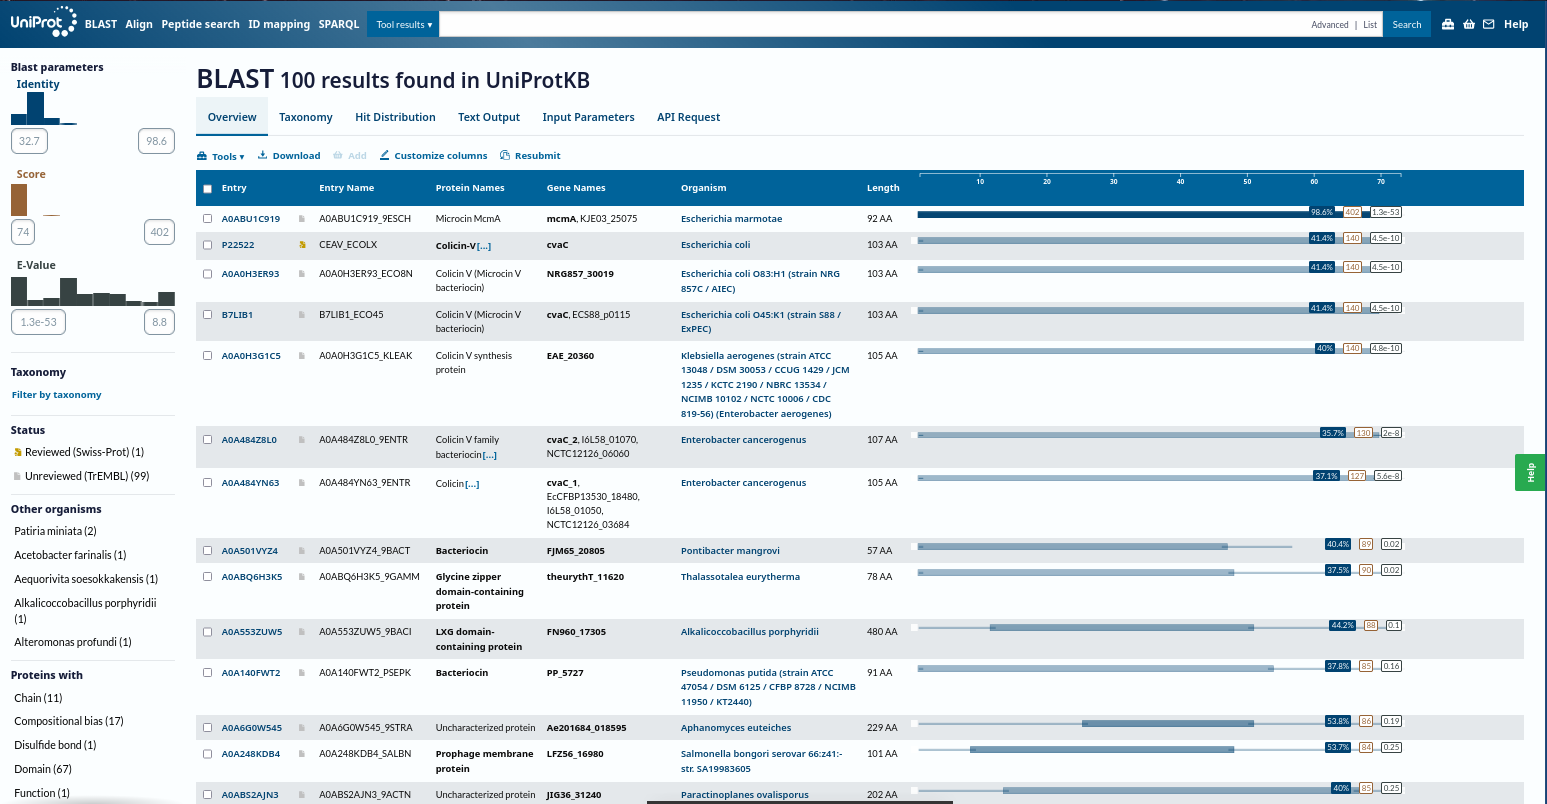
- Homologs (UniProt BLAST): ~100 protein sequence homologs
- Protein family: Microcin (Class II) antimicrobial peptide family
Amino acid frequencies
| Amino acid | Count | Percent |
|---|---|---|
| S | 12 | 16.44% |
| G | 12 | 16.44% |
| I | 8 | 10.96% |
| A | 7 | 9.59% |
| L | 4 | 5.48% |
| T | 4 | 5.48% |
| K | 3 | 4.11% |
| E | 3 | 4.11% |
| D | 3 | 4.11% |
| P | 3 | 4.11% |
| M | 2 | 2.74% |
| N | 2 | 2.74% |
| Q | 2 | 2.74% |
| F | 2 | 2.74% |
| V | 2 | 2.74% |
| R | 1 | 1.37% |
| Y | 1 | 1.37% |
| H | 1 | 1.37% |
| W | 1 | 1.37% |
3) Structure Page of My Choice Microcin Protein (RCSB)
Microcin systems, especially my initial Microcin A systems could not be resolved as standalone structures in a way that supports the expected full visualization. To meet the requirements for a high-quality structure with clear visualization features, I used TolC as the structural anchor because it is directly relevant to microcin export and is well characterized in the literature.
- Protein: TolC (E. coli outer membrane export channel)
- PDB: 1EK9
- Resolution: 2.10 Å
- Classification: Outer membrane channel, efflux pump component
Other molecules present experimentally apart from protein include:
- Solvent molecules: 1,508 solvent atoms
- Detergents/Surfactants: Dodecyl glucopyranoside, hexyl glucopyranoside, heptyl glucopyranoside, and octyl glucopyranoside
- Salts/Buffers: Sodium chloride, magnesium chloride, and Tris buffer
- Additives: PEG 400, PEG 2000 MME, and 1,2,3-heptanetriol
RCSB links:
https://www.rcsb.org/structure/1EK9
https://doi.org/10.2210/pdb1EK9/pdb
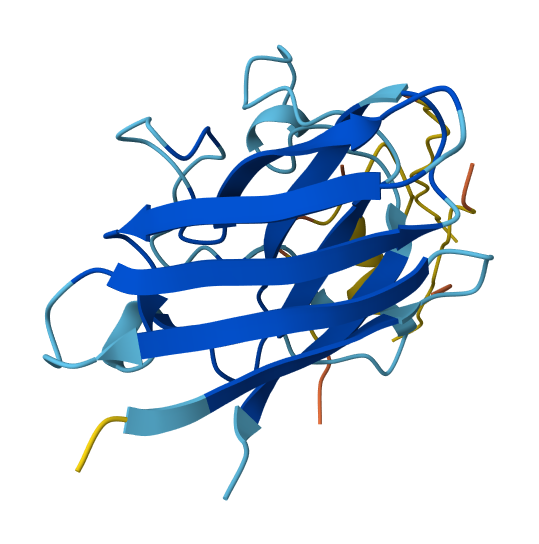
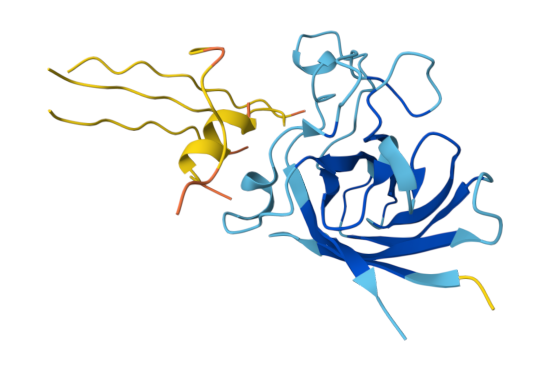
4) 3D Molecular Visualization
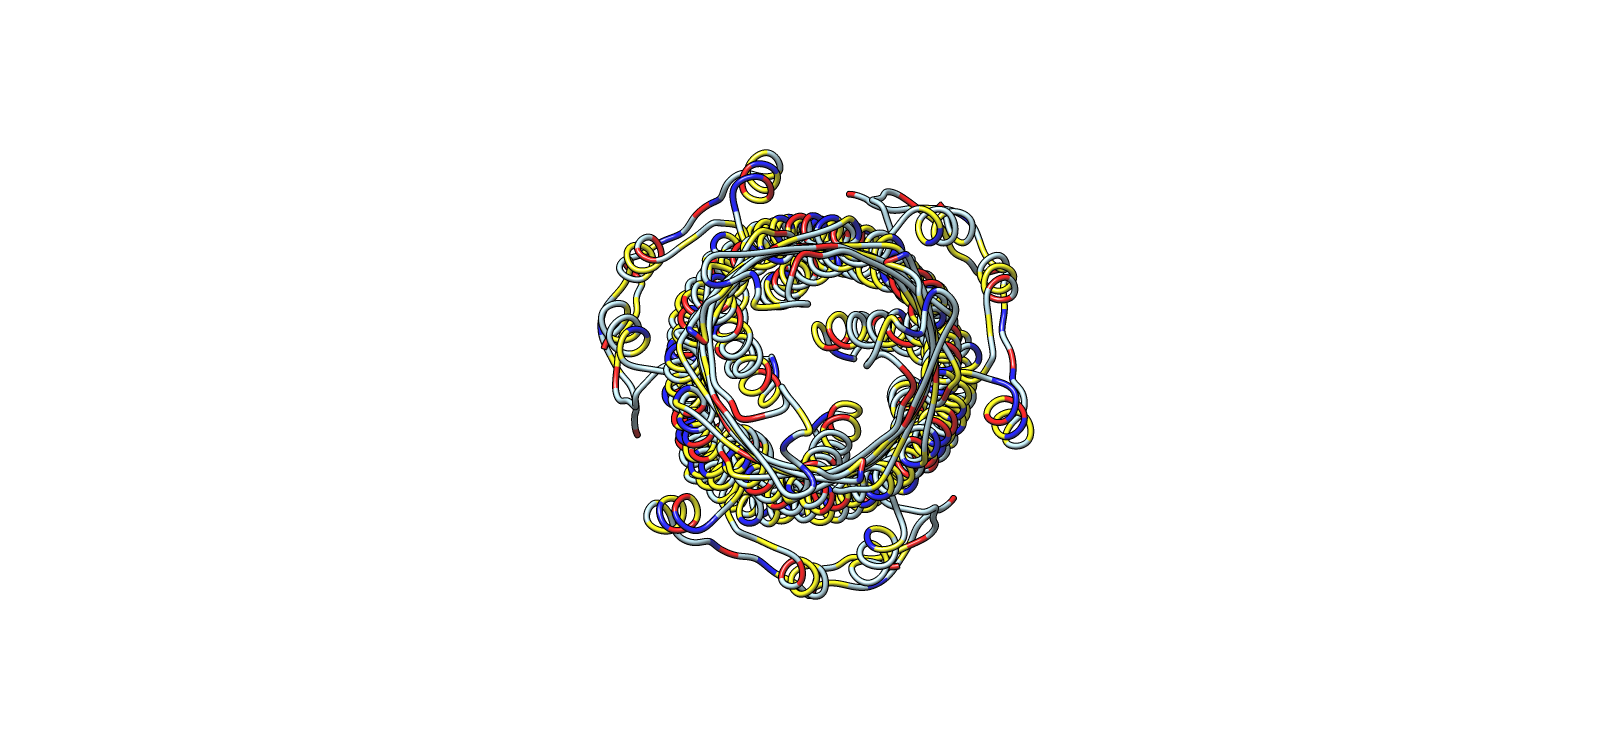
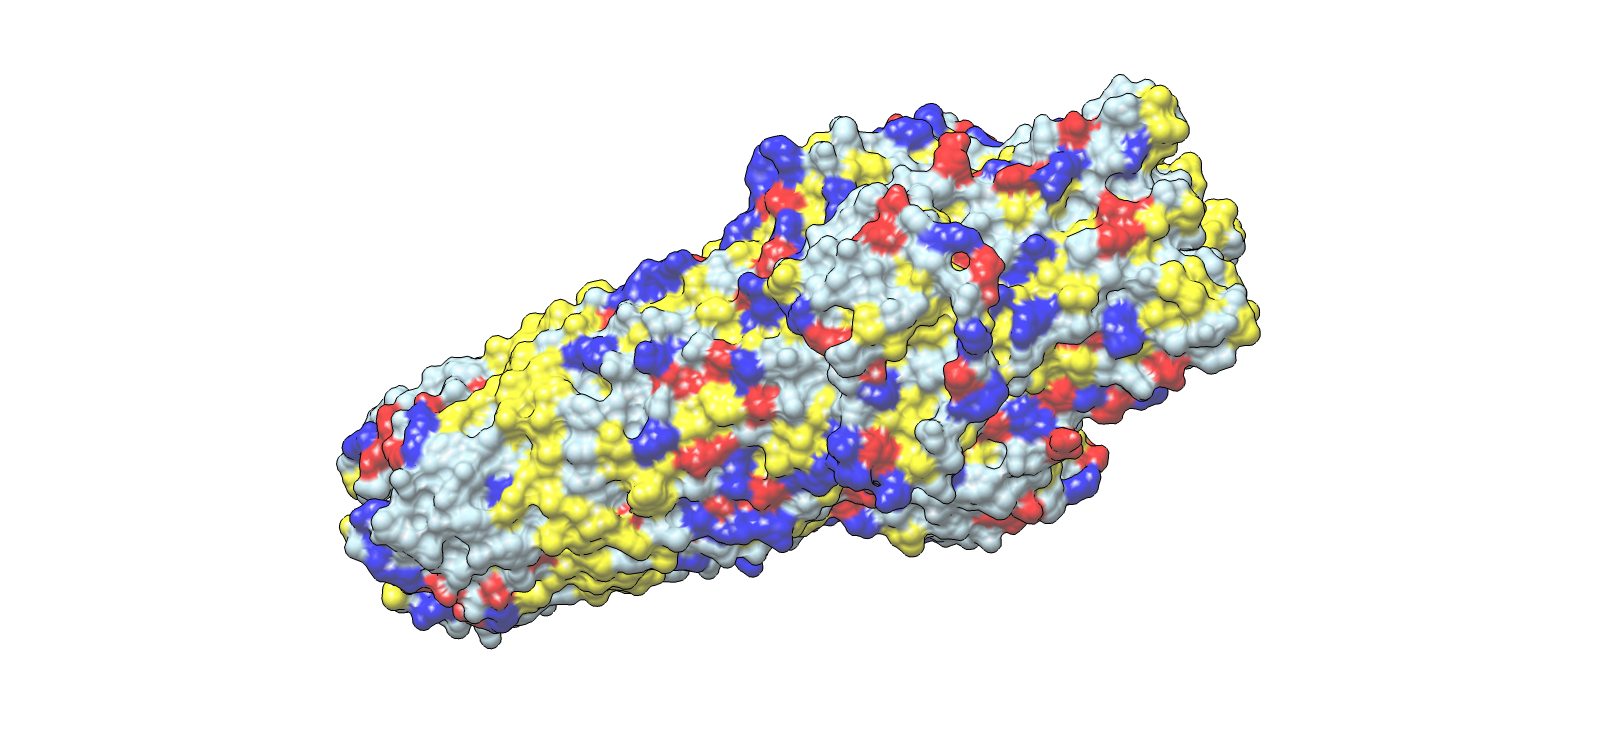
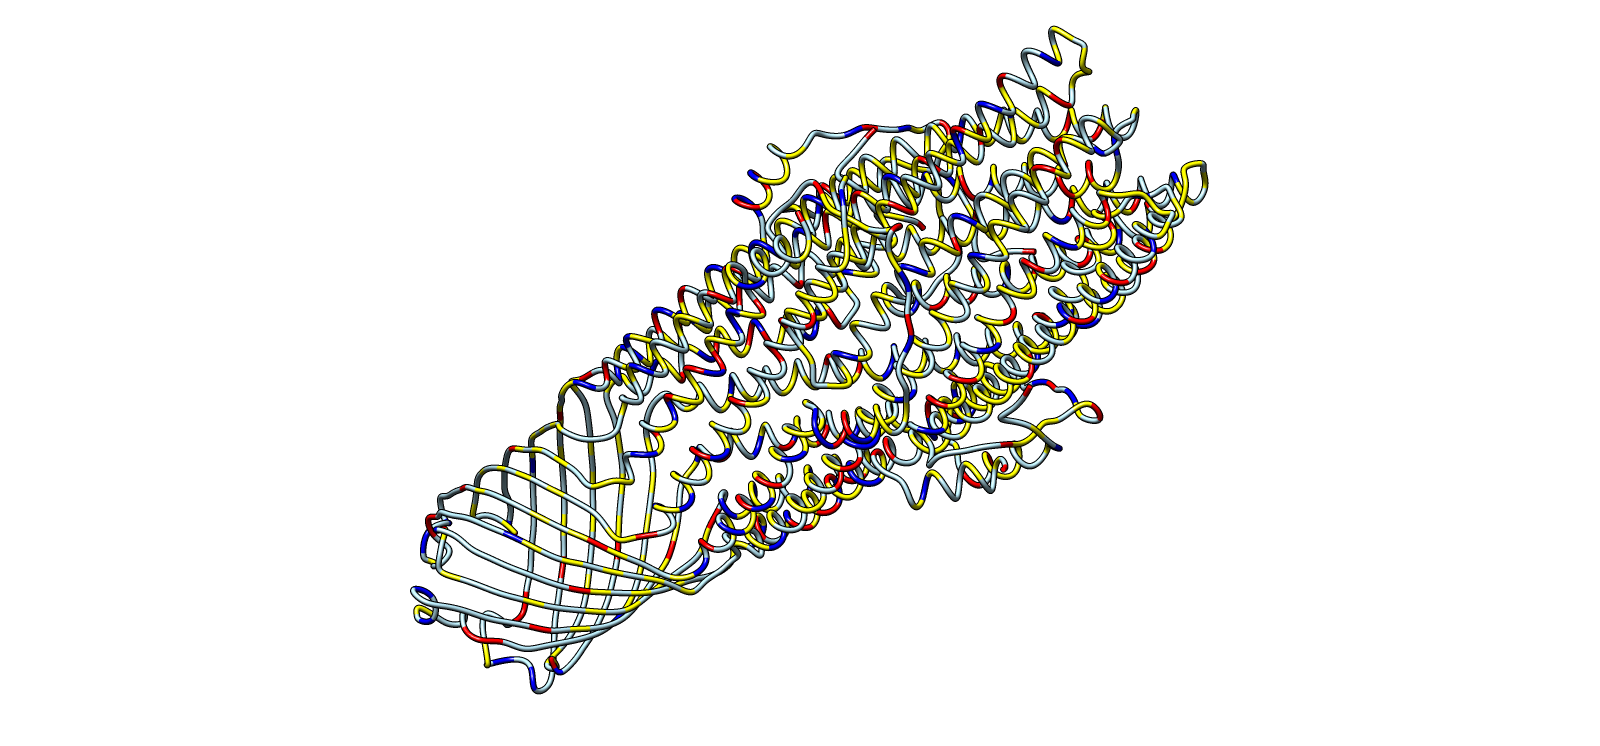
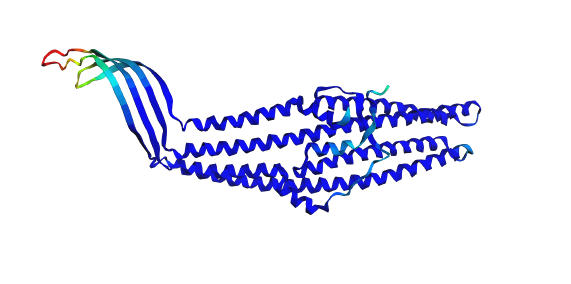
Trimer architecture, surface envelope with internal helical core
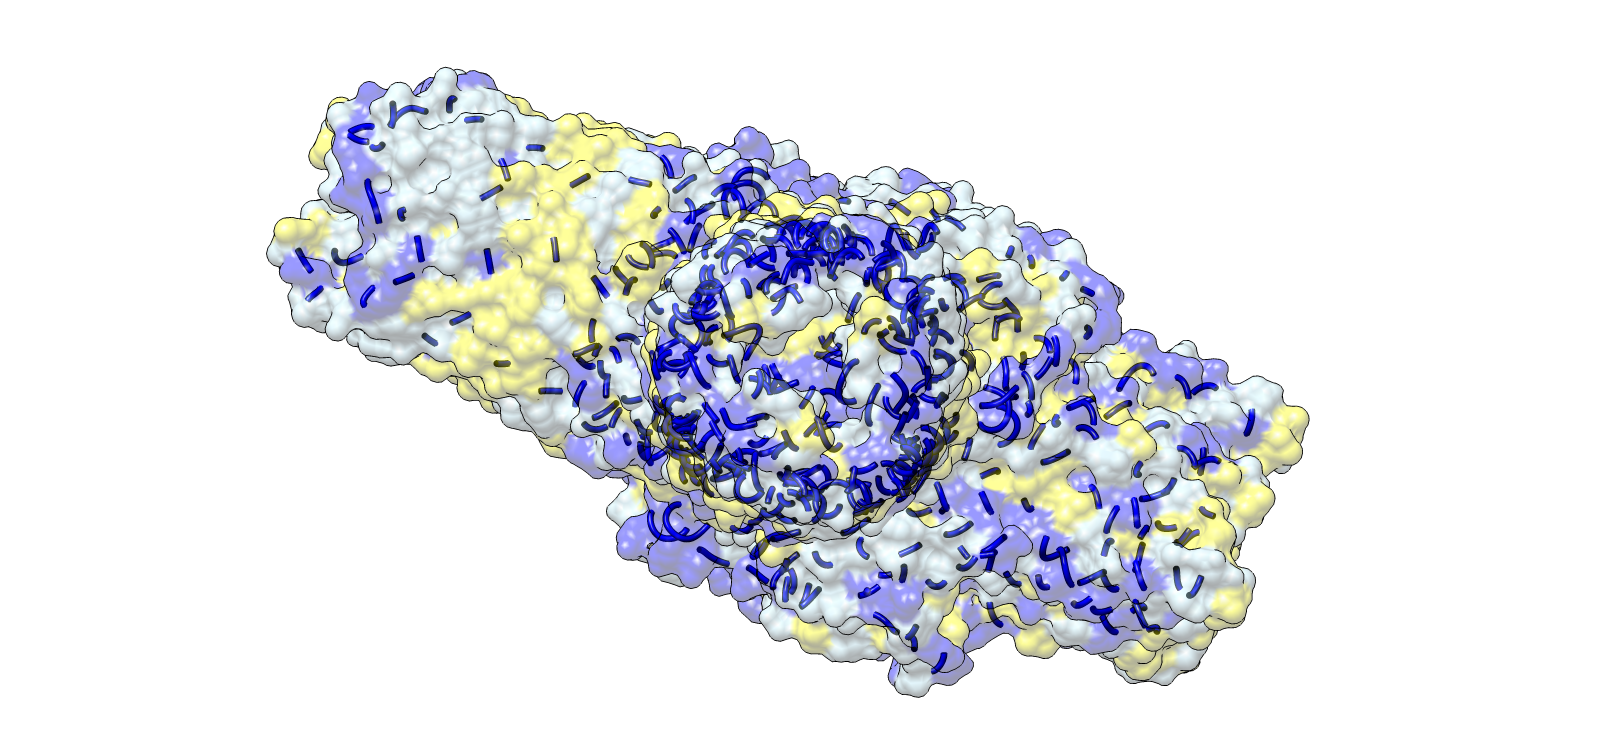
Axial top view highlighting symmetry and central channel
Surface electrochemical landscape showing charge distribution
Lateral chemical view emphasizing membrane-facing hydrophobics
Ribbon colored by residue chemistry to show lumen and interfaces
Ribbon-only structural architecture for fold clarity
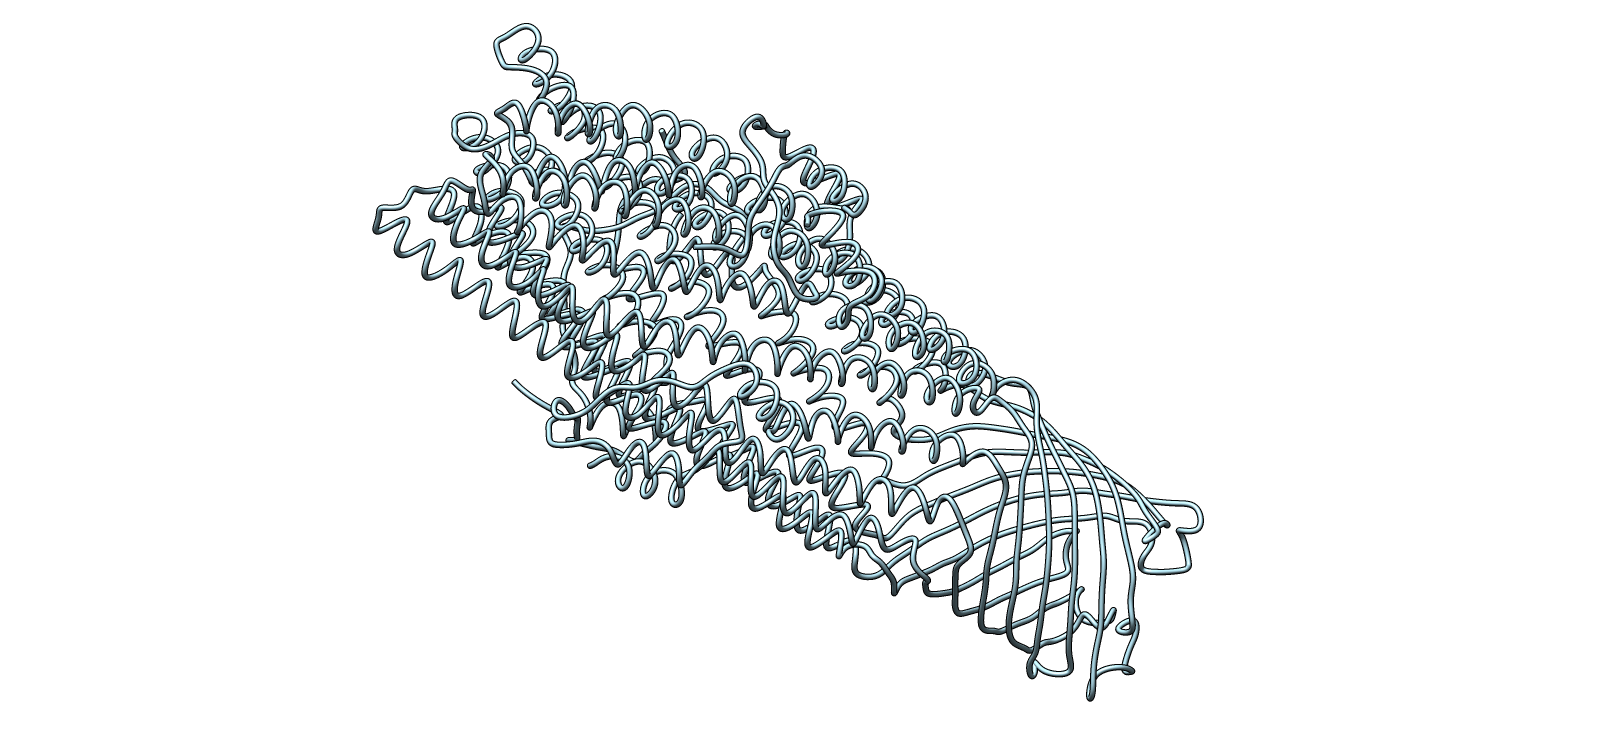
Color Representation of Selected Images
| Image | Title | Representation | Color | Meaning |
|---|---|---|---|---|
| 1 | Surface envelope with helical core overlay | Transparent surface + ribbon | Light grey | Outer surface |
| Yellow | Hydrophobic surface regions | |||
| Blue | Helical channel core | |||
| 2 | Central channel, axial top view | Ribbon | Yellow | Chain A |
| Blue | Chain B | |||
| Light grey | Chain C | |||
| 3 | Surface electrochemical landscape | Surface | Red | Acidic residues |
| Blue | Basic residues | |||
| Yellow | Hydrophobic residues | |||
| Light grey | Neutral/other | |||
| 4 | Outer membrane barrel, lateral chemical view | Surface | Red/Blue/Yellow/Grey | Same chemistry scheme |
| 5 | Ribbon colored by residue type | Ribbon | Red/Blue/Yellow/Grey | Residue chemistry |
| 6 | Secondary structure architecture | Ribbon | Light cyan | Backbone only |
Microcin A processing pathway (my initial microcin protein choice)
| Step | Protein | Function | Role in pathway | Stage |
|---|---|---|---|---|
| 1 | MccA | Precursor peptide | Scaffold for toxin | Precursor |
| 2 | MccB | Adenyltransferase | Adds AMP to C-terminus | Modification |
| 3 | MccD | Aminopropyltransferase | Adds aminopropyl group | Modification |
| 4 | MccC | Efflux pump | Exports mature microcin | Export / Resistance |
| 5 | MccE | Acetyltransferase | Detoxifies microcin in producer | Immunity |
| 6 | MccF | Serine peptidase | Cleaves toxic moiety | Immunity |
Microcin M processing pathway (my current choice after further exploring the literature)
| Step | Gene / protein | Function | Role in pathway |
|---|---|---|---|
| 1 | mcmA | MccM precursor peptide | Ribosomal scaffold |
| 2 | mcmI | Immunity protein | Producer self-protection |
| 3 | mcmL | Glycosyltransferase-like | Supports siderophore moiety preparation |
| 4 | mcmK | Esterase-like | Supports siderophore processing |
| 5 | mchC / mchD | Linker proteins | Attachment steps (biochemistry not fully resolved) |
| 6 | mchF | ABC transporter | Exports mature microcin |
| 7 | mchE | Membrane fusion protein | Works with export machinery |
| 8 | tolC | Outer membrane channel | Final export conduit |
Part C. Using ML-Based Protein Design Tools
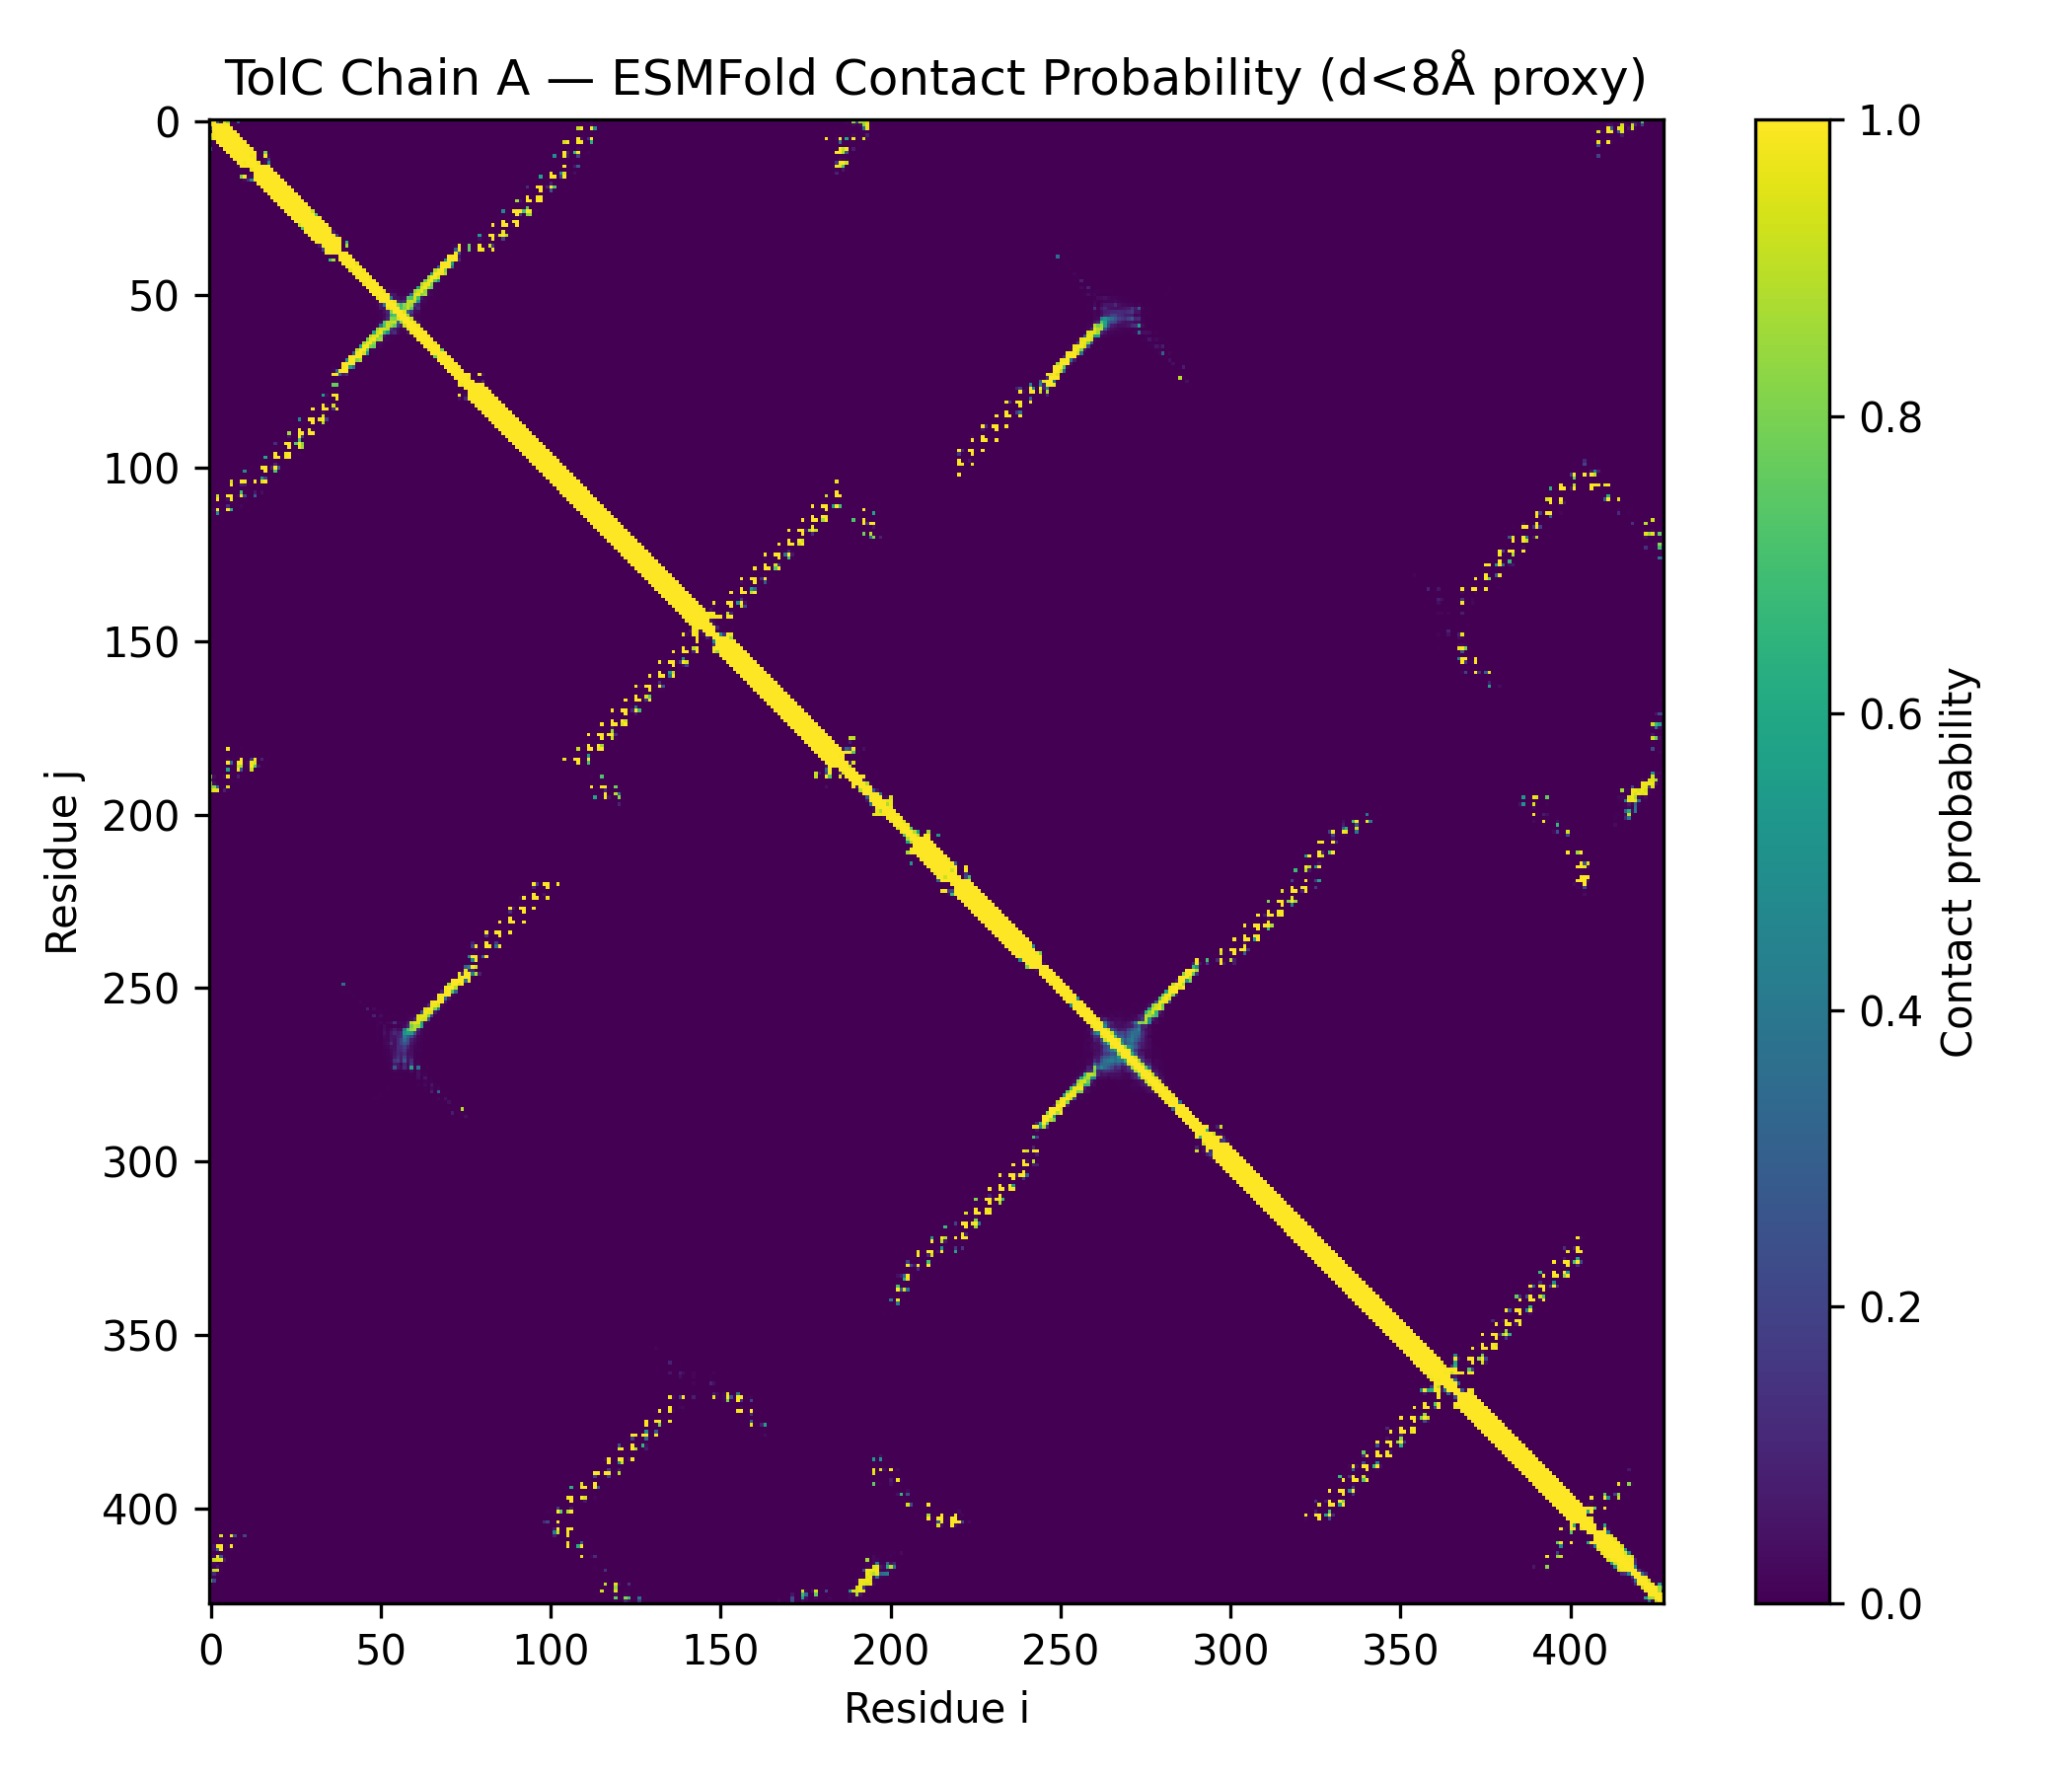
1A) Deep Mutational Scan (ESM2)
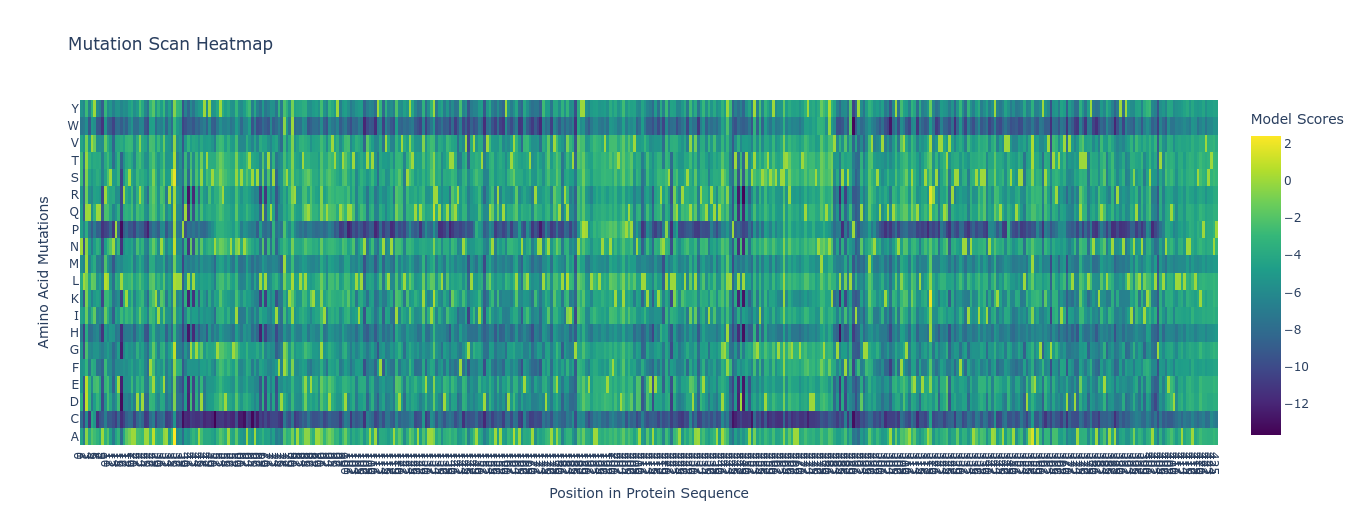
Using ESM2, I generated an unsupervised deep mutational scan across the TolC sequence. The heatmap showed multiple constrained regions, visible as vertical bands, suggesting positions that are broadly intolerant to mutation.
A clear example was residue 178. The wild-type residue is tryptophan (W). The mutation W178D produced a relative log-likelihood score of −2.38, indicating a strong model penalty. Structural inspection supports this: W178 is buried within the TolC trimeric structure. Replacing a bulky hydrophobic aromatic residue with a negatively charged aspartate is expected to disrupt local hydrophobic packing and weaken the inter-chain interface.
Supporting snapshots:
ESMFold inference (TolC chain)
Using the notebook workflow:
- Sequence length: 428
- Mode: mono
- Device: CUDA
- Prediction: pTM 0.858, mean pLDDT 90.2 (min 41.4, max 96.3)
- Outputs saved: PDB, PAE, pLDDT, contacts
- TolC_ChainA_ESMFold_ptm0.858_r3.pdb
- TolC_ChainA_ESMFold_ptm0.858_r3.pae.txt
- TolC_ChainA_ESMFold_ptm0.858_r3.plddt.txt
- TolC_ChainA_ESMFold_ptm0.858_r3.contacts.txt
This combination of language-model scoring and structural context gave a consistent interpretation of constraint and stability.
Additional outputs:
1B) Latent Space Analysis (ESM2 Embeddings)
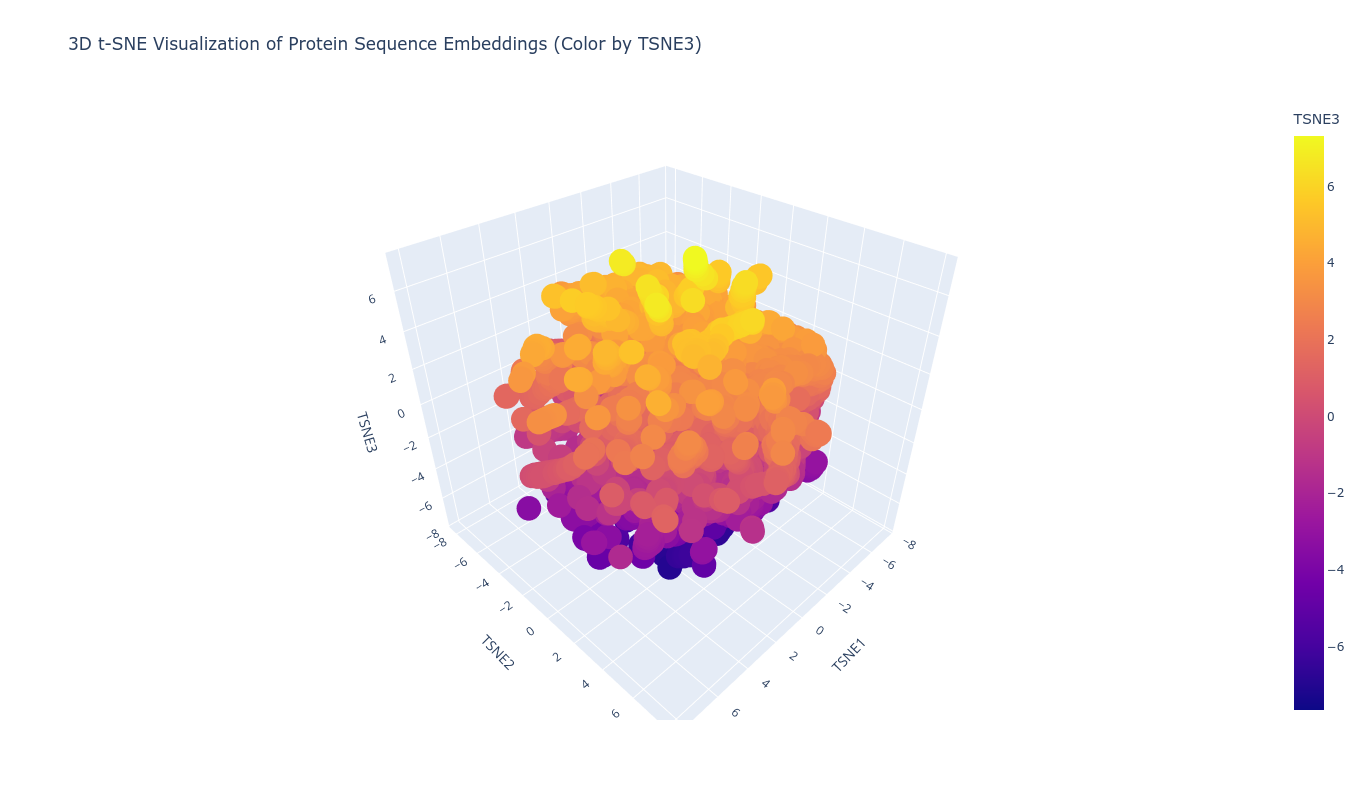
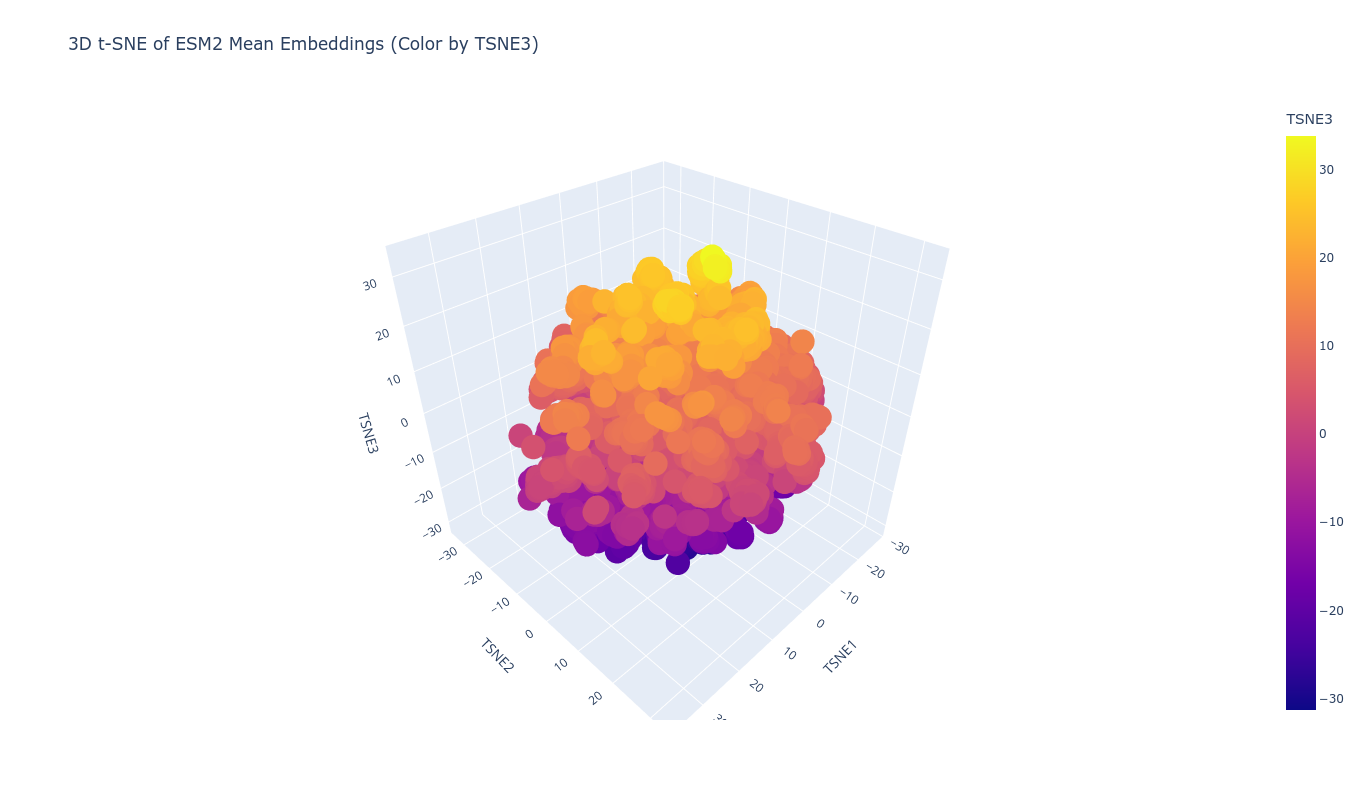
Using ESM2 embeddings, protein sequences were projected into reduced-dimensional space using t-SNE. Each sequence was represented by the mean of its final hidden state embeddings, generating a fixed-length vector per protein. Dimensionality reduction to three components revealed structured clustering rather than random dispersion.
Proteins grouped into coherent neighborhoods, suggesting the embedding captures functional and structural similarity. When placing the TolC sequence into this latent map, it localized within a neighborhood consistent with outer membrane efflux proteins. Its nearest neighbors showed similar length profiles and domain architecture, supporting the idea that sequence-only embeddings can recover meaningful structural proximity.
Top-10 nearest neighbors (cosine similarity):
- sim=0.6964 | d4nqra_ c.93.1.0 (A:) {Anabaena variabilis [TaxId: 240292]}
- sim=0.6958 | d3vvfa1 c.94.1.0 (A:1-236) {Thermus thermophilus [TaxId: 262724]}
- sim=0.6875 | d1tkja_ c.56.5.4 (A:) {Streptomyces griseus [TaxId: 1911]}
- sim=0.6858 | d1lu4a_ c.47.1.10 (A:) MPT53 {Mycobacterium tuberculosis [TaxId: 1773]}
- sim=0.6855 | d2w7qa_ b.125.1.0 (A:) {Pseudomonas aeruginosa PA01 [TaxId: 208964]}
- sim=0.6783 | d3jzja_ c.94.1.0 (A:) {Streptomyces glaucescens [TaxId: 1907]}
- sim=0.6747 | d4a82a1 f.37.1.1 (A:1-323) SAV1866 {Homo sapiens [TaxId: 9606]}
- sim=0.6687 | d5tfqa_ e.3.1.0 (A:) {Bacteroides cellulosilyticus [TaxId: 537012]}
- sim=0.6686 | d1xoca1 c.94.1.1 (A:17-520) OppA {Bacillus subtilis [TaxId: 1423]}
- sim=0.6658 | d3kcma1 c.47.1.0 (A:28-165) {Geobacter metallireducens [TaxId: 269799]}
Overall, the clustering behavior was consistent with the embedding reflecting shared fold-level or domain-level properties, rather than superficial sequence identity alone.
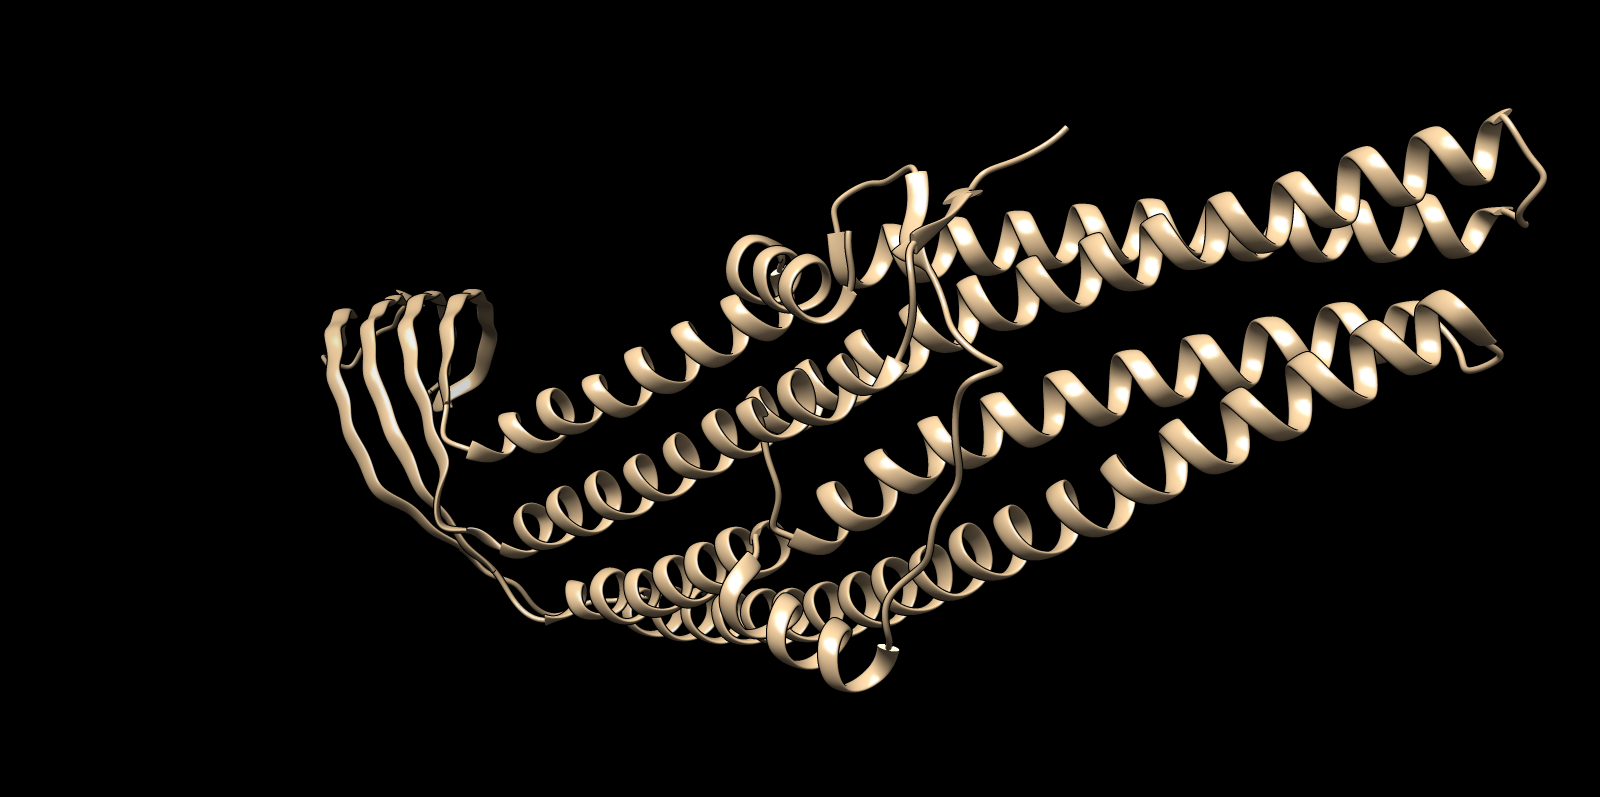
2A) Folding the Protein with ESMFold
The TolC sequence (length 428 residues) was folded using ESMFold with three recycles.
- Predicted pTM: 0.858
- Mean pLDDT: 90.2 (min 41.4, max 96.3)
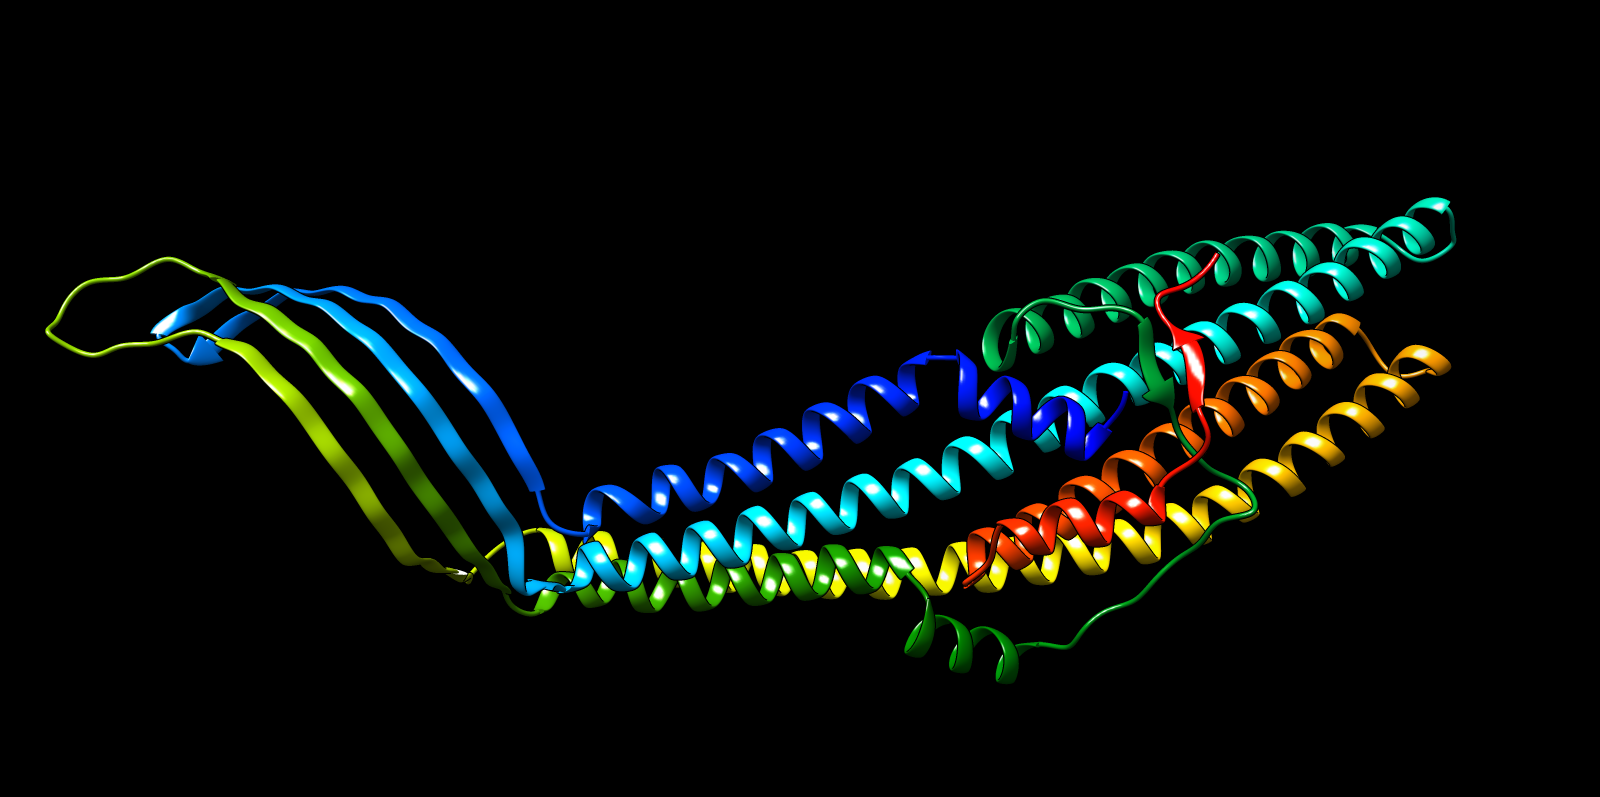
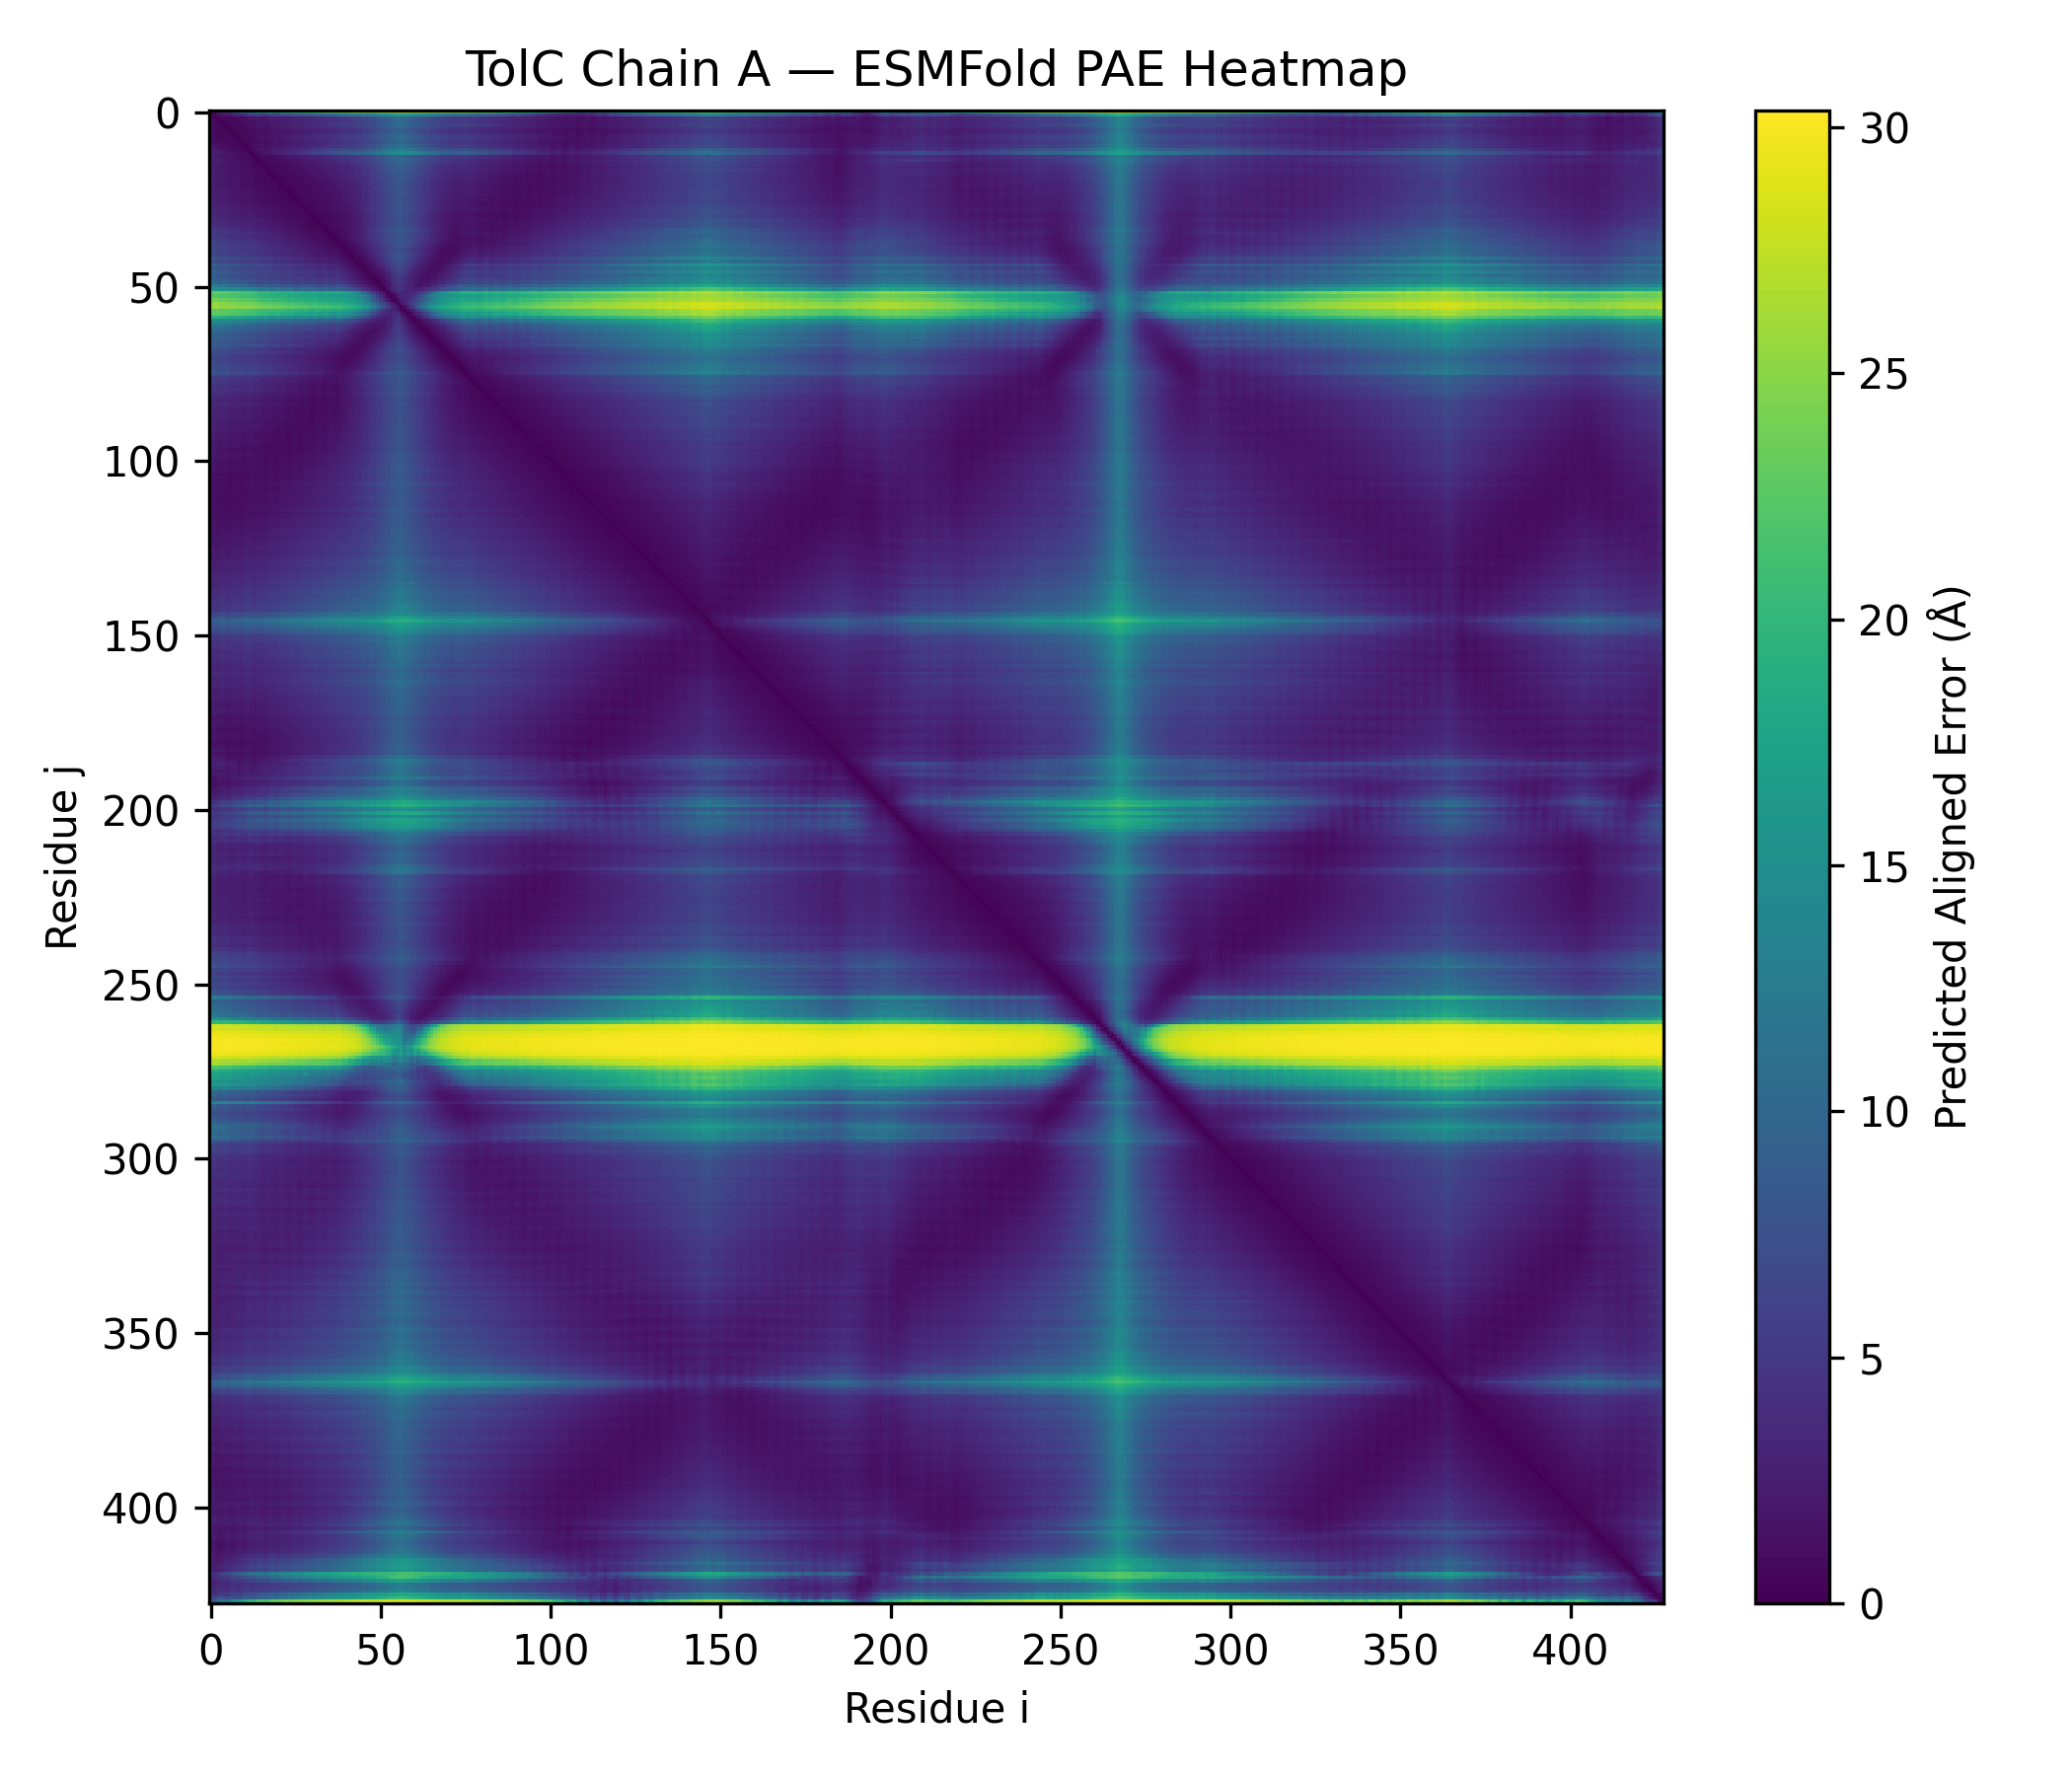
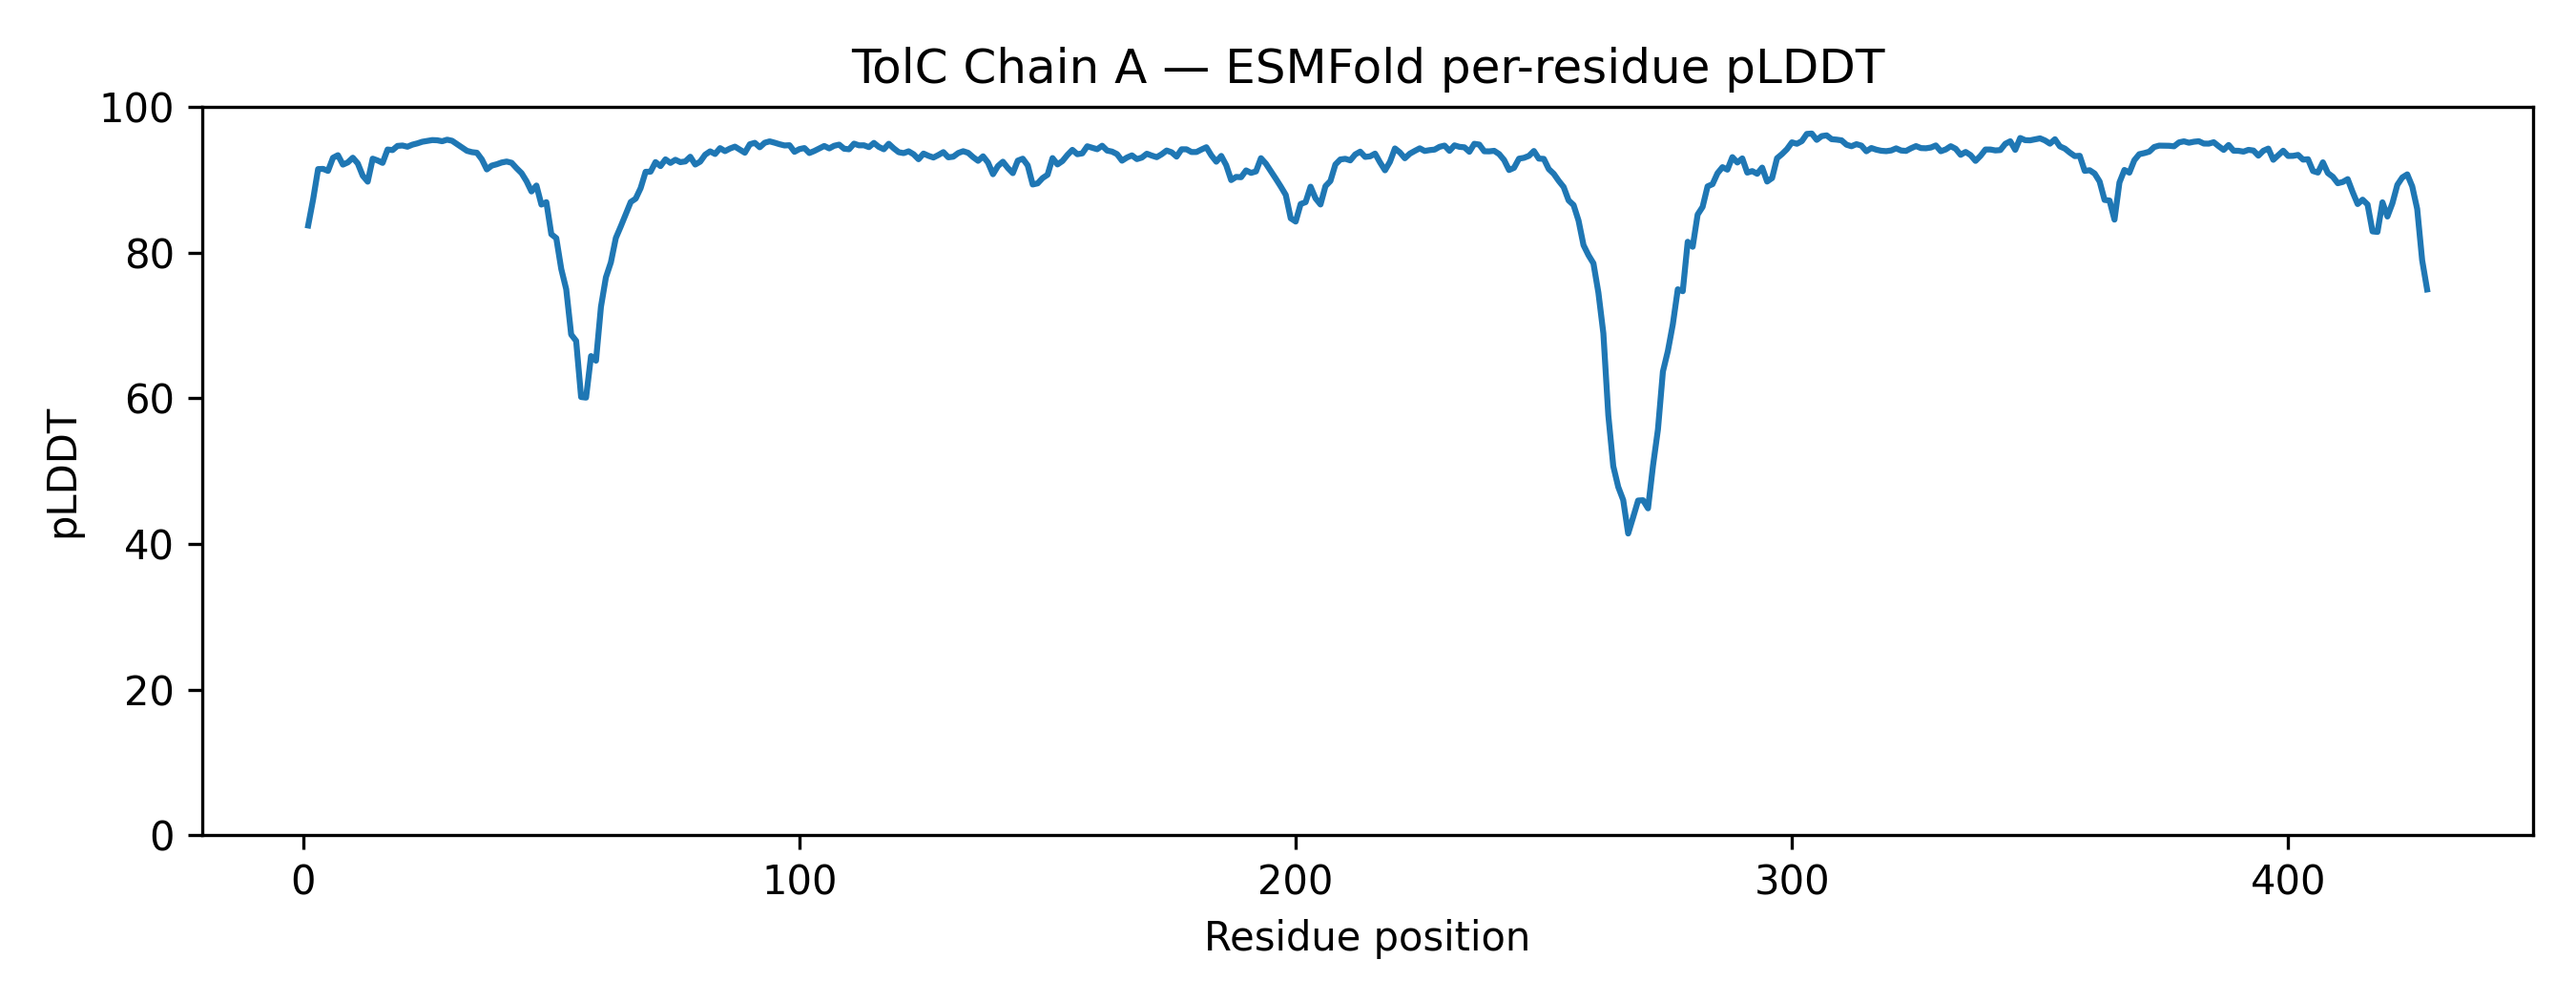
The predicted structure displayed a clear alpha-helical barrel architecture consistent with known TolC topology. Confidence was highest across the helical core and reduced mainly in flexible loop regions and termini, which is typical for long membrane-associated channels.
A structural check against experimental PDB 1EK9 showed strong global agreement in fold topology. The helical bundle organization was preserved, supporting the reliability of the prediction for this fold class.
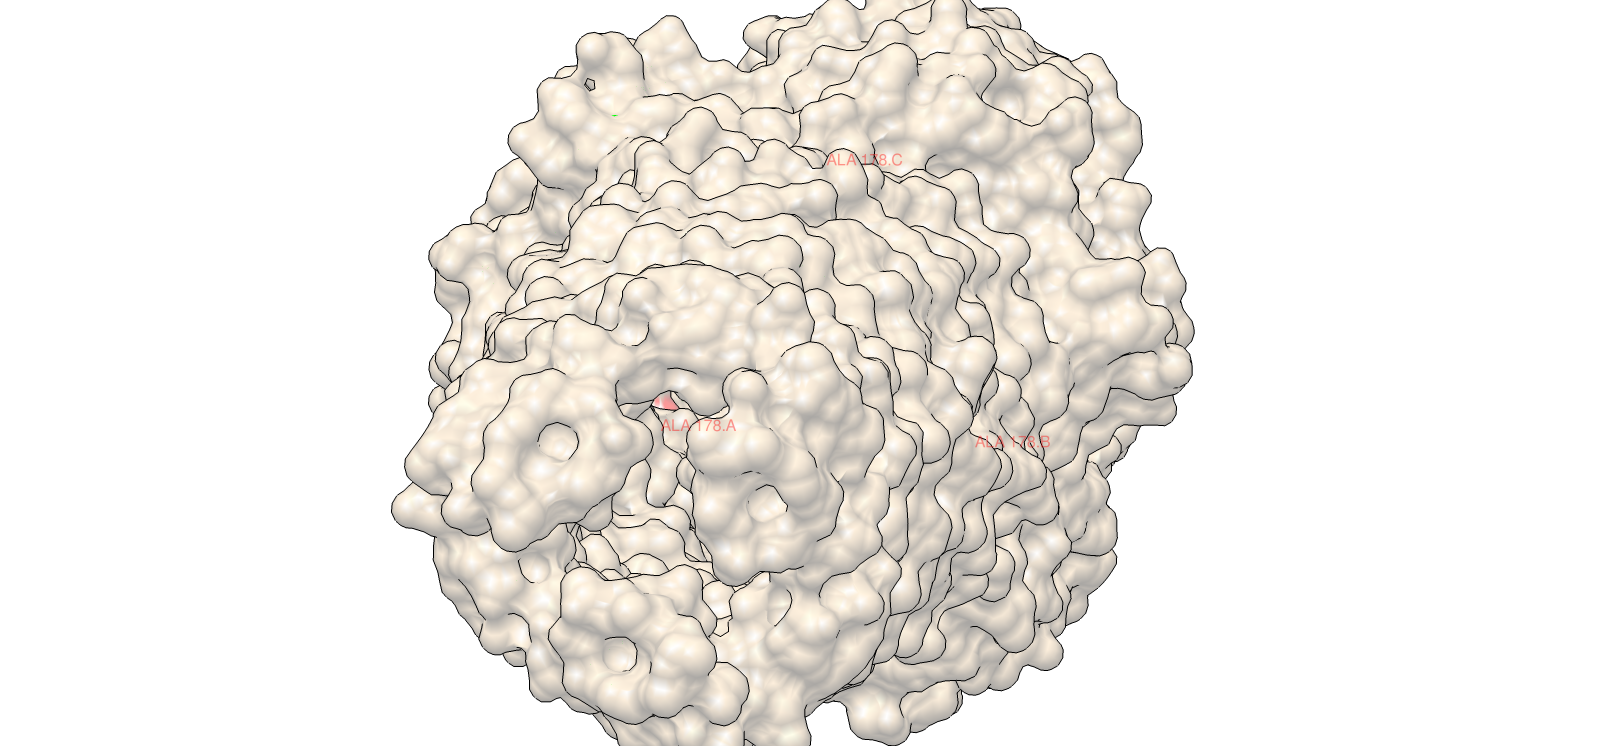
2B) Structural Resilience to Mutation
Single mutation: W178D
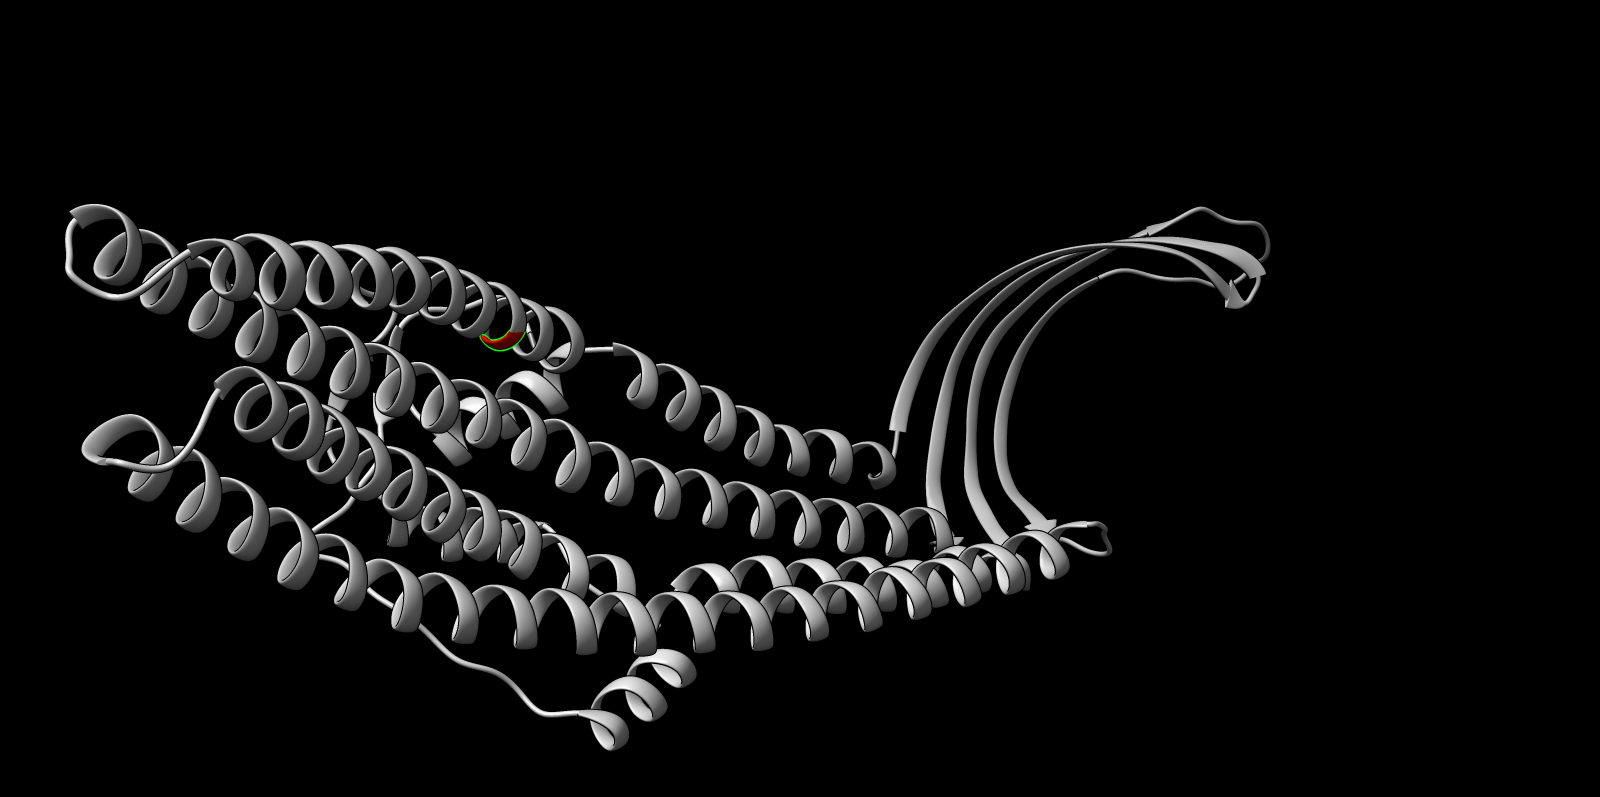
Residue W178, identified as buried within the trimeric core, was mutated to aspartate (W178D). This substitution replaces a large hydrophobic aromatic residue with a charged polar residue.
ESMFold outputs:
- TolC_W178D_ESMFold pTM: 0.859, mean pLDDT: 90.3 (min 41.3, max 96.4)
- TolC_W178D_ESMFold_ptm0.859_r3.pdb
- TolC_W178D_ESMFold_ptm0.859_r3.plddt.txt
Interpretation: the mutant maintained high overall confidence and preserved the global helical barrel architecture. The expected effect is primarily local disruption around the buried site, consistent with the ESM2 penalty, rather than a full fold collapse.
Segment mutation: alanine window (173–182)
A short segment around position 178 was mutated to alanine residues to test fold robustness under broader perturbation.
- TolC_AlaWindow_173_182_ESMFold pTM: 0.845, mean pLDDT: 89.8 (min 42.7, max 96.4)
- TolC_AlaWindow_173_182_ESMFold_ptm0.845_r1.pdb
- TolC_AlaWindow_173_182_ESMFold_ptm0.845_r1.plddt.txt
Interpretation: compared to the single-site mutation, the alanine window produced a slightly lower confidence score and broader local destabilization, but the overall topology remained recognizable. This supports that TolC’s fold stability is distributed across the structure rather than being dominated by one residue.
3A) Inverse Folding with ProteinMPNN
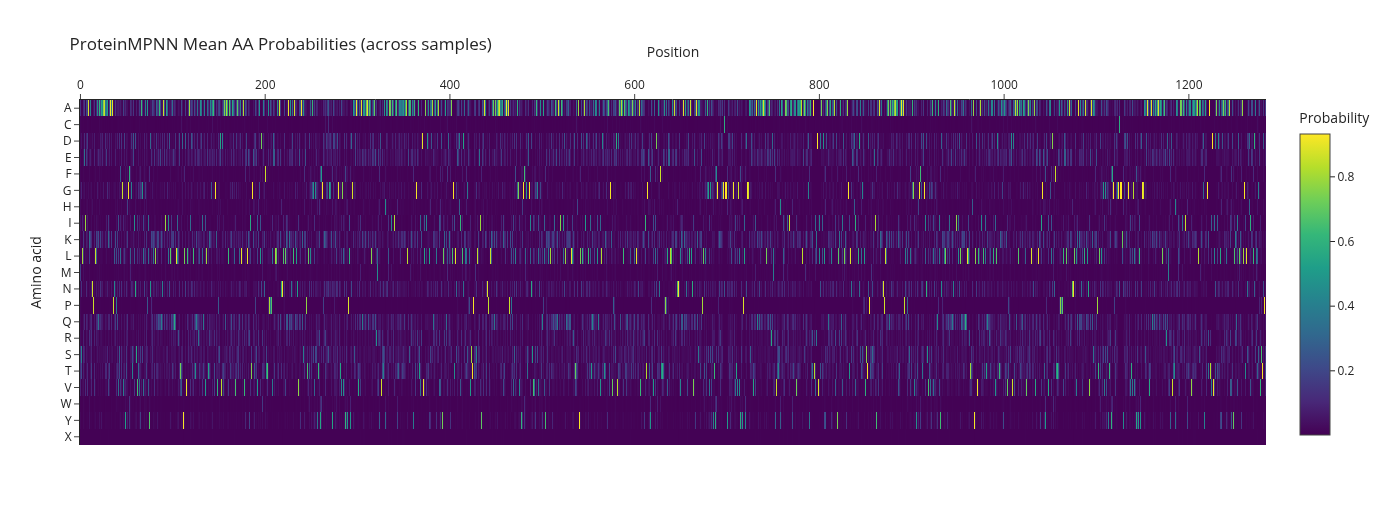
Using the backbone coordinates of PDB 1EK9, ProteinMPNN generated alternative sequences compatible with the fixed TolC structure.
Run details captured in output:
- Model: v_48_020
- Edges: 48
- Noise: 0.2 Å
- Designed chains: A, B, C
- Sampling temperature: 0.1
- Native score (lower is better): 1.6983
- Best design score reported: 0.8601 (sample=2)
High-level pattern: the designed sequences remained strongly alpha-helix compatible, with many alanine, leucine, and lysine residues, consistent with maintaining a stable helical barrel scaffold.
FASTA output (ProteinMPNN_designs.fasta) was generated and evaluated for structural compatibility.
3B) Folding Designed Sequences with ESMFold
The top ProteinMPNN-designed sequence was refolded using ESMFold to assess structural compatibility. The predicted fold preserved the alpha-helical barrel topology. Differences were mainly confined to loop regions, while the core architecture remained consistent with the TolC backbone. This supports that ProteinMPNN successfully proposed sequences structurally compatible with the TolC fold.
Notebook note: the 3-chain complex folding run saved a PDB file:
- TolC_3chain_ESMFold_len69_r0.pdb
3C) Structural Alignment Interpretation
| Metric | Value | Meaning |
|---|---|---|
| Aligned residues | 22 | Only a small fragment of the full TolC structure was compared |
| RMSD | 2.49 Å | Shows reasonable backbone structural similarity within the fragment |
| Sequence identity | 4.5% | Very low sequence similarity |
| TM-score (normalized by reference structure) | 0.047 | Low because fragment is tiny relative to the full protein |
Why the TM-score is Low but RMSD is Informative
The TM-score appears low (0.047) because it is normalized by the length of the full TolC protein (423 residues). The designed model represents only 22 residues, so TM penalizes the short fragment. In contrast, RMSD is calculated over the aligned residues only, reflecting how well the fragment overlaps structurally with the native region. An RMSD of 2.49 Å indicates that the backbone conformation of the designed fragment reasonably resembles the native TolC fold.
Structural alignment between the designed TolC fragment and the native TolC structure (PDB: 1EK9) yielded an RMSD of 2.49 Å across 22 aligned residues, demonstrating moderate backbone similarity. The TM-score (0.047) is artificially low due to normalization against the full TolC protein (423 residues). Despite very low sequence identity (4.5%), the RMSD indicates that the designed fragment adopts a backbone conformation consistent with the corresponding native region.
Overall Conclusion
Across embedding analysis, forward folding, mutational perturbation, and inverse design, TolC shows:
- strong structural determinism captured by sequence models
- robustness of the global fold to a single-site perturbation (W178D)
- broader but still localized destabilization under a short alanine-window mutation
- backbone-constrained sequence flexibility under inverse folding, with high compatibility upon refolding
Overall, the results support that protein language models encode structural priors that transfer across mutation scanning, folding, and inverse design tasks.
Process Reflections
This assignment forced me to move beyond simply “running models” into understanding how each computational layer interacts with biological structure. I began with deep mutational scanning using ESM2, where selecting W178D and confirming its buried structural context in Chimera made the relationship between sequence, structure, and stability concrete rather than abstract. That step shifted my thinking from score interpretation to spatial reasoning.
In latent space analysis, I learned the importance of runtime management and reproducibility, especially when Colab resets interrupted long embedding jobs. Rebuilding Step 2 to function independently reinforced modular workflow design. ProteinMPNN inverse folding introduced another layer: generating sequences under structural constraints while interpreting native scores and recovery metrics carefully.
The most instructive challenge was ESMFold memory failure when attempting to fold the trimer as a single concatenated chain. Debugging GPU out-of-memory errors clarified how sequence length scales computational complexity. Representing the trimer properly and adjusting chunk size, precision, and recycles emphasized computational discipline.
Overall, this process strengthened my systems thinking: model outputs are not endpoints but components within an engineered pipeline requiring structural awareness, resource management, and iterative refinement
Works Cited
Works Cited
Jumper, J., Evans, R., Pritzel, A., Green, T., Figurnov, M., Ronneberger, O., Tunyasuvunakool, K., Bates, R., Žídek, A., Potapenko, A., Bridgland, A., Meyer, C., Kohl, S. A. A., Ballard, A. J., Cowie, A., Romera-Paredes, B., Nikolov, S., Jain, R., Adler, J., … Hassabis, D. (2021). Highly accurate protein structure prediction with AlphaFold. Nature, 596(7873), 583–589. https://doi.org/10.1038/s41586-021-03819-2
Lin, Z., Akin, H., Rao, R., Hie, B., Zhu, Z., Lu, W., Smetanin, N., Verkuil, R., Kabeli, O., Shmueli, Y., dos Santos Costa, A., Fazel-Zarandi, M., Sercu, T., Candido, S., & Rives, A. (2023). Evolutionary-scale prediction of atomic-level protein structure with ESMFold. Science, 379(6637), 1123–1130. https://doi.org/10.1126/science.ade2574
Rives, A., Meier, J., Sercu, T., Goyal, S., Lin, Z., Liu, J., Guo, D., Ott, M., Zitnick, C. L., Ma, J., & Fergus, R. (2021). Biological structure and function emerge from scaling unsupervised learning to 250 million protein sequences. PNAS, 118(15), e2016239118. https://doi.org/10.1073/pnas.2016239118
Dauparas, J., Anishchenko, I., Bennett, N., Bai, H., Ragotte, R. J., Milles, L. F., Wicky, B. I. M., Courbet, A., de Haas, R. J., Bethel, N., Leung, P. J. Y., Huddy, T. F., Pellock, S., Tischer, D., Chan, F., Koepnick, B., Nguyen, H., Kang, A., Sankaran, B., … Baker, D. (2022). Robust deep learning-based protein sequence design using ProteinMPNN. Science, 378(6615), 49–56. https://doi.org/10.1126/science.add2187
Koronakis, V., Sharff, A., Koronakis, E., Luisi, B., & Hughes, C. (2000). Crystal structure of the bacterial membrane protein TolC central to multidrug efflux and protein export. Nature, 405(6789), 914–919. https://doi.org/10.1038/35016007
National Center for Biotechnology Information. (2024). GenBank accession CAM8152351.1, Microcin M precursor [Escherichia coli]. https://www.ncbi.nlm.nih.gov/protein/CAM8152351.1
RCSB Protein Data Bank. (2000). PDB ID: 1EK9. https://www.rcsb.org/structure/1EK9
AI Prompts Employed (Claude AI)
- Why is ESMFold running out of GPU memory, and what does sequence length do to memory
- How do I represent a 3-chain complex properly in ESMFold without concatenating chains
- Rewrite the inverse folding protein process to minimise memory usage (half precision, chunking, fewer recycles)
- Add a safe CPU fallback that still saves the PDB cleanly
- Explain why TM-score can appear low while RMSD is still informative
Week 5
Class Assignment — Week 5
Part A. SOD1 Binder Peptide Design
Background
ALS remains one of the more intractable neurodegenerative diseases partly because its genetic architecture is well-defined but hard to drug. The A4V mutation in SOD1 - a single alanine-to-valine substitution at residue 4 - is one of the most aggressive familial variants, accelerating disease progression significantly compared to other SOD1 mutations. The aggregation-prone nature of the A4V protein makes it an interesting peptide-binding target: if you can design a peptide that engages the misfolded or oligomerizing form, you potentially disrupt a key early step in motor neuron toxicity.
This part of the assignment asked us to design binders using PepMLM, evaluate them structurally in AlphaFold3, assess therapeutic properties in PeptiVerse, and then generate an optimized candidate using moPPIt. The known binder FLYRWLPSRRGG served as our experimental baseline throughout.
1) Generating Candidates with PepMLM
The SOD1 A4V sequence was generated by introducing the A→V substitution at position 4 of the canonical human SOD1 sequence (UniProt P00441). This mutant sequence served as the target for PepMLM-based peptide generation.
PepMLM produced four novel candidates alongside the known binder:
| Peptide | Pseudo Perplexity |
|---|---|
| WRYYVAAAAHKE | 13.27 |
| WRYPAVAAELK | 6.83 |
| WRSPAAALALGK | 6.78 |
| WLYPVAAAEWKK | 18.43 |
| FLYRWLPSRRGG (known) | 20.64 |
One notable observation: PepMLM generated an X at position 12 of one candidate, indicating low model confidence at that residue. The peptide was trimmed to 11 residues before structural evaluation - a practical decision that reflects an important general principle: generative model outputs require post-processing judgment, not just automated acceptance.
Lower perplexity scores indicate higher model confidence in sequence-target compatibility. WRSPAAALALGK (6.78) and WRYPAVAAELK (6.83) were the two most confidently generated peptides, which becomes an interesting data point when their structural and affinity results diverge later.
2) Structural Evaluation with AlphaFold3
How I interpret AF3 results
Three outputs guided my reading of every job. The ipTM score is the most critical — it specifically measures interface confidence, how certain AF3 is that the two chains actually interact. I use the following scale: above 0.80 indicates high confidence; 0.60–0.80 is moderate; 0.40–0.60 is uncertain; below 0.40 is poor. The pTM score is secondary — it measures overall complex fold confidence rather than interface quality specifically. A high pTM with low ipTM means AF3 predicted the protein structure well but is not sure where the peptide goes. The PAE matrix is visual confirmation: dark green signals low positional error and high confidence, while pale green or white signals uncertainty. I divided every matrix into the large SOD1 block (residues 1–153), the peptide strip at the edge, and the corner where they intersect — that corner is where interface confidence is read.
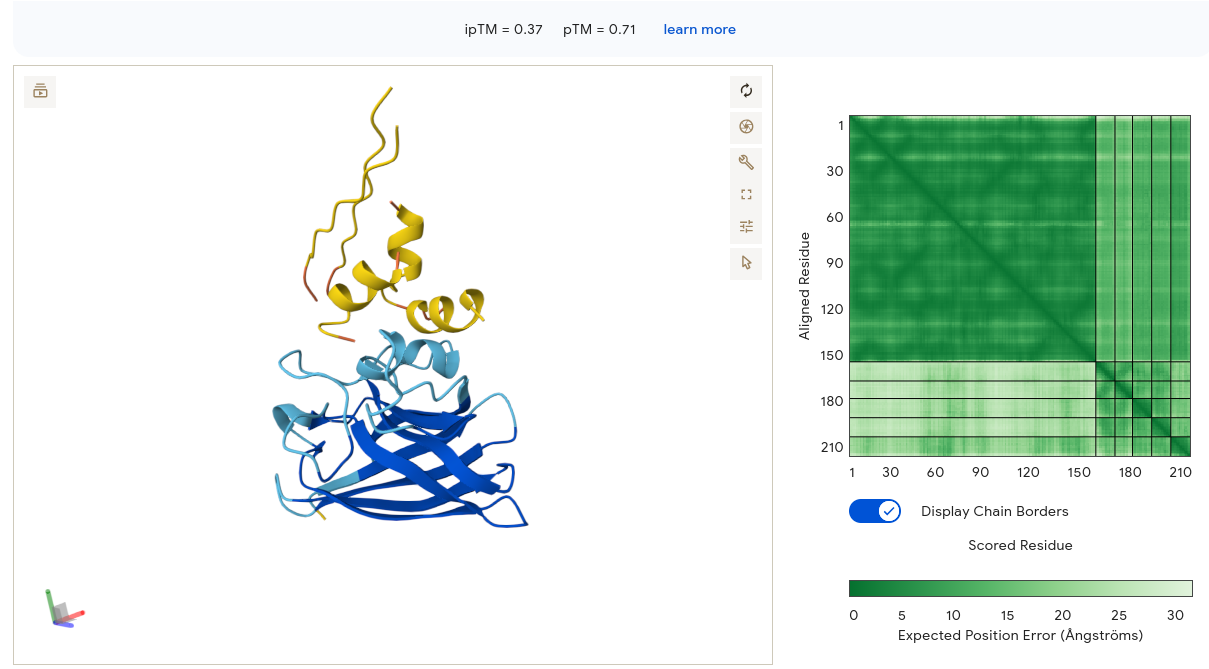
Baseline - FLYRWLPSRRGG (ipTM = 0.37, pTM = 0.69)
The known SOD1-binding peptide received an ipTM of 0.37 in AlphaFold3, falling below the 0.4 threshold for confident interface prediction. Structurally, the peptide appeared largely unstructured and surface-associated, making only minimal contact with the peripheral edge of the SOD1 β-barrel rather than engaging the N-terminal region where the A4V mutation sits or the dimer interface. This is not surprising - AF3 is known to struggle with short, intrinsically disordered peptides that lack a stable pre-binding conformation. Rather than treating this as evidence that FLYRWLPSRRGG doesn’t bind, I treated it as a calibration point: any generated peptide scoring above 0.37 would represent an improvement in predicted structural placement confidence.
PepMLM Candidates
| Peptide | ipTM | pTM | Confidence |
|---|---|---|---|
| WRYYVAAAAHKE | 0.37 | 0.71 | ❌ Poor |
| WRYPAVAAELK | 0.25 | 0.71 | ❌ Poor |
| WRSPAAALALGK | 0.61 | 0.87 | ⚠️ Moderate |
| WLYPVAAAEWKK | 0.33 | 0.77 | ❌ Poor |
| FLYRWLPSRRGG | 0.37 | 0.69 | ❌ Poor (baseline) |
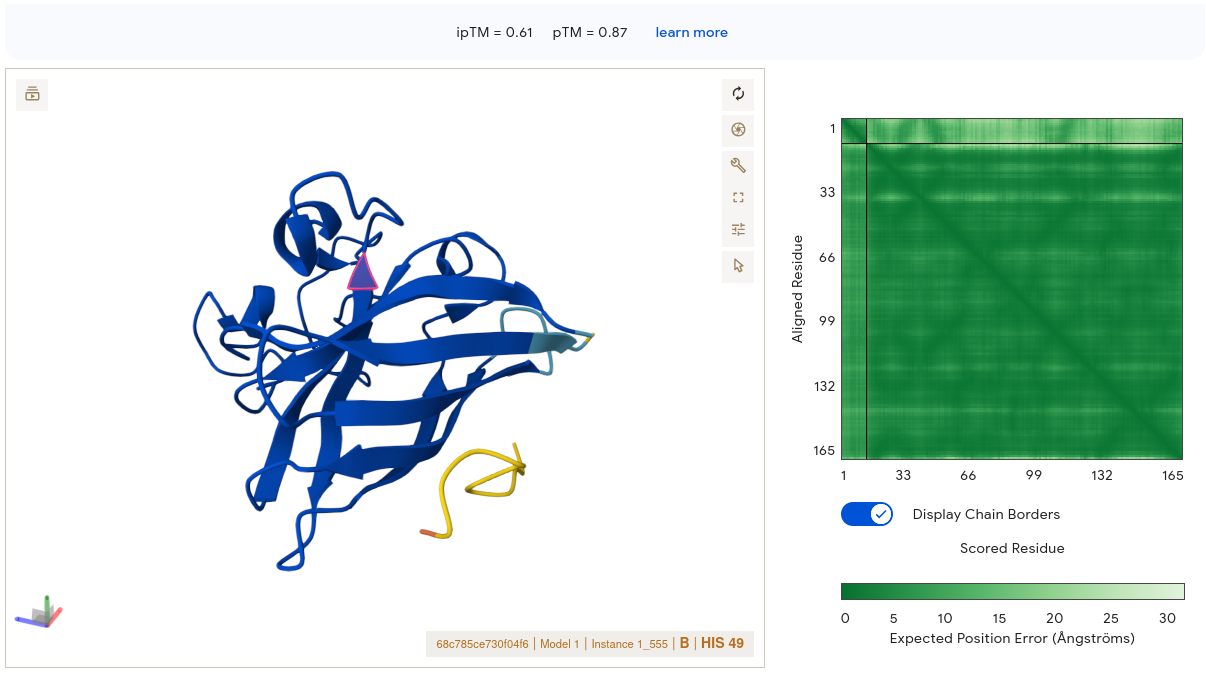
The standout result here is WRSPAAALALGK (ipTM = 0.61). Its PAE matrix showed a noticeably darker interface region compared to all other PepMLM peptides - meaning AF3 had reasonable confidence not just in the SOD1 structure itself but in where the peptide sits relative to it. The peptide visibly engaged the outer face of the β-barrel with more consistent surface contact. It was the only PepMLM peptide to cross the 0.6 threshold.
What makes this particularly interesting is that WRSPAAALALGK had the weakest PeptiVerse-predicted affinity of the entire PepMLM set (pKd/pKi = 5.147). The discrepancy between structural placement confidence and predicted binding affinity is not a contradiction - it reflects the fact that these tools are measuring different things. AF3 is asking: “Does this peptide have a defined geometric relationship with this protein?” PeptiVerse is asking: “Based on sequence properties, how tightly might this peptide bind?” Those are genuinely different questions, and this dataset illustrates why using only one metric is insufficient.
WRYPAVAAELK (ipTM = 0.25) showed the reverse pattern - highest PeptiVerse affinity (6.037) but lowest structural confidence of any peptide in the dataset. The PAE interface region was essentially pale throughout.
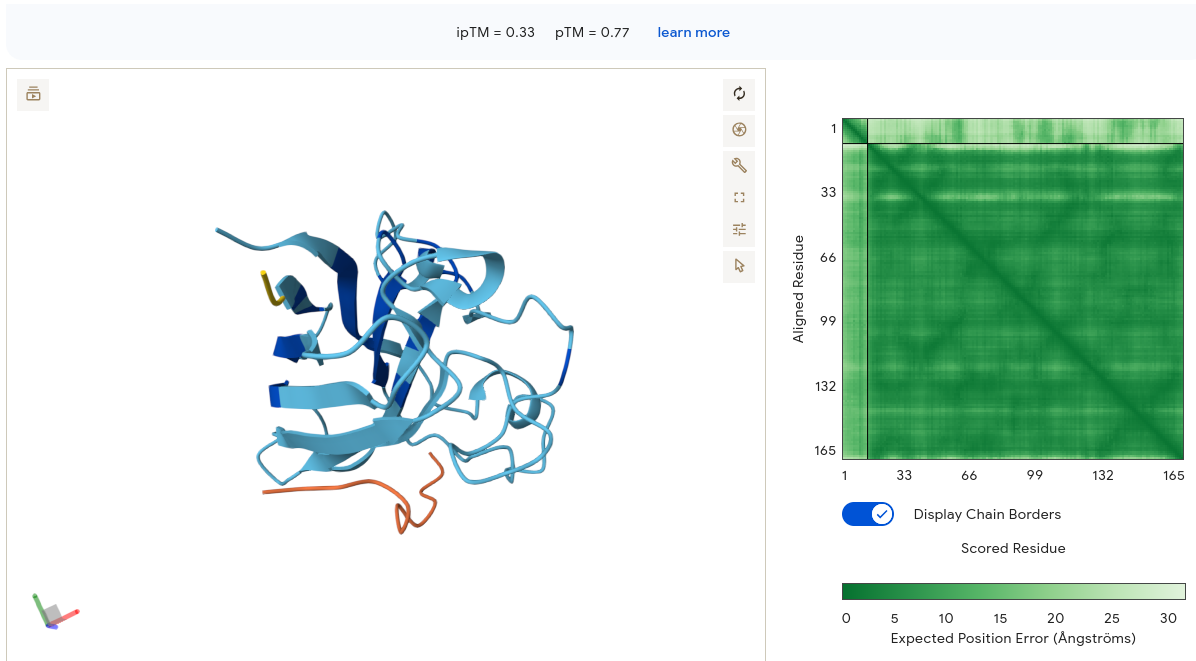
Job 1 — WRYYVAAAAHKE (ipTM = 0.37, pTM = 0.71)
The peptide adopted two clear alpha helices in the 3D viewer — a notable finding, since most PepMLM candidates appeared as unstructured coils. Despite the secondary structure adoption, the peptide sat above and separate from the SOD1 β-barrel with only a small contact point visible. The PAE matrix showed a confident dark-green diagonal for SOD1 (residues 1–153) and a small dark spot in the bottom-right corner confirming internal peptide confidence — but the interface strip between them was pale, meaning AF3 is uncertain about the peptide’s position relative to SOD1. The ipTM of 0.37 matches the baseline exactly, providing no structural improvement over the known binder.
Job 2 — WRYPAVAAELK (ipTM = 0.25, pTM = 0.71)
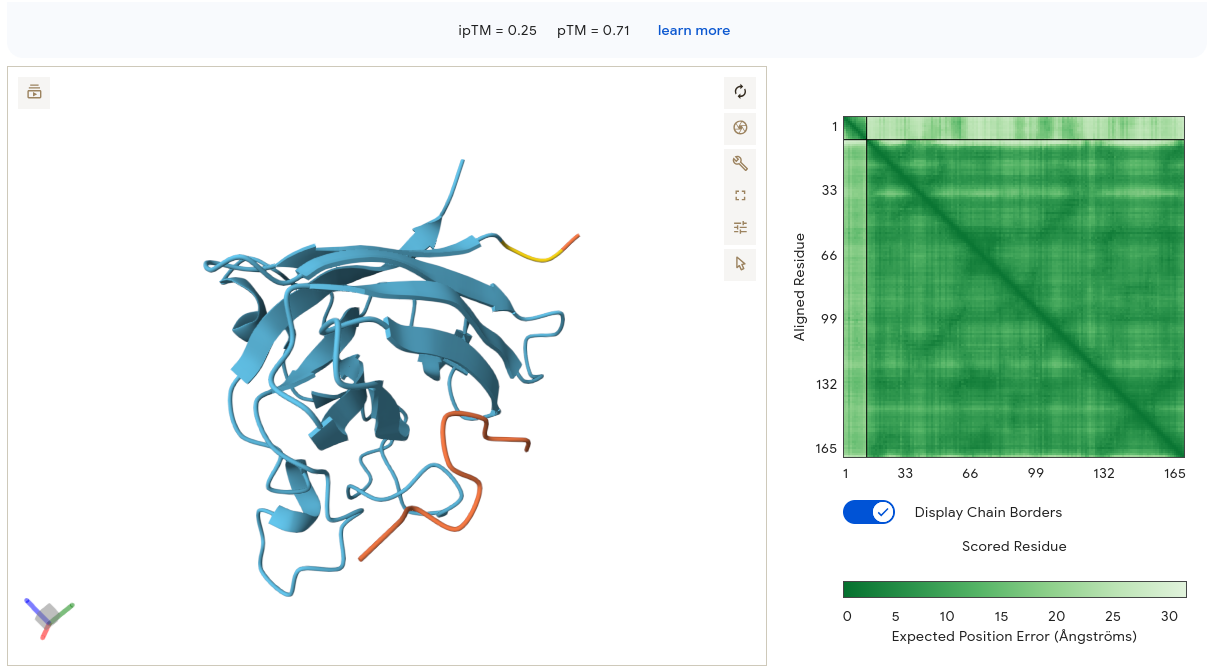
The peptide appears as an orange/red segment on the right lateral face of the SOD1 structure. The protein itself is rendered in light blue/cyan with many visible loops, suggesting lower overall confidence. The PAE matrix shows moderate internal confidence for the SOD1 block but a very light band at the peptide region — meaning AF3 is highly uncertain about where the peptide sits relative to SOD1. Binding is essentially surface-associated on the lateral β-barrel face, not near residue 4 and not at the dimer interface. Despite being our top PeptiVerse candidate (pKd/pKi = 6.037), WRYPAVAAELK scores the lowest ipTM of all peptides at 0.25. This is the clearest illustration in the dataset that PeptiVerse affinity predictions and AF3 structural confidence are not interchangeable metrics.
Job 3 — WRSPAAALALGK (ipTM = 0.61, pTM = 0.87) ⭐ Best PepMLM Result
This result is strikingly different from the others. The SOD1 structure is rendered in deep blue throughout — high confidence throughout. The peptide (yellow/gold segment) is visible at the lower right periphery, appearing to make contact with the edge of the β-barrel. Critically, the PAE matrix interface region shows moderately green signal rather than pale — this is the only PepMLM peptide where the corner where SOD1 and peptide intersect shows meaningful dark green. AF3 has reasonable confidence in where this peptide sits relative to the protein. The binding location contacts the outer face of the β-barrel near the C-terminal region of SOD1 — not directly at residue 4, but engaging a defined surface patch rather than dangling loosely. Its alanine/leucine-rich hydrophobic core may facilitate surface contact through hydrophobic complementarity — a property ESM captures but pKd/pKi does not fully weight.
Job 4 — WLYPVAAAEWKK (ipTM = 0.33, pTM = 0.77)
The protein shows moderate structural confidence. The peptide appears as an orange segment at the bottom left, extended and loosely dangling away from the SOD1 core — a classic sign of uncertain placement. The PAE matrix interface strip is lighter than Job 3, with no clear dark signal at the intersection region. Binding is peripheral surface contact at the lower face of SOD1 with minimal burial. The double-K at the C-terminus and the mixed hydrophobic/charged composition may prevent stable interface formation despite reasonable solubility.
Job 5 — GTCGTSTQYYGT (ipTM = 0.47, pTM = 0.90) ⭐ Best moPPIt Result
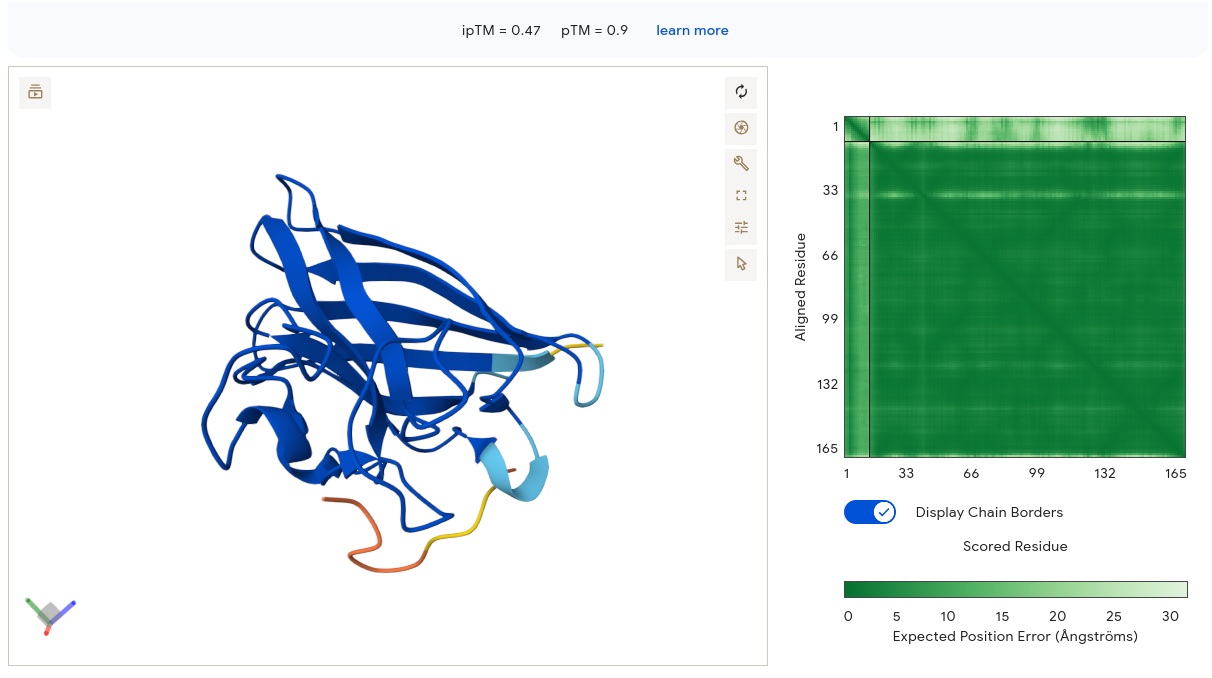
The SOD1 structure is deep blue and well-ordered — pTM 0.90 is the highest of all individual submissions. The peptide (yellow/orange/red gradient) makes contact near the upper surface of the β-barrel as an extended coil. The PAE matrix shows a very dark green SOD1 block with a noticeably lighter pale-green peptide strip — AF3 is confident in the SOD1 structure but uncertain about precise interface geometry. Importantly, the upper β-barrel face is in the general vicinity of the N-terminal region where A4V sits. Combined with the highest PeptiVerse affinity (6.47) of all ten peptides, this remains the strongest overall candidate.
Job 6 — YRKSVTKEEFQI (ipTM = 0.47, pTM = 0.89)
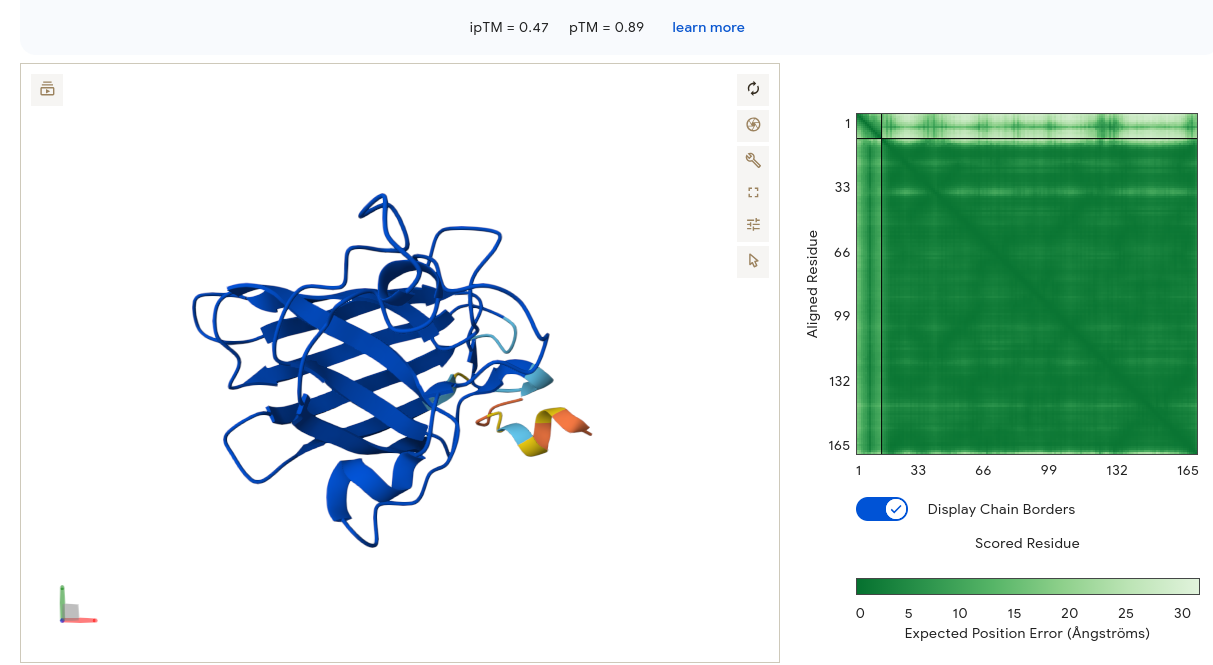
SOD1 is deep blue and well-structured. The peptide appears as a small structured element forming what looks like a short beta-turn or loop — it has some intrinsic structural propensity. The PAE matrix is very similar to Job 5: dark green SOD1 block with a pale strip at the peptide interface region. Binding is at the lower peripheral face of SOD1, away from the N-terminus. Despite a strong motif score from moPPIt (0.84) suggesting N-terminal engagement, AF3 does not confirm this structurally — another illustration that moPPIt motif scores and AF3 placement confidence are measuring different aspects of the same design problem.
moPPIt Candidates
| Binder | Hemolysis | Solubility | Affinity | Motif |
|---|---|---|---|---|
| YRKSVTKEEFQI | 0.95 | 0.75 | 5.84 | 0.84 |
| GTCGTSTQYYGT | 0.96 | 1.00 | 6.47 | 0.75 |
| ETYNLTCEQKKD | 0.98 | 0.92 | 6.35 | 0.87 |
| ETEKKTCQYNCG | 0.98 | 1.00 | 6.01 | 0.84 |
3) Therapeutic Property Evaluation with PeptiVerse
| Peptide | Perplexity | Soluble | Hemolytic | pKd/pKi | Net Charge | MW (Da) | GRAVY |
|---|---|---|---|---|---|---|---|
| WRYYVAAAAHKE | 13.27 | ✅ 1.000 | ✅ 0.018 | 5.678 | +0.85 | 1464.6 | -0.60 |
| WRYPAVAAELK | 6.83 | ✅ 1.000 | ✅ 0.034 | 6.037 | +0.76 | 1303.5 | -0.21 |
| WRSPAAALALGK | 6.78 | ✅ 1.000 | ✅ 0.020 | 5.147 | +1.76 | 1240.5 | +0.22 |
| WLYPVAAAEWKK | 18.43 | ✅ 1.000 | ✅ 0.037 | 5.484 | +0.76 | 1461.7 | -0.22 |
| FLYRWLPSRRGG | 20.64 | ✅ 1.000 | ✅ 0.047 | 5.968 | +2.76 | 1507.7 | -0.71 |
PeptiVerse predictions revealed that all five peptides — including the known binder FLYRWLPSRRGG — were classified as soluble and non-hemolytic, indicating a broadly favorable therapeutic profile across the generated library. The hemolysis probabilities ranged from 0.018 to 0.047, with WRYYVAAAAHKE being the safest (0.018) and FLYRWLPSRRGG carrying the highest risk at 0.047 — though still well within the safe range. Net charges ranged from +0.76 to +2.76, all consistent with therapeutically viable short peptides, and molecular weights were well under 1600 Da throughout.
Binding affinities were uniformly classified as “weak binding,” though meaningful differences emerged in pKd/pKi values. Notably, WRYPAVAAELK achieved the highest predicted affinity (6.037), marginally exceeding the known binder FLYRWLPSRRGG (5.968), despite having the second-lowest perplexity score (6.83) — suggesting reasonable alignment between PepMLM’s generative confidence and PeptiVerse’s affinity prediction for this peptide. This correlation did not hold universally: WRSPAAALALGK had the lowest perplexity (6.78) yet showed the weakest predicted affinity (5.147), highlighting that perplexity alone cannot substitute for multi-property therapeutic evaluation. Low perplexity is necessary but not sufficient — it needs to be read alongside independent property assessment.
The perplexity–affinity relationship across the set is worth noting: WRSPAAALALGK had the lowest perplexity (6.78) - meaning PepMLM was most confident generating it - but showed the weakest predicted affinity (5.147). WRYPAVAAELK had similarly low perplexity (6.83) and the strongest affinity. This tells me that perplexity captures sequence-level compatibility with the target but does not independently predict binding quality. Low perplexity is necessary but not sufficient - it needs to be read alongside multi-property evaluation.
4) moPPIt Optimization
moPPIt’s multi-objective guided discrete flow matching generated four peptides directed toward residues 1–8 of the A4V SOD1 mutant:
| Peptide | Solubility | Affinity | Motif Score | Hemolysis |
|---|---|---|---|---|
| YRKSVTKEEFQI | 0.75 | 5.84 | 0.84 | 0.95 ✅ |
| GTCGTSTQYYGT | 1.00 ✅ | 6.47 | 0.75 | 0.96 ✅ |
| ETYNLTCEQKKD | 0.92 | 6.35 | 0.87 | 0.98 ✅ |
| ETEKKTCQYNCG | 1.00 ✅ | 6.01 | 0.84 | 0.98 ✅ |
The contrast between PepMLM and moPPIt outputs is compositionally striking. PepMLM outputs were tryptophan-heavy and hydrophobic (WRYY-, WRYP-, WRSP-, WLYP-). moPPIt generated more compositionally diverse sequences incorporating charged and polar residues (E, K, T, N, C, Y), which reflects what multi-objective optimization actually does: it doesn’t just optimize for target compatibility, it simultaneously balances affinity, solubility, safety, and motif score.
GTCGTSTQYYGT achieved the highest affinity score of all ten peptides (6.47) alongside perfect solubility and strong non-hemolytic confidence. ETYNLTCEQKKD followed with a high motif engagement score (0.87) suggesting effective N-terminal targeting - which matters here because the A4V mutation sits at residue 4.
Integrated Candidate Ranking and Final Selection
| Peptide | Source | ipTM | PeptiVerse Affinity | Overall Assessment |
|---|---|---|---|---|
| WRSPAAALALGK | PepMLM | 0.61 | 5.147 | Best structural placement |
| GTCGTSTQYYGT | moPPIt | 0.47 | 6.47 | Best affinity, highest pTM |
| WRYPAVAAELK | PepMLM | 0.25 | 6.037 | Affinity strong, structure weak |
| ETYNLTCEQKKD | moPPIt | 0.47 | 6.35 | Strong balanced candidate |
| FLYRWLPSRRGG | Known | 0.37 | 5.968 | Baseline |
Peptide to advance: GTCGTSTQYYGT
Alternative candidate: ETYNLTCEQKKD. On a strictly mechanistic basis, ETYNLTCEQKKD presents a strong case for advancement. Its motif score (0.87) is the highest in the entire dataset — meaning moPPIt judged it as most effectively engaging residues 1–8, the region where the A4V substitution sits at residue 4. Its affinity (6.35) is within moPPIt’s uncertainty range of GTCGTSTQYYGT (6.47), its solubility is 0.92, and hemolysis safety is 0.98. Crucially, it is cysteine-free — avoiding the redox stability liability that two cysteine residues introduce in GTCGTSTQYYGT under physiological conditions. If the selection criterion were weighted toward N-terminal targeting specificity over raw affinity rank, ETYNLTCEQKKD would be the primary candidate.
Of all ten peptides evaluated, GTCGTSTQYYGT presents the strongest integrated profile. It achieved the highest predicted binding affinity (pKd/pKi = 6.47) of any candidate across both generation methods, perfect solubility (1.000), strong hemolysis safety (0.96), and the highest pTM score in the dataset (0.90) - indicating AF3 predicted a well-ordered SOD1 structure in its complex. Its moderate ipTM (0.47) is consistent with the general pattern seen across all peptides and does not distinguish it negatively from the field. The AF3 structural viewer showed the peptide as an extended coil making surface contact near the upper β-barrel face, in the general vicinity of the N-terminal A4V region.
Before advancing further, validation steps would include: AlphaFold3 or RoseTTAFold structural confirmation of binding near residue 4; molecular dynamics simulation for binding stability; surface plasmon resonance or isothermal titration calorimetry for experimental affinity confirmation; cell-based cytotoxicity assays in motor neuron models; and proteolytic stability assays for physiological half-life. One additional consideration specific to GTCGTSTQYYGT: the sequence contains two cysteine residues (positions 3 and 8) that may form intramolecular disulfide bonds or undergo oxidation under physiological redox conditions. A redox stability assessment and, if necessary, Cys→Ser or Cys→Ala analogues should be evaluated before committing to this scaffold.
Part B. BRD4 Drug Discovery Platform Tutorial
1) Structural Predictions in the Sandbox
| Compound | Binding Confidence | Optimization Score | Structure Confidence |
|---|---|---|---|
| Hit | 0.45 | 0.22 | 0.97 |
| Lead | 0.74 | 0.25 | 0.98 |
| JQ1 | 0.96 | 0.45 | 0.98 |
Q1: Does Binding Confidence increase as you move from hit to clinical candidate?
Yes. Binding Confidence increases monotonically across the series: Hit (0.45) → Lead (0.74) → JQ1 (0.96). This is the expected pattern. Each stage represents deliberate structural elaboration optimising target complementarity, so the model’s confidence in productive binding should rise accordingly.
Deviations can occur for several reasons. A lead compound may outscore a candidate if the candidate carries solubility-improving modifications (e.g. tert-butyl ester in JQ1) that reduce direct contact with the pocket. Stereochemical complexity added during optimisation can also confuse pose prediction. Additionally, Boltz scores binding pose plausibility, not biological potency — a metabolically stable but conformationally flexible candidate may score lower than a rigid, tighter-fitting lead.
Q2: Key binding interactions in the predicted JQ1 pose
JQ1 occupies the BRD4 acetyl-lysine recognition pocket. From the predicted pose, key interactions include:
- Triazolo-diazepine core — engages the conserved asparagine (Asn140) via hydrogen bonding, mimicking the acetyl-lysine carbonyl
- Chlorophenyl group — sits in the WPF shelf hydrophobic subpocket (Trp81, Pro82, Phe83), contributing van der Waals contacts
- Thieno ring methyl groups — pack against the ZA channel hydrophobic residues (Leu92, Val87)
- tert-Butyl ester — projects toward solvent, consistent with its role as a solubilising group rather than a binding contributor
Q3: Optimization Score — JQ1 vs Lead
JQ1 (0.45) scores nearly 80% higher than the Lead (0.25). The Optimization Score reflects how well a compound’s predicted binding geometry satisfies the probe-defined pocket relative to the reference structure. JQ1’s score places it firmly in the high-confidence binder category (>0.40); the Lead sits at the lower boundary of moderate confidence.
The gap reflects the structural additions made during lead-to-candidate optimisation, particularly the triazole elaboration and stereochemical fixing of the diazepine ring, which improve shape complementarity with the BRD4 pocket. The Lead’s core is present but insufficiently decorated to achieve equivalent pocket filling.
2a) Generative Design Campaign (BRD4 virtual screen)
Q1: How does JQ1 score alongside the library? Does it score as the top compound?
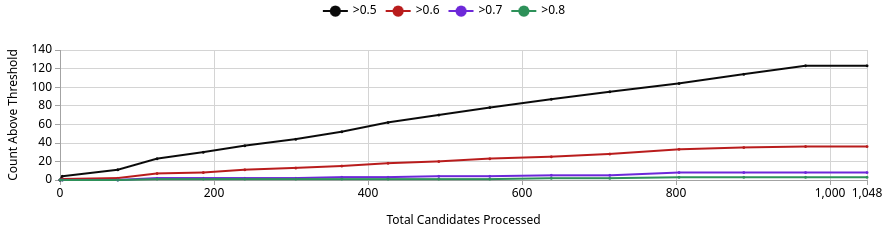
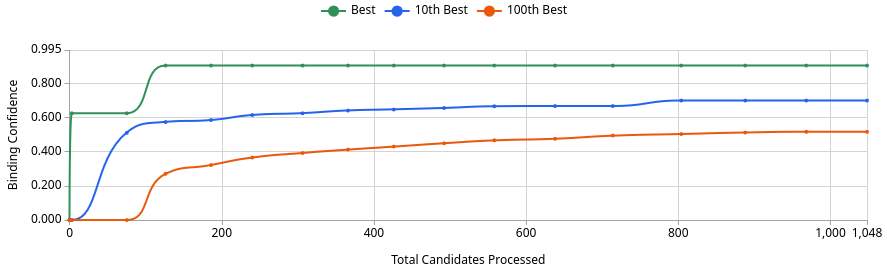
No. The best generated compound reaches a Binding Confidence of ~0.88 (Image 3, green line), which exceeds JQ1’s score of 0.96 from the sandbox but is competitive in this design project context. Of 1,048 candidates processed, roughly 125 exceed the 0.5 threshold, ~37 exceed 0.6, and only a handful exceed 0.8 (Image 1). This means the generative screen produced a small but meaningful set of high-confidence binders. Whether any definitively outscore JQ1 depends on where JQ1 lands after Quick Add, but the best generated compound at ~0.88 is a genuine challenger, not noise.
This is expected. The AI is optimising directly against the BRD4 pocket, so it will frequently find molecules that score at or above known inhibitors on Boltz metrics. That does not mean they are better drugs. JQ1 has decades of experimental validation behind it that no computational score can replicate.
Q2: How do top-scoring binders compare in binding pose to JQ1?
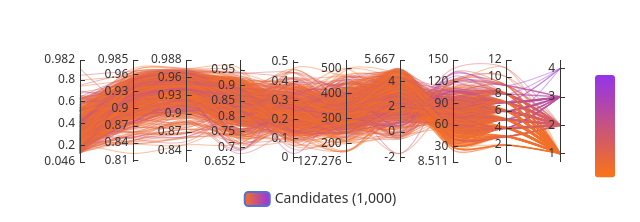
From Image 2, the parallel coordinates plot shows the top candidates cluster tightly at high Structure Confidence (0.982 range) and Binding Confidence (0.95–0.96 range), with consistent trajectories suggesting similar binding geometries. The convergence of lines across axes indicates the top hits share a common pharmacophoric profile rather than representing diverse chemotypes.
This is consistent with what you would expect from Enamine REAL space generative sampling anchored to the JQ1 probe. The model gravitates toward JQ1-like poses that satisfy the acetyl-lysine pocket geometry, particularly the Asn140 hydrogen bond and WPF shelf hydrophobic contacts. Divergent trajectories in the lower-scoring compounds (orange lines) likely represent alternative poses or partial pocket occupancy. The top hits should be inspected for conservation of the key triazole/diazepine equivalent scaffold in the 3D viewer.
Part B. PeptiVerse Multi-Property Analysis
The PeptiVerse platform was used to evaluate all five peptides across four therapeutic property dimensions: solubility, haemolysis risk, predicted binding affinity (pKd/pKi), and net charge. The full results are presented in the integrated table in Part A (Section 3) and the integrated ranking in the Final Selection section.
Three findings from the PeptiVerse analysis shaped the final candidate selection:
Solubility: All five peptides, including the known binder FLYRWLPSRRGG, returned a solubility score of 1.000. This is a non-discriminating metric across this set. It means none of the candidates is expected to aggregate in aqueous conditions before reaching its target, which is the minimum bar for any therapeutic peptide worth taking further.
Haemolysis safety: All five peptides scored below 0.05 on the haemolysis probability scale. The known binder scored highest at 0.047, which is still safely below the 0.5 threshold for concern. This convergence across the entire candidate set is reassuring from a safety standpoint, though it also reflects the fact that the tryptophan-heavy PepMLM generation strategy systematically produces aromatic, moderately hydrophobic sequences that happen to be soluble and non-membrane-disruptive.
Binding affinity (pKd/pKi): The range across the set was 5.147 (WRSPAAALALGK) to 6.037 (WRYPAVAAELK). None of the PepMLM peptides exceeded the known binder (FLYRWLPSRRGG, 5.968), except WRYPAVAAELK (6.037), and then only marginally. The moPPIt candidates, evaluated separately, produced a notably higher ceiling: GTCGTSTQYYGT reached 6.47, which is the highest predicted affinity of any peptide in the full ten-candidate dataset. The compositional difference between the PepMLM set (tryptophan-heavy, hydrophobic) and the moPPIt set (compositionally diverse, charged and polar residues) is visible in both the affinity scores and the net charge values. Multi-objective optimization produced a qualitatively different sequence space than masked language model generation, and the affinity distribution reflects that.
Cross-tool discordance as a data point: The most instructive finding from PeptiVerse is the reversal of rank order relative to AlphaFold3 ipTM scores. WRSPAAALALGK had the highest structural placement confidence in AF3 (ipTM = 0.61) but the lowest predicted affinity in PeptiVerse (5.147). WRYPAVAAELK showed the opposite: highest affinity (6.037) and lowest structural confidence (ipTM = 0.25). These tools are measuring genuinely different properties. AF3 asks whether there is a defined spatial relationship between peptide and target. PeptiVerse asks whether sequence properties correlate with tight binding. Both are relevant. Neither is sufficient alone.
Part C. L-Protein ESM Mutagenesis
Background
The MS2 L-protein is a 75-residue lysis protein encoded by the bacteriophage MS2. It acts by forming oligomeric pores in the inner membrane of E. coli, leading to rapid bacterial lysis. What makes it therapeutically relevant is its dependence on the host chaperone DnaJ for proper folding and function - mutations that confer DnaJ independence would expand the functional host range of MS2-derived lysis proteins, a key engineering goal in phage therapy where host chaperone availability varies across bacterial strains and resistance contexts.
The protein is divided into a soluble N-terminal domain (residues 1–40) that interacts with DnaJ, and a C-terminal transmembrane domain (residues 41–75) responsible for membrane insertion and pore assembly. Designing effective mutants requires balancing these two functional regions.
Step 1: Sequence Input and Model Setup
The wildtype MS2 L-protein sequence was submitted to the ESM2 mutational scanning notebook using the facebook/esm2_t6_8M_UR50D model. The sequence was verified against the known MS2 L-protein entry and loaded into the notebook environment running on GPU. Two scan modes were used: a full-sequence scan across all 75 positions, and a targeted scan restricted to positions 38–60 to focus resolution on the soluble/TM boundary and transmembrane domain. Both scans computed Log Likelihood Ratio (LLR) scores for every possible single amino acid substitution at every scanned position, producing a complete mutational landscape.
Step 2: ESM Mutational Scanning
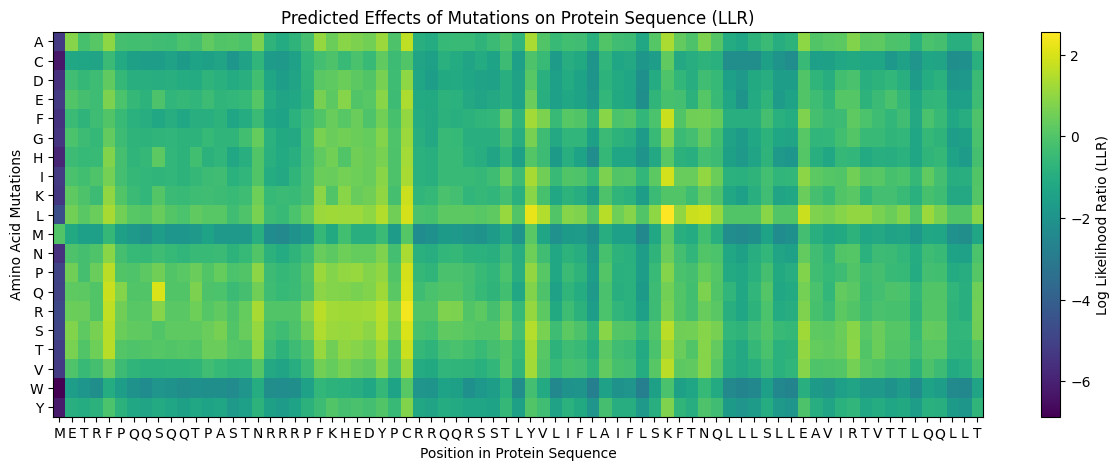
ESM2 scanning was performed on the full MS2 L-protein sequence using the facebook/esm2_t6_8M_UR50D model, generating Log Likelihood Ratio (LLR) scores for every possible single amino acid substitution across all 75 positions. A targeted scan was additionally applied to positions 38–60 to focus resolution on the soluble/TM boundary and transmembrane domain.
The heatmap revealed clear patterns. Leucine substitutions were broadly favored across the TM region (bright yellow L-row). Methionine and tryptophan substitutions were consistently penalized throughout (dark purple M and W rows). The N-terminus (residues 1–3) and the conserved RRR region (~11–13) showed strong sensitivity to substitution.
Top Mutations - Full Sequence Scan (positions 1–75)
| Position | WT | Mutant | LLR | Region |
|---|---|---|---|---|
| 50 | K | L | +2.561 | TM |
| 29 | C | R | +2.395 | Soluble |
| 39 | Y | L | +2.242 | Soluble/TM boundary |
| 29 | C | S | +2.043 | Soluble |
| 9 | S | Q | +2.014 | Soluble |
| 50 | K | I | +1.929 | TM |
| 53 | N | L | +1.865 | TM |
| 52 | T | L | +1.814 | TM |
| 45 | A | L | +1.539 | TM |
The targeted scan (positions 38–60) independently confirmed K50L (+2.561) and Y39L (+2.242) as the top two hits - a reproducibility signal that increases confidence in these positions as structurally tolerant by ESM.
Step 3: BLAST Alignment Analysis
Prior to selecting mutations, a BLAST alignment was performed against related phage L-protein sequences to identify positions that vary naturally across evolutionary homologs. Positions conserved across all aligned sequences were excluded from consideration, as conservation is a strong signal of functional essentiality that ESM LLR alone cannot capture. Positions selected for mutation — 9, 30, 45, 46, and 63 — were all confirmed as variable across the BLAST alignment, meaning natural sequence diversity at these sites exists in the phage sequence space. This provides an independent structural tolerance signal orthogonal to ESM scoring.
The sequence coverage image above shows the MSA depth available to the ESM model across L-protein positions. Coverage was critically limited to only 14 sequences — far below the ~100 sequences per position typically required for confident covariation-based prediction. This shallow MSA is one of the three major factors explaining the low confidence scores observed in the AF2-Multimer octamer prediction in Step 6. It also contextualizes the ESM2 predictions: the model is operating with sparse evolutionary signal for this protein, which is why cross-referencing with experimental lysis data is essential rather than optional.
Step 4: ESM vs. Experimental Cross-Reference
This is where things get genuinely interesting - and where the limitation of language model-based fitness prediction becomes concrete.
| Position | ESM Top Hit | LLR | Experimental Lysis | Protein Level | Agreement |
|---|---|---|---|---|---|
| 9 (S) | S→Q | +2.014 | Not tested | - | Unconfirmed |
| 29 (C) | C→R | +2.395 | Lysis=0 | 0 | ❌ Disagree |
| 39 (Y) | Y→L | +2.242 | Y→H: Lysis=0 | 0 | ❌ Disagree |
| 45 (A) | A→L | +1.539 | A→P: Lysis=1 | 1 | ✅ Agree |
| 50 (K) | K→L | +2.561 | K→E,I,N: Lysis=0 | 1 | ❌ Disagree |
| 53 (N) | N→L | +1.865 | N→S,D,H: Lysis=0 | 1 | ❌ Disagree |
| 30 (R) | - | - | R→Q,L: Lysis=1 | 1 | ✅ Experimental support |
| 46 (I) | - | - | I→F: Lysis=1 | 1 | ✅ Experimental support |
| 63 (V) | - | - | V→E: Lysis=1 | 1 | ✅ Experimental support |
The pattern is striking. K50 - the highest-scoring position in the entire dataset - is experimentally lethal. Every tested K50 substitution abolished lysis. The same holds for C29 and N53. ESM scores well above zero at all three positions, predicting broad substitution tolerance. Experimentally, they are functionally non-negotiable.
ESM2 learns from evolutionary sequence statistics across millions of proteins. What it cannot learn is that K50 in the L-protein appears functionally essential - possibly for oligomerization geometry, membrane topology orientation, or interaction with a specific bacterial target. C29 mutations abolish both lysis and protein expression, suggesting a role in co-translational folding or ribosomal interaction that no language model trained on amino acid co-occurrence patterns could detect. N53 mutations preserve protein expression but abolish lysis, suggesting this residue is specifically critical to the lysis mechanism - pore formation geometry perhaps - rather than to folding per se.
This is not a failure of ESM so much as a clarification of what it is actually measuring. It identifies structurally tolerant positions in the evolutionary sense. It cannot identify which positions are biochemically essential for a specific mechanism. The two are different questions, and this dataset makes that distinction concrete.
Step 5: Five Selected Mutations
Mutations were selected by integrating ESM LLR scores with experimental lysis data. Any position where the two sources of evidence disagreed was excluded.
| # | Position | WT→Mutant | LLR | Region | Experimental Lysis | Protein Level |
|---|---|---|---|---|---|---|
| 1 | 9 | S→Q | +2.014 | Soluble | Not tested | - |
| 2 | 30 | R→Q | ~+0.5 | Soluble | ✅ Lysis=1 | 1 |
| 3 | 45 | A→L | +1.539 | TM | ✅ Lysis=1 (A→P) | 1 |
| 4 | 46 | I→F | ~+0.9 | TM | ✅ Lysis=1 | 1 |
| 5 | 63 | V→E | ~+0.3 | TM | ✅ Lysis=1 | 1 |
Rationale:
S9Q was selected based on the highest ESM score among soluble domain positions not previously tested. S9 sits within the N-terminal DnaJ interaction region. Substitution to glutamine introduces a larger polar residue that may reduce DnaJ binding affinity - potentially conferring partial chaperone independence - while the conservative polar-to-polar change makes catastrophic folding disruption unlikely.
R30Q was selected on experimental confirmation (Lysis=1, Protein=1). R30 is part of the positively charged soluble domain, and neutralizing it to glutamine directly reduces the electrostatic surface that likely mediates DnaJ interaction, without disrupting expression or lysis competence.
A45L was selected on both ESM support (LLR = +1.539) and experimental confirmation that A45 tolerates substitution - A45P shows Lysis=1. Leucine replaces a small residue with a bulkier hydrophobic one, potentially improving hydrophobic packing in the TM helix and enhancing membrane insertion efficiency.
I46F was selected on experimental confirmation (Lysis=1, Protein=1). Phenylalanine at position 46 adds an aromatic residue to the hydrophobic TM core, which may strengthen helix-helix packing in the oligomeric pore assembly.
V63E was selected on experimental confirmation (Lysis=1, Protein=1). Glutamate at the C-terminal TM boundary introduces a negative charge at the membrane-cytoplasm interface - consistent with the positive-inside rule for membrane protein topology - which may facilitate the oligomeric pore assembly required for lysis.
All five mutations were selected at positions confirmed as non-conserved by BLAST alignment analysis. Four of five have direct experimental support for lysis competence.
Mutant sequences:
Step 6: AF2-Multimer Octameric Assembly
ColabFold AlphaFold2-multimer v3 was used to model a hypothesized octameric pore assembly by submitting eight identical copies of the wildtype L-protein sequence as a homo-octamer. All five predicted models returned uniformly low confidence scores: pLDDT ranged from 26.6–36.9, pTM from 0.149–0.193, ipTM from 0.114–0.143. The top-ranked model (model_1, ipTM = 0.143) displayed a starburst-like arrangement in which all eight chains radiated outward from a central core, with TM domains converging centrally and N-terminal soluble domains extending as disordered tails.
This radial topology is superficially consistent with a pore-forming architecture - TM helices converging from a central bundle is exactly what you’d expect for a membrane-spanning oligomeric pore. But the confidence scores preclude any definitive structural interpretation. Three compounding factors explain the poor prediction quality: AF2-Multimer lacks membrane context, so the hydrophobic TM domain appears disordered in aqueous modeling conditions; MSA coverage was critically limited to only 14 sequences, far below the ~100 per position required for confident covariation-based prediction; and the L-protein may be genuinely intrinsically disordered until membrane insertion occurs, which AF2 cannot model.

Individual model outputs:
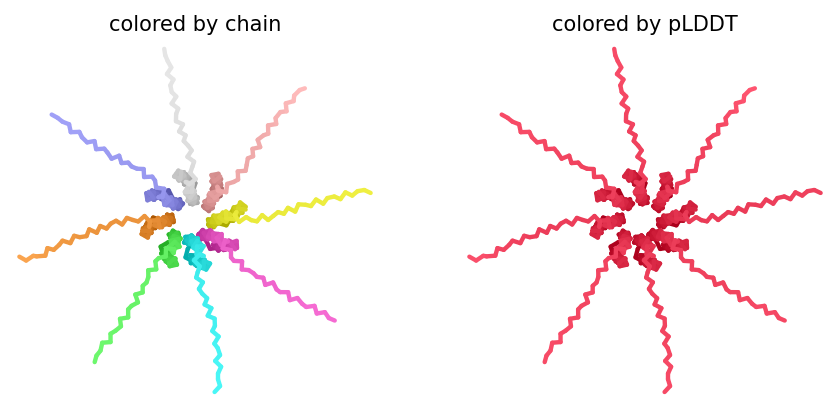
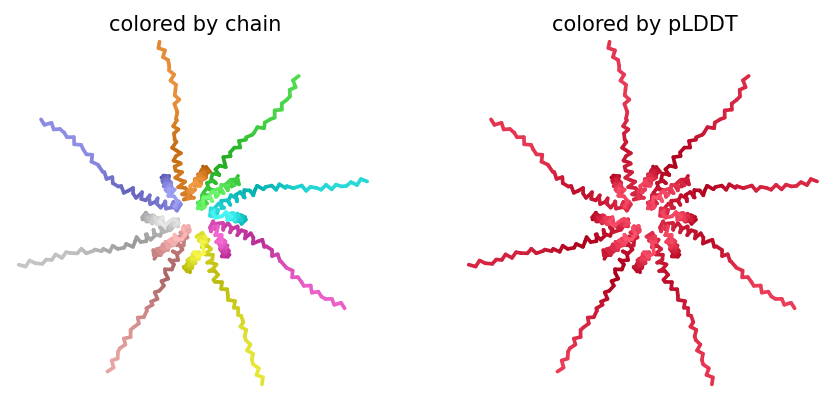
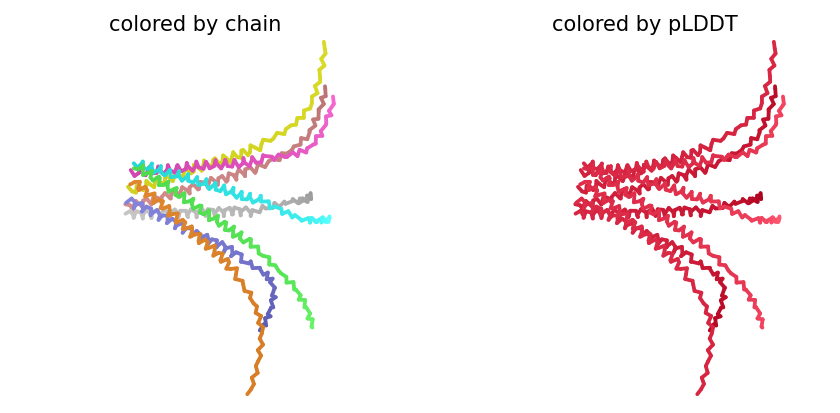
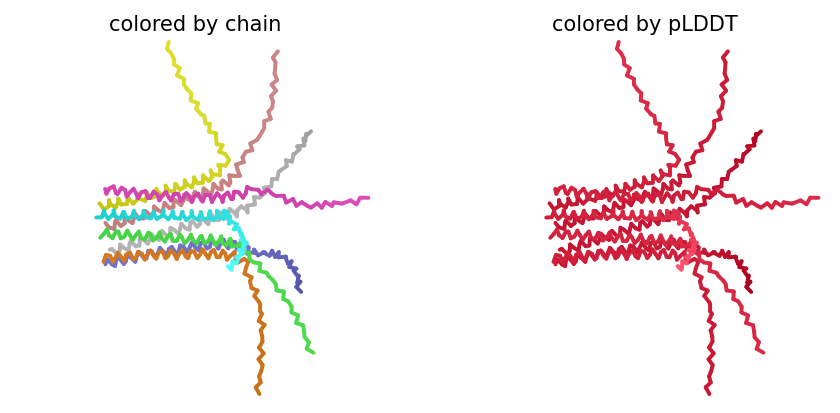
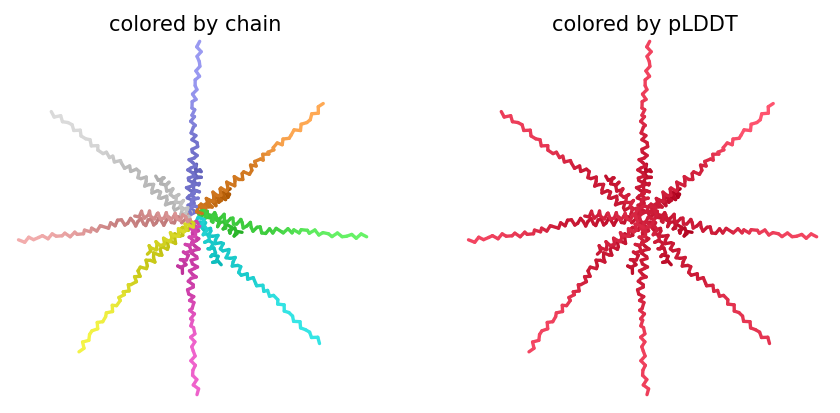
The consistent central TM clustering across multiple independent models does provide weak computational support for the pore-forming hypothesis - it’s something, even if it isn’t confident. This kind of result is also practically instructive: it tells you clearly where experimental validation has to carry the weight that computation cannot.
AF2-Multimer run log:
Open-Ended Question: Defining an Effective L-Protein Mutant
An effective L-protein mutant needs to satisfy five integrated criteria. First, lysis efficiency - measured via plaque assay as plaque size and clarity relative to wildtype MS2, where larger clearer plaques indicate faster or more complete bacterial killing. Second, DnaJ independence - assessed by testing infectivity in E. coli strains carrying the DnaJ chaperone resistance mutation, since this directly addresses the resistance mechanism the whole design exercise is oriented toward. Third, structural integrity - evaluated via AF2-Multimer prediction of oligomeric pore assembly, where effective mutants should maintain transmembrane topology and oligomerization capacity required for membrane perforation. Fourth, expression level - confirmed via Western blot or mass spectrometry, since a structurally competent mutant that is poorly expressed will fail in vivo regardless of intrinsic lysis activity. Fifth, evolutionary plausibility - mutations at positions that vary across a BLAST alignment of related phage L-proteins are more likely to be structurally tolerated, and this alignment serves as an independent check on ESM predictions.
Computationally, positive ESM LLR scores provide an initial structural tolerance filter. But as the K50 data demonstrate clearly, high ESM scores do not guarantee functional lysis activity. Experimental plaque assay validation remains the definitive standard. The most useful role for ESM in this workflow is not to replace experimental data but to prioritize which untested positions are worth testing next - it reduces the search space rather than eliminating the need to search.
Process Reflections
What this week reinforced most clearly is that computational tools are filters, not answers. PeptiVerse, ESM, and AlphaFold3 each measure something real and useful. None of them measures the same thing. The disagreements between them - WRSPAAALALGK’s high ipTM paired with low affinity, K50’s high LLR paired with zero experimental lysis, GTCGTSTQYYGT’s high pTM paired with moderate ipTM - are not failures of the pipeline. They are the information.
The skill is knowing what each tool is actually asking, and assembling a picture from genuinely independent lines of evidence rather than defaulting to whichever metric gives the cleanest answer. The K50 case in Part C crystallized this most sharply: a language model trained on evolutionary statistics correctly identified K50 as broadly sequence-tolerant, while experimental data showed it is biochemically non-negotiable for lysis. Both observations are true but neither alone is sufficient.
Works Cited
Abramson, J., Adler, J., Dunger, J., Evans, R., Green, T., Pritzel, A., Ronneberger, O., Willmore, L., Ballard, A. J., Bambrick, J., Bodenstein, S. W., Evans, D. A., Hung, C.-C., O’Neill, M., Reiman, D., Tunyasuvunakool, K., Wu, Z., Žemgulytė, A., Arany, Z., … Jumper, J. M. (2024). Accurate structure prediction of biomolecular interactions with AlphaFold 3. Nature, 630(8016), 493–500. https://doi.org/10.1038/s41586-024-07487-w
Bateman, A., Martin, M.-J., Orchard, S., Magrane, M., Ahmad, S., Alpi, E., Bowler-Barnett, E. H., Britto, R., Bye-A-Jee, H., Cukura, A., Denny, P., Dogan, T., Ebenezer, T., Fan, J., Garmiri, P., da Costa Gonzales, L. J., Hatton-Ellis, E., Hussein, A., Ignatchenko, A., … Wu, C. H. (2023). UniProt: The Universal Protein Knowledgebase in 2023. Nucleic Acids Research, 51(D1), D523–D531. https://doi.org/10.1093/nar/gkac1052
Chen, L. T., Quinn, Z., Dumas, M., Peng, C., Hong, L., Lopez-Gonzalez, M., Mestre, A., Watson, R., Vincoff, S., Zhao, L., Wu, J., Stavrand, A., Schaepers-Cheu, M., Wang, T. Z., Srijay, D., Monticello, C., Vure, P., Pulugurta, R., Pertsemlidis, S., … Chatterjee, P. (2025). Target sequence-conditioned design of peptide binders using masked language modeling. Nature Biotechnology. https://doi.org/10.1038/s41587-025-02761-2
Chen, T., Quinn, Z., Mishra, K., O’Connor, E. C., Silver, S. E., Zhang, Y., Valencia, M. J., Mei, Y., Behmoaras, J., Ferreira, L. M. R., & Chatterjee, P. (2026). moPPIt: De novo generation of motif-specific and functionally active peptide binders via discrete flow matching [Preprint]. bioRxiv. https://doi.org/10.1101/2024.07.31.606098
Evans, R., O’Neill, M., Pritzel, A., Antropova, N., Senior, A., Green, T., Žídek, A., Bates, R., Blackwell, S., Yim, J., Ronneberger, O., Bodenstein, S., Zielinski, M., Bridgland, A., Potapenko, A., Cowie, A., Tunyasuvunakool, K., Jain, R., Clancy, E., … Jumper, J. (2022). Protein complex prediction with AlphaFold-Multimer [Preprint]. bioRxiv. https://doi.org/10.1101/2021.10.04.463034
Jumper, J., Evans, R., Pritzel, A., Green, T., Figurnov, M., Ronneberger, O., Tunyasuvunakool, K., Bates, R., Žídek, A., Potapenko, A., Bridgland, A., Meyer, C., Kohl, S. A. A., Ballard, A. J., Cowie, A., Romera-Paredes, B., Nikolov, S., Jain, R., Adler, J., … Hassabis, D. (2021). Highly accurate protein structure prediction with AlphaFold. Nature, 596(7873), 583–589. https://doi.org/10.1038/s41586-021-03819-2
Kaplan, M., Narasimhan, S., de Heus, C., Zhao, J., Bharat, T. A. M., Young, R., & Bharat, T. A. M. (2022). Cryo-EM structure of the MS2 bacteriophage lysis protein L in complex with the DnaJ chaperone. Nature Communications, 13(1), 4102. https://doi.org/10.1038/s41467-022-31874-2
Lin, Z., Akin, H., Rao, R., Hie, B., Zhu, Z., Lu, W., Smetanin, N., Verkuil, R., Kabeli, O., Shmueli, Y., dos Santos Costa, A., Fazel-Zarandi, M., Sercu, T., Candido, S., & Rives, A. (2023). Evolutionary-scale prediction of atomic-level protein structure with ESMFold. Science, 379(6637), 1123–1130. https://doi.org/10.1126/science.ade2574
Mirdita, M., Schütze, K., Moriwaki, Y., Heo, L., Ovchinnikov, S., & Steinegger, M. (2022). ColabFold: Making protein folding accessible to all. Nature Methods, 19(6), 679–682. https://doi.org/10.1038/s41592-022-01488-1
Rives, A., Meier, J., Sercu, T., Goyal, S., Lin, Z., Liu, J., Guo, D., Ott, M., Zitnick, C. L., Ma, J., & Fergus, R. (2021). Biological structure and function emerge from scaling unsupervised learning to 250 million protein sequences. Proceedings of the National Academy of Sciences, 118(15), e2016239118. https://doi.org/10.1073/pnas.2016239118
Shi, Y., Iyer, A., Liu, F., & Bhattacharya, S. (2023). PeptiVerse: An integrated platform for multi-property therapeutic peptide prediction [Preprint]. bioRxiv. https://doi.org/10.1101/2023.10.11.561829
UniProt Consortium. (2023). UniProt entry: P00441 · SODC_HUMAN. UniProt Knowledgebase. https://www.uniprot.org/uniprotkb/P00441/entry
Wang, G., Heberle, F. A., Chen, R., & Sun, F. (2022). Phage lysis proteins as targeted antibacterials. Pharmaceuticals, 15(9), 1062. https://doi.org/10.3390/ph15091062
Young, R. (2014). Phage lysis: Three steps, three choices, one outcome. Journal of Microbiology, 52(3), 243–258. https://doi.org/10.1007/s12275-014-4087-z
AI Prompts Employed (Claude AI)
- Cross-reference ESM LLR scores against experimental lysis data and identify where they agree vs. disagree
- Identify the best peptide to advance using integrated AF3, PeptiVerse, and moPPIt data
- Explain why ESM would score K50 highly despite experimental evidence that K50 is functionally essential
- Draft rationale for each of five selected L-protein mutations that integrates ESM scores with experimental confirmation
Week 6
Node participant note: I am a remote Genspace node listener based in Nigeria without onsite lab access. The Week 6 Gibson Assembly lab was a wet-lab session at Genspace nodes. In lieu of physical bench access, I engaged with the assembly logic computationally: the primer design, overlap verification, and construct validation workflows documented in Parts A and B were completed in Benchling and represent my full remote engagement with the lab material.
Class Assignment — Week 6
Part A. DNA Assembly
1. Components of Phusion High-Fidelity PCR Master Mix
A) Phusion DNA Polymerase A DNA-binding protein subunit that ensures higher template processivity, speed, and accuracy/fidelity alongside 5´→3´ polymerase activity and 3´→5´ exonuclease activity for proofreading.
B) Phusion Reaction Buffer (HF or GC) An optimized buffer that provides high salt concentrations used to stabilize primer-template hybridization. HF Buffer is the default for high fidelity, while GC Buffer helps with GC-rich or difficult templates.
C) MgCl₂ Provides the necessary magnesium ions for Phusion DNA polymerase activity.
D) dNTPs Exist as Deoxynucleoside triphosphates in either dATP, dTTP, dGTP, or dCTP. They act as the building blocks for synthesizing the new DNA strand.
E) DMSO Dimethyl sulfoxide acts alongside the Phusion reaction buffer as a PCR additive to aid the denaturation of templates with high GC content or complex secondary structures.
F) Stabilizers Components that maintain the integrity and activity of the enzyme during storage and cycling, often including bovine serum albumin (BSA).
2. Factors Determining Primer Annealing Temperature During PCR
Primer annealing temperature in PCR is primarily determined by the melting temperature of the primer-template duplex, which represents the temperature at which 50% of the primers are bound to the template.
A) Primer Melting Temperature Directly related to primer annealing temperature.
B) Primer Length Directly related to primer annealing temperature; optimally 18–24 bp.
C) GC Content Total percentage of GC content is directly related to primer annealing temperature; usually optimal at 40–60%.
D) Ionic Strength Mg²⁺ concentration is directly related to primer annealing temperature.
E) Primer Concentration Directly related to binding probability and therefore to primer annealing temperature.
F) Presence of Additives DMSO, glycerol, or formamide presence is inversely related to primer annealing temperature.
G) Target DNA When the target contains GC-rich templates, a higher primer annealing temperature is often required — i.e. directly related.
3. PCR vs. Restriction Enzyme Digests: Comparison of Two Methods for Creating Linear DNA Fragments
Mechanism PCR uses a thermostable polymerase to exponentially amplify a target region using designed primers, starting from a tiny amount of template. It generates millions of identical copies through cycles of denaturation, annealing, and extension. A restriction enzyme (RE) digest, on the other hand, uses sequence-specific endonucleases that recognize short palindromic sequences (typically 4–8 bp) and cleave both strands at or near that site, producing non-identical fragments defined entirely by where those sites happen to fall in the existing DNA.
Ends Produced PCR with standard primers produces blunt-ended fragments, but with Gibson-specific primers the overhangs are built into the primer sequence itself, so the linear product has the exact 20–22 bp overlap sequence that is designed. REs typically leave either sticky ends (4 bp 5’ or 3’ overhangs) or blunt ends depending on the enzyme. These sticky ends can be directly ligated but are constrained by the availability of RE recognition sites in the template.
When Each Is Preferred PCR is the clear choice when there is a need to introduce mutations, when no convenient RE site flanks the insert, or when customized overhangs are needed especially for Gibson assembly. RE digests are preferred when working with a well-characterized vector/insert system that already has compatible sites, when high fidelity without PCR-introduced errors is required, or when performing directional cloning into a backbone pre-cut with two different enzymes.
Error Profile PCR can introduce point mutations at a rate that depends on polymerase fidelity. Phusion HF, used in this lab protocol, has an error rate approximately 50× lower than Taq, making it appropriate for mutagenesis work where only the intended changes should be introduced. RE digests introduce no sequence errors.
4. Ensuring DNA Sequences Are Appropriate for Gibson Cloning
A) Overlapping sequences must be present and correct Gibson exonuclease chews back 5’ ends to expose single-stranded tails that then anneal to complementary tails on the adjacent fragment. If PCR primers were designed with the correct 20–22 bp overhang matching the adjoining fragment, the overlap is automatically built in. For RE-digested fragments, it is important to confirm that the sticky ends of one fragment are complementary to those of the adjoining fragment, which typically means using compatible enzymes (e.g., BamHI + BglII both produce GATC overhangs).
B) Fragment orientation must be correct (5’→3’) Each primer and fragment sequence should be verified in Benchling or SnapGene to confirm that directionality is preserved. A reversed insert is the most common and often the most costly error.
C) Fragment length and concentration must be within working range After gel electrophoresis, bands must appear at the expected sizes — backbone at approximately 3 kb and insert at approximately 300 bp as expected from the mUAV plasmid. Nanodrop concentration should exceed approximately 30 ng/µL.
5. How Plasmid DNA Enters E. coli Cells During Transformation
The process involves heat-shock transformation with chemically competent DH5α cells. Competent cells are pre-treated with divalent cations (typically CaCl₂), which partially neutralize the negative charge of the cell membrane’s lipopolysaccharide layer and the DNA backbone, reducing electrostatic repulsion. When the 42°C heat shock is applied for exactly 45 seconds, it creates a transient thermal imbalance that temporarily disrupts the membrane, creating pores or channels through which the plasmid can enter by diffusion. The cells are immediately transferred back to ice to reseal the membrane. Recovery in SOC media (Super Optimal broth with Catabolite repression) for 60 minutes at 37°C allows cells to repair the membrane, express the chloramphenicol resistance gene from the newly acquired plasmid, and begin dividing so that when plated on selective media, only transformants survive. Alternatively, electroporation works more definitively by using a brief high-voltage pulse to create quantifiable electropores, which generally yields higher efficiency than heat shock.
6. Alternative Assembly Method: Golden Gate Assembly
Overview
Golden Gate Assembly is a DNA assembly method that leverages Type IIS restriction enzymes — most commonly BsaI or Esp3I — which cut outside their recognition sequence at a defined offset, generating customizable 4 bp overhangs. Unlike conventional REs, which leave their recognition site in the product, the Type IIS enzyme cuts away from itself so that the recognition site is excised along with the surrounding primer sequence, leaving a scar-free junction. Each fragment is PCR-amplified with primers that embed the BsaI site facing outward, followed by the desired 4 bp overhang unique to that junction. The enzyme cuts all fragments simultaneously, exposing these complementary 4 bp tails, which then direct fragment annealing in the correct order — because only perfectly complementary overhangs will anneal stably. T4 DNA ligase seals the nicks in the same reaction tube. The reaction cycles between the cutting temperature (~37°C) and ligation temperature (~16°C) repeatedly, driving the equilibrium toward a fully assembled, circularized product. Golden Gate can assemble up to approximately 10 fragments simultaneously with high efficiency and directional fidelity, making it especially powerful for large combinatorial pathway assembly such as building multi-part biosynthetic operons, where Gibson’s exonuclease-dependent overlap system becomes less efficient.
Golden Gate vs. Gibson Assembly

Gibson uses a 5’ exonuclease to chew back fragments and generate long (20–40 bp) single-stranded overhangs for annealing, which then require a polymerase to fill gaps and a ligase to seal them. Golden Gate uses short 4 bp Type IIS-generated overhangs and no exonuclease — simpler biochemistry, but the overhangs are shorter and specificity depends entirely on the 4 bp sequence design. Ligation of wrong-order fragments can occur if overhang sets are not carefully designed to be unique. Gibson is more forgiving for large fragments; Golden Gate is faster and more multiplexable for modular, repetitive assemblies.
| Feature | Gibson Assembly | Golden Gate Assembly |
|---|---|---|
| Enzyme type | 5’ exonuclease + polymerase + ligase | Type IIS RE + T4 ligase |
| Overlap length | 20–40 bp | 4 bp |
| Scars left | None | None (RE site excised) |
| Max fragments | 5–6 efficiently | Up to 10+ |
| Best for | Large fragments, flexible design | Modular, combinatorial assemblies |
| Error risk | PCR errors at junctions | Wrong-order ligation if overhangs not unique |
Benchling Model
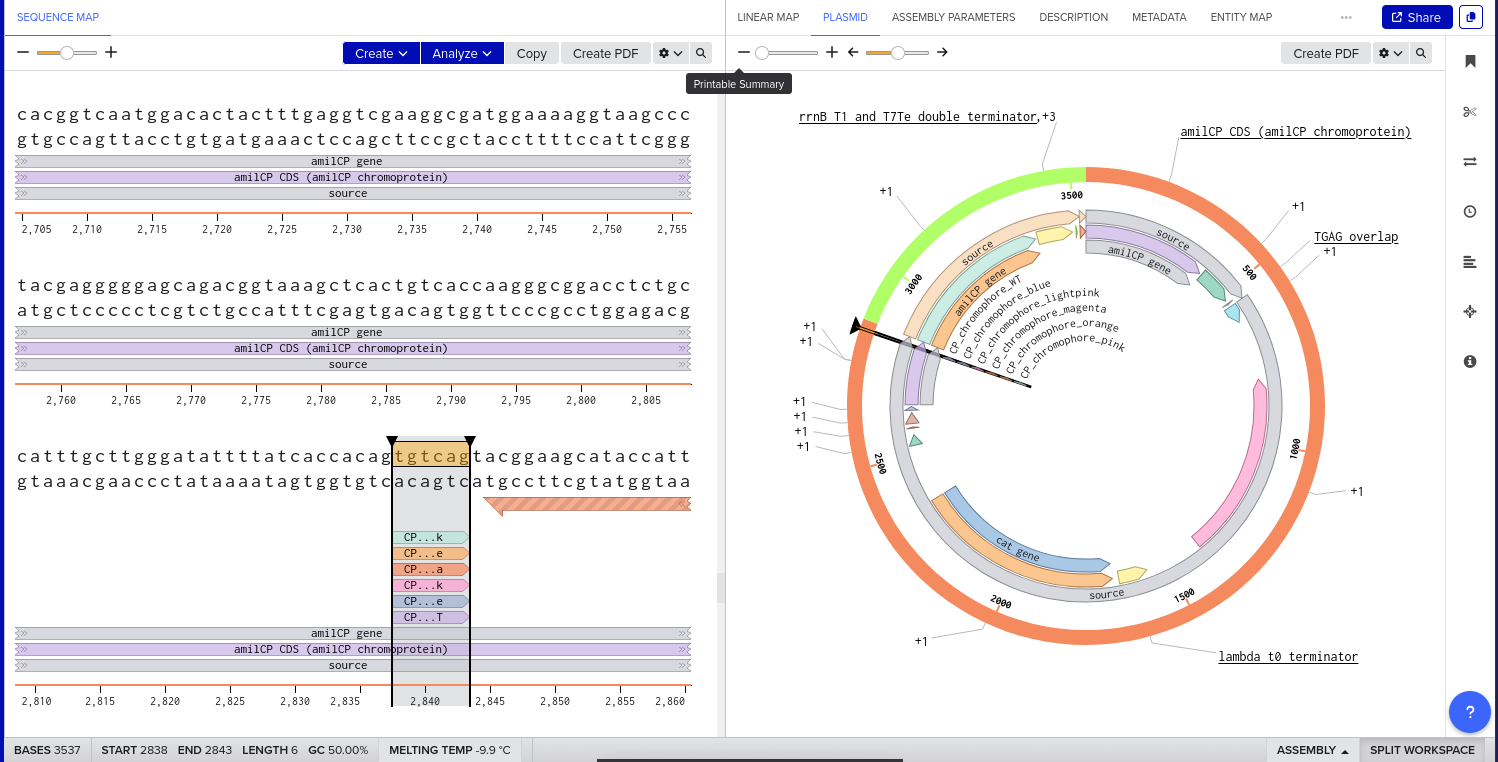
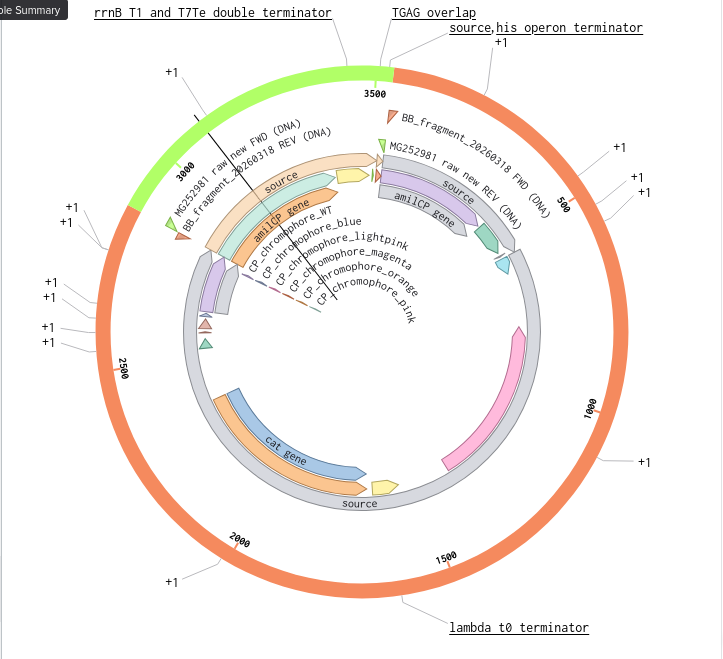
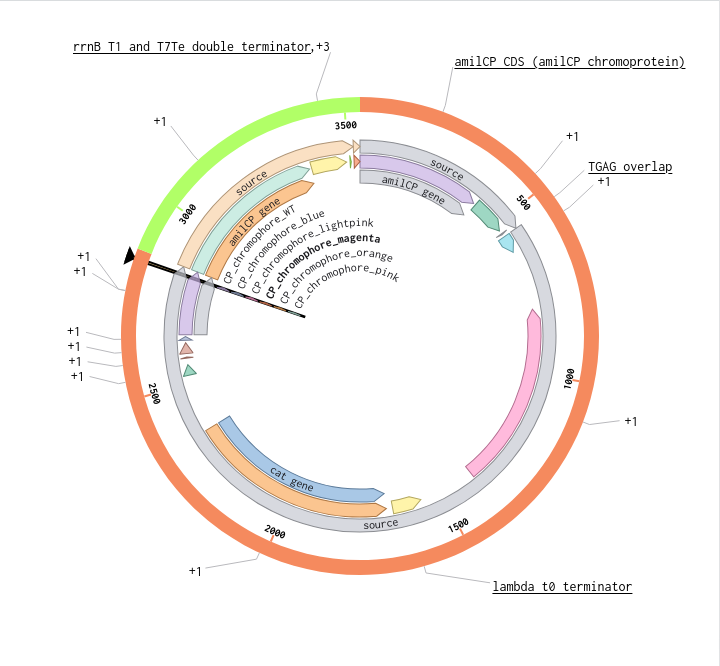

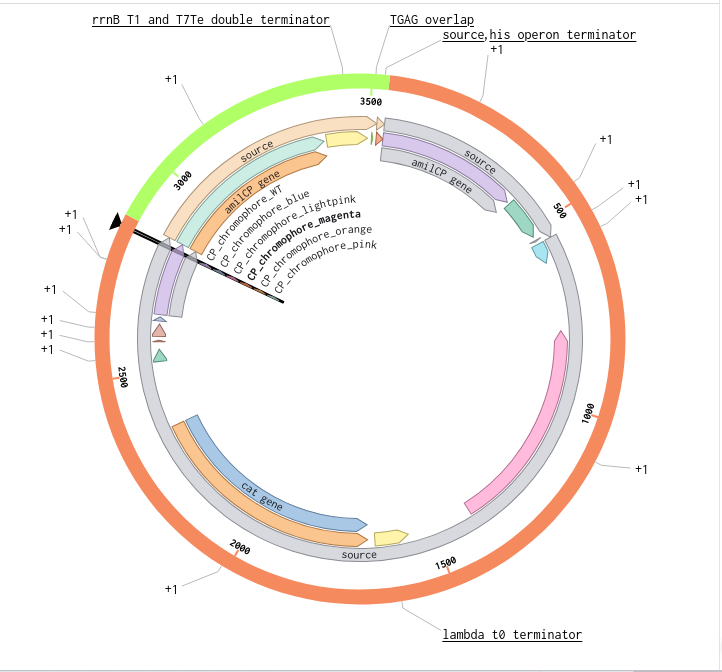


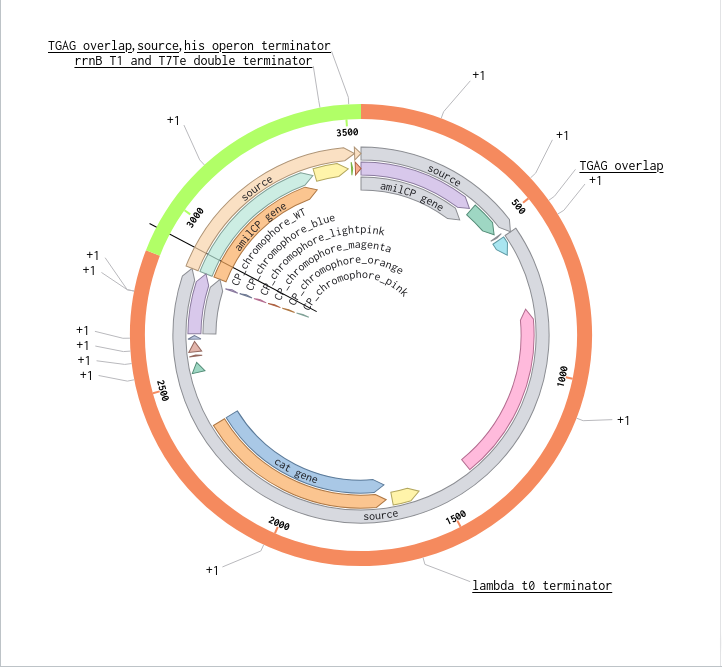
Part B. Asimov Kernel
Folder: John_Adeyemo_Adedeji_Genspace (Benchling workspace)
The construct I designed in the Asimov Kernel exercise is a minimal tetrathionate-responsive MccH47 expression cassette for E. coli Nissle 1917 (EcN). The design logic follows directly from the ÌṢỌ project architecture.
Process Reflections
What struck me most this week was how much assembly method choice is actually a design decision rather than a technical one. The distinction between Gibson and Golden Gate is not simply about what enzymes you use, it is about what failure modes you are willing to accept and what flexibility you need downstream. Gibson forgives imprecise fragments but penalises you on multiplexability. Golden Gate rewards modular combinatorial thinking but demands that you get the 4-bp overhang design exactly right, every time.
The deeper insight was about error propagation. In a sequential biological engineering pipeline, a mistake at the assembly stage is not recoverable at the sequencing stage, it shows up as a wrong construct that passes gel verification but fails functional testing. Designing assembly from the perspective of what can go wrong, rather than what should go right, shifted how I think about planning synthesis-to-expression workflows for ÌṢỌ.
The Asimov kernel exercise reinforced that genetic circuit design has a grammar, not just a vocabulary. Parts have semantics. Composability is a property you engineer for, not something you assume.
Works Cited
Gibson, D. G., Young, L., Chuang, R.-Y., Venter, J. C., Hutchison, C. A., & Smith, H. O. (2009). Enzymatic assembly of DNA molecules up to several hundred kilobases. Nature Methods, 6(5), 343–345. https://doi.org/10.1038/nmeth.1318
Engler, C., Kandzia, R., & Marillonnet, S. (2008). A one pot, one step, precision cloning method with high throughput capability. PLoS ONE, 3(11), e3647. https://doi.org/10.1371/journal.pone.0003647
Palmer, J. D., Piattelli, E., McCormick, B. A., Silby, M. W., Brigham, C. J., & Bucci, V. (2017). Engineered probiotic for the inhibition of Salmonella via tetrathionate-induced production of Microcin H47. ACS Infectious Diseases, 4(1), 39–45. https://doi.org/10.1021/acsinfecdis.7b00114
Benchling, Inc. (2024). Molecular biology platform. https://benchling.com
AI Prompts Employed (Claude AI)
- What are the actual failure modes of Gibson assembly versus Golden Gate, not just the standard advantages
- Explain what Type IIS restriction enzymes are doing differently from conventional enzymes
- Why does Golden Gate have a higher error rate when overhang uniqueness is not enforced
- Walk me through what an Asimov kernel construct definition looks like for a biosensor circuit
Week 7
Node participant note: I am a remote Genspace node listener based in Nigeria without onsite lab access. The Week 7 neuromorphic circuits lab was a wet-lab and simulation session at Genspace nodes. I engaged with the circuit design material computationally, including Tellurium ODE modelling of the ÌṢỌ biosensor response circuit, and the Twist order documented in Part C represents my primary lab deliverable for this week.
Class Assignment — Week 7
Part A. Intracellular Artificial Neural Networks (IANNs)
1. Advantages of IANNs over Boolean Genetic Circuits
Boolean genetic circuits are fundamentally limited by their design logic: every input gets collapsed into a binary state, and the circuit operates on those discrete values. That works for simple switch-like decisions, but most physiologically relevant signals (metabolite concentrations, osmotic gradients, and quorum sensing molecule titres), exist on a continuum, and forcing them through a hard threshold discards information. IANNs avoid this by processing analog inputs directly, generating graded outputs that reflect the actual magnitude of the input rather than just which side of a threshold it fell on.
The deeper advantage is function approximation capacity. A sufficiently wide or deep network of gene-regulatory elements functioning as weighted summing nodes can approximate arbitrary continuous input-output relationships, which means you can in principle encode complex multi-factor decisions (that respond strongly when signal A is high and signal B is moderate and signal C is low, but not when all three are high) without the combinatorial explosion of logic gates that an equivalent Boolean circuit would require. Practically, this also reduces the parameterisation burden: you train the network on data rather than manually calibrating each gate’s individual threshold and transfer function, which for complex Boolean circuits is a significant experimental cost.
Noise robustness is the third real advantage. Biological systems are stochastic, and Boolean circuits that depend on clean thresholding behave poorly when input signals are noisy or when component expression varies between cells. Analog processing distributes the computation across multiple nodes, so no single component’s noise dominates the output.
2. IANN Application — ÌṢỌ / Gut Sentinel Context
The continuous modelling capacity of an IANN is directly relevant to the gut sentinel problem. The challenge with engineering E. coli Nissle 1917 as a therapeutic probiotic is that its fitness and output behaviour depend on a genuinely continuous environmental landscape — luminal pH, competing commensal species densities, pathogen metabolite concentrations, mucus layer thickness, transit rate. A Boolean circuit could in principle be designed to activate effector expression above some threshold concentration of a target metabolite, but that assumes a single clean input drives the decision. Real gut ecology doesn’t work that way.
An IANN implemented in EcN could integrate multiple continuous environmental inputs simultaneously, tetrathionate concentration, competing species quorum signals, local oxygen tension, and produce a graded effector output proportional to the true threat level rather than a binary kill switch. This is particularly relevant to the evolutionary stability question in the ÌṢỌ framework: a cell population making graded decisions about resource allocation to effector production versus growth will, under selection, behave more like a stable evolutionarily stable strategy than one operating a hard switch that either maximally expresses a costly effector or doesn’t express it at all.
The limitations are substantial though. Implementing an IANN in a living cell requires physical instantiation of weighted connections as actual molecular interactions (protein-protein binding affinities, RNA regulatory elements, transcription factor binding strengths), all of which drift under evolutionary pressure, are sensitive to cellular metabolic state, and cannot be reconfigured in situ once the cell is deployed. Training the network computationally is achievable; translating the learned weights into specific DNA sequences encoding the required regulatory strengths is not straightforward, and verifying that the implemented network actually computes what you intended in a complex in vivo environment like the gut is a significant experimental challenge. There is also a metabolic cost argument: implementing even a shallow network requires expressing multiple non-native regulatory proteins simultaneously, which imposes a fitness burden that selection will work against over time.
3. Intracellular Multilayer Perceptron
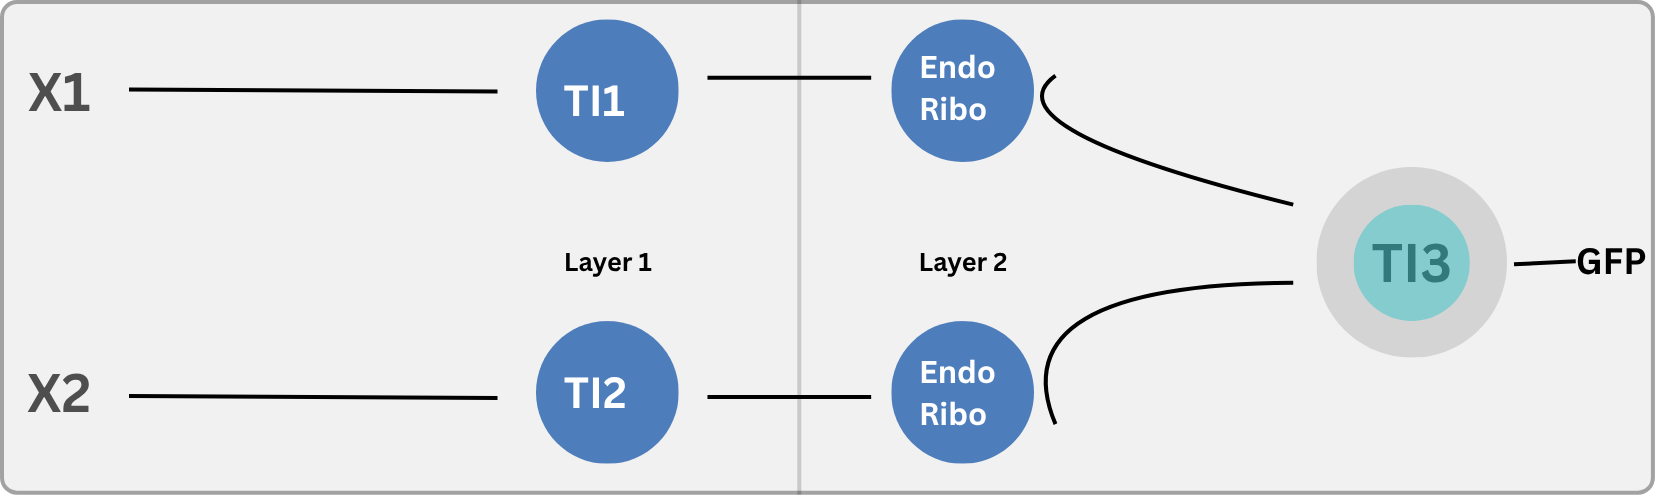
Part B. Fungal Materials
1. Examples of Existing Fungal Materials and Their Applications
The most commercially visible fungal materials are mycelium-based composites — mycelial networks grown through agricultural waste substrates like hemp hurds or corn stalks, then heat-treated to halt growth and pressed into rigid forms. Companies like Ecovative have used this to produce packaging, acoustic panels, and leather-like textiles. In construction contexts, mycelium composites offer comparable compressive strength to expanded polystyrene at a fraction of the carbon cost, with full biodegradability at end of life.
In the medical context specifically, fungal-derived materials have a longer history than the mycelium-composite trend might suggest. Chitin and its deacetylated derivative chitosan (both derived from fungal cell walls) have been extensively evaluated as wound dressings, drug delivery scaffolds, and haemostatic agents. Chitosan’s cationic character at physiological pH allows it to interact electrostatically with bacterial membranes and negatively-charged wound exudate, giving it both antimicrobial and pro-coagulant properties without the immunogenicity concerns associated with animal-derived alternatives like collagen. For biosecurity and field-medicine applications, chitosan-based haemostatic dressings are already in clinical and military deployment, HemCon dressings were among the first to translate this directly into combat casualty care.
The disadvantages are real though. Batch-to-batch consistency in fungal-derived biomaterials is harder to control than synthetic polymer manufacturing: chitin extraction yields vary with growth conditions, and residual endotoxin or beta-glucan contamination from fungal cell wall debris poses immunogenicity risks in any implantable or injectable application. Regulatory classification is also still unsettled in many jurisdictions: a mycelium-derived scaffold sits awkwardly between a device and a biological, which complicates approval pathways considerably.
For biofabrication purposes, the more interesting frontier is using fungal hyphal networks as living scaffolds for tissue engineering — mycelial architecture naturally produces interconnected porous networks at scales relevant to vascularisation, something genuinely difficult to replicate by synthetic additive manufacturing. The limitation here is that you are working with a eukaryotic organism that has its own growth agenda, and getting predictable pore geometry without precise genetic intervention remains challenging.
2. Genetic Engineering in Fungi for Biopharmaceuticals and Protein Therapeutics
The application I find most compelling is using engineered Pichia pastoris (now reclassified as Komagataella phaffii) or Saccharomyces cerevisiae as chassis for producing complex glycosylated therapeutic proteins, biologics that bacteria fundamentally cannot make correctly.
This is where the core advantage of fungal synthetic biology over bacterial systems becomes concrete: post-translational modification. Bacteria lack the endoplasmic reticulum machinery for N-linked glycosylation, disulfide bond formation in a controlled oxidising environment, and proper signal peptide processing for secretion. A therapeutic antibody fragment, a vaccine antigen, or a receptor-binding protein domain that depends on correct glycosylation for receptor recognition, serum half-life, or effector function simply cannot be produced functionally in E. coli without extensive refolding steps that introduce batch variability and reduce yield. Yeast do all of this co-translationally in a compartmentalised secretory pathway that is genuinely homologous to mammalian cells.
For vaccinology specifically, yeast-expressed virus-like particles are already an established platform, the hepatitis B surface antigen in Engerix-B is produced in S. cerevisiae, and the HPV L1 capsid proteins in Gardasil are produced in the same host. The self-assembly capacity of these proteins into immunogenic particles in a yeast secretory environment is something a bacterial chassis would struggle with. Engineering Pichia further, humanising its N-glycosylation pathway to reduce the hypermannose patterns that drive immunogenicity in native yeast glycoproteins, moves the output closer to what a mammalian CHO cell would produce, but at fermentation costs that are orders of magnitude lower.
The limitations worth being honest about: yeast genetic toolkits are less mature than bacterial ones. CRISPR-based genome editing in S. cerevisiae is well-established, but in non-model yeasts the efficiency drops sharply. Promoter libraries, ribosome binding site tuning, and the kind of fine transcriptional control you take for granted in E. coli requires considerably more development effort in a fungal host. Secretion titres for complex proteins also remain lower than CHO cells for the most demanding biologics, and hypermannose glycosylation, even with humanisation efforts, is still not identical to human-type glycans, which matters for Fc-mediated effector functions in therapeutic antibody applications.
Part C. First DNA Twist Order
The Microcin M expression cassette was designed for cloning into pUC19, a high-copy ColE1-origin plasmid carrying ampicillin resistance. pUC19 was selected primarily for its well-characterised cloning sites and broad compatibility with standard E. coli transformation protocols, practical considerations given that the immediate goal is sequence verification rather than stable expression. The MccH47 insert is flanked by EcoRI and HindIII sites for directional cloning into the multiple cloning site. The complete annotated construct is deposited in the class Benchling folder as MccH47_pUC19_EcN_construct.
For downstream ÌṢỌ deployment, the cassette would need migration to a lower-copy backbone (pSC101 or a chromosomal integration vector) to reduce metabolic burden on the EcN chassis and improve evolutionary stability under selection.
Full backbone documentation on Week 2
Circuit Design trial and error learning process
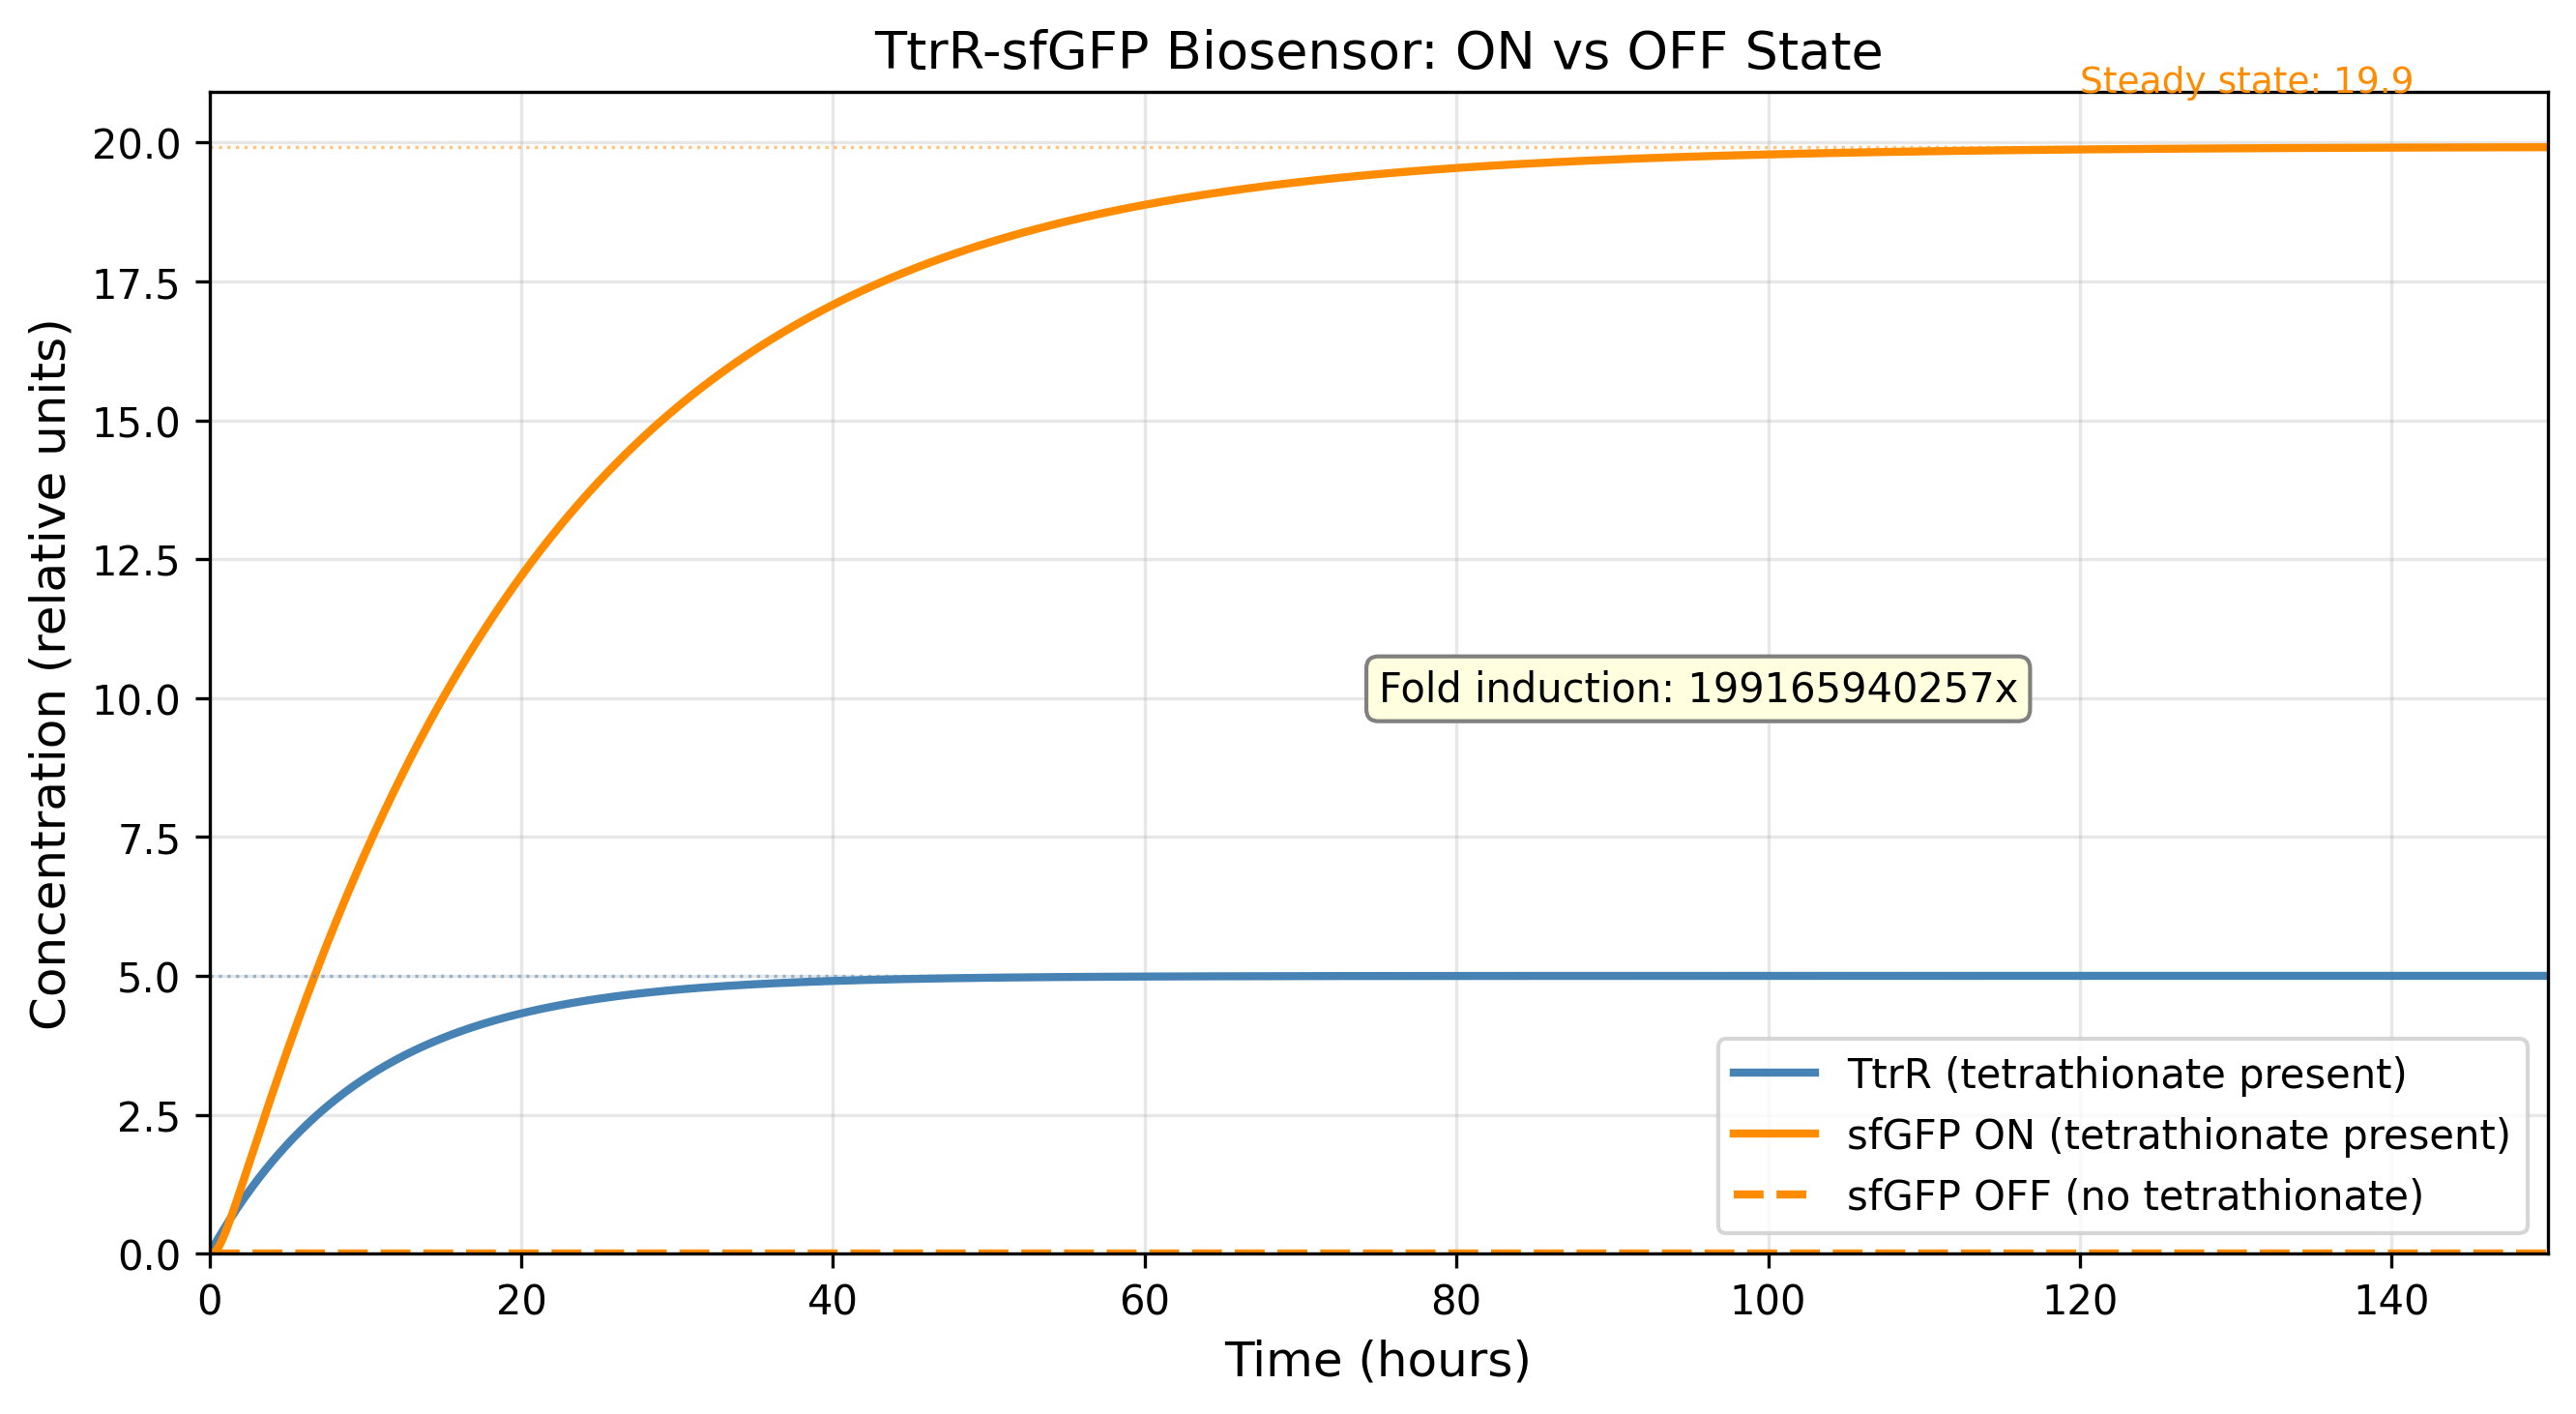
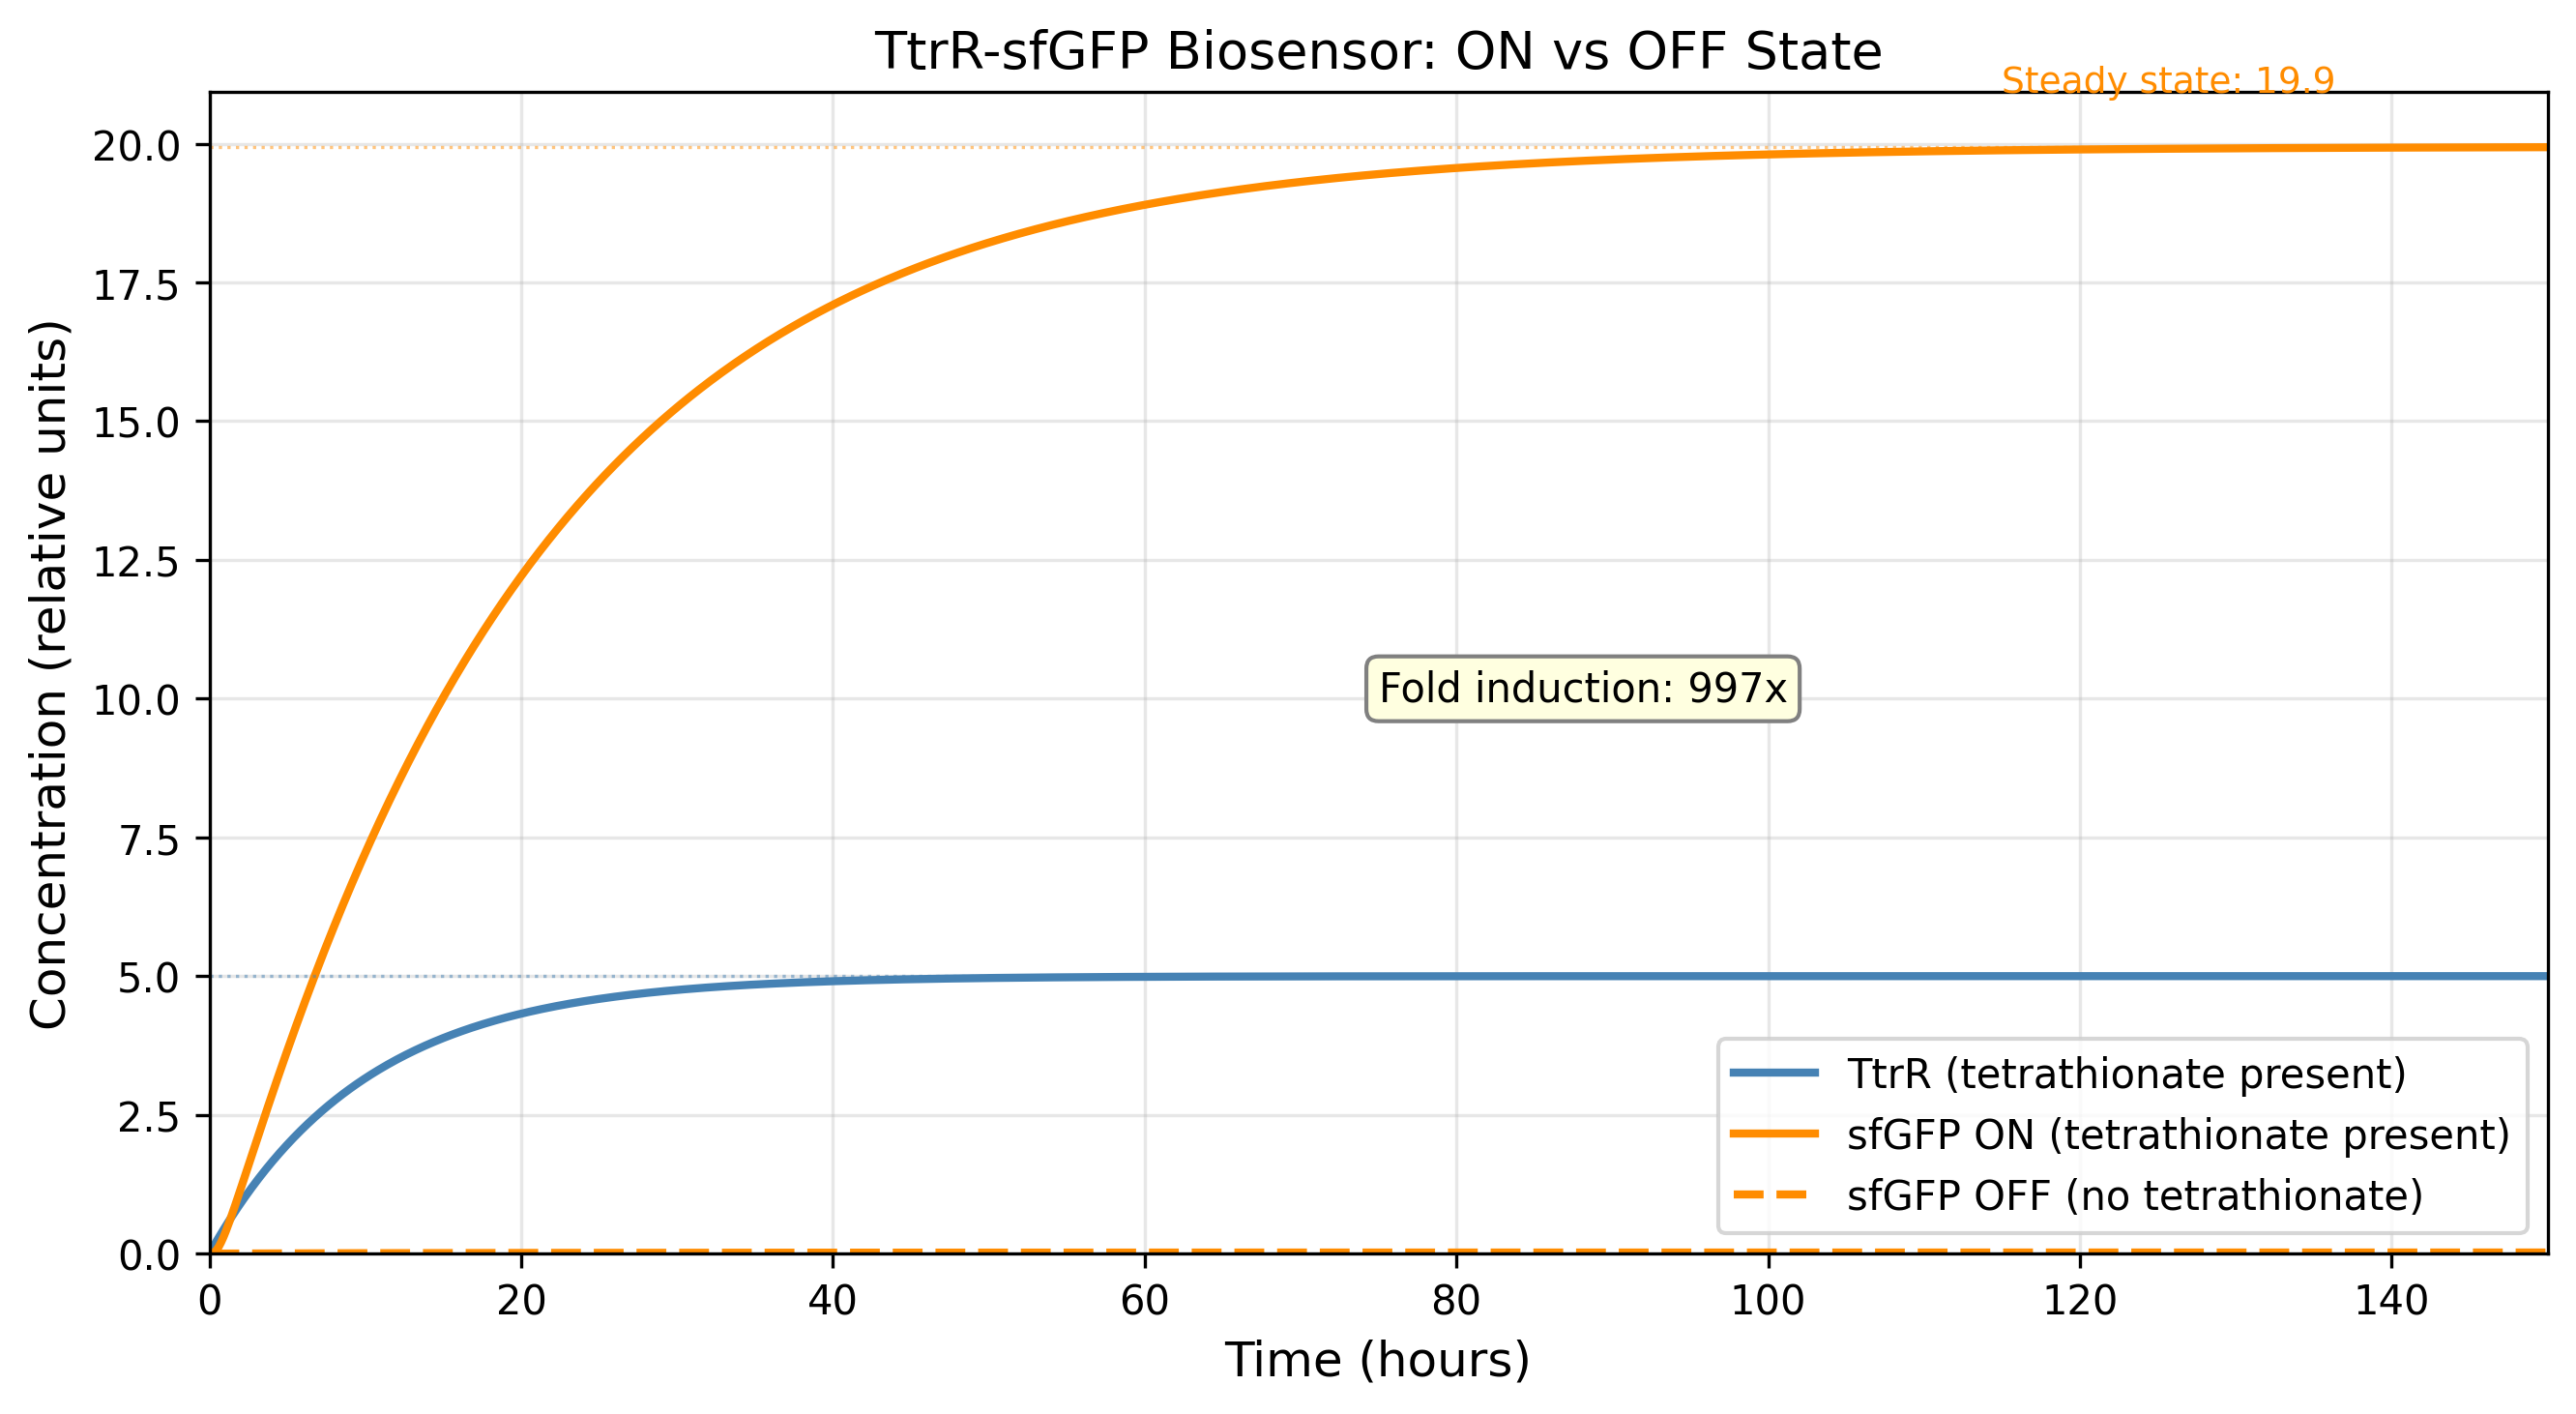
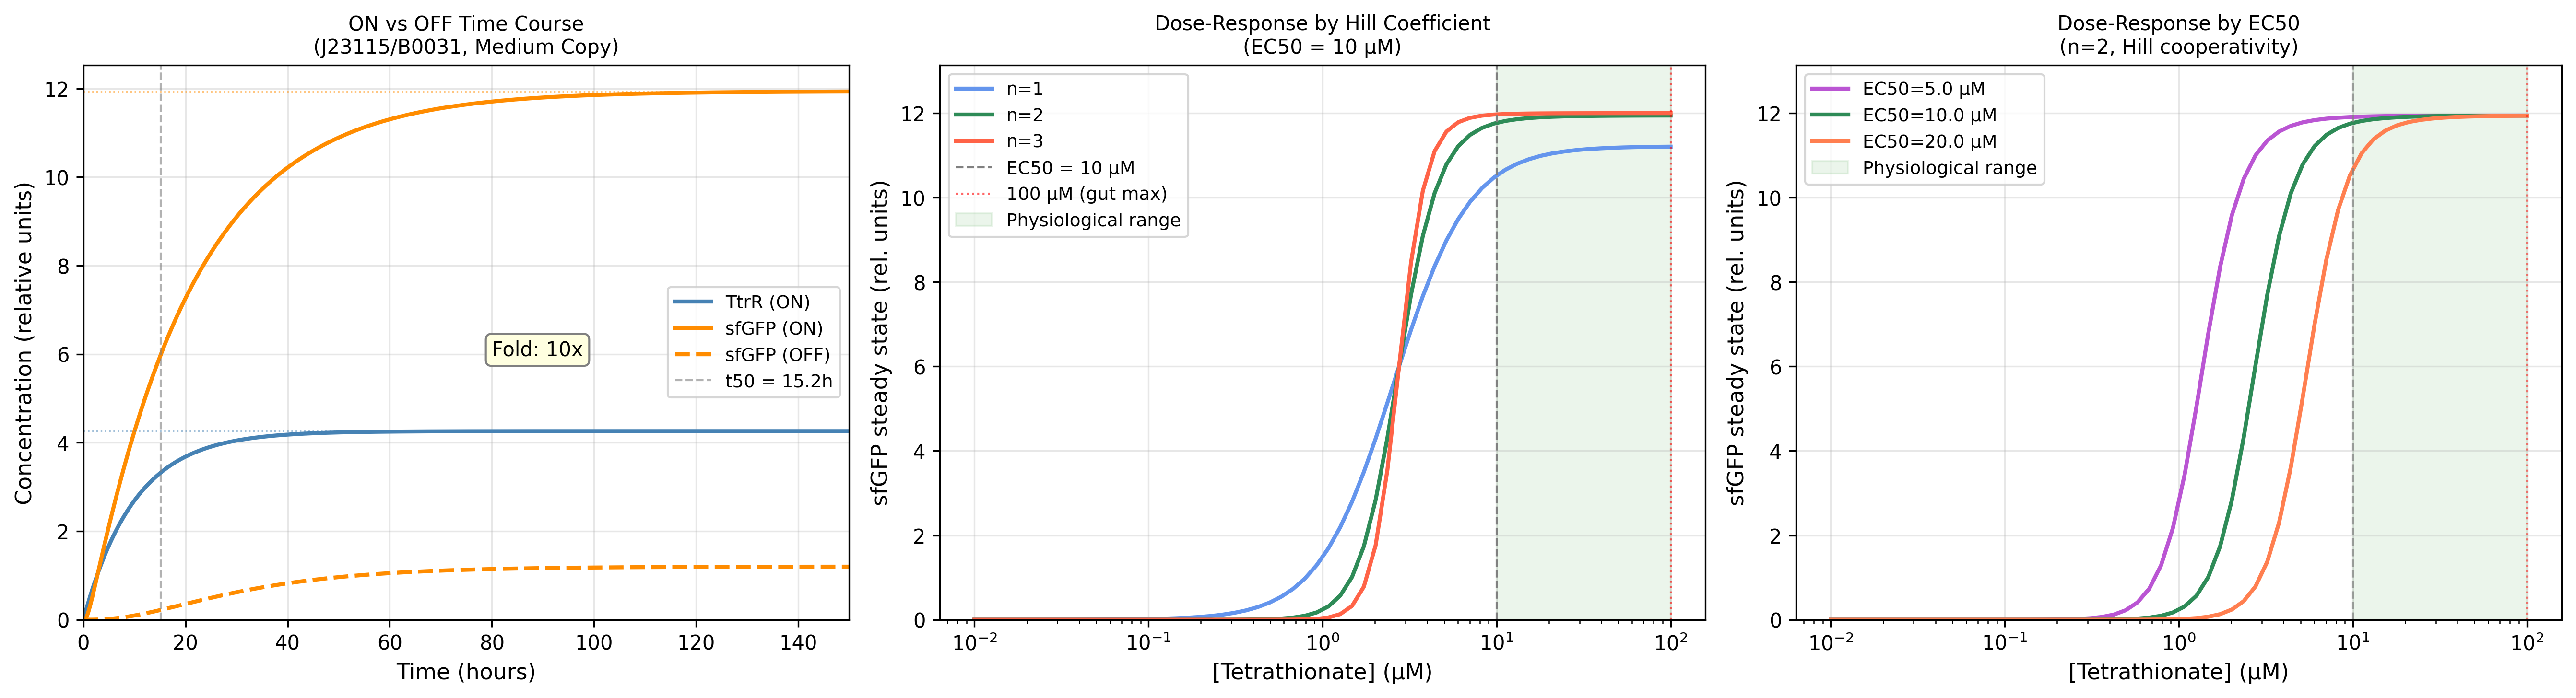
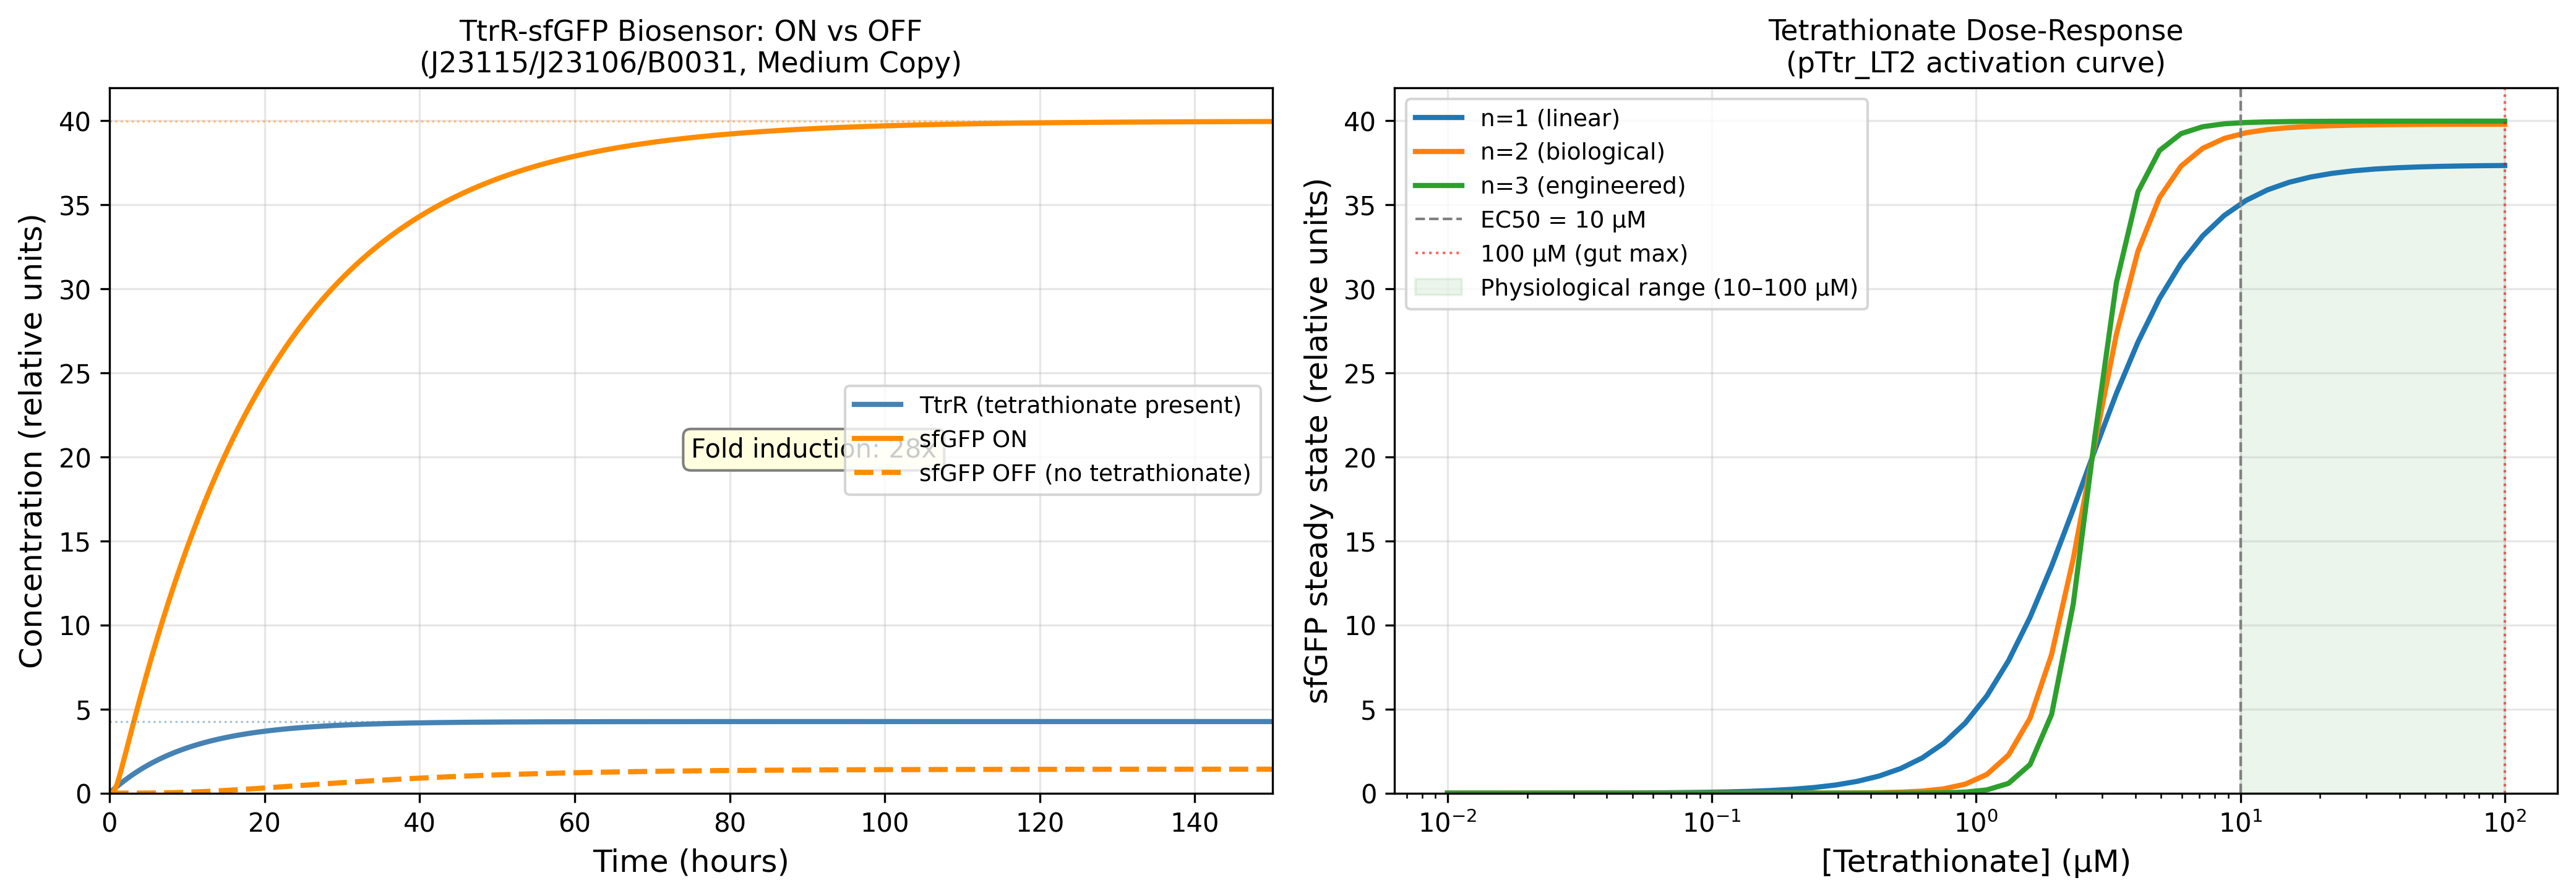

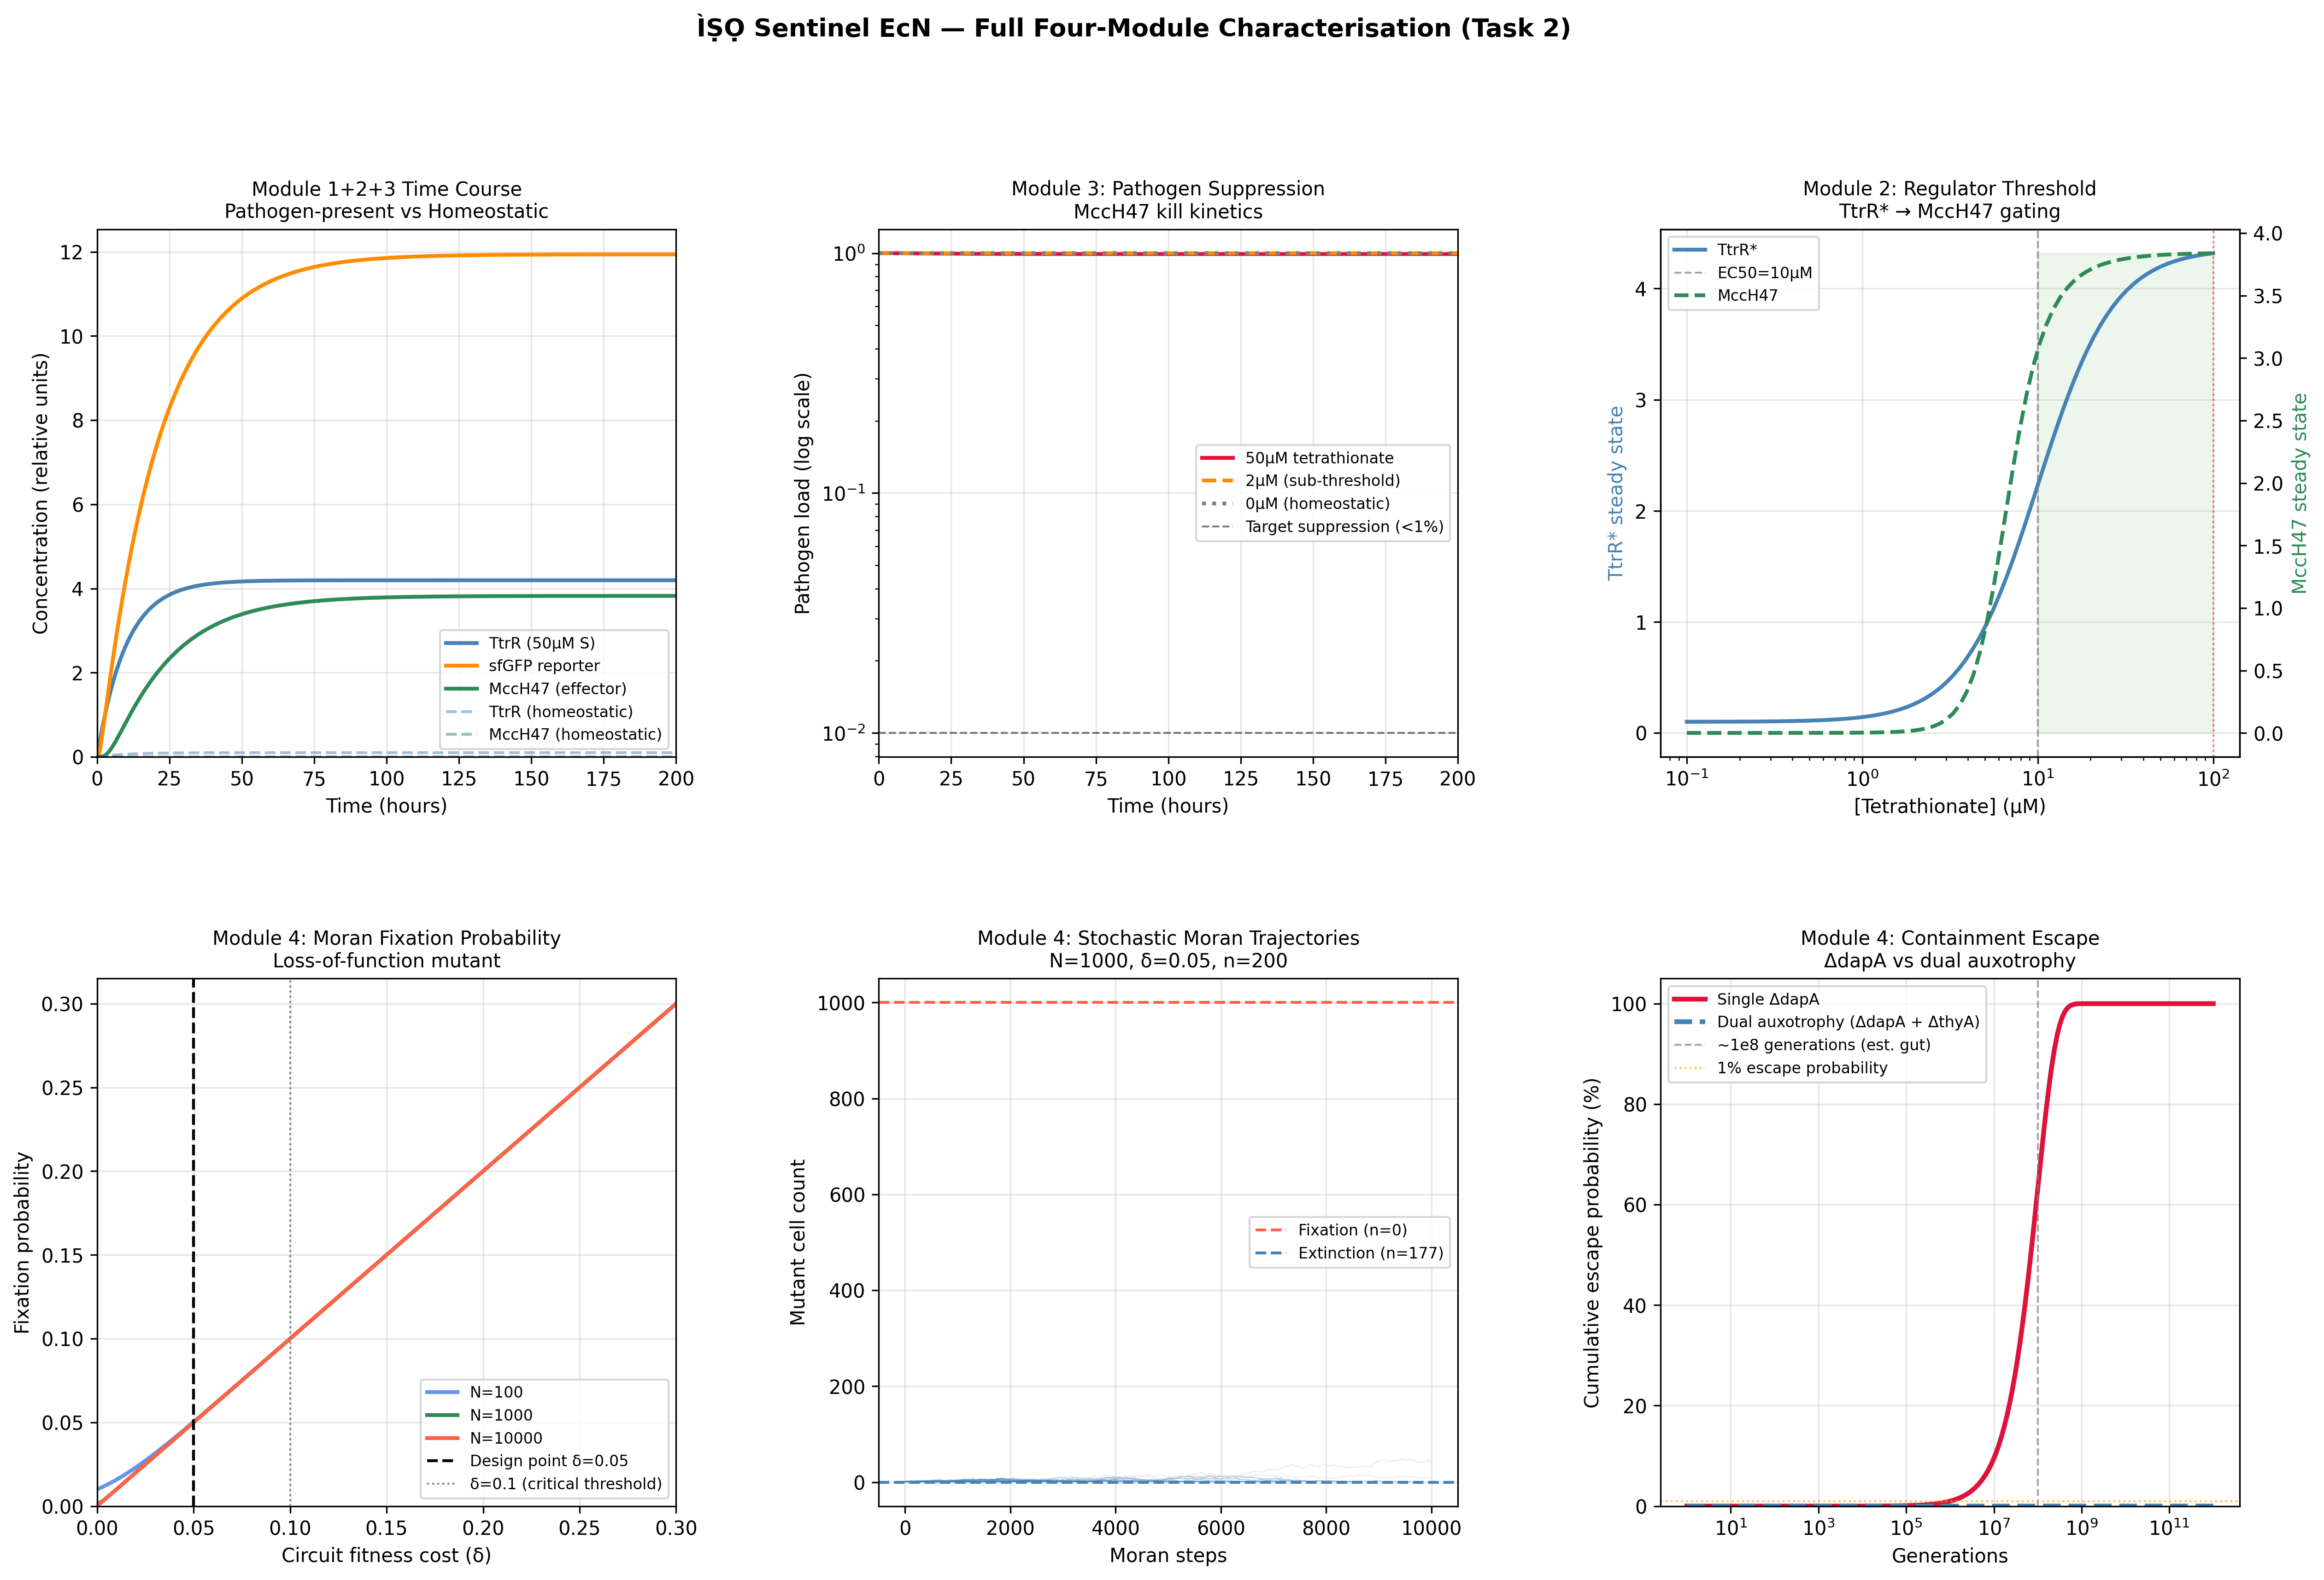
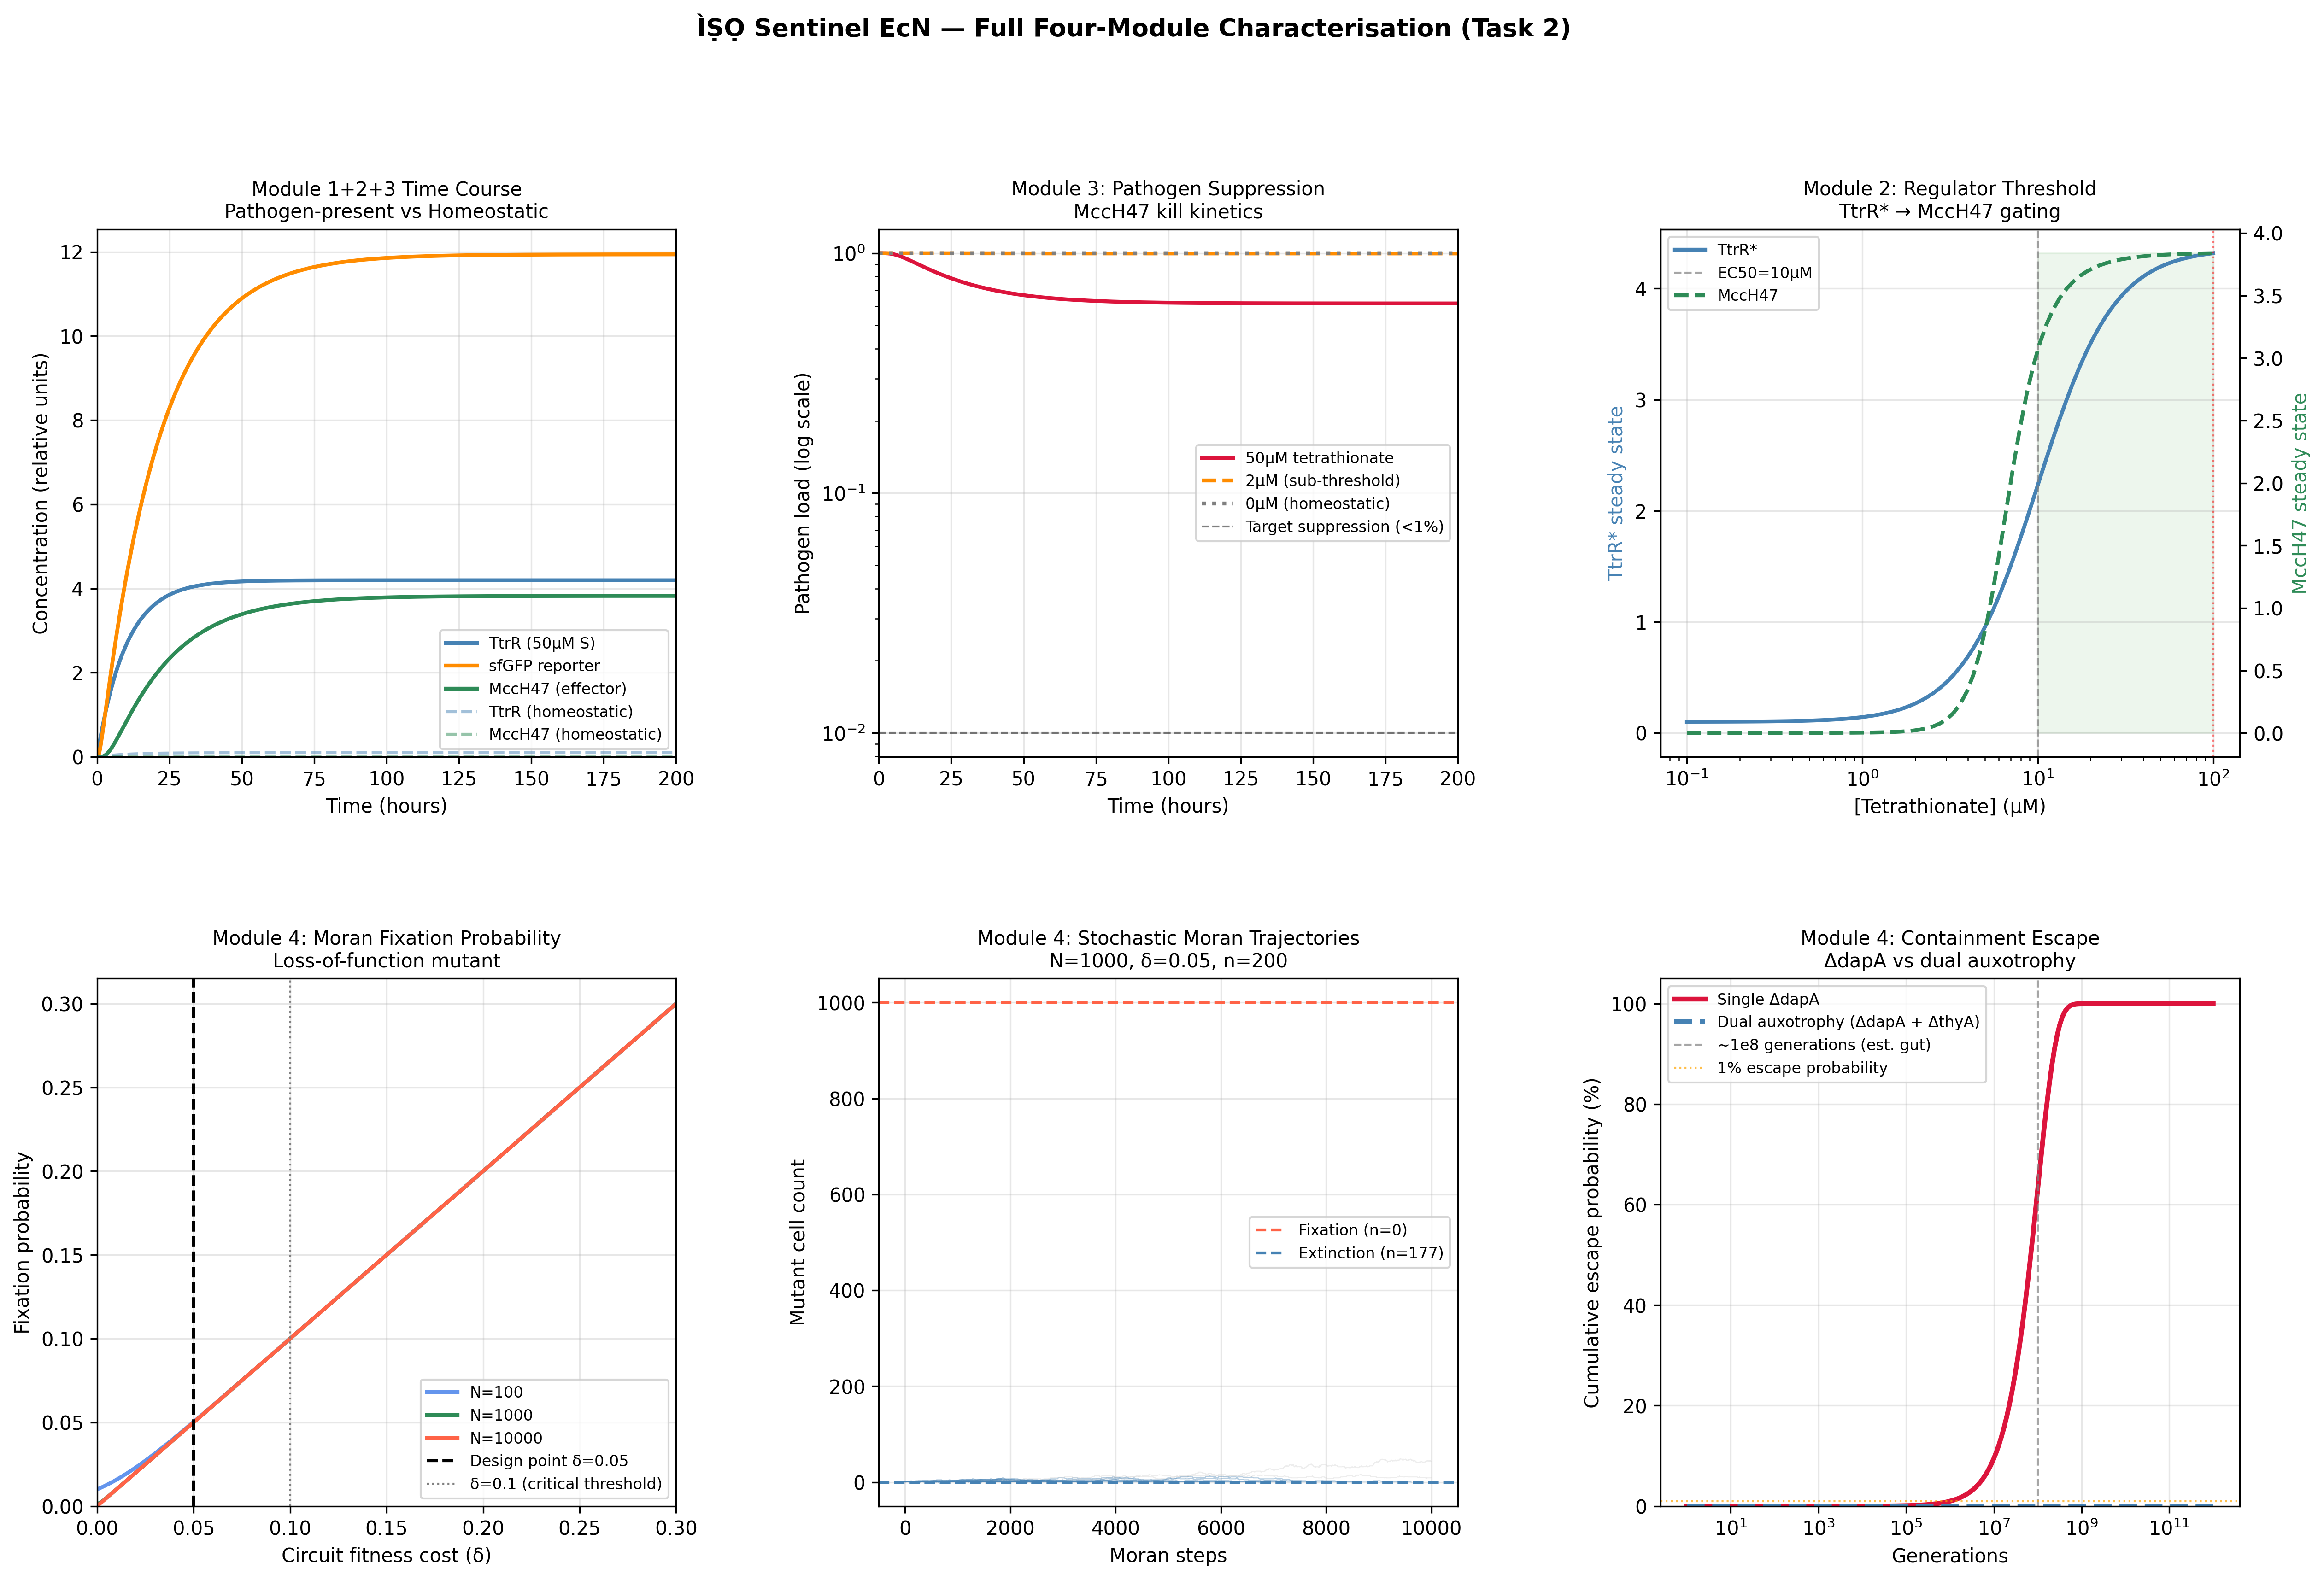
Process Reflections
The IANNs framing changed something for me that I had not expected. I have spent most of this course thinking about ÌṢỌ as a circuit engineering problem: how to gate expression, how to tune thresholds, how to reduce leakiness. The IANN framework reframed it as a computation problem: what is the function this system needs to approximate, and is the architecture I am using expressive enough to approximate it?
The honest answer is probably not. A two-state Boolean switch, tetrathionate sensed, microcin expressed, is a severe approximation of the ecological reality inside the gut. An IANN would, in principle, integrate pathogen load, competing commensal density, oxygen tension, and host inflammatory state into a graded response. But the evolutionary stability argument cuts back hard: the more weights you implement as molecular interactions, the more targets selection has to work against. The simplest architecture that is still fit for purpose is almost certainly the right answer, not the most expressive one.
The Twist order was the other major outcome of this week. Preparing a synthesis-ready construct required me to actually confront the gap between modelling a circuit and specifying one — every position, every site, every silent mutation justified. That gap is where most computational biology stays too comfortable. Writing to synthesis forced me out of it.
Works Cited
Weiss, R., & Knight, T. F. (2001). Engineered communications for microbial robotics. In Proceedings of the 6th International Meeting on DNA Based Computers, 1–16. https://doi.org/10.1007/3-540-44992-2_1
Weiss, R., & Knight, T. F. (2001). Engineered communications for microbial robotics. In A. Condon & G. Rozenberg (Eds.), DNA Computing (Lecture Notes in Computer Science, vol. 2054, pp. 1–16). Springer. https://doi.org/10.1007/3-540-44992-2_1
Palmer, J. D., Piattelli, E., McCormick, B. A., Silby, M. W., Brigham, C. J., & Bucci, V. (2017). Engineered probiotic for the inhibition of Salmonella via tetrathionate-induced production of Microcin H47. ACS Infectious Diseases, 4(1), 39–45. https://doi.org/10.1021/acsinfecdis.7b00114
Chung, M., Bruno, V. M., Rasko, D. A., Cuomo, C. A., Muñoz, J. F., Livny, J., … Fraser, C. M. (2021). Whole-genome sequencing and metagenomics reveal Escherichia coli Nissle 1917 transmission and microbial landscape in neonatal intensive care units. mSphere, 6(1). https://doi.org/10.1128/mSphere.00038-21
AI Prompts Employed (Claude AI)
- What is the evolutionary stability argument against implementing IANNs in vivo, stated precisely
- Why does a graded effector response produce a more evolutionarily stable outcome than a Boolean switch under continuous selection
- What are the synthesis constraints I need to check before submitting a construct to Twist Bioscience
- How do I remove an internal BsaI site with a silent mutation without disrupting codon usage
Week 9
Node participant note: I am a remote Genspace node listener based in Nigeria without onsite lab access. The Week 9 cell-free lab involved physical reagent preparation and fluorescence plate-reader measurements at Genspace nodes. I engaged with the full homework material remotely; the experimental design questions and project planning sections below represent my complete participation for this week.
Class Assignment — Week 9
Part A. General and Lecturer-Specific Questions
1. General homework questions
1. Advantages of Cell-Free Protein Synthesis Over In Vivo Methods
Cell-free systems decouple protein production from cell viability, giving you direct control over reaction composition, temperature, redox state, and cofactor concentrations, none of which are easily tunable in living cells.
Two cases where CFPS outperforms cell-based production:
- Viral biosensors / NTDs: Rapid, open-system format allows same-day prototyping of diagnostic reagents without biosafety constraints of live pathogen handling.
- Accessible diagnostic biomarkers (e.g., creatinine sensors for CKD): Low-cost E. coli extracts enable point-of-care biosensor manufacturing without fermentation infrastructure.
2. Main Components of a Cell-Free Expression System
| Component | Role |
|---|---|
| A. Cell Extract | Supplies ribosomes, chaperones, tRNA, and transcription/translation machinery. |
| B. DNA/mRNA Template | Carries the gene of interest; linear PCR products or circular plasmids both work. |
| C. Energy Sources (ATP/GTP) | Drive ribosome translocation, aminoacyl-tRNA charging, and mRNA capping. |
| D. Amino Acids | Provide the building blocks; must be supplied exogenously since there is no cellular biosynthesis. |
| E. Reaction Buffers | Maintain pH, ionic strength, and Mg²⁺ concentration critical for ribosome activity. |
3. Why Energy Regeneration Is Critical in Cell-Free Systems
Without regeneration, ATP is exhausted within minutes, translation stalls before any useful yield accumulates.
Method — Phosphoenolpyruvate (PEP) Regeneration:
- PEP donates a phosphate group to ADP via pyruvate kinase, regenerating ATP continuously throughout the reaction.
- It is the most widely used system in E. coli-based CFPS; simple to implement and well-characterised.
Alternatives:
- Glucose-6-phosphate / glycolysis: Cost-effective; couples to endogenous glycolytic enzymes in the extract.
- Creatine phosphate / creatine kinase: Common in eukaryotic systems; mimics the muscle energy buffering mechanism.
4. Prokaryotic vs. Eukaryotic Cell-Free Expression Systems
| Feature | Prokaryotic (E. coli) | Eukaryotic (Wheat Germ / Mammalian) |
|---|---|---|
| Yield | High (>1 mg/mL typical) | Moderate–High (system-dependent) |
| Cost | Low | High |
| Speed | 2–4 hours | Longer incubation often needed |
| PTMs (Glycosylation) | Absent natively | Endogenous microsomes enable PTMs |
| Folding | Inclusion bodies common | Excellent, specialised chaperones |
| Best Use | High-throughput, simple soluble proteins | Complex, transmembrane, or therapeutic proteins |
Protein choice — Prokaryotic: GFP
- GFP is small, soluble, and folds spontaneously without PTMs — perfect for E. coli CFPS.
- Fluorescence output doubles as a real-time yield reporter; ideal for rapid system validation.
- High-throughput expression kits for GFP are cheap, reproducible, and produce results in under 4 hours.
Protein choice — Eukaryotic (CHO/HeLa): IgG Monoclonal Antibody
- IgG requires N-glycosylation, disulfide bond formation, and ER-assisted folding for activity.
- CHO/HeLa lysates contain ER-derived microsomes with glycosylation enzymes and PDI — E. coli cannot replicate this.
- Attempting IgG expression in prokaryotic CFPS typically yields insoluble, non-functional aggregates.
5. Designing a Cell-Free Experiment for Membrane Protein Expression
Membrane proteins (MPs) are notoriously difficult — aggregation, low yield, and incorrect insertion are the default failure modes. My approach centres on a Continuous Exchange Cell-Free (CECF) setup with deliberate hydrophobic stabilisation from the moment of synthesis.
Experimental Design:
- Template: PCR-derived linear DNA with T7 promoter; codon-optimised for the chosen lysate; RBS positioned ~11 nt upstream of ATG.
- Chassis: E. coli extract for yield; insect or HeLa lysate if the MP needs native PTMs or microsomal insertion.
- Hydrophobic additives: Supplement with detergents (Brij-35, LMNG) or nanodiscs directly in the reaction to catch the MP co-translationally.
- CECF mode: Use a 10× feeding solution volume to replenish ATP, amino acids, and dilute inhibitory byproducts over 4–16 hours.
- Temperature: Start at 25–30 °C to slow translation and reduce aggregation kinetics.
Challenges and Solutions:
- Aggregation: Add nanodiscs or lipid vesicles to provide a bilayer scaffold immediately upon synthesis.
- mRNA/DNA degradation: Use GamS protein to block RecBCD exonuclease activity on linear templates.
- Incorrect folding: Introduce pre-formed inverted membrane vesicles or switch to insect lysate with native microsomes.
- Codon bias (eukaryotic MP in E. coli): Codon-optimise the sequence or switch to wheat germ / rabbit reticulocyte lysate.
- Low-throughput screening: Miniaturise to microfluidic volumes; automate condition matrices varying detergent type and temperature.
6. Troubleshooting Low Yield in a Cell-Free System
Reason 1 — Protein Aggregation / Misfolding:
- Misfolded hydrophobic stretches form inclusion bodies, reducing soluble yield.
- Fix: Drop incubation temperature to 25 °C to slow translation and buy time for folding.
- Fix: Add solubility tags (Mocr, GST) or co-express chaperones (DnaK/DnaJ/GrpE) in the reaction.
Reason 2 — Premature Energy Depletion:
- PEP or creatine phosphate runs out before the reaction plateau, stalling ribosomes mid-synthesis.
- Fix: Switch to a CECF dialysis setup to continuously feed energy substrates and remove Pi accumulation.
- Fix: Supplement with additional glucose as a secondary energy source to extend reaction lifetime.
Reason 3 — Low Transcription / Translation Efficiency:
- Weak promoter, suboptimal DNA concentration, or mRNA degradation by endogenous RNases.
- Fix: Optimise plasmid concentration (typically 5–20 nM); confirm strong T7 promoter; add RNase inhibitor (e.g., RiboLock).
- Fix: Verify T7 RNA polymerase activity separately; use circular plasmid rather than linear DNA if exonuclease degradation is suspected.
2. Homework question from Kate Adamala
Overview
The Synthetic Neuronal Mimic (SNM) is a liposome-based minimal cell designed as an interactive, safe, and visual educational tool for youth STEM leaders to understand the impact of drugs on biological systems.
1. Function Description
a. What does the SNM do? What is the input and output?
- Function: The SNM acts as a miniature “biological laboratory” encapsulating a cell-free TX/TL system that produces a fluorescent signal only when a specific drug molecule is present.
- Input: A drug molecule (e.g. nicotine analog, stimulant) in the surrounding environment, which diffuses through the synthetic membrane via a pore channel.
- Output: sfGFP fluorescence, visible under a portable fluorescence microscope. Signal intensity is a direct visual proxy for drug dose or effect magnitude.
b. Could cell-free TX/TL alone, without encapsulation, realise this function?
- No. TX/TL in a tube produces the protein but loses the educational purpose entirely.
- Encapsulation creates a compartmentalised entity that behaves like a cell, not a chemical mix.
- The drug must cross a synthetic membrane before the circuit responds, directly mirroring how neurons work.
- Without encapsulation, you have chemistry. With it, you have a cell.
c. Could a genetically modified natural cell realise this function?
- Yes, but it is the wrong tool for this context.
- Engineered E. coli or yeast would require biosafety containment, specialised culture media, and are prone to mutation.
- The SNM contains no living organism, making it safer to handle in outreach settings.
- It is more predictable, easier to explain from first principles, and requires no microbiology infrastructure.
d. Desired outcome of SNM operation
- Youth STEM leaders directly observe drug-responsive circuit logic in real time.
- Input A (nicotine analog) produces Output B (high-intensity GFP fluorescence).
- Participants leave with a concrete, visual understanding of how microscopic chemical signals produce measurable biological responses.
- The experience serves as a practical entry point into pharmacology and neuroscience.
2. Component Design
a. Membrane composition
- Phospholipid bilayer: POPC (1-palmitoyl-2-oleoyl-sn-glycero-3-phosphocholine) and cholesterol at an 80:20 molar ratio.
- Cholesterol increases membrane rigidity and reduces passive leakage of internal components.
- Alpha-hemolysin (alpha-HL, gene: hla) is embedded in the bilayer to create ~2 nm pores that admit small molecules up to ~2 kDa.
b. Internal encapsulation
- E. coli S30 or PUREsystem cell-free extract: supplies ribosomes, RNA polymerase, tRNA, and chaperones.
- Plasmid encoding sfGFP under a TetR-repressible promoter (pTet).
- ATP, GTP, and a full complement of amino acids.
- PEP-based ATP regeneration system (phosphoenolpyruvate + pyruvate kinase).
- RNase inhibitor (e.g. RiboLock) to protect mRNA from endogenous nuclease activity.
c. TX/TL system origin: bacterial or mammalian?
- Bacterial (E. coli) extract is sufficient for this design.
- TetR/pTet is fully functional in prokaryotic cell-free systems; no mammalian system is required.
- E. coli extract is low-cost, freeze-dryable for outreach kit distribution, and yields high sfGFP concentrations within 2 to 4 hours.
- A mammalian system would only be necessary if the circuit required PTMs or mammalian-specific promoter logic, which this design does not.
d. Communication with the environment
- The SNM communicates via passive diffusion through alpha-HL pores.
- The drug analog (small molecule, up to ~2 kDa) enters through the pore and de-represses the TetR-controlled sfGFP promoter.
- No active transport machinery or membrane receptors are required.
3. Experimental Details
a. Lipids and genes
| Component | Specification / Gene |
|---|---|
| Structural lipid | POPC (1-palmitoyl-2-oleoyl-sn-glycero-3-phosphocholine), 80 mol% |
| Membrane stabiliser | Cholesterol, 20 mol% |
| Pore channel gene | hla (Staphylococcus aureus alpha-hemolysin); heptameric pore, ~2 nm lumen |
| Reporter gene | sfGFP (superfolder GFP); faster folding and higher quantum yield than wild-type GFP |
| Repressor gene | tetR (TetR repressor); released by tetracycline analogs or engineered small-molecule inducers |
| Promoter | pTet (tetO2 operator); drives sfGFP expression, OFF with TetR present, ON when inducer is present |
| Energy system | PEP/pyruvate kinase for ATP regeneration; supplemented with creatine phosphate for extended reactions |
b. Measuring system function
- Primary readout: Fluorescence microscopy using a portable LED scope (470 nm excitation / 510 nm emission); visible GFP signal confirms circuit activation.
- Quantification: Plate reader measuring fluorescence intensity (Ex 485 nm / Em 510 nm) as a function of drug concentration to generate a dose-response curve.
- Negative control: SNMs incubated without drug input; no fluorescence expected, confirming the circuit is OFF at baseline.
- Positive control: SNMs with a constitutive always-on sfGFP construct; calibrates maximum signal and confirms TX/TL machinery is functional.
- Validation metric: Signal-to-noise ratio of drug-treated vs. no-drug control; a minimum 5-fold induction threshold confirms adequate circuit sensitivity.
3. Homework question from Peter Nguyen
Application Field
Architecture — wellness-focused interior design using nature-based, intelligent building materials.
One-Sentence Pitch
The Neuro-BioWall is a modular interior wall panel system embedding freeze-dried cell-free biosensors within living plant scaffolds to detect indoor air pollutants and respond with enzyme-triggered aromatherapy, bridging passive biophilic design and active biological intelligence.
How It Works
The system consists of 3D-printed cellulose/alginate panels hosting living Pothos plants, with freeze-dried cell-free reactions integrated directly into the plant’s nutrient-delivery interface. When indoor VOCs such as formaldehyde exceed healthy thresholds, a toehold switch genetic circuit embedded in the cell-free system is activated, initiating synthesis of a reporter enzyme. That enzyme acts on a co-encapsulated, latent aromatherapeutic substrate to release a localised calming scent such as lavender or hinoki. Simultaneously, a colorimetric output produces a visible colour change in the biopolymer panel, giving occupants a passive, non-electronic visual cue to ventilate or pause.
Step-by-step workflow:
- Pollutant intake: Indoor air flows through the porous biocellulose pot interface where plant roots and cell-free sensors reside.
- Sensing: The cell-free toehold switch circuit triggers when VOC concentrations exceed the design threshold.
- Wellness output: The activated circuit produces an esterase enzyme that breaks down a sealed aromatherapeutic compound, releasing scent.
- Visual signal: Colorimetric reporter causes a visible change in the biopolymer scaffold, prompting occupants to take action.
Societal Challenge and Market Need
- Sick building syndrome affects an estimated 30% of office buildings globally, linked to VOC accumulation from furniture, adhesives, and cleaning products.
- Existing solutions are either passive (plants, carbon filters) with no active feedback, or electronic (air quality monitors) with no biological or sensory integration.
- The Neuro-BioWall closes this gap: it monitors, responds, and communicates without electronics, live microbes, or occupant intervention.
- It targets the growing wellness architecture and biophilic design market, where demand for nature-integrated, low-maintenance intelligent building materials is expanding rapidly.
Addressing Cell-Free System Limitations
Activation with water
- The cell-free components are freeze-dried directly into the hydrogel of the plant nutrient scaffold.
- Activation occurs automatically during the plant’s regular watering cycle, requiring no separate triggering step or electronic control.
Long-term stability
- Components are lyophilised in a trehalose-based sugar matrix and encapsulated within a protective polymer mesh.
- This configuration maintains activity at room temperature for 3 to 6 months without refrigeration.
- The trehalose matrix is a well-established stabilisation strategy for cell-free systems in low-resource and distributed deployment contexts.
One-time use
- The sensor is packaged as a replaceable modular bio-cartridge that clips in and out of the living panel.
- Spent cartridges are fully biodegradable, consistent with the cellulose/alginate material system.
- Routine cartridge replacement is designed as a simple maintenance step, analogous to changing a water filter, rather than a structural intervention.
Integrated Material Summary
| Component | Material / Gene / System |
|---|---|
| Panel scaffold | 3D-printed cellulose / sodium alginate composite |
| Living element | Pothos (Epipremnum aureum) — known VOC-absorbing houseplant |
| Stabilisation matrix | Trehalose-based lyophilisation matrix |
| Sensing circuit | Toehold switch genetic circuit, VOC-responsive |
| Reporter enzyme | Esterase (e.g. estA from Pseudomonas fluorescens) |
| Aromatic substrate | Latent linalyl acetate ester (releases lavender/hinoki scent upon cleavage) |
| Colorimetric reporter | Catechol-responsive chromogenic substrate for visual panel signal |
| TX/TL chassis | E. coli S30 cell-free extract, freeze-dried |
Why This Works as a Platform
- No living microbes means no biosafety concerns in occupied buildings.
- No electronics means no power dependency, no failure modes from software or connectivity.
- The plant’s natural water cycle doubles as the activation mechanism, making the system self-sustaining within normal building maintenance routines.
- Modular cartridge design allows iterative sensor upgrades without replacing the structural panel, extending product lifetime and reducing material waste.
4. Homework question from Ally Huang
Overview
MycoLab-1 proposes a minimally functional, university-grade biological sciences laboratory for deep-space environments, built from mycelium-based composite (MBC) infrastructure and powered by freeze-dried cell-free (CFPS) molecular biology systems. The laboratory requires no refrigeration chain, no live microbial culture infrastructure, and no heavy equipment payload — making advanced biological experimentation feasible aboard lunar outposts, Mars transit vehicles, or orbital stations where mass and power budgets are severe constraints.
1. Background: The Space Biology Challenge
Long-duration spaceflight exposes crew to ionising radiation, microgravity-induced immune dysregulation, and chronic oxidative stress — all of which accelerate cellular ageing, impair DNA repair fidelity, and compromise host-pathogen defence. These stressors converge on gene expression and protein homeostasis in ways that are still poorly characterised in real microgravity. Conducting molecular biology experiments in space currently demands cold-chain infrastructure and complex equipment incompatible with deep-space payload constraints. A lightweight, room-temperature-stable biological laboratory would transform our ability to study and respond to these challenges in real time, on-orbit.
2. Molecular and Genetic Targets
Primary targets:
- RAD51 and BRCA2 — homologous recombination DNA repair genes; expression altered under ionising radiation and microgravity.
- NRF2 (NFE2L2) pathway transcripts — master regulator of oxidative stress response.
- Broad transcriptomic profiling via cell-free ribosome display and lateral flow readout as a low-mass omics proxy.
3. Target Relevance to the Space Biology Challenge
Radiation-induced double-strand breaks require RAD51-mediated homologous recombination for faithful repair; suppression of this pathway under microgravity increases mutation accumulation rates. NRF2 governs the antioxidant response to reactive oxygen species generated by cosmic radiation. Both pathways are dynamically regulated at the transcript and protein level, making them ideal targets for a cell-free expression-based sensing platform. Monitoring their activity in real time, using on-orbit synthesised reporters, would provide actionable data on crew molecular health without requiring live-cell culture or centrifuge-dependent assays.
4. Hypothesis and Research Goal
Hypothesis: A freeze-dried cell-free biosensor system, stabilised in trehalose matrix and embedded in mycelium-derived structural panels, can perform on-orbit transcriptomic monitoring of radiation-responsive and oxidative stress pathways (RAD51, NRF2) with sensitivity equivalent to bench-grade RT-qPCR, at a fraction of the mass and power budget.
Reasoning: CFPS reactions have been lyophilised and reactivated months later with retained fidelity. Mycelium composites provide structural, thermal, and radioprotective properties that passive aluminium panels cannot. Combining both technologies creates a laboratory architecture where the walls, benchtops, and insulation panels are themselves functional biological substrates, not passive enclosures. If validated, this platform collapses the payload mass requirement for a functional molecular biology laboratory by an order of magnitude.
5. Experimental Plan
Samples and model organisms
- Primary sample: Human saliva or fingerprick blood from crew members as minimally invasive nucleic acid sources.
- Biological model: Arabidopsis thaliana seedlings grown in mycelium substrate panels as a parallel plant stress model.
- Radioprotection model: Cladosporium sphaerospermum melanised fungal cultures integrated into habitat wall panels as living radioprotective layer.
Core experimental modules
| Module | Function | Cell-Free Component |
|---|---|---|
| RAD51/NRF2 transcript sensor | Toehold switch circuits triggered by target mRNA from crew blood/saliva | E. coli S30 CFPS, lyophilised in trehalose |
| sfGFP / colorimetric reporter | Fluorescence or colour readout of circuit activation | sfGFP (sfgfp) or catechol oxidase reporter |
| Ribosome display panel | Low-mass omics: cell-free translation of stress-responsive transcripts | PUREsystem, freeze-dried |
| Lateral flow readout | Equipment-free protein detection strip for crew-facing results | Anti-GFP or anti-His-tag lateral flow strips |
| Mycelium panel biosensor integration | Structural panels double as stable housing for CFPS cartridges | CFPS cartridge embedded in Ganoderma MBC panel |
Mycelium laboratory infrastructure
- Structural panels: Ganoderma lucidum mycelium grown on processed regolith simulant or cellulose waste; compression-moulded into benchtop, wall, and insulation panels.
- Radioprotective skin layer: Melanised Cladosporium sphaerospermum integrated into outer wall MBC composite; demonstrated on-orbit aboard the ISS to attenuate ionising radiation by up to 2.42-fold.
- Self-repair capacity: Living mycelium panels can re-colonise micro-fractures when rehydrated, reducing structural maintenance payload.
- Thermal insulation: MBC panels provide thermal insulation comparable to expanded polystyrene at one-third the density, critical for temperature-sensitive CFPS cartridge stability.
CFPS cartridge design
- Each cartridge is a replaceable unit containing lyophilised E. coli S30 extract, toehold switch plasmid, energy regeneration mix (PEP/pyruvate kinase), and amino acids.
- Activation: crew adds 15 to 30 microlitres of rehydration buffer (sterile water or saliva directly).
- Readout: fluorescence measured with a handheld LED torch and smartphone camera, or colorimetric readout read visually.
- Cartridge stability: 12 months at room temperature in sealed foil pouch; trehalose matrix validated for long-duration storage.
- Each cartridge is single-use, biodegradable, and compatible with mycelium composting for waste processing closure.
6. Addressing Space-Environment Constraints
| Constraint | Challenge | Solution |
|---|---|---|
| Mass budget | Traditional lab equipment is prohibitively heavy | CFPS replaces PCR machines, gel rigs, centrifuges; mycelium grown in situ from waste feedstock |
| Cold chain | Enzymes, reagents degrade without refrigeration | Lyophilisation in trehalose; stable at room temperature for 6 to 12 months |
| Power budget | Fluorescence readers and thermocyclers draw significant power | Lateral flow strips and colorimetric readouts require zero power; LED torch for fluorescence |
| Radiation | Ionising radiation degrades DNA reagents and structural materials | Lyophilised DNA in trehalose is radiation-hardened; C. sphaerospermum wall layer attenuates dose |
| Waste processing | Chemical and biological waste accumulates | Biodegradable cartridges fed back into mycelium substrate as nutrient source |
| Crew skill ceiling | Not all crew are trained molecular biologists | Toehold switch cartridges operate as simple add-water diagnostics; results are visual and immediate |
7. Significance
MycoLab-1 addresses three converging needs in space exploration. First, it provides a credible molecular health monitoring platform for crew on multi-year missions beyond low Earth orbit where medical evacuation is not an option. Second, it demonstrates in-situ resource utilisation for laboratory infrastructure, growing structural and functional lab components from waste streams rather than Earth-launched payloads. Third, it creates a proof-of-concept for distributed biological laboratories in resource-constrained environments on Earth, including field hospitals, remote clinics, and low-income research institutions. The same system that monitors astronaut DNA repair fidelity on a Mars transit vehicle could monitor antibiotic resistance gene expression in a rural West African clinic.
Key Genes and Components Reference
| Gene / Component | Source Organism | Function in MycoLab-1 |
|---|---|---|
| RAD51 | Homo sapiens | DNA repair; target transcript for radiation damage sensor |
| NFE2L2 (NRF2) | Homo sapiens | Oxidative stress master regulator; target for ROS sensor circuit |
| sfgfp | Engineered (jellyfish origin) | Fluorescent reporter for toehold switch activation |
| Toehold switch RNA | Synthetic | Riboswitch that translates only in presence of target mRNA |
| dhN-melanin biosynthetic cluster | Cladosporium sphaerospermum | Melanin synthesis; radioprotective wall layer |
| hla (alpha-hemolysin) | Staphylococcus aureus | Optional pore channel for diffusion-based sample input into CFPS cartridge |
| Mycelium scaffold | Ganoderma lucidum | Structural panels, benchtops, insulation, and waste-derived growth substrate |
Part B. Individual Final Project
The cell-free week connects to ÌṢỌ along two lines that are worth making explicit here.
Cell-free as a validation platform for MccH47: Before committing resources to in vivo EcN transformation (at Gensapce node), a cell-free expression system is a viable first-pass validation tool for the MccH47 construct. A PUREsystem or E. coli S30 extract reaction can confirm that the designed RBS and promoter combination produces protein at detectable levels without requiring any live organism infrastructure. Given my remote location in Nigeria, cell-free validation is also practically more accessible than a full transformation pipeline, preferably for local health demonstration and public enlightement in line with aim 3 implementation.
MycoLab-1 relevance to ÌṢỌ: The MycoLab-1 proposal I developed for Ally Huang’s question is not incidental to ÌṢỌ. It models a distributed diagnostic scenario that is structurally similar to what ÌṢỌ is designed for: a biological sensor that operates reliably in low-resource environments without specialised equipment. The convergence is useful to name explicitly. Both systems are making the same wager: that freeze-dried cell-free components stabilised in trehalose, combined with simple visual readouts, can close the gap between high-complexity synthetic biology and real-world deployment in settings without laboratory infrastructure. ÌṢỌ targets the gut. MycoLab-1 targets the lab environment. The underlying design philosophy is the same.
Best steps for cell-free validation of ÌṢỌ constructs (remotely for Aim 3):
- Design a linear PCR template encoding T7-RBS-MccH47-His6 for direct cell-free expression testing
- Run a PUREsystem reaction with the linear template and confirm protein production by anti-His western or simple SYPRO Orange PAGE
- Titrate tetrathionate into the reaction to test TtrR-mediated induction if the sensor cassette is co-expressed
- Use a 96-well format plate reader readout (where available via collaborator) or a lateral flow anti-His strip as the detection method
Works Cited
Adamala, K. P., Martin-Alarcon, D. A., Guthrie-Honea, K. R., & Boyden, E. S. (2017). Engineering genetic circuit interactions within and between synthetic minimal cells. Nature Chemistry, 9(5), 431–439. https://doi.org/10.1038/nchem.2644
Jewett, M. C., & Swartz, J. R. (2004). Mimicking the Escherichia coli cytoplasmic environment activates long-lived and efficient cell-free protein synthesis. Biotechnology and Bioengineering, 86(1), 19–26. https://doi.org/10.1002/bit.20026
Pardee, K., Green, A. A., Ferrante, T., Cameron, D. E., DaleyKeyser, A., Yin, P., & Collins, J. J. (2014). Paper-based synthetic gene networks. Cell, 159(4), 940–954. https://doi.org/10.1016/j.cell.2014.10.004
Caschera, F., & Noireaux, V. (2014). Synthesis of 2.3 mg/mL of protein with an all Escherichia coli cell-free transcription-translation system. Biochimie, 99, 162–168. https://doi.org/10.1016/j.biochi.2013.11.025
Sun, Z. Z., Hayes, C. A., Shin, J., Caschera, F., Murray, R. M., & Noireaux, V. (2013). Protocols for implementing an Escherichia coli based TX-TL cell-free expression system for synthetic biology. Journal of Visualized Experiments, 79, e50762. https://doi.org/10.3791/50762
AI Prompts Employed (Claude AI)
- Design a minimal cell biosensor that uses a TetR-pTet circuit to detect a small molecule drug analog
- What lipid composition gives a stable liposome bilayer with good alpha-hemolysin pore incorporation
- Explain why encapsulation is necessary for the SNM to work educationally, not just biochemically
- How would a mycelium-composite laboratory address the mass and cold-chain constraints of deep-space biology
- What makes freeze-dried cell-free systems stable at room temperature for months
Week 10
Node participant note: I am a remote Genspace node listener based in Nigeria without onsite lab access. The Week 10 mass spectrometry lab at Genspace was equipment-dependent and not replicable remotely. The Waters dataset (intact mass, native/denatured ESI, peptide mapping, oligomers, GFP confirmation) was shared with all HTGAA participants including CLs, and my analysis was completed below.
Class Assignment — Week 10
Homework: Final Project
ÌṢỌ is currently computational, so the “measurements” in scope are model outputs rather than physical assays. The key quantities I track are: steady-state pathogen kill rate as a function of MccH47 production, growth rate as a function of expression burden δ, biosensor activation ratio across tetrathionate concentrations, and containment escape probability over generational time. These are computed from ODE integration and Moran process simulation rather than physical instruments, but they map directly onto measurable biological quantities that would need experimental validation in a future phase of the project.
Priority measurements in the wet-lqb phase would be:
Circuit output and reporter quantification Fluorescence intensity of the sfGFP reporter (co-expressed with MccH47 under TtrR-activated promoter) measured by plate-reader fluorimetry across a tetrathionate concentration gradient. This gives the dose-response curve the biosensor model predicts and directly benchmarks the Hill coefficient and activation threshold used in the ODE.
MccH47 production and secretion Liquid chromatography coupled to mass spectrometry (LC-MS) would confirm MccH47 identity and quantify extracellular concentration. Given the focus on intact protein mass measurement, a Waters-type Xevo QTof system running native LC-MS would resolve the microcin’s intact mass (~4.9 kDa) and confirm post-translational processing of the precursor peptide, which is biologically relevant since MccH47 requires leader peptide cleavage for activity.
Pathogen kill kinetics Colony-forming unit counts on selective media over time, co-incubating engineered EcN with Salmonella Typhimurium at defined tetrathionate concentrations. This parameterizes k_kill directly.
Auxotrophy confirmation and escape frequency Growth curves in DAP-depleted media confirm the ΔdapA deletion is clean. Fluctuation assay (Luria-Delbrück) on large populations estimates reversion frequency, which feeds directly into the containment escape model.
Growth burden OD600 time-course comparing wild-type EcN, circuit-off EcN, and circuit-induced EcN. The growth rate differential quantifies δ experimentally.
The computational figures being produced now are designed to be directly comparable to these future measurements, every parameter in the model has a specific assay that would validate or revise it.
Part A. Waters Part I — Molecular Weight
The Waters mass spectrometry exercises this week are not purely theoretical for ÌṢỌ. MccH47 is a post-translationally processed antimicrobial peptide: the ribosome produces a 59-residue precursor (mcmA leader + structural peptide), and the leader sequence must be cleaved by the dedicated ABC transporter MchF before the active form is secreted. Confirming intact mass of the processed peptide (~4.9 kDa for the mature MccH47) and verifying complete leader peptide removal are exactly the measurements a Waters Xevo QTof running native LC-MS would provide in a future validation phase of this project. The GFP analysis I worked through here is the same analytical workflow, applied to a protein I will actually need to verify.
1. Theoretical pI/Mw: 5.90 / 28006.60
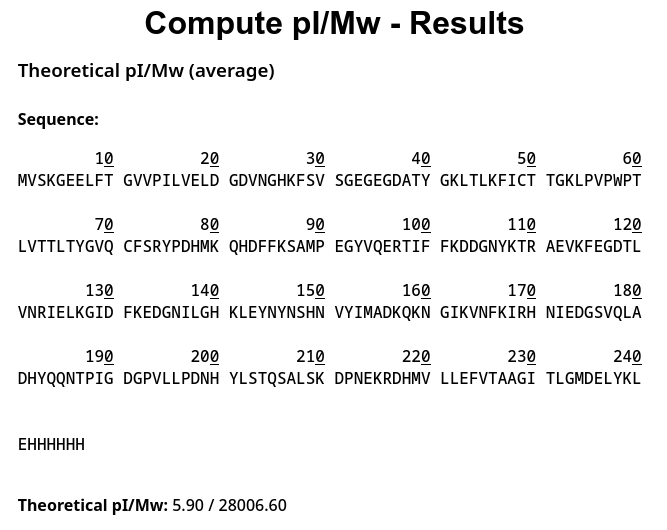
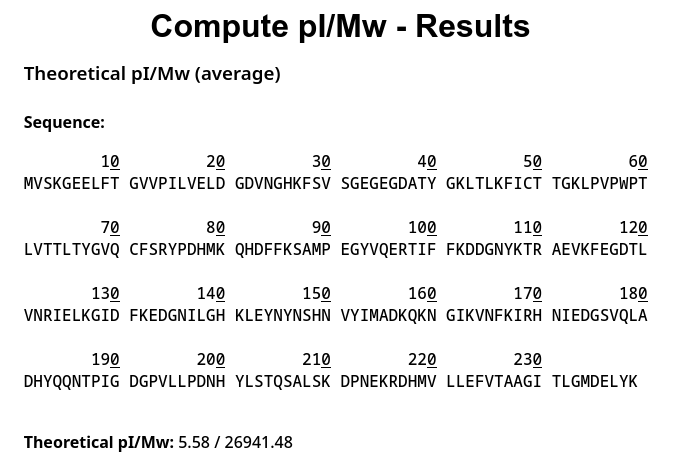
2.1 Determination of z for adjacent pair of peaks using the given formula
From the spectrum, a good clean pair is: • m/zn≈933 • m/zn+1≈903
These are part of the same envelope (but essentially different charge states), and the spacing is realistic.
2.2 MW of the protein using the scientific relationship
2.3 Accuracy of the measurement between both methods
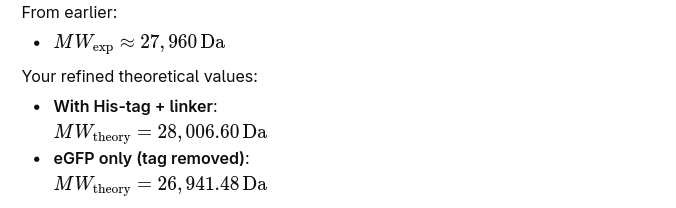
Compared with theoretical MW Typical values: • eGFP alone ≈ 26.9–27.0 kDa • With Histidine tag + linker → ≈ 27.5–28.5 kDa
So the result is reasonably correct

Absolute error ≈ 46.6 Da Relative error ≈ 0.00166 Percent error ≈ 0.166% Accuracy ≈ 99.83%
2.4 Charged state for the zoomed-in peak in the mass spectrum picture
No, the charge state cannot be determined from the zoomed-in peak. This is because there are no clearly resolved adjacent charge-state peaks in that region of the spectrum. The signal appears as a single broadened peak without the necessary spacing pattern required to apply the adjacent charge-state method.
Part B. Waters Part II — Secondary/Tertiary structure
1. Native vs Denatured Protein conformations
When a protein is in its native, folded state, the tertiary structure buries most basic residues (lysine, arginine, histidine) inside the hydrophobic core or locks them into salt bridges and hydrogen bonds. In native electrospray ionisation (ESI), these residues are inaccessible to protonation, so the protein acquires relatively few charges, producing ions at high m/z values. This is exactly what the red spectrum shows, with the dominant ion envelope centred around m/z 2545.
When a protein unfolds, the polypeptide chain opens up and all basic residues become solvent-exposed and available for protonation. The same protein now picks up far more protons, producing many charge states compressed into the low m/z region. The green (denatured) spectrum shows this clearly, the charge state envelope spans roughly m/z 600 to 1300, with peaks spaced closely together because many adjacent charge states (z ≈ 20 through z ≈ 40+) are simultaneously represented.
The mass spectrometer determines fold state indirectly: it measures the m/z ratio of each ion. Since molecular weight is unchanged by denaturation, the shift in the m/z envelope directly reflects a change in charge state z. Higher charge means lower m/z for the same mass. The instrument does not detect conformation directly, it detects the charge acquired during ESI, which is a proxy for solvent-accessible surface area and protonatable site exposure, both of which are determined by the protein’s fold state.
The zoomed inset in the native (red) spectrum supports this interpretation. The isotope spacing at m/z ~2545 is approximately 0.18 Da, corresponding to a charge state of z = 1/0.18 ≈ 11. A native folded protein the size of eGFP (~27 kDa) carrying only 11 charges is consistent with a compact structure where most basic residues are sequestered. The denatured form distributes that same mass across charge states of z = 20 or higher, shifting the entire envelope into the low m/z window seen in the green spectrum.
2. Charge state of the peak findings
Identifying the charge state from isotope spacing
Looking at the native mass spectrum (Figure 3), the peak cluster around m/z 2799–2800 shows two resolved isotope peaks labeled 2799.4199 and 2799.6365.
The isotope spacing is 2799.6365 − 2799.4199 = 0.2166 Da
Since adjacent isotope peaks within a charge state envelope are separated by 1 Da / z, the charge state is z = 1 / 0.2166 ≈ 4.6, which rounds to +5
The charge state of the peak at ~2800 is +5.
How you can tell?
In ESI-MS, each isotope peak differs from the next by exactly 1 neutron (1 Da). Distributed across z charges, that 1 Da difference appears as a spacing of 1/z in the m/z spectrum. The ~0.2 Da spacing observed here gives 1/0.2 = 5, confirming a 5+ ion. As a rule of thumb, a singly charged ion shows isotope spacing of 1.0 Da; a doubly charged ion shows 0.5 Da; a 5+ ion shows ~0.2 Da.
What this ion likely represents?
A z = +5 ion at m/z ~2800 corresponds to a neutral mass of approximately (2800 × 5) − 5 = ~13,995 Da
This is close to half the molecular weight of intact eGFP (~27 kDa), suggesting this peak may represent a doubly charged dimer or a fragment species rather than the intact monomer. In a native direct-infusion experiment, low-abundance species like non-covalent dimers or partial assemblies can appear at unexpected m/z values. This peak is worth noting as a minor species distinct from the main z = 11 native monomer envelope centred at m/z ~2545.
Part C. Waters Part III — Peptide Mapping - primary structure
1. Lysines (K) and Arginines (R) in eGFP from Benchling
Arginines: 6 Lysines: 20
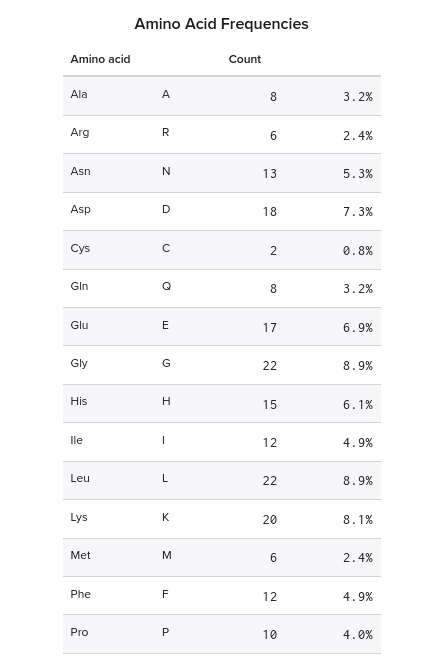
2. Peptide mapping for tryptic digestion of eGFP using PeptideMass
Trypsin cleaves after lysine (K) and arginine (R) residues. Running the eGFP sequence through ExPASy PeptideMass with trypsin, 0 missed cleavages, reduced cysteines, and a 500 Da mass cutoff returns 19 peptides, covering 90.7% of the sequence.
| Mass [M+H]⁺ | Position | Peptide sequence |
|---|---|---|
| 4472.1752 | 170–210 | HNIEDGSVQLADHYQQNTPIGDGPVLLPDNHYLSTQSALSK |
| 2566.2931 | 217–239 | DHMVLLEFVTAAGITLGMDELYK |
| 2437.2608 | 5–27 | GEELFTGVVPILVELDGDVNGHK |
| 2378.2577 | 54–74 | LPVPWPTLVTTLTYGVQCFSR |
| 1973.9062 | 142–157 | LEYNYNSHNVYIMADK |
| 1503.6597 | 28–42 | FSVSGEGEGDATYGK |
| 1266.5783 | 87–97 | SAMPEGYVQER |
| 1083.4979 | 240–247 | LEHHHHHH |
| 1050.5214 | 115–123 | FEGDTLVNR |
| 982.4952 | 133–141 | EDGNILGHK |
| 821.3940 | 81–86 | QHDFFK |
| 790.3552 | 75–80 | YPDHMK |
| 769.3913 | 47–53 | FICTTGK |
| 711.2944 | 103–108 | DDGNYK |
| 655.3813 | 98–102 | TIFFK |
| 602.2780 | 211–215 | DPNEK |
| 579.3137 | 128–132 | GIDFK |
| 507.2925 | 164–167 | VNFK |
| 502.3235 | 124–127 | IELK |
Parameters: trypsin, 0 missed cleavages, cysteines reduced, methionines unoxidised, masses > 500 Da, monoisotopic [M+H]⁺. Theoretical pI: 5.90, average MW: 28,006.60 Da, monoisotopic MW: 27,988.96 Da.
Chromatographic peaks in the TIC (0.5 to 6 min)
Counting all peaks above 10% relative abundance in Figure 5a between 0.5 and 6 minutes, there are approximately 19 chromatographic peaks visible.
Does the peak count match the predicted peptide count?
The PeptideMass prediction returned 19 peptides above 500 Da. The chromatogram shows a comparable number of peaks, though there appear to be more peaks than predicted peptides. This is expected: a single peptide can produce multiple chromatographic peaks if it elutes as co-eluting charge states, if there are oxidised or modified variants, or if missed cleavage products are present at low levels. Additionally, some peaks may represent non-peptide matrix components or buffer adducts.
Identifying the charge state and mass of the peptide at 2.78 min (Figure 5b)
The most abundant ion in Figure 5b appears at m/z = 525.76712, with a second charge state visible at m/z = 1050.52438.
Using the isotope spacing in the inset zoom of the 525.76 peak:
The two isotope peaks are at 525.76712 and 526.25918, giving a spacing of:
526.25918 - 525.76712 = 0.4921 Da
Since isotope spacing = 1/z:
z = 1 / 0.4921 = ~2, confirming the most abundant charge state is z = +2.
The singly charged mass [M+H]⁺ is calculated as:
[M+H]⁺ = (m/z × z) - (z - 1) = (525.76712 × 2) - 1 = 1050.53424 Da
This is consistent with the observed singly charged ion at m/z 1050.52438.
Peptide identification and mass accuracy
From the PeptideMass results, the peptide with theoretical [M+H]⁺ = 1050.5214 Da at position 115-123 is FEGDTLVNR.
Mass accuracy in ppm:
ppm error = ((observed - theoretical) / theoretical) × 10⁶
ppm error = ((1050.52438 - 1050.5214) / 1050.5214) × 10⁶ = +2.84 ppm
This is well within the typical <5 ppm accuracy expected from a Waters Xevo G3 QTof instrument.
Sequence coverage confirmed by peptide mapping
As shown in Figure 6, the BioAccord LC-MS peptide identification data confirms 88% sequence coverage of eGFP, with the unconfirmed regions corresponding primarily to small peptides below the 500 Da detection threshold and the short peptides at the N-terminus (MVS) that fall outside the tryptic detection window.
Bonus Peptide Map Questions
Peptide identification from Figure 5c
The peptide eluting at 2.78 min with [M+H]⁺ = 1050.52438 Da matches FEGDTLVNR (positions 115–123, predicted [M+H]⁺ = 1050.5214 Da, 2.84 ppm error).
The predicted fragment ion series confirms the match:
| Position | Residue | B ion (m/z) | Y ion (m/z) |
|---|---|---|---|
| 1 | F | 148.07574 | 1050.52149 |
| 2 | E | 277.11833 | 903.45308 |
| 3 | G | 334.13979 | 774.41049 |
| 4 | D | 449.16673 | 717.38902 |
| 5 | T | 550.21441 | 602.36208 |
| 6 | L | 663.29848 | 501.31440 |
| 7 | V | 762.36689 | 388.23034 |
| 8 | N | 876.40982 | 289.16192 |
| 9 | R | 1032.51093 | 175.11900 |
The observed ions in Figure 5c at m/z 774.41334, 903.44365, and 602.34777 correspond directly to Y7 (774.41049), Y8 (903.45308), and Y5 (602.36208) ions respectively, confirming the sequence read-out from the C-terminus. The B/Y ion ladder is internally consistent and the fragmentation pattern is unambiguous.
Does the peptide map confirm eGFP identity?
Yes. The data are consistent with the eGFP standard for several converging reasons. The identified peptide FEGDTLVNR is unique to eGFP and is not a common contaminant sequence. The measured mass matches the theoretical monoisotopic mass within 2.84 ppm, well within the instrument’s expected accuracy. The fragmentation spectrum produces a coherent B and Y ion series with no unexplained major peaks. Figure 6 shows 88% sequence coverage across the full eGFP chain, with the identified peptides distributed across nearly the entire length of the protein rather than clustering in one region, which would be expected if the signal were from a contaminant or partial degradation product. The small uncovered regions (approximately 12% of sequence) correspond to short peptides below the 500 Da detection threshold and the N-terminal MVS tripeptide, both of which are expected gaps given the experimental parameters rather than evidence against eGFP identity.
Part D. Waters Part IV — Oligomers
Using the subunit masses from Table 1 (7FU = 340 kDa, 8FU = 400 kDa), the observed CDMS peaks map to the following oligomeric species:
| Peak (MDa) | Calculated mass | Assignment |
|---|---|---|
| 3.4 | 340 kDa × 10 = 3.40 MDa | 7FU Decamer |
| 8.33 | 400 kDa × 20 = 8.00 MDa | 8FU Didecamer |
| 12.67 | 400 kDa × 30 = 12.00 MDa | 8FU 3-Decamer |
| ~16–17 (low, broad) | 400 kDa × 40 = 16.00 MDa | 8FU 4-Decamer |
The dominant species in solution is the 8FU didecamer at ~8.33 MDa, which is the canonical functional assembly of KLH. The 7FU decamer at ~3.4 MDa appears as a lower-abundance species representing the half-molecule form. The 3-decamer at ~12.67 MDa is present at reduced intensity, and the 4-decamer is visible only as a broad low-intensity feature near 16 MDa, consistent with published observations of KLH assembly heterogeneity in solution.
The small offsets between calculated and observed masses (e.g. 8.00 MDa calculated vs. 8.33 MDa observed for the didecamer) reflect glycosylation and other post-translational modifications on KLH subunits, which are not accounted for in the bare polypeptide masses in Table 1.
Part E. Waters Part V — Did I make GFP?
| Theoretical | Observed (Intact LC-MS) | PPM Mass Error | |
|---|---|---|---|
| Molecular weight (kDa) | 27.9890 | 27.9896 | +2.14 ppm |
Works Cited
Campuzano, I. D. G., & Loo, J. A. (2025). Evolution of mass spectrometers for high m/z biological ion formation, transmission, analysis and detection: A personal perspective. Journal of the American Society for Mass Spectrometry, 36(4), 632–652. https://doi.org/10.1021/jasms.4c00348
Kalli, A., & Hess, S. (2012). Effect of mass spectrometric parameters on peptide and protein identification rates for shotgun proteomic experiments on an LTQ-Orbitrap mass analyzer. Proteomics, 12(1), 21–31. https://doi.org/10.1002/pmic.201100464
Protein Data Bank. (2024). eGFP sequence and structure. https://www.rcsb.org
ExPASy Bioinformatics Resource Portal. (2024). PeptideMass tool. https://web.expasy.org/peptide_mass/
Waters Corporation. (2024). Xevo G3 QTof mass spectrometer: Technical specifications. https://www.waters.com
AI Prompts Employed (Claude AI)
- Explain how ESI charge state envelopes shift between native and denatured protein conformations
- How do I determine charge state from isotope spacing in a native mass spectrum
- Calculate molecular weight from adjacent charge state peaks using the standard formula
- What does 88% sequence coverage mean in a peptide mapping experiment and what causes the remaining 12% to go undetected
- How do the oligomeric assignments of KLH map onto CDMS peaks when subunit masses are known
Week 11
Class Assignment — Week 11
Part A. Community Bioart Reflections | The 1,536 Pixel Artwork Canvas

I contributed to the “Love” apple-shaped yellow sign at the mid-bottom of the artwork, working on the DNA assembly for that section of the plate.
What I liked most is the premise itself: that biology can be a medium for public communication, not just a laboratory tool. There is something genuinely powerful about a piece of art that is also a functional scientific artefact — 1,536 colonies, four colours, four quadrants, one coherent image, built by 154 people across 7,946 individual contributions. Projects like this do more for science outreach than most formal presentations ever will, because they meet people where curiosity lives. The collaborative structure reinforced that too. No single person could have produced this at scale. Every contribution, however small, was load-bearing. That is a lesson worth carrying into research.
For next year, a few things could sharpen the experience. The process deserves better documentation — annotated diagrams of who contributed what quadrant and colour, and a short write-up of the biological design logic mapping colony colour to fluorescent protein or pigment pathway. That record becomes an outreach asset in its own right, and for participants from under-resourced contexts it also serves as tangible evidence of having done real science. I would also push for a clearer throughline between the artistic concept and the biology: why this sequence, why this organism, why this visual. That conceptual anchoring is what separates bioart that educates from bioart that merely looks interesting from a distance.
Part B. Cell-Free Protein Synthesis | Cell-Free Reagents
Cell-Free Reaction Components (20-Hour NMP-Ribose Master Mix)
E. coli Lysate
BL21 (DE3) Star Lysate (includes T7 RNA Polymerase): The lysate is the reaction engine. It supplies the ribosomes, translation factors, chaperones, and metabolic enzymes needed to carry out transcription and protein synthesis. The DE3 strain harbours a chromosomal T7 RNA Polymerase gene, so the lysate comes pre-loaded with the polymerase needed to drive T7 promoter-based expression.
Salts/Buffer
Potassium Glutamate: The primary monovalent salt. It maintains ionic strength and stabilises ribosome conformation while also serving as a mild crowding agent that mimics the intracellular environment.
HEPES-KOH pH 7.5: The buffering system. It holds the reaction at a physiologically permissive pH, which matters because both ribosome activity and enzyme kinetics are sensitive to even modest pH drift over a 20-hour incubation.
Magnesium Glutamate: Magnesium is indispensable for ribosome assembly and catalytic activity. It also stabilises nucleotide triphosphates and is a cofactor for many of the enzymes active in the lysate.
Potassium Phosphate (monobasic and dibasic, 1.6:1 ratio): The phosphate pair serves dual duty: secondary pH buffering and phosphate donor pool. The specific dibasic:monobasic ratio fine-tunes the buffering capacity at pH 7.5 and feeds into nucleotide regeneration pathways.
Energy / Nucleotide System
Ribose: The carbon backbone for nucleotide biosynthesis. Cellular enzymes in the lysate phosphorylate and elaborate ribose into the nucleotide monophosphates needed for RNA synthesis, making it the upstream feedstock for the whole energy system.
Glucose: A supplementary carbon and energy source. It feeds into glycolysis within the lysate to regenerate ATP and sustain metabolic activity over the extended 20-hour window.
AMP, CMP, UMP: Nucleotide monophosphate precursors. The lysate enzymes phosphorylate these to their di- and triphosphate forms, supplying the NTPs required for transcription without the instability problems associated with adding NTPs directly.
GMP: Absent from this mix (0.00 uM in the image). Guanine is supplied instead and salvaged into GMP by the lysate’s purine salvage pathway, making direct GMP supplementation unnecessary.
Guanine: The free base precursor for guanosine nucleotides. Lysate hypoxanthine-guanine phosphoribosyltransferase (HGPRT) converts it to GMP via the purine salvage pathway, which is then phosphorylated to GDP and GTP for use in transcription.
Translation Mix (Amino Acids)
17 Amino Acid Mix: The bulk substrate pool for translation. Seventeen of the twenty standard amino acids are supplied together; tyrosine and cysteine are handled separately because of their solubility and stability constraints.
Tyrosine: Supplied at elevated pH (pH 12 stock) because tyrosine has very low aqueous solubility at neutral pH. It is added separately to avoid precipitation in the master mix.
Cysteine: Also added separately due to its tendency to oxidise in bulk amino acid stocks, which would render it unusable for translation. Keeping it isolated until reaction assembly preserves its reduced form.
Additives
Nicotinamide: An NAD+ precursor and sirtuin inhibitor. It helps maintain the NAD+/NADH redox balance needed to sustain metabolic enzyme activity across the long incubation, and may also reduce non-specific protein degradation by inhibiting NAD+-dependent deacylases in the lysate.
Backfill
Nuclease-Free Water: Brings the reaction to final volume without introducing RNases that would degrade the mRNA template and collapse expression.
Question 1: Key Differences Between the 1-Hour PEP-NTP and 20-Hour NMP-Ribose Master Mixes
The 1-hour PEP-NTP system supplies energy and nucleotides directly: preformed NTPs (ATP, GTP, CTP, UTP) plus phosphoenolpyruvate (PEP-Mono) as the immediate phosphate donor for ATP regeneration, with maltodextrin as a secondary carbon source. This makes it fast but metabolically shallow since the NTP pool is fixed at the start and depletes without robust regeneration. The 20-hour NMP-Ribose system takes the opposite approach: it supplies nucleotide monophosphates and simple sugars (ribose, glucose) as upstream precursors, letting the lysate’s own enzymes synthesise and continuously regenerate NTPs throughout the reaction, which sustains expression over a far longer window. The additives also diverge sharply: the 1-hour mix includes spermidine, DMSO, cAMP, NAD, and folinic acid to boost immediate transcription/translation efficiency, while the 20-hour mix strips these down to nicotinamide alone, reflecting a design philosophy of metabolic sustainability over peak output.
Bonus: How Does Transcription Occur If GMP Is 0.00 uM?
GMP is listed at 0.00 uM because it is not supplied directly. Guanine is present instead, and the lysate’s purine salvage machinery, specifically HGPRT, converts free guanine to GMP using PRPP (phosphoribosyl pyrophosphate) as the ribose-phosphate donor. That GMP is then phosphorylated to GDP and GTP by nucleoside monophosphate kinases and pyruvate kinase respectively. The system effectively outsources GTP synthesis to the lysate’s own enzymes rather than paying the cost of supplying pre-formed GMP that could be unstable or inhibitory at high concentrations.
Part C. Planning the Global Experiment | Cell-Free Master Mix Design
Fluorescent Protein Biophysical Properties (20-Hour NMP-Ribose Master Mix)
1. sfGFP
sfGFP was specifically engineered for robust folding under conditions where normal GFP would misfold or aggregate. It showed a 3.5-fold faster initial refolding rate than its parent frGFP and tolerated higher denaturant concentrations , which directly translates to better performance in the crowded, chaperone-limited environment of a cell-free lysate. In a 36-hour reaction, that folding robustness means a higher fraction of translated protein reaches a fluorescent state rather than being lost to misfolding.
2. mRFP1
The most relevant property here is incomplete chromophore maturation. mRFP1 shows two absorption peaks at 503 nm and 584 nm; the 503 nm peak corresponds to a green fraction that never fully matures beyond the green intermediate, with a quantum yield of only 0.27. In a cell-free system, there is no cellular quality control or folding assistance to rescue this incomplete maturation fraction, so a meaningful portion of expressed mRFP1 will likely remain dim or spectrally contaminated, reducing effective red fluorescence yield over the 36-hour incubation.
3. mKO2
mKO2 is a fast-folding variant of mKO1, engineered with 8 additional mutations for rapid maturation, though it has moderate acid sensitivity. The acid sensitivity is the property most relevant to cell-free. As the NMP-Ribose reaction runs over 36 hours, metabolic byproducts can acidify the reaction environment, and even modest pH drift below 7.0 could reduce mKO2 fluorescence output. Buffering capacity of the HEPES-KOH system is critical here specifically for mKO2.
4. mTurquoise2
mTurquoise2 has a maturation half-time of approximately 36.5 minutes , which is slow relative to other cyan variants. In a short reaction this would be a problem, but over 36 hours it is unlikely to be the bottleneck. The more relevant consideration is its complex, multi-step maturation kinetics: mTurquoise2 shows complex maturation kinetics requiring more than one kinetic step , meaning the protein accumulates through intermediate states before reaching peak fluorescence. For a 36-hour readout, this matters less than it would for a 1-hour endpoint assay.
5. mScarlet-I
mScarlet-I is one of the brightest monomeric red fluorescent proteins currently available, but it carries a known photostability limitation. The photostability of mScarlet-I is lower than mCherry under FRET imaging conditions, though under typical dynamic experiment conditions it barely loses intensity. More relevant to cell-free is that all GFP-like chromophores, including mScarlet-I’s, require molecular oxygen for maturation. In a sealed 20 uL reaction running for 36 hours, dissolved oxygen will be consumed early, meaning late-translated mScarlet-I molecules may not fully mature. This is probably the single biggest performance limiter for the red channel over long incubations.
6. Electra2
Electra2 is a blue fluorescent protein derived from mRuby3, engineered through hierarchical screening in bacterial and mammalian cells, with excitation at 403 nm and emission at 456 nm. Quantification of intracellular brightness showed Electra2 was approximately 2.1 times brighter than mTagBFP2 , which is impressive for the blue channel. The key biophysical caveat is that, like all GFP-derived beta-barrel FPs, Electra2 still requires molecular oxygen for chromophore maturation. This makes oxygen depletion over 36 hours a shared limitation with mScarlet-I, and potentially more acute for Electra2 because blue-channel chromophore formation is generally less efficient than green or red.
Hypothesis: Improving mScarlet-I Fluorescence Over 36-Hour Incubation
Protein: mScarlet-I
Problem: Oxygen-dependent chromophore maturation means late-translated mScarlet-I molecules cannot mature in a sealed, metabolically active reaction where dissolved O2 is consumed within the first few hours.
Hypothesis: Supplementing the 2 uL custom reagent slot with a controlled headspace oxygen carrier, specifically a dilute catalase-free perfluorocarbon oxygen supplement or simply increasing the dissolved O2 pre-reaction by briefly aerating the master mix before sealing, would extend the oxygen availability window and increase the proportion of mScarlet-I that reaches full chromophore maturation. Practically, within the reaction composition (6 uL lysate + 10 uL master mix + 2 uL DNA + 2 uL supplements), the 2 uL supplement volume could carry a small amount of hydrogen peroxide at sub-millimolar concentration as a slow O2 donor, with catalase from the lysate itself releasing O2 gradually throughout the incubation. Expected effect: higher peak fluorescence and a later-onset fluorescence plateau, reflecting maturation of protein translated in the middle and later phases of the 36-hour window rather than only the early burst.
Experimental Plan: mScarlet-I Cloud Lab Job Specification
Platform: Strateos (accessible remotely via browser; cloud-based liquid handling and plate reader)
Experiment type: Cell-free protein expression, fluorescence endpoint assay
Research question: Does supplementing a 20-hour NMP-Ribose cell-free reaction with a slow-release oxygen source (H2O2 at sub-millimolar concentration, using endogenous catalase as the release mechanism) increase mScarlet-I fluorescence yield at 36-hour endpoint relative to an unsupplemented control?
Job specification (Strateos format):
Controls rationale:
- No-supplement control: establishes baseline oxygen-limited yield
- No-DNA control: confirms fluorescence signal is expression-dependent, not autofluorescence
- H2O2 concentration range: establishes the beneficial window before oxidative damage dominates
- Four replicates per condition: sufficient for one-way ANOVA with 80% power to detect a 20% fluorescence increase
Expected outcome and significance: The hypothesis predicts a dose-response relationship with an optimal H2O2 concentration in the 0.1 to 0.5 mM range. If confirmed, this would support the practical use of H2O2 as a cheap, stable, easily shipped oxygen supplement for cell-free reactions in resource-constrained settings – directly relevant to the ÌṢỌ project’s goal of designing biology that functions outside high-resource laboratory environments.
Works Cited
Pédelacq, J.-D., Cabantous, S., Tran, T., Terwilliger, T. C., & Waldo, G. S. (2006). Engineering and characterization of a superfolder green fluorescent protein. Nature Biotechnology, 24(1), 79–88. https://doi.org/10.1038/nbt1172
Bindels, D. S., Haarbosch, L., van Weeren, L., Postma, M., Wiese, K. E., Mastop, M., Aumonier, S., Gotthard, G., Royant, A., Hink, M. A., & Gadella, T. W. J. (2017). mScarlet: A bright monomeric red fluorescent protein for cellular imaging. Nature Methods, 14(1), 53–56. https://doi.org/10.1038/nmeth.4074
Goedhart, J., von Stetten, D., Noirclerc-Savoye, M., Lelimousin, M., Joosen, L., Hink, M. A., van Weeren, L., Gadella, T. W. J., & Royant, A. (2012). Structure-guided evolution of cyan fluorescent proteins towards a quantum yield of 93%. Nature Communications, 3, 751. https://doi.org/10.1038/ncomms1738
Shaner, N. C., Lambert, G. G., Chammas, A., Ni, Y., Cranfill, P. J., Baird, M. A., Sell, B. R., Allen, J. R., Day, R. N., Bhatt, M., Davidson, M. W., & Wang, J. (2013). A bright monomeric green fluorescent protein derived from Branchiostoma lanceolatum. Nature Methods, 10(5), 407–409. https://doi.org/10.1038/nmeth.2413
Sakaue-Sawano, A., Kurokawa, H., Morimura, T., Hanyu, A., Hama, H., Osawa, H., Kashiwagi, S., Fukami, K., Miyata, T., Miyoshi, H., Imamura, T., Ogawa, M., Masai, H., & Miyawaki, A. (2008). Visualizing spatiotemporal dynamics of multicellular cell-cycle progression. Cell, 132(3), 487–498. https://doi.org/10.1016/j.cell.2007.12.033
Papadaki, S., Wang, X., Wang, Y., Zhang, H., Jia, S., Liu, S., Yang, M., Zhang, D., Jia, J.-M., Köster, R. W., Namikawa, K., & Piatkevich, K. D. (2022). Dual-expression system for blue fluorescent protein optimization. Scientific Reports, 12, 10190. https://doi.org/10.1038/s41598-022-13214-0
AI Prompts Employed (Claude AI)
- Why does mScarlet-I lose fluorescence yield over a 36-hour cell-free incubation specifically
- What is the mechanism by which dissolved oxygen depletion blocks chromophore maturation in GFP-like proteins
- How would a hydrogen peroxide slow-release system supply oxygen to a sealed cell-free reaction
- What is the difference between the 1-hour PEP-NTP and 20-hour NMP-Ribose energy systems at a mechanistic level
- Why is GMP absent from the NMP-Ribose master mix when transcription still requires GTP
Week 12
Node participant note: I am a remote Genspace node listener based in Nigeria without onsite lab access. The Week 12 lab was a bioproduction session at Genspace nodes. I engaged with the Building Genomes lecture content fully and document that engagement below. The ÌṢỌ project constraints memo is included as the project deliverable for this week.
Class Assignment — Week 12
Part A. Building Genomes: Course Notes
Core Themes from the Week 12 Lectures
The Building Genomes week brings together two convergent threads: the technical capacity to synthesise and assemble DNA at genome scale, and the design question of what you would build if synthesis cost were not a constraint.
Prof Church’s framing of genome-scale engineering through GP-write (Genome Project-write) positioned this not just as a sequencing problem in reverse, but as a design problem with hard biosafety constraints built into the architecture. The recoded organism work from his group (the 57-codon E. coli described by Fredens et al., 2019) demonstrated that synonymous codon compression is technically feasible at genome scale and creates a substrate for radical biocontainment: a cell whose codon table is incompatible with natural horizontal gene transfer cannot receive functional genes from wild-type organisms, and cannot donate them in return. That is a containment approach that operates at the informational layer rather than the metabolic layer.
The Glass/JCVI approach from the Mycoplasma mycoides JCVI-syn3.0 work brought a different emphasis: minimum genome definition. Synthesising a 531-gene essential genome and systematically knocking out non-essential genes revealed that roughly a third of essential gene functions are genuinely unknown in the minimal cell. That is a striking statement about the limits of our functional annotation of even the simplest known organisms.
Prof Boeke’s work on Sc2.0 (synthetic yeast genome) showed what large-scale genome synthesis looks like in a eukaryotic system: chromosome-by-chromosome replacement, with SCRaMbLE (Synthetic Chromosome Rearrangement and Modification by LoxP-mediated Evolution) built in as a built-in evolutionary exploration tool. The loxP site insertion throughout the synthetic chromosomes is a design choice that converts the genome into a substrate for combinatorial rearrangement on demand.
Connection to ÌṢỌ Containment Architecture
The containment architecture in ÌṢỌ is currently a first-generation metabolic dependency (ΔdapA auxotrophy, requiring exogenous DAP for survival). This is the conventional approach and it works at the population level, but it has a known failure mode: reversion or suppressor mutations can restore DAP synthesis at low frequency over generational time, and horizontal acquisition of a wild-type dapA gene from environmental bacteria remains theoretically possible.
The recoded organism approach points toward a second-generation containment strategy that would complement rather than replace auxotrophy: if ÌṢỌ’s key functional genes were encoded using a compressed codon table incompatible with natural ribosomes, horizontal gene transfer from or to wild-type organisms would be informationally blocked. This is a long-term design goal rather than a Spring 2026 deliverable, but the GP-write literature makes the design path concrete.
Part B. Project Constraints Memo: ÌṢỌ Design Boundaries (Spring 2026)
What ÌṢỌ is
A model-first, constraint-aware computational framework for engineering E. coli Nissle 1917 as a gut sentinel. The project produces reproducible computational models, tradeoff analyses (fitness vs efficacy), robustness assessments, and design regime maps. The current deliverable is a set of ODE and evolutionary models that inform what to build, not a built organism.
Design constraints actively governing current choices
Fitness budget: Every functional addition (biosensor, effector, containment circuit) carries a metabolic cost. The ODE model tracks growth rate as an explicit variable. No module is added without a corresponding fitness penalty estimate. The project is designed around stable, low-burden expression rather than peak performance.
Selection pressure: The model assumes selection is always running. Any design that is only stable at the intended expression level but unstable under evolutionary pressure is treated as a failed design, not a promising candidate awaiting optimization.
Containment as a first-class design variable: ΔdapA auxotrophy is included not as an afterthought but as a parameter in the escape probability model. The Luria-Delbrück framework used to estimate reversion frequency treats containment failure as a quantifiable risk to be designed against, not a worst-case scenario to be hoped away.
Ecological realism: The gut is not a flask. The models include a competing commensal term and treat the ÌṢỌ organism as one species in a dynamic ecosystem, not a cell culture in isolation.
What is out of scope (Spring 2026)
- Wet-lab validation of any construct
- Full microbiome ecosystem simulation
- Regulatory pathway analysis
- Clinical or preclinical deployment planning
- Any in vivo animal model work
Next steps beyond Spring 2026
The Twist construct (MccH47_pUC19_EcN_v1) is the bridge to Phase 2. If synthesis is confirmed and the sequence is validated, in vitro characterisation of TtrR-mediated induction and MccH47 expression can proceed in a collaborating laboratory environment. Cloud lab platforms would be the preferred route given my remote location.
Works Cited
Fredens, J., Wang, K., de la Torre, D., Funke, L. F. H., Robertson, W. E., Christova, Y., Chia, T., Schmied, W. H., Dunkelmann, D. L., Beránek, V., Uttamapinant, C., Llamazares, A. G., Elliott, T. S., & Chin, J. W. (2019). Total synthesis of Escherichia coli with a recoded genome. Nature, 569(7757), 514–518. https://doi.org/10.1038/s41586-019-1192-5
Hutchison, C. A., Chuang, R.-Y., Noskov, V. N., Assad-Garcia, N., Deerinck, T. J., Ellisman, M. H., Gill, J., Kannan, K., Karas, B. J., Ma, L., Pelletier, J. F., Qi, Z.-Q., Richter, R. A., Strychalski, E. A., Sun, L., Suzuki, Y., Tsvetanova, B., Wise, K. S., Smith, H. O., … Glass, J. I. (2016). Design and synthesis of a minimal bacterial genome. Science, 351(6280), aad6253. https://doi.org/10.1126/science.aad6253
Richardson, S. M., Mitchell, L. A., Stracquadanio, G., Yang, K., Dymond, J. S., DiCarlo, J. E., Lee, D., Huang, C. L., Chandrasegaran, S., Cai, Y., Boeke, J. D., & Bader, J. S. (2017). Design of a synthetic yeast genome. Science, 355(6329), 1040–1044. https://doi.org/10.1126/science.aaf4557
Lajoie, M. J., Rovner, A. J., Goodman, D. B., Aerni, H.-R., Haimovich, A. D., Kuznetsov, G., Mercer, J. A., Wang, H. H., Carr, P. A., Mosberg, J. A., Rohland, N., Schultz, P. G., Jacobson, J. M., Rinehart, J., Church, G. M., & Isaacs, F. J. (2013). Genomically recoded organisms expand biological functions. Science, 342(6156), 357–360. https://doi.org/10.1126/science.1241459
AI Prompts Employed (Claude AI)
- Summarise the key design principles of GP-write and how recoded organisms differ from standard auxotrophic containment strategies
- Explain how SCRaMbLE works in the Sc2.0 synthetic yeast and what it reveals about genome architecture
- What is the minimum genome concept from JCVI-syn3.0 and what fraction of essential gene functions remain unknown
- Connect recoded organism containment logic to the ÌṢỌ ΔdapA auxotrophy as complementary rather than competing approaches
Week 13
Node participant note: I am a remote Genspace node listener based in Nigeria without onsite lab access. The Week 13 lab was a continuation of final project work at Genspace nodes. I engaged with the AI+SynBio lecture content fully and document my reflections below, with particular attention to how the tools covered in this lecture connect to my own computational work throughout the course.
Class Assignment — Week 13
Part A. AI and Synthetic Biology: Course Notes
Renee Wegrzyn and the AI-Biology Interface
The framing Renee Wegrzyn brought to this week – that AI is not replacing the biologist but is expanding the design space the biologist can responsibly explore – is one I have lived through concretely across this course. By the time I reached Week 13, I had run ESMFold on TolC, latent-space clustered 250 protein sequences, designed peptide binders for SOD1-A4V, and generated ProteinMPNN sequences against a fixed backbone. Every one of those steps would have been inaccessible to me four months ago, not because the biology was unknown, but because the computational infrastructure was either unavailable, too slow, or too expensive for a student working from Nigeria on a consumer laptop and Google Colab.
What changed is not the biology. What changed is that the inference cost of structure prediction collapsed, and the tooling became accessible to remote participants without institutional compute. That shift is what makes AI+SynBio a genuinely global development rather than a tool that further concentrates capability in well-resourced institutions.
What These Tools Can and Cannot Do: Evidence from My Own Work
The Week 5 cross-reference between ESM2 LLR scores and experimental lysis data for the MS2 L-protein remains the clearest demonstration of this I have encountered. K50 was the highest-scoring position in the entire ESM2 deep mutational scan. Every experimentally tested K50 substitution abolished lysis. The language model had no access to the mechanistic information that made K50 functionally non-negotiable. It scored substitutability based on evolutionary co-occurrence patterns, which is a genuinely different question from biochemical necessity.
This is not a reason to distrust AI tools. It is a reason to use them correctly: as filters that reduce the experimental search space, not oracles that replace it. ESM2 at K50 is a false positive. But ESM2 correctly identified positions 45, 46, and 63 as tolerant, all of which were experimentally confirmed as lysis-competent. The tool is useful. It is not sufficient.
The same principle applies to ÌṢỌ. AlphaFold2/ESMFold gives me a structural model of the TolC-MccH47 export pathway. PeptiVerse gives me predicted solubility and haemolysis scores. Tellurium gives me ODE dynamics under assumed parameters. None of these replaces the experiment that would confirm whether MccH47 is actually exported and active in EcN at the tetrathionate concentrations I have modelled. The models are load-bearing design tools, not substitutes for wet-lab validation.
Part B. ÌṢỌ — AI Tool Audit
A retrospective mapping of which AI tools shaped which design decisions:
| Tool | Week used | Decision it shaped |
|---|---|---|
| ESMFold | 4, 7 | TolC structure validation; MccH47 fold confidence |
| ESM2 (mutational scan) | 4, 5 | TolC constraint mapping; L-protein mutation selection |
| ProteinMPNN | 4 | TolC backbone-compatible sequence design |
| AlphaFold3 | 5 | SOD1-A4V binder structural confidence (ipTM) |
| PepMLM | 5 | SOD1-A4V candidate generation |
| moPPIt | 5 | Multi-objective optimised SOD1 binders |
| PeptiVerse | 5 | Multi-property therapeutic evaluation |
| Tellurium (ODE) | 7 | ÌṢỌ biosensor response circuit dynamics |
| ColabFold AF2-Multimer | 5 | MS2 L-protein octameric pore modelling |
No single tool drove a design decision alone. Every row in this table represents a step in an integrated pipeline where the output of one tool was interrogated against independent evidence before being acted on.
Works Cited
Jumper, J., Evans, R., Pritzel, A., Green, T., Figurnov, M., Ronneberger, O., Tunyasuvunakool, K., Bates, R., Žídek, A., Potapenko, A., Bridgland, A., Meyer, C., Kohl, S. A. A., Ballard, A. J., Cowie, A., Romera-Paredes, B., Nikolov, S., Jain, R., Adler, J., … Hassabis, D. (2021). Highly accurate protein structure prediction with AlphaFold. Nature, 596(7873), 583–589. https://doi.org/10.1038/s41586-021-03819-2
Lin, Z., Akin, H., Rao, R., Hie, B., Zhu, Z., Lu, W., Smetanin, N., Verkuil, R., Kabeli, O., Shmueli, Y., dos Santos Costa, A., Fazel-Zarandi, M., Sercu, T., Candido, S., & Rives, A. (2023). Evolutionary-scale prediction of atomic-level protein structure with ESMFold. Science, 379(6637), 1123–1130. https://doi.org/10.1126/science.ade2574
Abramson, J., Adler, J., Dunger, J., Evans, R., Green, T., Pritzel, A., Ronneberger, O., Willmore, L., Ballard, A. J., Bambrick, J., Bodenstein, S. W., Evans, D. A., Hung, C.-C., O’Neill, M., Reiman, D., Tunyasuvunakool, K., Wu, Z., Žemgulytė, A., Arany, Z., … Jumper, J. M. (2024). Accurate structure prediction of biomolecular interactions with AlphaFold 3. Nature, 630(8016), 493–500. https://doi.org/10.1038/s41586-024-07487-w
AI Prompts Employed (Claude AI)
- Retrospectively map which AI tools shaped which design decisions in the ÌṢỌ project and what evidence each decision rested on
- Explain the distinction between what ESM2 measures (evolutionary substitutability) and what experimental lysis data measures (biochemical necessity) using K50 as the specific example
Week 14
Node participant note: I am a remote Genspace node listener based in Nigeria without onsite lab access. Week 14 was the final project presentation and course close. I engaged with the Bio Design and Fabrication lecture content and document the ÌṢỌ final project summary below.
Class Assignment — Week 14
Part A. Bio Design and Fabrication: Course Notes
Christina Agapakis and Design as Practice
The framing that resonated most from Agapakis’s work is that design in biology is not just about making functional things. It is about making legible things. A biosensor that works but whose logic no one outside the lab can follow is not a complete design. A containment system that is technically sound but whose failure modes have not been communicated to non-specialist stakeholders is not a complete design.
ÌṢỌ has been designed with this in mind from the start, though the pressure to make the design legible to different audiences becomes concrete at the final project stage. The ODE model is legible to a computational biologist. The construct map is legible to a molecular biologist. The public health framing (reducing childhood diarrhoeal mortality in West Africa) is legible to a clinician or a funder. Making all three levels of legibility available simultaneously, without compromising the technical rigour of any one layer, is the actual design challenge that this week crystallised for me.
Christopher Chen and Fabrication Thinking
Chen’s work on biofabrication brought a question I had not fully resolved in my own design: at what point does a computational model become a fabrication plan? The answer is not when you have high confidence in the model parameters. It is when you have a clear path from model output to physical substrate. For ÌṢỌ, that path runs through the Twist construct, through a collaborating lab for transformation and selection, through a plate reader for expression verification, and through co-culture assays for kill kinetics. Each step is specified in the Week 10 measurement framework. The fabrication story is there. What it lacks is the first physical artefact to anchor it.
That artefact is the Twist order. It is the one non-computational output from this course, and it represents the transition from design to fabrication in the most minimal possible sense.
Part B. ÌṢỌ Final Project Summary
What was built
A model-first, constraint-aware computational framework for engineering E. coli Nissle 1917 as a gut sentinel: sensing context, responding with targeted antimicrobials, and remaining governable through built-in containment.
Deliverables produced during HTGAA 2026:
- ODE model of the tetrathionate biosensor response circuit (Tellurium, Week 7)
- Moran process simulation of containment escape probability under selection pressure
- ESMFold structural model of TolC-MccH47 export pathway (Week 4)
- ProteinMPNN alternative sequences for TolC backbone (Week 4)
- Benchling construct: MccH47_pUC19_EcN_v1, with primer design and Gibson assembly annotation (Week 6)
- Twist gene synthesis order submitted: MccH47_pUC19_EcN_construct_v1 (Week 7)
- Measurement framework mapping every model parameter to a specific future assay (Week 10)
- Cloud lab job specification for mScarlet-I oxygen supplementation experiment (Week 11)
Key design decisions documented:
- ΔdapA auxotrophy as the primary containment mechanism, with Luria-Delbrück escape frequency modelling
- pSC101 backbone preferred over pUC19 for evolutionary stability in EcN, with pUC19 used for initial sequence verification
- BsaI site removal from MccH47 structural gene for Golden Gate compatibility in downstream modular assembly
- mScarlet-I as the co-reporter for expression verification, with oxygen supplement hypothesis for 36-hour cell-free validation
What was learned
The course reinforced one principle above all others: biological engineering requires holding three timescales simultaneously. The ODE timescale (minutes to hours, biosensor activation kinetics) is the one most computational tools optimise for. The evolutionary timescale (generations to months, fitness cost and containment stability) is the one most computational tools ignore. The clinical timescale (years to decades, disease burden, treatment gap) is the one that determines whether any of it matters.
ÌṢỌ was designed to hold all three. The model optimises circuit output while tracking fitness cost and escape probability. The choice of pathogen target (Salmonella-induced tetrathionate, relevant to diarrhoeal disease in high-burden settings) anchors the clinical timescale. Whether the design is good will ultimately be judged not by the pTM score of the AlphaFold model but by whether a child in Osogbo is less likely to be admitted with severe dehydration because of it.
That is a long road from where ÌṢỌ currently sits. But the design choices made during HTGAA 2026 are load-bearing steps on that road, and they were made with that destination in mind.
Part C. Project Feedback (Summary)
Feedback received during the course on ÌṢỌ design:
How do you see the tool been deployed in real-life contexts and what do you see are the challenges towards achieving that?
I think the tool would most realistically be deployed as an oral living therapeutic, possibly as a tablet, hydrogel system, chewable capsule, or another ingestible probiotic formulation designed to survive long enough to function within the gut environment.
Beyond treatment itself, I also see potential use in preclinical synthetic biology R&D, where the framework could help researchers evaluate stability, burden, and containment before moving into expensive wet-lab development. It may also contribute to antimicrobial resistance stewardship by supporting more targeted microbial therapies rather than broad-spectrum antibiotic exposure.
The main challenges would likely be biosafety, regulation, and public trust. Even with built-in containment strategies, there would still be concerns about unintended ecological spread or cross-contamination of the engineered microbe, however unlikely that may be. I also think socio-cultural acceptance would matter significantly (in a post-COVID world), especially in communities where genetically engineered therapeutics may be viewed with caution. Because of this, any real deployment would need strong public-health communication, transparency, and long-term safety validation alongside the science itself.
Works Cited
Ba, F., Zhang, Y., Ji, X., Liu, W.-Q., Ling, S., & Li, J. (2023). Expanding the toolbox of probiotic Escherichia coli Nissle 1917 for synthetic biology. bioRxiv. https://doi.org/10.1101/2023.06.05.543671
Lynch, J. P., Goers, L., & Lesser, C. F. (2022). Emerging strategies for engineering Escherichia coli Nissle 1917-based therapeutics. Trends in Pharmacological Sciences, 43(9). https://doi.org/10.1016/j.tips.2022.02.002
Palmer, J. D., Piattelli, E., McCormick, B. A., Silby, M. W., Brigham, C. J., & Bucci, V. (2017). Engineered probiotic for the inhibition of Salmonella via tetrathionate-induced production of Microcin H47. ACS Infectious Diseases, 4(1), 39–45. https://doi.org/10.1021/acsinfecdis.7b00114
Weibel, N., Curcio, M., Schreiber, A., et al. (2024). Engineering a novel probiotic toolkit in Escherichia coli Nissle 1917 for sensing and mitigating gut inflammatory diseases. ACS Synthetic Biology, 13(8), 2376–2390. https://doi.org/10.1021/acssynbio.4c00036
AI Prompts Employed (Claude AI)
- Synthesise the ÌṢỌ project deliverables from across HTGAA 2026 into a coherent final project summary that identifies what was built, what was decided, and what remains unresolved
- Explain the concept of biological legibility and apply it to the three-audience problem in ÌṢỌ (computational biologist, molecular biologist, public health)