Week 10
Node participant note: I am a remote Genspace node listener based in Nigeria without onsite lab access. The Week 10 mass spectrometry lab at Genspace was equipment-dependent and not replicable remotely. The Waters dataset (intact mass, native/denatured ESI, peptide mapping, oligomers, GFP confirmation) was shared with all HTGAA participants including CLs, and my analysis was completed below.
Class Assignment — Week 10
Homework: Final Project
ÌṢỌ is currently computational, so the “measurements” in scope are model outputs rather than physical assays. The key quantities I track are: steady-state pathogen kill rate as a function of MccH47 production, growth rate as a function of expression burden δ, biosensor activation ratio across tetrathionate concentrations, and containment escape probability over generational time. These are computed from ODE integration and Moran process simulation rather than physical instruments, but they map directly onto measurable biological quantities that would need experimental validation in a future phase of the project.
Priority measurements in the wet-lqb phase would be:
Circuit output and reporter quantification Fluorescence intensity of the sfGFP reporter (co-expressed with MccH47 under TtrR-activated promoter) measured by plate-reader fluorimetry across a tetrathionate concentration gradient. This gives the dose-response curve the biosensor model predicts and directly benchmarks the Hill coefficient and activation threshold used in the ODE.
MccH47 production and secretion Liquid chromatography coupled to mass spectrometry (LC-MS) would confirm MccH47 identity and quantify extracellular concentration. Given the focus on intact protein mass measurement, a Waters-type Xevo QTof system running native LC-MS would resolve the microcin’s intact mass (~4.9 kDa) and confirm post-translational processing of the precursor peptide, which is biologically relevant since MccH47 requires leader peptide cleavage for activity.
Pathogen kill kinetics Colony-forming unit counts on selective media over time, co-incubating engineered EcN with Salmonella Typhimurium at defined tetrathionate concentrations. This parameterizes k_kill directly.
Auxotrophy confirmation and escape frequency Growth curves in DAP-depleted media confirm the ΔdapA deletion is clean. Fluctuation assay (Luria-Delbrück) on large populations estimates reversion frequency, which feeds directly into the containment escape model.
Growth burden OD600 time-course comparing wild-type EcN, circuit-off EcN, and circuit-induced EcN. The growth rate differential quantifies δ experimentally.
The computational figures being produced now are designed to be directly comparable to these future measurements, every parameter in the model has a specific assay that would validate or revise it.
Part A. Waters Part I — Molecular Weight
The Waters mass spectrometry exercises this week are not purely theoretical for ÌṢỌ. MccH47 is a post-translationally processed antimicrobial peptide: the ribosome produces a 59-residue precursor (mcmA leader + structural peptide), and the leader sequence must be cleaved by the dedicated ABC transporter MchF before the active form is secreted. Confirming intact mass of the processed peptide (~4.9 kDa for the mature MccH47) and verifying complete leader peptide removal are exactly the measurements a Waters Xevo QTof running native LC-MS would provide in a future validation phase of this project. The GFP analysis I worked through here is the same analytical workflow, applied to a protein I will actually need to verify.
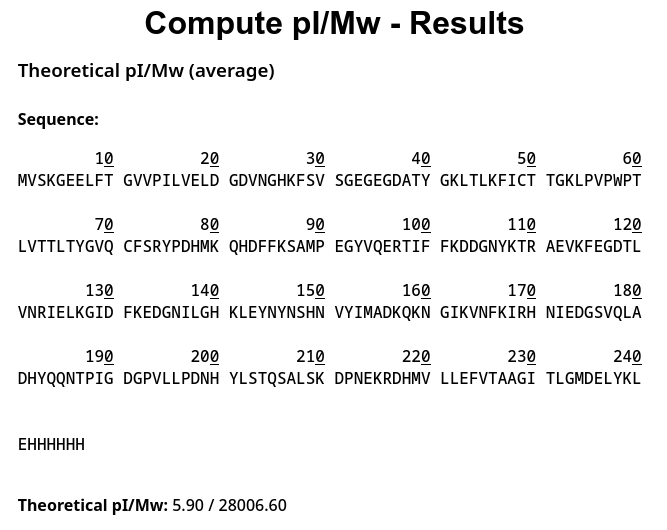
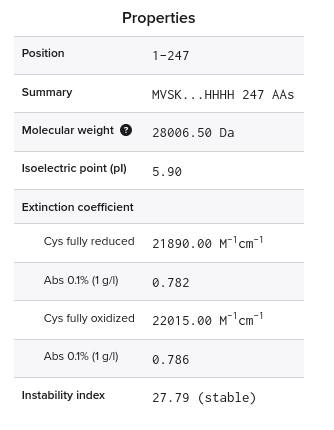
1. Theoretical pI/Mw: 5.90 / 28006.60
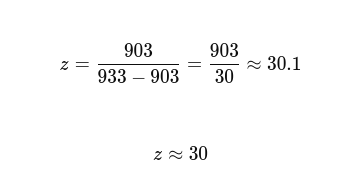
2.1 Determination of z for adjacent pair of peaks using the given formula
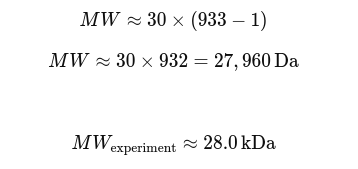
From the spectrum, a good clean pair is: • m/zn≈933 • m/zn+1≈903
These are part of the same envelope (but essentially different charge states), and the spacing is realistic.
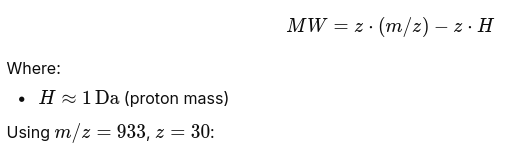
2.2 MW of the protein using the scientific relationship
2.3 Accuracy of the measurement between both methods
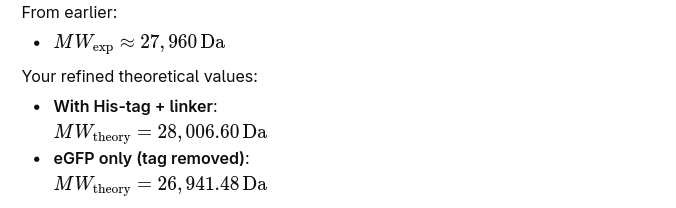
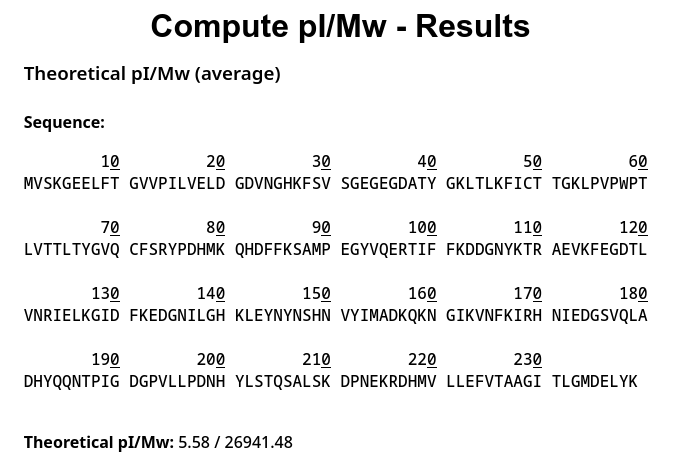
Compared with theoretical MW Typical values: • eGFP alone ≈ 26.9–27.0 kDa • With Histidine tag + linker → ≈ 27.5–28.5 kDa
So the result is reasonably correct

Absolute error ≈ 46.6 Da Relative error ≈ 0.00166 Percent error ≈ 0.166% Accuracy ≈ 99.83%
2.4 Charged state for the zoomed-in peak in the mass spectrum picture
No, the charge state cannot be determined from the zoomed-in peak. This is because there are no clearly resolved adjacent charge-state peaks in that region of the spectrum. The signal appears as a single broadened peak without the necessary spacing pattern required to apply the adjacent charge-state method.
Part B. Waters Part II — Secondary/Tertiary structure
1. Native vs Denatured Protein conformations
When a protein is in its native, folded state, the tertiary structure buries most basic residues (lysine, arginine, histidine) inside the hydrophobic core or locks them into salt bridges and hydrogen bonds. In native electrospray ionisation (ESI), these residues are inaccessible to protonation, so the protein acquires relatively few charges, producing ions at high m/z values. This is exactly what the red spectrum shows, with the dominant ion envelope centred around m/z 2545.
When a protein unfolds, the polypeptide chain opens up and all basic residues become solvent-exposed and available for protonation. The same protein now picks up far more protons, producing many charge states compressed into the low m/z region. The green (denatured) spectrum shows this clearly, the charge state envelope spans roughly m/z 600 to 1300, with peaks spaced closely together because many adjacent charge states (z ≈ 20 through z ≈ 40+) are simultaneously represented.
The mass spectrometer determines fold state indirectly: it measures the m/z ratio of each ion. Since molecular weight is unchanged by denaturation, the shift in the m/z envelope directly reflects a change in charge state z. Higher charge means lower m/z for the same mass. The instrument does not detect conformation directly, it detects the charge acquired during ESI, which is a proxy for solvent-accessible surface area and protonatable site exposure, both of which are determined by the protein’s fold state.
The zoomed inset in the native (red) spectrum supports this interpretation. The isotope spacing at m/z ~2545 is approximately 0.18 Da, corresponding to a charge state of z = 1/0.18 ≈ 11. A native folded protein the size of eGFP (~27 kDa) carrying only 11 charges is consistent with a compact structure where most basic residues are sequestered. The denatured form distributes that same mass across charge states of z = 20 or higher, shifting the entire envelope into the low m/z window seen in the green spectrum.
2. Charge state of the peak findings
Identifying the charge state from isotope spacing
Looking at the native mass spectrum (Figure 3), the peak cluster around m/z 2799–2800 shows two resolved isotope peaks labeled 2799.4199 and 2799.6365.
The isotope spacing is 2799.6365 − 2799.4199 = 0.2166 Da
Since adjacent isotope peaks within a charge state envelope are separated by 1 Da / z, the charge state is z = 1 / 0.2166 ≈ 4.6, which rounds to +5
The charge state of the peak at ~2800 is +5.
How you can tell?
In ESI-MS, each isotope peak differs from the next by exactly 1 neutron (1 Da). Distributed across z charges, that 1 Da difference appears as a spacing of 1/z in the m/z spectrum. The ~0.2 Da spacing observed here gives 1/0.2 = 5, confirming a 5+ ion. As a rule of thumb, a singly charged ion shows isotope spacing of 1.0 Da; a doubly charged ion shows 0.5 Da; a 5+ ion shows ~0.2 Da.
What this ion likely represents?
A z = +5 ion at m/z ~2800 corresponds to a neutral mass of approximately (2800 × 5) − 5 = ~13,995 Da
This is close to half the molecular weight of intact eGFP (~27 kDa), suggesting this peak may represent a doubly charged dimer or a fragment species rather than the intact monomer. In a native direct-infusion experiment, low-abundance species like non-covalent dimers or partial assemblies can appear at unexpected m/z values. This peak is worth noting as a minor species distinct from the main z = 11 native monomer envelope centred at m/z ~2545.
Part C. Waters Part III — Peptide Mapping - primary structure
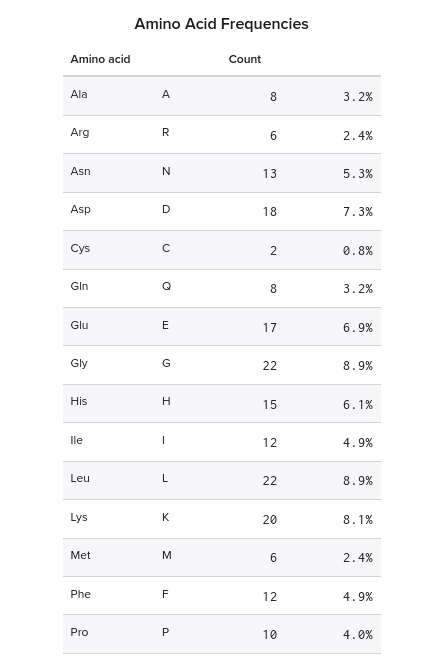
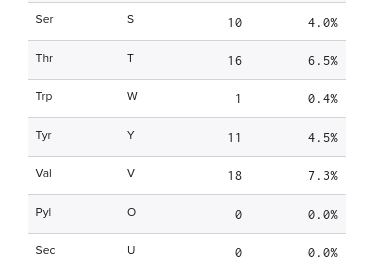
1. Lysines (K) and Arginines (R) in eGFP from Benchling
Arginines: 6 Lysines: 20
2. Peptide mapping for tryptic digestion of eGFP using PeptideMass
Trypsin cleaves after lysine (K) and arginine (R) residues. Running the eGFP sequence through ExPASy PeptideMass with trypsin, 0 missed cleavages, reduced cysteines, and a 500 Da mass cutoff returns 19 peptides, covering 90.7% of the sequence.
| Mass [M+H]⁺ | Position | Peptide sequence |
|---|---|---|
| 4472.1752 | 170–210 | HNIEDGSVQLADHYQQNTPIGDGPVLLPDNHYLSTQSALSK |
| 2566.2931 | 217–239 | DHMVLLEFVTAAGITLGMDELYK |
| 2437.2608 | 5–27 | GEELFTGVVPILVELDGDVNGHK |
| 2378.2577 | 54–74 | LPVPWPTLVTTLTYGVQCFSR |
| 1973.9062 | 142–157 | LEYNYNSHNVYIMADK |
| 1503.6597 | 28–42 | FSVSGEGEGDATYGK |
| 1266.5783 | 87–97 | SAMPEGYVQER |
| 1083.4979 | 240–247 | LEHHHHHH |
| 1050.5214 | 115–123 | FEGDTLVNR |
| 982.4952 | 133–141 | EDGNILGHK |
| 821.3940 | 81–86 | QHDFFK |
| 790.3552 | 75–80 | YPDHMK |
| 769.3913 | 47–53 | FICTTGK |
| 711.2944 | 103–108 | DDGNYK |
| 655.3813 | 98–102 | TIFFK |
| 602.2780 | 211–215 | DPNEK |
| 579.3137 | 128–132 | GIDFK |
| 507.2925 | 164–167 | VNFK |
| 502.3235 | 124–127 | IELK |
Parameters: trypsin, 0 missed cleavages, cysteines reduced, methionines unoxidised, masses > 500 Da, monoisotopic [M+H]⁺. Theoretical pI: 5.90, average MW: 28,006.60 Da, monoisotopic MW: 27,988.96 Da.
Chromatographic peaks in the TIC (0.5 to 6 min)
Counting all peaks above 10% relative abundance in Figure 5a between 0.5 and 6 minutes, there are approximately 19 chromatographic peaks visible.
Does the peak count match the predicted peptide count?
The PeptideMass prediction returned 19 peptides above 500 Da. The chromatogram shows a comparable number of peaks, though there appear to be more peaks than predicted peptides. This is expected: a single peptide can produce multiple chromatographic peaks if it elutes as co-eluting charge states, if there are oxidised or modified variants, or if missed cleavage products are present at low levels. Additionally, some peaks may represent non-peptide matrix components or buffer adducts.
Identifying the charge state and mass of the peptide at 2.78 min (Figure 5b)
The most abundant ion in Figure 5b appears at m/z = 525.76712, with a second charge state visible at m/z = 1050.52438.
Using the isotope spacing in the inset zoom of the 525.76 peak:
The two isotope peaks are at 525.76712 and 526.25918, giving a spacing of:
526.25918 - 525.76712 = 0.4921 Da
Since isotope spacing = 1/z:
z = 1 / 0.4921 = ~2, confirming the most abundant charge state is z = +2.
The singly charged mass [M+H]⁺ is calculated as:
[M+H]⁺ = (m/z × z) - (z - 1) = (525.76712 × 2) - 1 = 1050.53424 Da
This is consistent with the observed singly charged ion at m/z 1050.52438.
Peptide identification and mass accuracy
From the PeptideMass results, the peptide with theoretical [M+H]⁺ = 1050.5214 Da at position 115-123 is FEGDTLVNR.
Mass accuracy in ppm:
ppm error = ((observed - theoretical) / theoretical) × 10⁶
ppm error = ((1050.52438 - 1050.5214) / 1050.5214) × 10⁶ = +2.84 ppm
This is well within the typical <5 ppm accuracy expected from a Waters Xevo G3 QTof instrument.
Sequence coverage confirmed by peptide mapping
As shown in Figure 6, the BioAccord LC-MS peptide identification data confirms 88% sequence coverage of eGFP, with the unconfirmed regions corresponding primarily to small peptides below the 500 Da detection threshold and the short peptides at the N-terminus (MVS) that fall outside the tryptic detection window.
Bonus Peptide Map Questions
Peptide identification from Figure 5c
The peptide eluting at 2.78 min with [M+H]⁺ = 1050.52438 Da matches FEGDTLVNR (positions 115–123, predicted [M+H]⁺ = 1050.5214 Da, 2.84 ppm error).
The predicted fragment ion series confirms the match:
| Position | Residue | B ion (m/z) | Y ion (m/z) |
|---|---|---|---|
| 1 | F | 148.07574 | 1050.52149 |
| 2 | E | 277.11833 | 903.45308 |
| 3 | G | 334.13979 | 774.41049 |
| 4 | D | 449.16673 | 717.38902 |
| 5 | T | 550.21441 | 602.36208 |
| 6 | L | 663.29848 | 501.31440 |
| 7 | V | 762.36689 | 388.23034 |
| 8 | N | 876.40982 | 289.16192 |
| 9 | R | 1032.51093 | 175.11900 |
The observed ions in Figure 5c at m/z 774.41334, 903.44365, and 602.34777 correspond directly to Y7 (774.41049), Y8 (903.45308), and Y5 (602.36208) ions respectively, confirming the sequence read-out from the C-terminus. The B/Y ion ladder is internally consistent and the fragmentation pattern is unambiguous.
Does the peptide map confirm eGFP identity?
Yes. The data are consistent with the eGFP standard for several converging reasons. The identified peptide FEGDTLVNR is unique to eGFP and is not a common contaminant sequence. The measured mass matches the theoretical monoisotopic mass within 2.84 ppm, well within the instrument’s expected accuracy. The fragmentation spectrum produces a coherent B and Y ion series with no unexplained major peaks. Figure 6 shows 88% sequence coverage across the full eGFP chain, with the identified peptides distributed across nearly the entire length of the protein rather than clustering in one region, which would be expected if the signal were from a contaminant or partial degradation product. The small uncovered regions (approximately 12% of sequence) correspond to short peptides below the 500 Da detection threshold and the N-terminal MVS tripeptide, both of which are expected gaps given the experimental parameters rather than evidence against eGFP identity.
Part D. Waters Part IV — Oligomers
Using the subunit masses from Table 1 (7FU = 340 kDa, 8FU = 400 kDa), the observed CDMS peaks map to the following oligomeric species:
| Peak (MDa) | Calculated mass | Assignment |
|---|---|---|
| 3.4 | 340 kDa × 10 = 3.40 MDa | 7FU Decamer |
| 8.33 | 400 kDa × 20 = 8.00 MDa | 8FU Didecamer |
| 12.67 | 400 kDa × 30 = 12.00 MDa | 8FU 3-Decamer |
| ~16–17 (low, broad) | 400 kDa × 40 = 16.00 MDa | 8FU 4-Decamer |
The dominant species in solution is the 8FU didecamer at ~8.33 MDa, which is the canonical functional assembly of KLH. The 7FU decamer at ~3.4 MDa appears as a lower-abundance species representing the half-molecule form. The 3-decamer at ~12.67 MDa is present at reduced intensity, and the 4-decamer is visible only as a broad low-intensity feature near 16 MDa, consistent with published observations of KLH assembly heterogeneity in solution.
The small offsets between calculated and observed masses (e.g. 8.00 MDa calculated vs. 8.33 MDa observed for the didecamer) reflect glycosylation and other post-translational modifications on KLH subunits, which are not accounted for in the bare polypeptide masses in Table 1.
Part E. Waters Part V — Did I make GFP?
| Theoretical | Observed (Intact LC-MS) | PPM Mass Error | |
|---|---|---|---|
| Molecular weight (kDa) | 27.9890 | 27.9896 | +2.14 ppm |
Works Cited
Campuzano, I. D. G., & Loo, J. A. (2025). Evolution of mass spectrometers for high m/z biological ion formation, transmission, analysis and detection: A personal perspective. Journal of the American Society for Mass Spectrometry, 36(4), 632–652. https://doi.org/10.1021/jasms.4c00348
Kalli, A., & Hess, S. (2012). Effect of mass spectrometric parameters on peptide and protein identification rates for shotgun proteomic experiments on an LTQ-Orbitrap mass analyzer. Proteomics, 12(1), 21–31. https://doi.org/10.1002/pmic.201100464
Protein Data Bank. (2024). eGFP sequence and structure. https://www.rcsb.org
ExPASy Bioinformatics Resource Portal. (2024). PeptideMass tool. https://web.expasy.org/peptide_mass/
Waters Corporation. (2024). Xevo G3 QTof mass spectrometer: Technical specifications. https://www.waters.com
AI Prompts Employed (Claude AI)
- Explain how ESI charge state envelopes shift between native and denatured protein conformations
- How do I determine charge state from isotope spacing in a native mass spectrum
- Calculate molecular weight from adjacent charge state peaks using the standard formula
- What does 88% sequence coverage mean in a peptide mapping experiment and what causes the remaining 12% to go undetected
- How do the oligomeric assignments of KLH map onto CDMS peaks when subunit masses are known