Week 10: Advanced Imaging and Measurement Technology
Based on the older information:
• m/z(n) = 824.1148
• m/z(n+1) = 800.608
• n = 34.0172
MW = (n * m/z(n)) - n
MW = ((34.0172) (824.1148)) - 34.0172
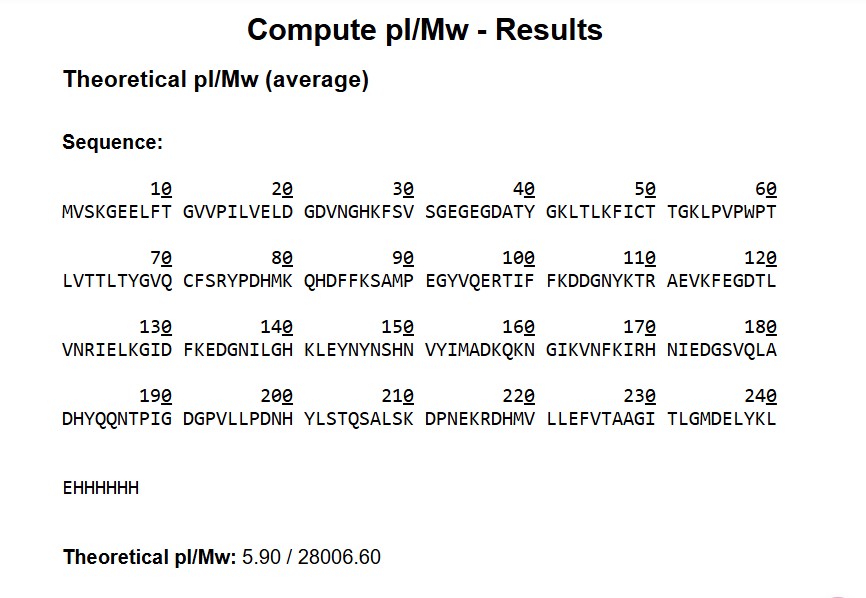
MW = 28,000.06 daltons
Error Rate/Accuracy = ((28006.6 - 28000.06)/28006.6)1000000 = 0.0002341000000 = 233.52ppm
This value is much higher than the 50ppm threshold, indicating an issue with the tested product. Also, I think this calculation seems to actually be for inaccuracy or error rate.
The sequence has 20 K’s and 6 R’s for peptide segmentation sites
MVSKGEELFTG VVPILVELDG DVNGHKFSVS GEGEGDATYG KLTLKFICTT GKLPVPWPTL VTTLTYGVQC FSRYPDHMKQ HDFFKSAMPE GYVQERTIFF KDDGNYKTRA EVKFEGDTLV NRIELKGIDF KEDGNILGHK LEYNYNSHNV YIMADKQKNG IKVNFKIRHN IEDGSVQLAD HYQQNTPIGD GPVLLPDNHY LSTQSALSKD PNEKRDHMVL LEFVTAAGIT LGMDELYKLE HHHHHH
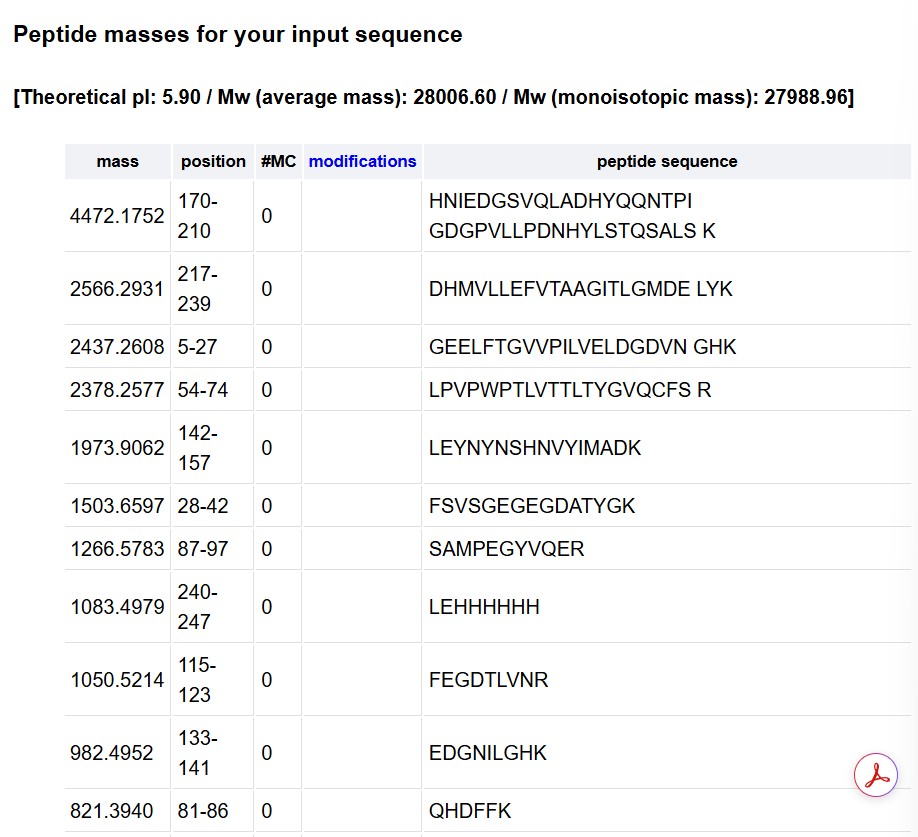
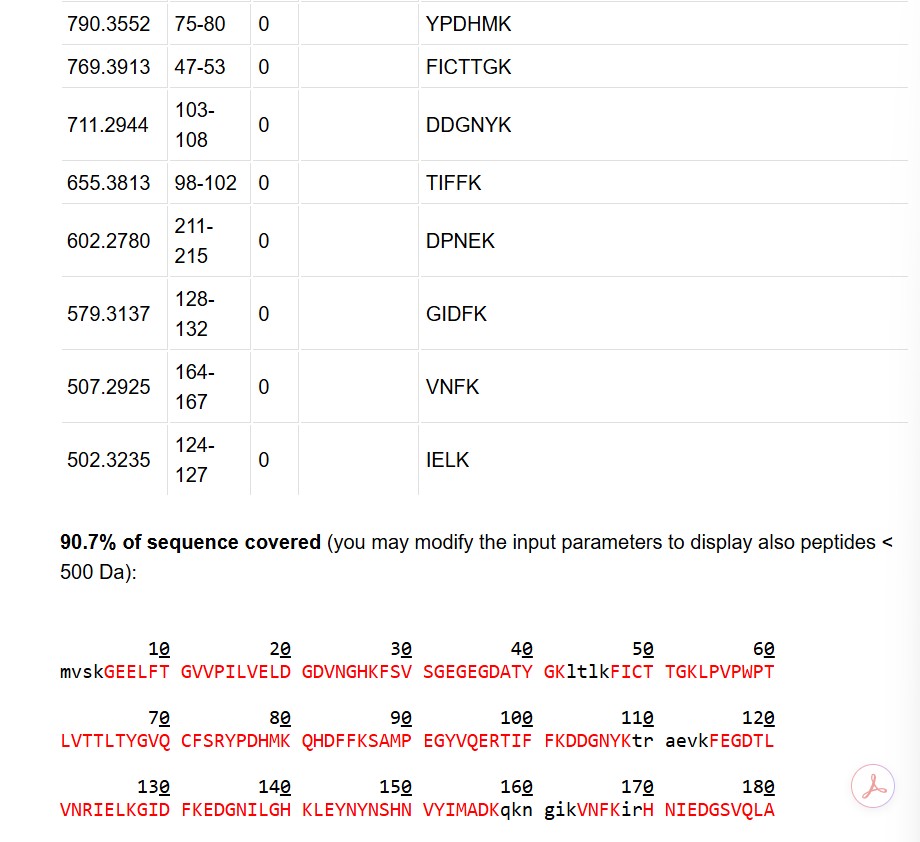
There are 21 labeled peaks, and one unlabeled peak in the chart between 0.5 seconds and 6 seconds.
Compared to the 19 rows for the peptide prediction, the 21 labeled peaks in the chart indicate that there is a slight discrepecy in the threshold between the two software. One observation is that it could down to the two double peaks within two of the larger peaks on the chart, which accounts for the difference of 2 between the rows and peaks. The double peaks could be referring to the same peptide, while each potential peptide in the table is unique.
• m/z(n) = peak 1 = 525.767
• m/z(n-1) = peak 2 = 526.259
delta between peaks = 0.492
z = 1/delta = 2+ charge