Week 10 HW: Advanced Imaging & Measurment Technology
Homework: Final Project
For my project, I want to measure the activity of the CotA laccase from Bacillus subtilis (whose gene is inserted into my pETite‑based plasmid) against PAH compounds using ABTS as a colour‑indicating substrate. I will measure the initial reaction rate of CotA, expressed as the change in absorbance over time, under different conditions, such as pH and temperature, to determine the enzyme’s optimal working range.
I would also like to measure the half‑life and stability of CotA in a paint‑like formula by embedding cultured CotA‑expressing cells in a water‑based gel or coating to then sample at regular intervals and quantify any residual activity through ABTS assays. Finally, I will record colour‑change metrics of the ABTS PAH‑surrogate solution over time, using percentage colour loss as a quantitative readout of degradative activity. This will help characterise the functional performance of the system in conditions relevant to a PAH‑degrading paint.
Considering PAH are not LBS1 safe, I will be using ABTS, a synthetic water‑soluble compound that laccases (like CotA) oxidise to a coloured radical as a PAH substitute. After mixing my pETite‑CotA plasmid with BL21(DE3) competent cells, performing heat shock and plating on LB kanamycin to grow a colony. I can then proceed to scaling up the culture to have enough E.coli to proceed with the following tests:
Reaction Rate of CotA Laccase - Change in absorbance over time:
1) Centrifuge the culture to pellet the cells and pipette away the surplus (LB and kanamycin) to obtain only the bacterial cells.2) Prepare the solution: dissolve ABTS in 100 mM potassium phosphate buffer (achieved by mixing Potassium phosphate monobasic and dibasic in water).
3) Centrifuge the culture to pellet the cells and pipette away the surplus (LB and kanamycin) to obtain only the bacterial cells.
4) From the obtained cells, I will then resuspend the pellet in a smaller volume of buffer to create a cell suspension.
5) I will then measure the ABTS assay of the cell suspensions of my prepared bacterial samples at different temperatures and pHs by using a 96-well plate reader or UV-Vis spectrophotometer, depending on lab availability.
6) I will measure the change in absorbance at 420nm over time during the ABTS oxidation assay.
7) I will calculate the initial rate as ∆A₄₂₀·min⁻¹, which serves as a quantitative measure of CotA activity under each condition.
8) Additionally, adding copper to the reaction will enhance the activity of CotA Laccase.
Colour‑change metrics of the ABTS PAH‑surrogate solution over time:Half‑life and stability of CotA‑expressing cells embedded in a paint‑like gel
References
For all three protocols, the core instrument is a UV‑Vis spectrophotometer (or a microplate reader with absorbance capabilities) to measure A₄₂₀ during ABTS‑based laccase assays. For the settings, I will set the wavelength at 420 nm (ABTS has the highest absorbance point). I will then create a ‘blank’ cuvette to calibrate it (buffer + ABTS with no CotA cells) and place it first in the spectrometer. Place each sample in a cuvette and place those in the spectrophotometer one by one. Calculation details are explained in the bullet point above.
Additionally, to relate to the lecture, my aim 3 for my project aims to develop a field‑ready bioremediation paint by evaluating CotA performance in a real‑world‑like coating matrix and validating its safety profile. Toxicity validation would focus on verifying that degradation yields safe byproducts rather than more hazardous compounds, a concern highlighted by recent studies showing that PAH transformation products could be toxic (Huizenga et al., 2025). In this context, mass spectrometry (e.g., LC‑MS/MS) would be used to identify and monitor the formation of degradation products (Nakken et al., 2025).
References
Homework: Waters Part I - Molecular Weight
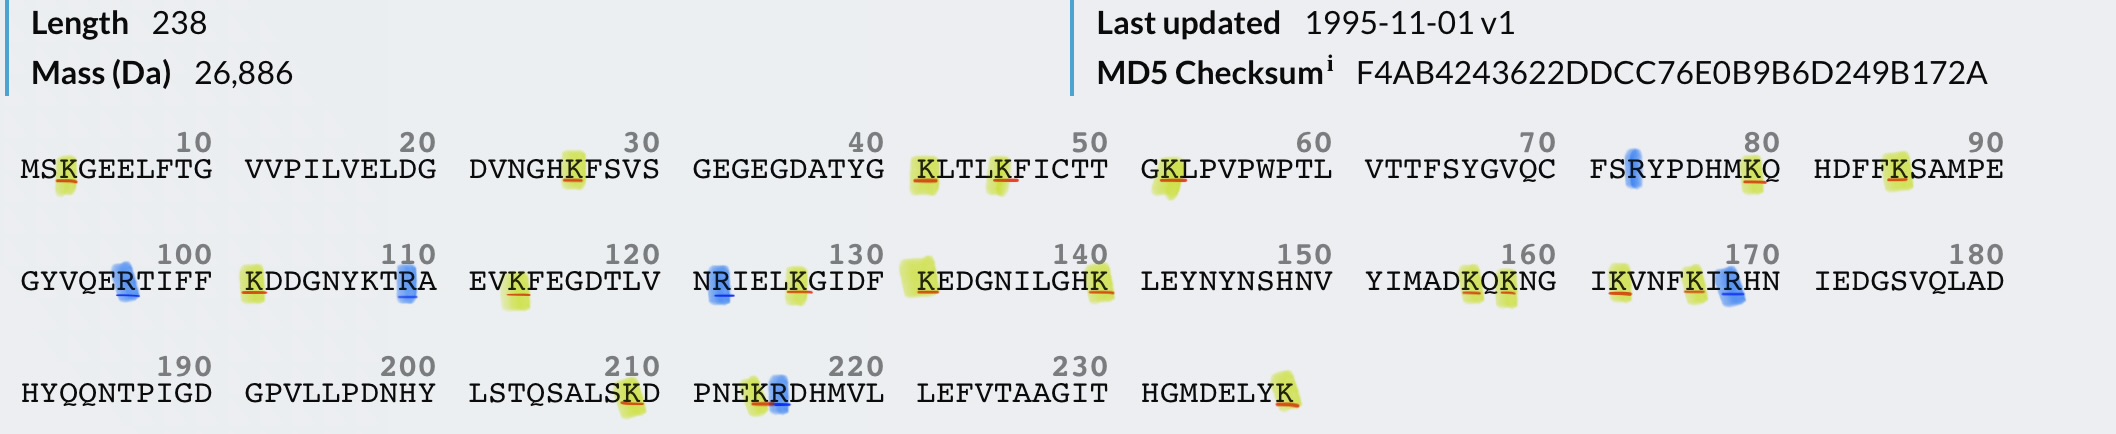
1. Based on the predicted amino acid sequence of eGFP (see below) and any known modifications, what is the calculated molecular weight? You can use an online calculator like the one at https://web.expasy.org/compute_pi/
Calculated molecular weight: 27,988.97 Da
2. Calculate the molecular weight of the eGFP using the adjacent charge state approach described in the recitation. Select two charge states from the intact LC-MS data (Figure 1)
- Determine for each adjacent pair of peaks (n, n +1) using:
I selected:
Z = 848.9758 / 875.4421 - 848.9758 = 848.9758/26.4663 = 32.077615 (+32)
- Determine the MW of protein using the relationship between m/Zⁿ, MW and z
Only one of the peaks is needed to calculate the molecular weight. Using the charge peak (m/zn), here is how I calculated the molecular weight:
Formula: z (m/z - 1.0073) Valu 1.0073 is the Proton mass.
Peak (m/zn): 32 x (875.4421- 1.0073) = 27.998 Da
- Calculate the accuracy of the measurement using the deconvoluted MW from 2.2 and the predicted weight of the protein:
- Can you observe the charge state for the zoomed-in peak in the mass spectrum for the intact eGFP? If yes, what is it? If no, why not?
No, the charge state of the zoomed-in peak cannot be observed directly because the protein is denatured and highly charged, so the isotopic peaks are too closely spaced to be resolved at the instrument’s resolution.
Homework: Waters Part II — Secondary/Tertiary structure
1. Based on learnings in the lab, please explain the difference between native and denatured protein conformations. For example, what happens when a protein unfolds? How is that determined with a mass spectrometer? What changes do you see in the mass spectrum between the native and denatured protein analyses (Figure 2)?
When a protein is denatured, it unfolds and exposes many basic amino acids. These exposed sites can easily gain protons, so the protein ends up with a high number of charges. This leads to many peaks at lower m/z values. In contrast, a protein in its native (folded) state hides many of these protonatable sites inside its structure. As a result, it gains fewer protons, has lower charge states, and produces peaks at higher m/z values. In Figure 2, the unfolded protein shows a wider distribution of peaks, while the folded protein shows fewer, more clustered peaks, reflecting its lower charge.
2. Zooming into the native mass spectrum of eGFP from the Waters Xevo G3 QTof MS (see Figure 3), can you discern the charge state of the peak at ~2800? What is the charge state? How can you tell?
Yes, the charge state is 10+. By zooming in on Figure 3, we can see the individual isotopic peaks are baseline-resolved, and the distance between adjacent isotopes is 0.1 m/z. Because the isotope spacing in a mass spectrum is given by 1/z, a spacing of 0.1 m/z corresponds to a charge of 10+
Homework: Waters Part III — Peptide Mapping - primary structure
1. How many Lysines (K) and Arginines (R) are in eGFP? Please circle or highlight them in the eGFP sequence given in Waters Part I question 1 above. (Note: adding the sequence to Benchling as an amino acid file and clicking biochemical properties tab will show you a count for each amino acid).
2. How many peptides will be generated from tryptic digestion of eGFP? - Navigate to https://web.expasy.org/peptide_mass/
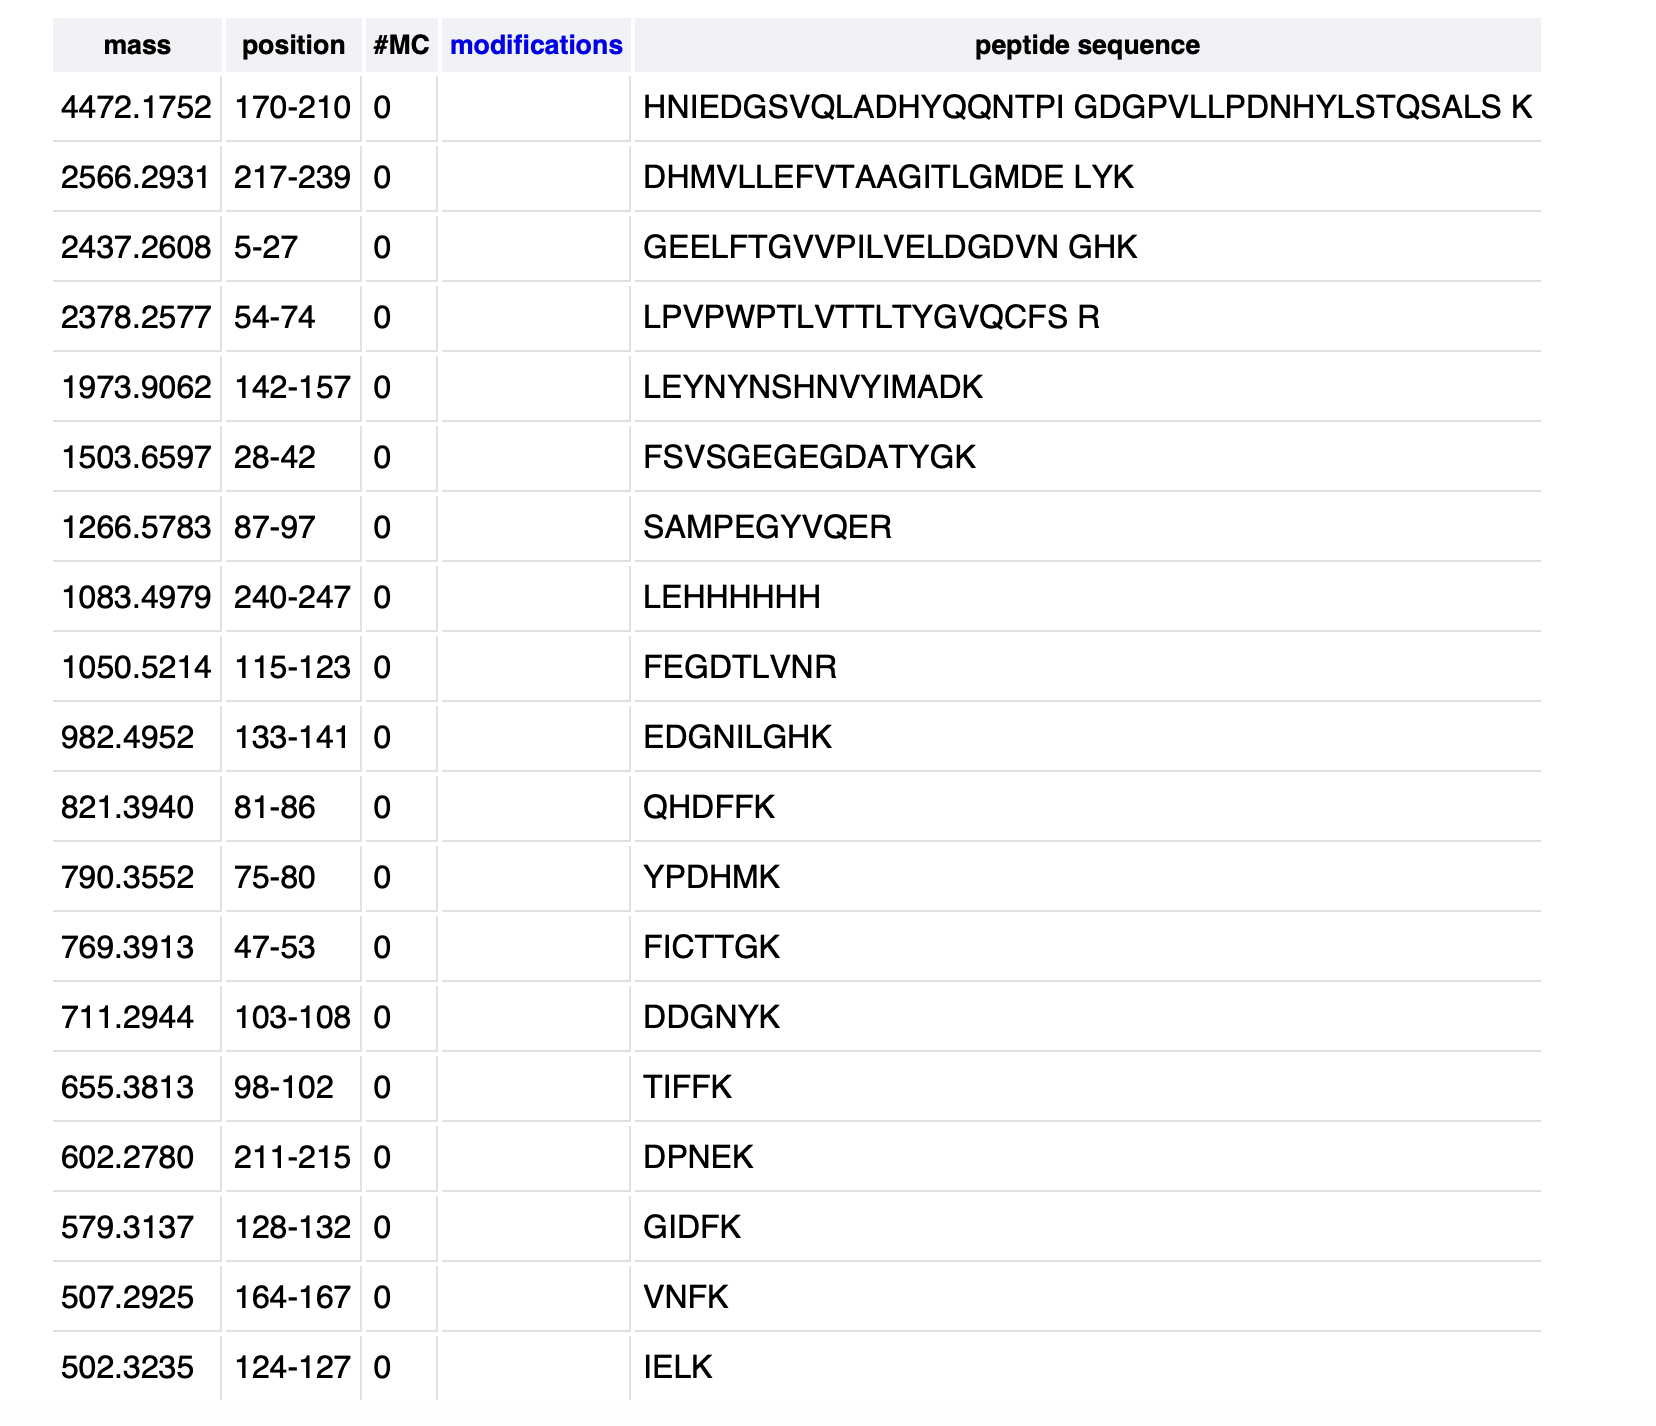
19 peptides were generated from the tryptic digestion of eGFP.
3. Based on the LC-MS data for the Peptide Map data generated in lab (please use Figure 5a as a reference) how many chromatographic peaks do you see in the eGFP peptide map between 0.5 and 6 minutes? You may count all peaks that are >10% relative abundance.
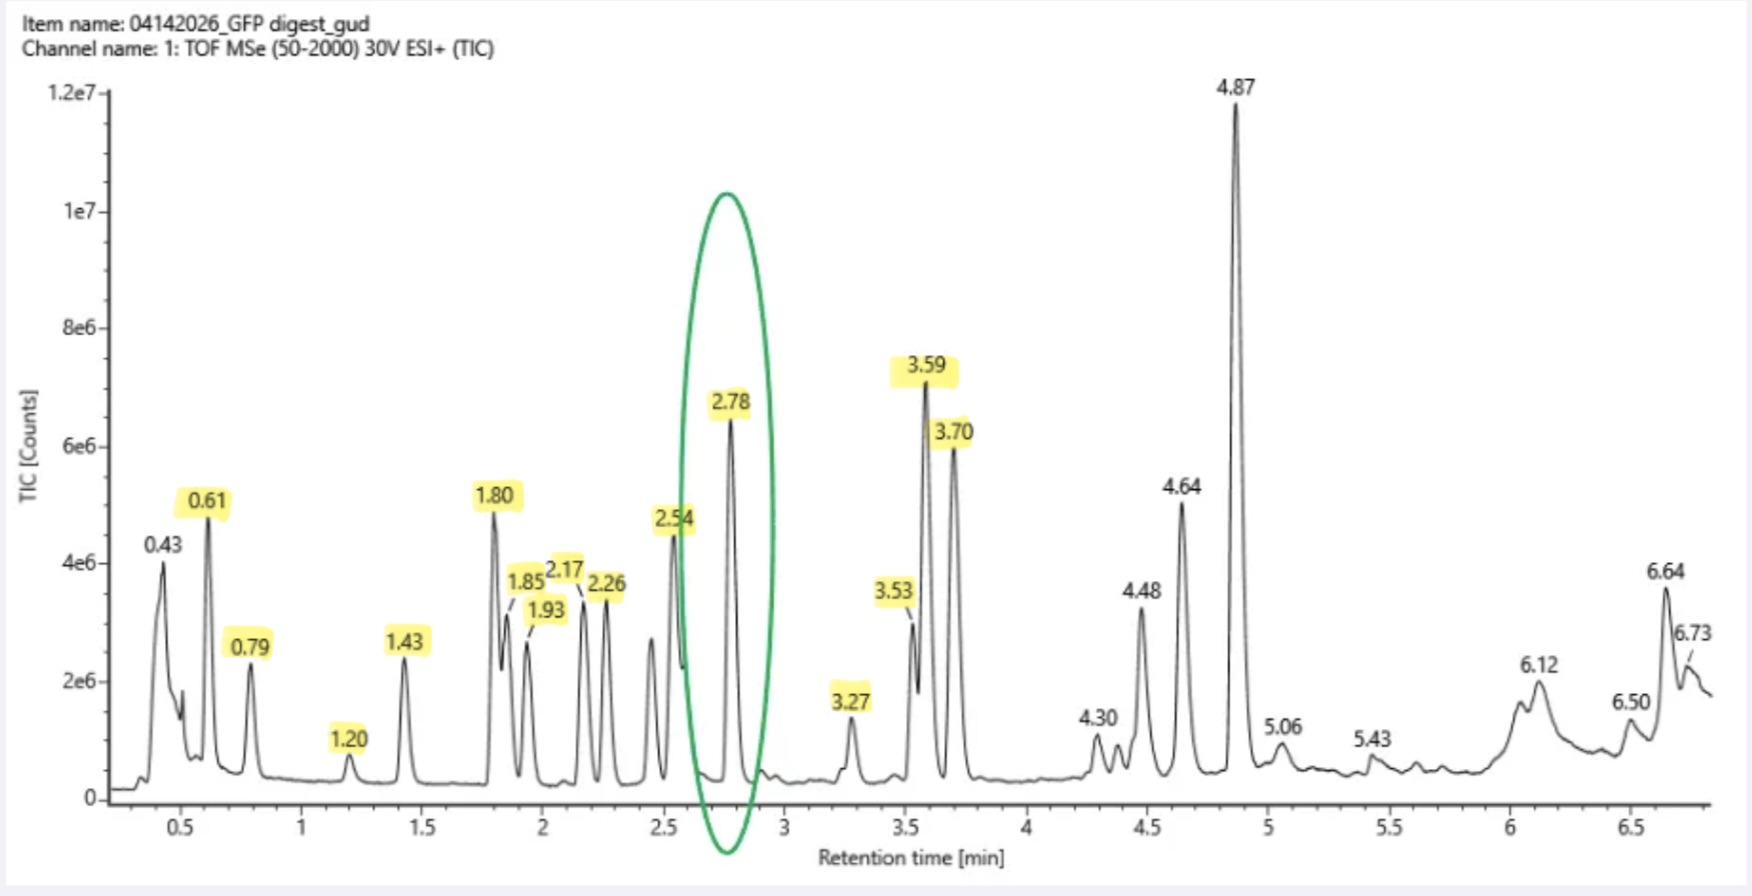
There are 15 chromatographic peaks that meet the >10% relative abundance.
4. Assuming all the peaks are peptides, does the number of peaks match the number of peptides predicted from question 2 above? Are there more peaks in the chromatogram or fewer?
I observed fewer peaks (4 less) than the number of peptides predicted.
5. Identify the mass-to-charge (m/z) of the peptide shown in Figure 5b. What is the charge (z) of the most abundant charge state of the peptide (use the separation of the isotopes to determine the charge state). Calculate the mass of the singly charged form of the peptide ( [M + H] + ) based on tissue m/z and z.
6. Identify the peptide based on comparison to expected masses in the PeptideMass tool. What is mass accuracy of measurement? Please calculate the error in ppm. (Recall that MWexperiment - MWtheory/ MWexperiment
This is highly accurate and does confirm the peptide identity.
7. What is the percentage of the sequence that is confirmed by peptide mapping?
In reference to Figure 6., 88% of the sequence is confirmed by the peptide mapping.
Homework: Waters Part IV — Oligomers
We will determine Keyhole Limpet Hemocyanin (KLH)’s oligomeric states using charge detection mass spectrometry (CDMS). CDMS single-particle measurements of KLH allow us to make direct mass measurements to determine what oligomeric states (that is, how many protein subunits combine) are present in solution. Using the known masses of the polypeptide subunits (Table 1) for KLH, identify where the following oligomeric species are on the spectrum shown below from the CDMS (Figure 7):
ANSWERS:
Homework: Waters Part V — Did I make GFP?
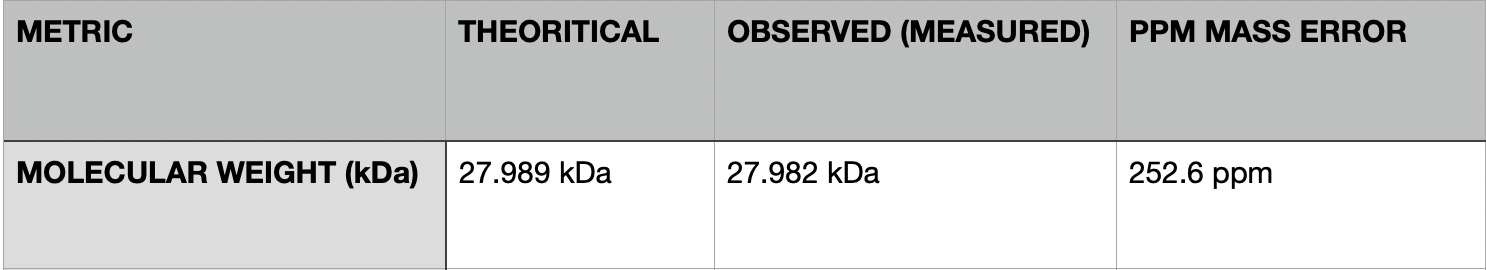
Please fill out this table with the data you acquired from the lab work done at the Waters Immerse Lab in Cambridge, or else the data screenshots in this document if you were unable to have lab work done at Waters.
This table is based on MIT Homework Review Session: