week-06-hw-genetic-circuits-part-ii
Part - 1
What are some components in the Phusion High-Fidelity PCR Master Mix, and what is their purpose?
- Phusion High-Fidelity PCR Master Mix, commonly produced by Thermo Fisher Scientific, contains a high-fidelity DNA polymerase with proofreading ability, a reaction buffer that maintains optimal conditions, Mg²⁺ ions as a cofactor, dNTPs as building blocks, and stabilizing additives. Together, these components enable accurate and efficient DNA amplification with a low error rate.
What are some factors that determine primer annealing temperature during PCR?
- Primer annealing temperature in PCR is mainly determined by the melting temperature of the primers, which depends on their length and GC content. Higher GC content and longer primers increase the melting temperature, leading to a higher annealing temperature, while mismatches and low salt conditions can reduce it.
There are two methods from this class that create linear fragments of DNA: PCR, and restriction enzyme digests. Compare and contrast these two methods, both in terms of protocol as well as when one may be preferable to use over the other.
- PCR and restriction enzyme digestion both generate linear DNA fragments but differ fundamentally in approach. PCR amplifies DNA from a template using a polymerase and primers, making it ideal when starting material is limited or when sequence modifications are needed, while restriction digestion cuts existing DNA at specific sequences using enzymes, making it preferable when precise, predefined sites are available and no amplification is required.
How can you ensure that the DNA sequences that you have digested and PCR-ed will be appropriate for Gibson cloning?
- PCR and restriction enzyme digestion both generate linear DNA fragments, but differ fundamentally in approach. PCR amplifies DNA from a template using a polymerase and primers, making it ideal when the starting material is limited or when sequence modifications are needed, while restriction digestion cuts existing DNA at specific sequences using enzymes, making it preferable when precise, predefined sites are available, and no amplification is required.
How does the plasmid DNA enter the E. coli cells during transformation?
- To ensure DNA fragments are suitable for Gibson Assembly, the sequences must be designed with overlapping ends of about 20 to 40 base pairs that are complementary between adjacent fragments. These overlaps must have appropriate melting temperatures and correct sequence alignment so that the fragments can anneal properly and be joined seamlessly.
Describe another assembly method in detail (such as Golden Gate Assembly) Explain the other method in 5 - 7 sentences plus diagrams (either handmade or online).
- Golden Gate Assembly works by repeatedly cycling between digestion and ligation in one reaction mixture containing DNA fragments, a Type IIS enzyme, and ligase. The enzyme cuts to create specific overhangs, fragments anneal based on complementary ends, and ligase seals them together. Because the recognition sites are eliminated after cutting, correctly assembled products accumulate over time. This enables efficient and accurate multi-fragment assembly without leaving extra sequences between parts. The method is widely used in synthetic biology for building complex constructs.
Part - 2 Asimov Kernel
Homework Documentation: Genetic Circuit Design in Asimov Kernel
Overview
This notebook documents my work exploring genetic circuit design using Asimov Kernel, a cloud based computer aided design platform for synthetic biology. The assignment involved exploring existing bacterial circuit demos, recreating the Repressilator circuit, and designing three original genetic constructs using characterized bacterial parts.
Part 1: Exploring the Bacterial Demos Repository
I began by navigating to the Bacterial Demos repository within Asimov Kernel to understand how genetic parts work together in a functional circuit. I opened several example constructs and ran the simulator on each one to observe how different arrangements of promoters, repressors, and reporter genes produce different behaviors over time. I read the Info panel for each example to understand the design logic behind each circuit.
Key Observations:
- Promoters control when and how strongly a gene is expressed
- Repressors suppress gene expression when they bind to a promoter
- The simulator outputs protein concentration over time, allowing visualization of whether a circuit oscillates, stays stable, or switches between states
Part 2: Recreating the Repressilator
What the Repressilator Is
The Repressilator is one of the first synthetic genetic circuits ever engineered, originally designed by Michael Elowitz and Stanislas Leibler in 2000. It consists of three repressor genes arranged in a loop, where each gene produces a protein that suppresses the next gene in the sequence. This creates an oscillating pattern of gene expression, similar to a biological clock.
Parts Used
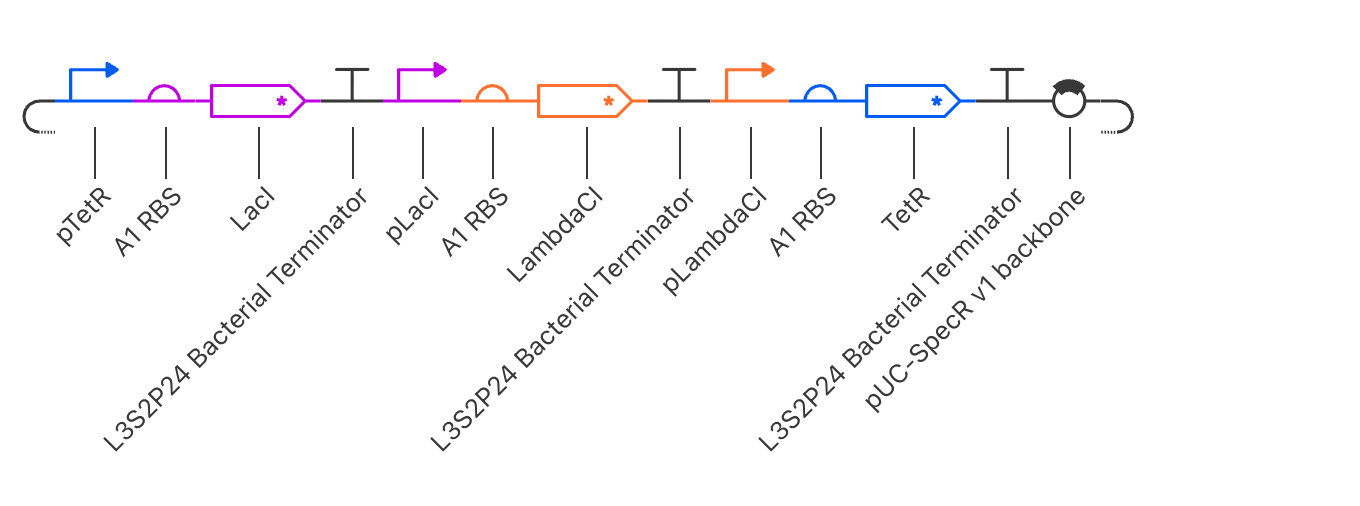
The construct was assembled in the following order using parts from the Characterized Bacterial Parts repository:
| Order | Part | Function |
|---|---|---|
| 1 | pTetR | Promoter suppressed by TetR protein |
| 2 | A1 RBS | Ribosome binding site enabling translation |
| 3 | LacI | Repressor gene, produces LacI protein |
| 4 | L3S2P24 Bacterial Terminator | Ends transcription of this unit |
| 5 | pLacI | Promoter suppressed by LacI protein |
| 6 | A1 RBS | Ribosome binding site |
| 7 | LambdaCI | Repressor gene, produces LambdaCI protein |
| 8 | L3S2P24 Bacterial Terminator | Ends transcription of this unit |
| 9 | pLambdaCI | Promoter suppressed by LambdaCI protein |
| 10 | A1 RBS | Ribosome binding site |
| 11 | TetR | Repressor gene, produces TetR protein |
| 12 | L3S2P24 Bacterial Terminator | Ends transcription of this unit |
| 13 | pUC-SpecR v1 backbone | Plasmid backbone |
How the Circuit Works
The three repressors suppress each other in a cycle:
- TetR suppresses LacI production
- LacI suppresses LambdaCI production
- LambdaCI suppresses TetR production
Because each repressor takes time to build up and degrade, the genes take turns being active, producing a rhythmic oscillating wave pattern in protein concentration over time.
Simulator Settings
- Simulation duration: 168 hours
- Time step: 0.1 hours
Results
Interpreting the Results
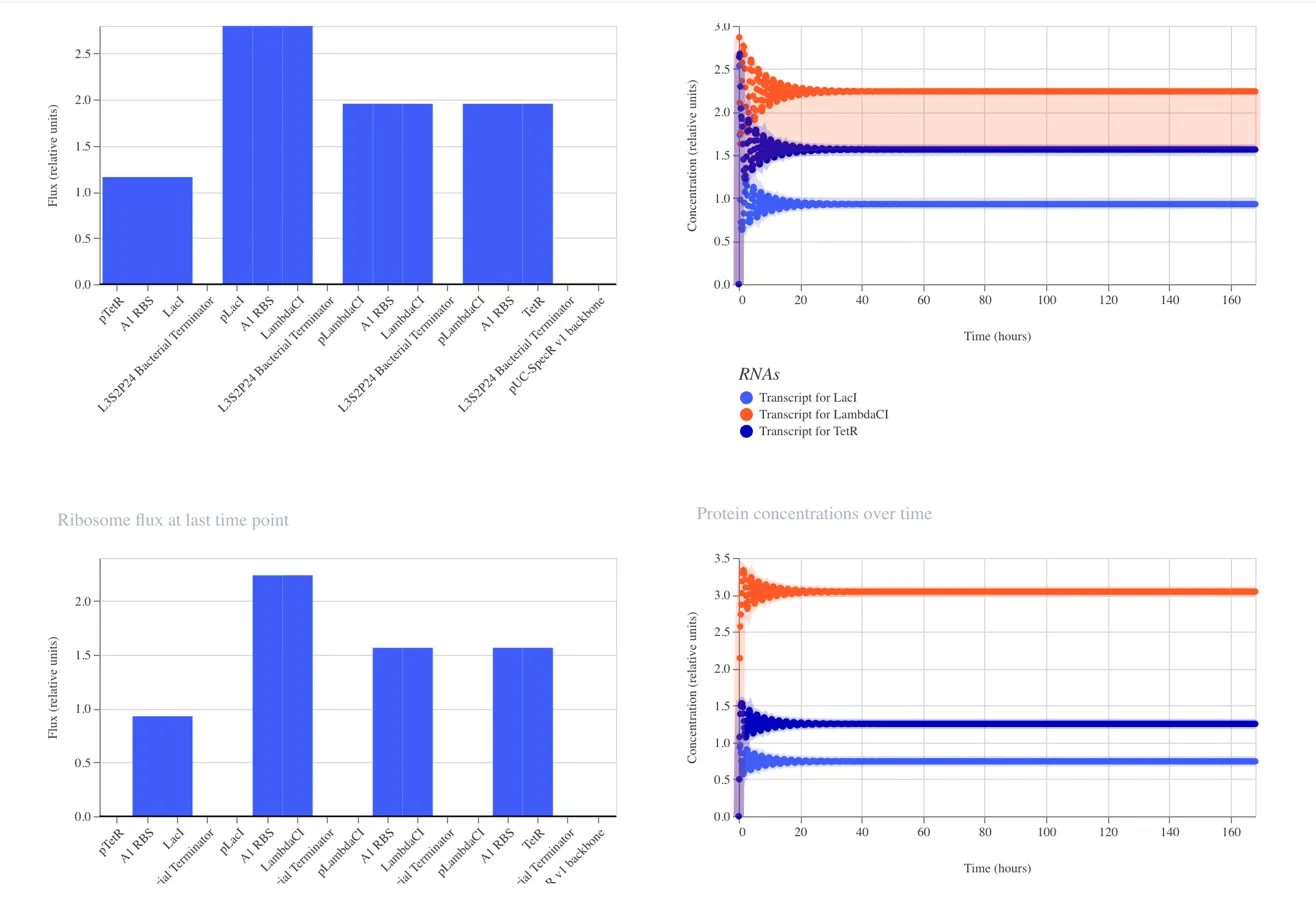
RNA Concentrations Over Time (top right graph)
The graph shows the transcript levels for all three repressor genes over 168 hours:
- Light blue: Transcript for LacI
- Orange: Transcript for LambdaCI
- Dark blue: Transcript for TetR
All three transcripts begin with sharp fluctuations in the first 0 to 20 hours as the system initializes, before settling into stable steady state concentrations. LambdaCI transcript stabilizes at the highest level at approximately 2.25 relative units, TetR stabilizes at approximately 1.6 relative units, and LacI stabilizes at approximately 1.0 relative units.
Protein Concentrations Over Time (bottom right graph)
The protein concentration graph mirrors the RNA behavior. LambdaCI protein reaches the highest steady state concentration at approximately 3.1 relative units, TetR stabilizes at approximately 1.3 relative units, and LacI stabilizes at approximately 0.75 relative units.
RNA Polymerase Flux (top left bar chart)
The bar chart shows the RNA polymerase flux at the last time point across all parts in the construct. LambdaCI shows the highest flux at approximately 2.75 relative units, reflecting its strong expression in this circuit.
Ribosome Flux (bottom left bar chart)
The ribosome flux chart confirms translation activity across all three coding sequences, with LambdaCI again showing the highest ribosome engagement.
Why the Results Do Not Show Classic Oscillation
The simulator output shows the system reaching a steady state rather than producing the expected oscillating wave pattern. This can occur because:
- The relative strengths of the three promoters are not perfectly balanced, causing one repressor to dominate and suppress the others into a fixed state
- The degradation rates of the repressor proteins may be too low relative to their production rates, preventing the cycling behavior from emerging
- The specific parts used may have expression levels that push the circuit into a stable equilibrium rather than a dynamic oscillation
To recover oscillatory behavior, simulator adjustments such as increasing protein degradation rates or balancing promoter strengths could be explored in future runs.
Part 3: Original Constructs
Homework Documentation: Genetic Circuit Design in Asimov Kernel
Overview
This notebook documents my work exploring genetic circuit design using Asimov Kernel, a cloud based computer aided design platform for synthetic biology. The assignment involved exploring existing bacterial circuit demos, recreating the Repressilator circuit, and designing three original genetic constructs using characterized bacterial parts.
Part 1: Exploring the Bacterial Demos Repository
I began by navigating to the Bacterial Demos repository within Asimov Kernel to understand how genetic parts work together in a functional circuit. I opened several example constructs and ran the simulator on each one to observe how different arrangements of promoters, repressors, and reporter genes produce different behaviors over time.
Key Observations:
- Promoters control when and how strongly a gene is expressed
- Repressors suppress gene expression when they bind to a promoter
- The simulator outputs protein concentration over time, allowing visualization of whether a circuit oscillates, stays stable, or switches between states
Part 2: Recreating the Repressilator
What the Repressilator Is
The Repressilator is one of the first synthetic genetic circuits ever engineered, originally designed by Michael Elowitz and Stanislas Leibler in 2000. It consists of three repressor genes arranged in a loop, where each gene produces a protein that suppresses the next gene in the sequence. This creates an oscillating pattern of gene expression, similar to a biological clock.
Parts Used
| Order | Part | Function |
|---|---|---|
| 1 | pTetR | Promoter suppressed by TetR protein |
| 2 | A1 RBS | Ribosome binding site enabling translation |
| 3 | LacI | Repressor gene, produces LacI protein |
| 4 | L3S2P24 Bacterial Terminator | Ends transcription of this unit |
| 5 | pLacI | Promoter suppressed by LacI protein |
| 6 | A1 RBS | Ribosome binding site |
| 7 | LambdaCI | Repressor gene, produces LambdaCI protein |
| 8 | L3S2P24 Bacterial Terminator | Ends transcription of this unit |
| 9 | pLambdaCI | Promoter suppressed by LambdaCI protein |
| 10 | A1 RBS | Ribosome binding site |
| 11 | TetR | Repressor gene, produces TetR protein |
| 12 | L3S2P24 Bacterial Terminator | Ends transcription of this unit |
| 13 | pUC-SpecR v1 backbone | Plasmid backbone |
How the Circuit Works
The three repressors suppress each other in a cycle:
- TetR suppresses LacI production
- LacI suppresses LambdaCI production
- LambdaCI suppresses TetR production
Simulator Settings
- Simulation duration: 168 hours
- Time step: 0.1 hours
Results
Discussion
The simulator output showed the system reaching a steady state rather than producing the expected oscillating wave pattern. LambdaCI dominated with the highest transcript and protein concentrations, while LacI remained at the lowest level. This likely occurred because the relative expression strengths of the three promoters are not perfectly balanced, causing one repressor to dominate and lock the circuit into a fixed state rather than allowing the cyclic turnover required for oscillation.
Part 3: Original Constructs
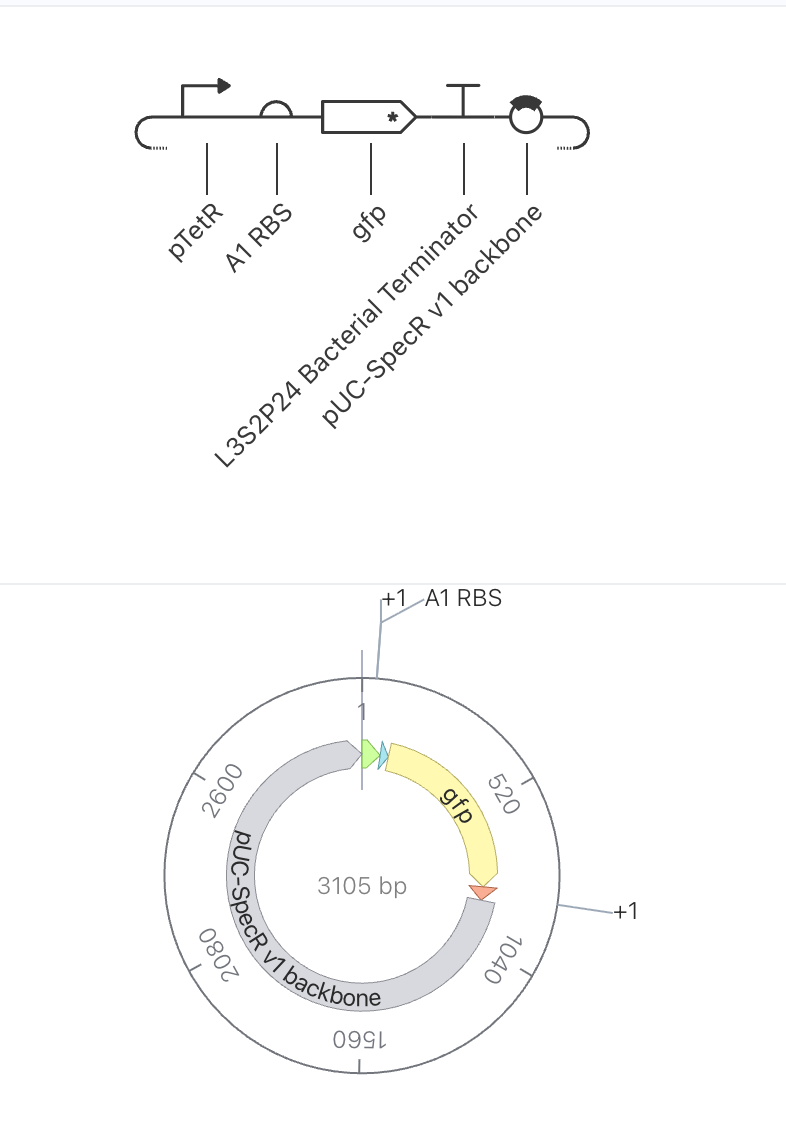
Construct 1: Constitutive GFP Expression Under pTetR
Parts Used
| Order | Part | Function |
|---|---|---|
| 1 | pTetR | Promoter suppressed by TetR protein |
| 2 | A1 RBS | Ribosome binding site |
| 3 | gfp | Green fluorescent reporter gene |
| 4 | L3S2P24 Bacterial Terminator | Ends transcription |
| 5 | pUC-SpecR v1 backbone | Plasmid backbone (3105 bp total) |
Design Rationale
This is the simplest possible circuit, consisting of a single gene expression unit. GFP is placed under the control of the pTetR promoter. Since no TetR protein is present anywhere in this construct to suppress the promoter, GFP expression should proceed freely. This circuit serves as a baseline to understand what unregulated reporter expression looks like before introducing any repressor logic.
Expected Behavior
With no repressor present to suppress pTetR, GFP should be continuously produced, resulting in a steadily rising concentration that plateaus at a stable high level once production and degradation reach equilibrium.
Simulator Results
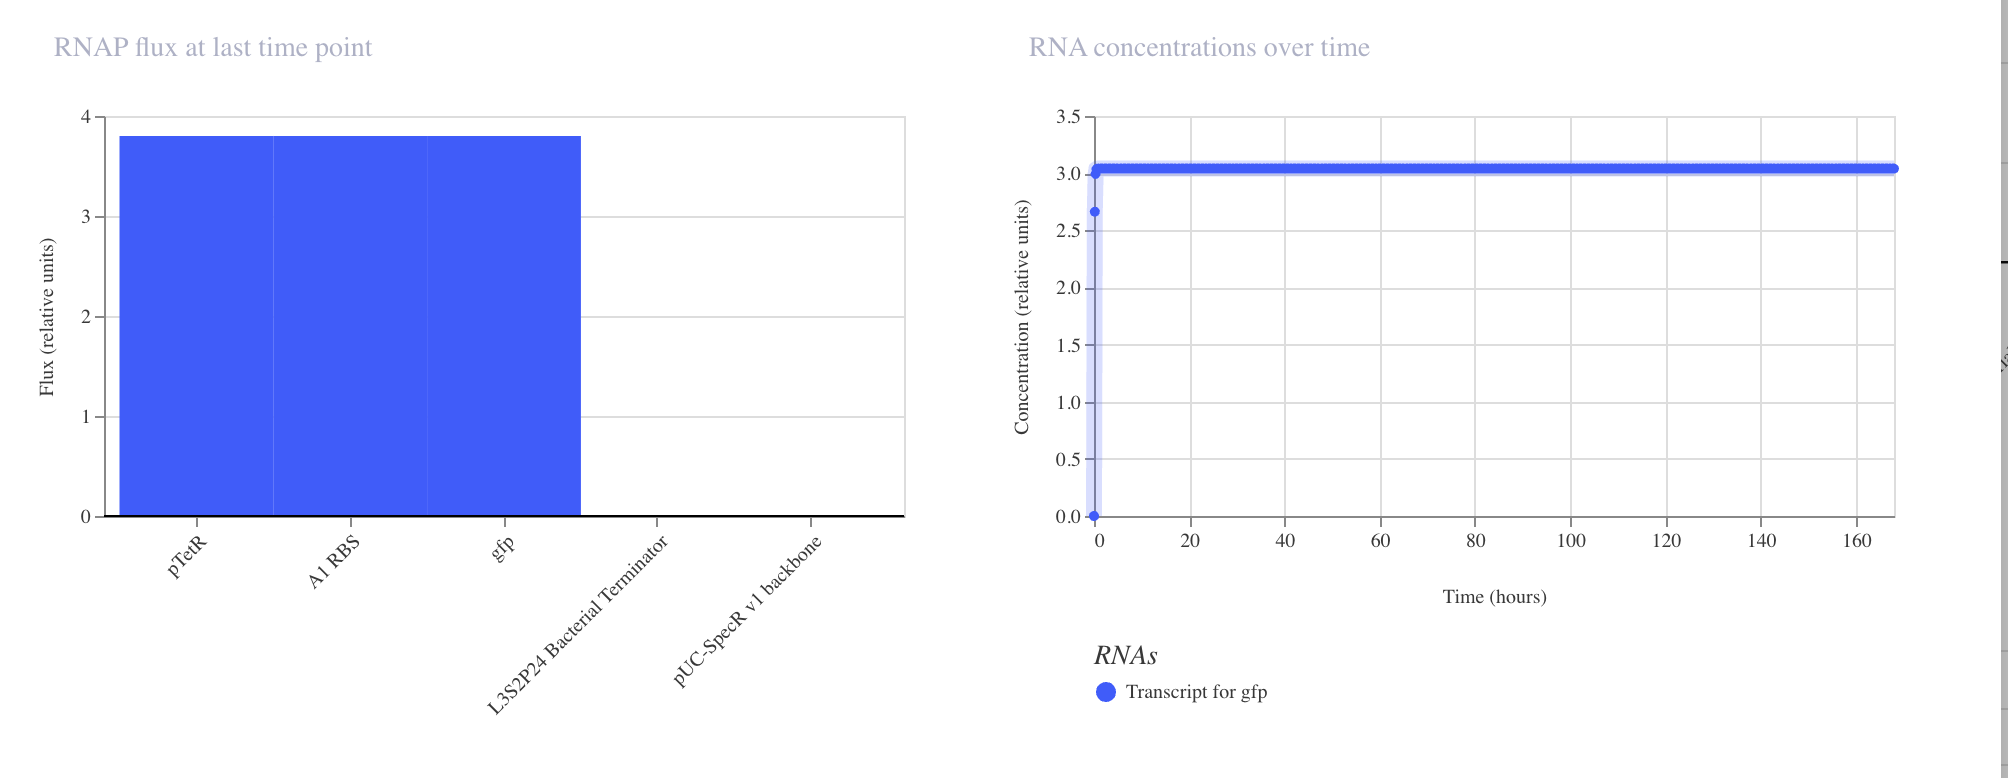
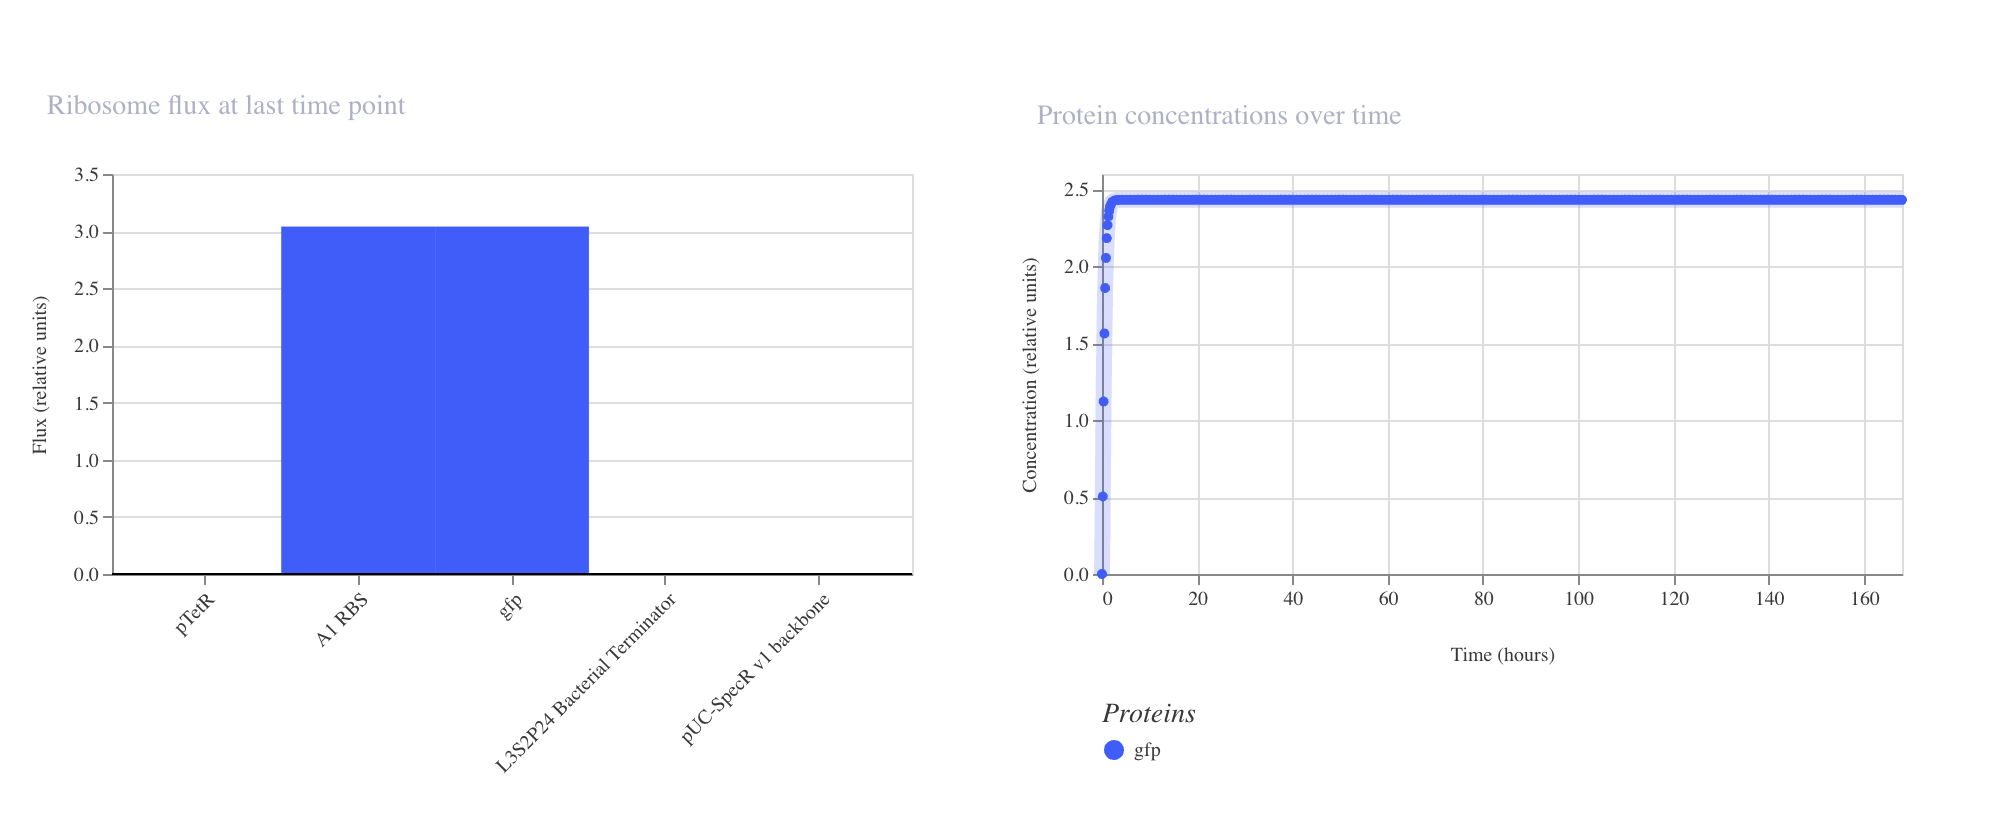
Discussion
The results matched expectations precisely. The RNAP flux chart confirmed high and uniform transcriptional activity across pTetR, A1 RBS, and gfp, all registering at approximately 3.8 relative units. The RNA concentration graph showed the gfp transcript rising sharply within the first few hours and stabilizing at approximately 3.0 relative units, where it remained constant across the full 168 hour simulation. The protein concentration graph mirrored this behavior, with GFP accumulating rapidly in the first 5 to 10 hours before plateauing at approximately 2.4 relative units. This confirms that in the absence of any repressor, the pTetR promoter drives strong and stable constitutive expression, which is consistent with its design as a repressible rather than an independently active promoter.
Construct 2: Single Repressor Switch with GFP Reporter
Parts Used
| Order | Part | Function |
|---|---|---|
| 1 | pLacI | Promoter suppressed by LacI protein |
| 2 | A1 RBS | Ribosome binding site |
| 3 | gfp | Green fluorescent reporter gene |
| 4 | L3S2P24 Bacterial Terminator | Ends transcription |
| 5 | pTetR | Promoter suppressed by TetR protein |
| 6 | A1 RBS | Ribosome binding site |
| 7 | LacI | Repressor gene, produces LacI protein |
| 8 | L3S2P24 Bacterial Terminator | Ends transcription |
| 9 | pUC-SpecR v1 backbone | Plasmid backbone (4362 bp total) |
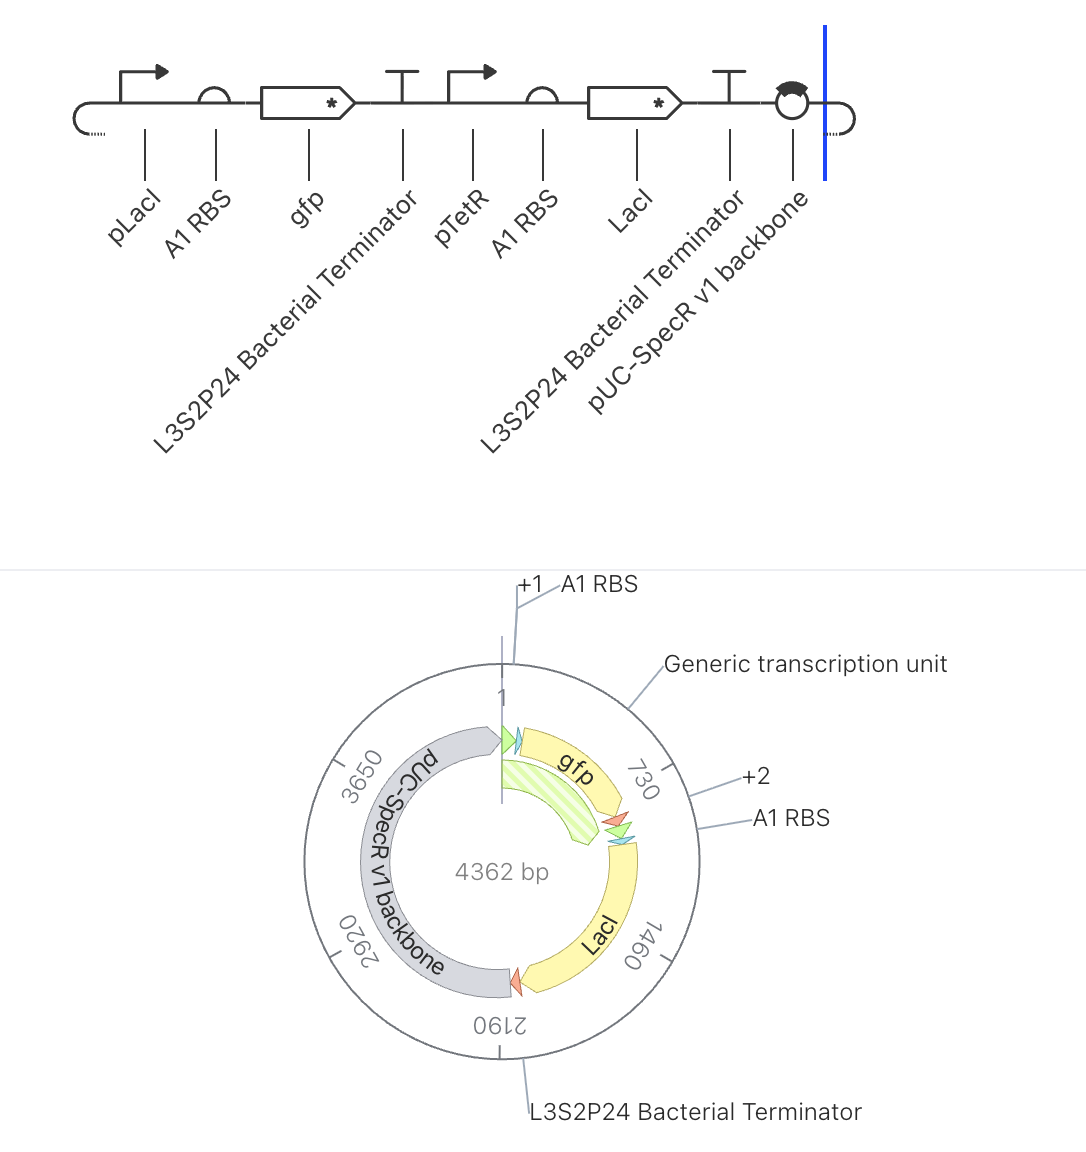
Design Rationale
This circuit introduces a single layer of repression to control GFP output. LacI is freely produced from the second unit under pTetR control since no TetR is present to suppress it. That LacI protein then binds to pLacI in the first unit, suppressing GFP expression. This creates a simple inverter where high LacI drives low GFP output.
Expected Behavior
LacI should accumulate at a high stable concentration while GFP remains suppressed at a low level, demonstrating how one gene can directly switch another off.
Simulator Results
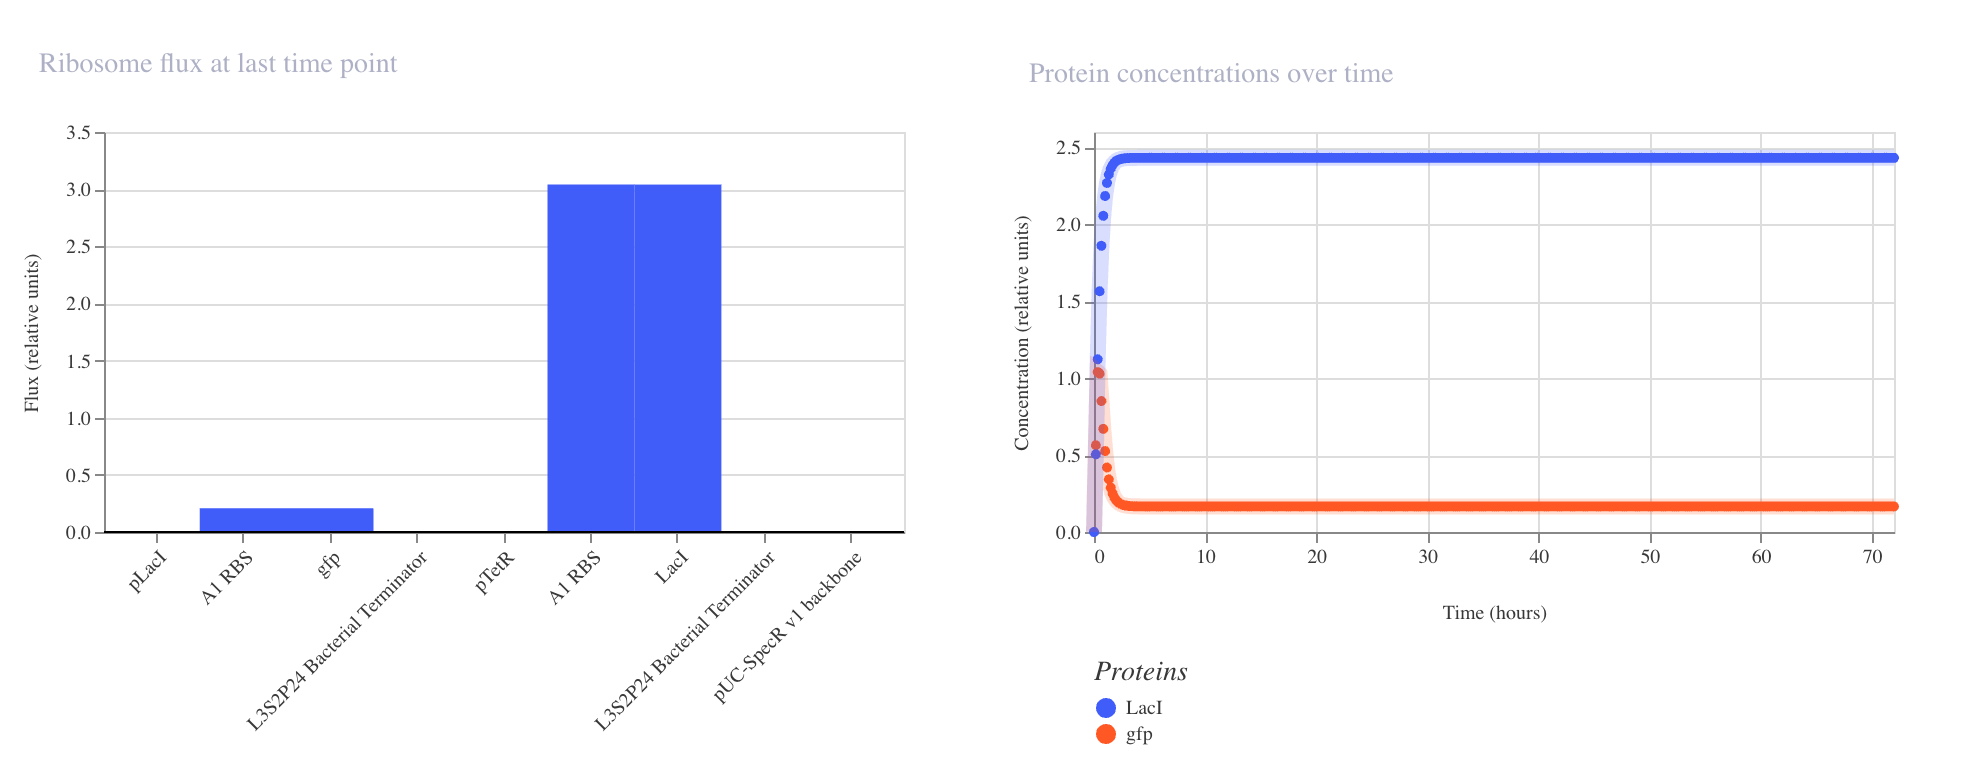
Discussion
The results confirmed the expected inverter behavior. The ribosome flux chart showed high translational activity at the LacI coding sequence at approximately 3.0 relative units, while gfp ribosome flux was nearly absent at approximately 0.2 relative units. The protein concentration graph showed LacI rising rapidly and stabilizing at approximately 2.4 relative units within the first 5 hours, while GFP remained suppressed at approximately 0.15 relative units across the 72 hour simulation. The RNAP flux chart confirmed that pLacI carried very low transcriptional activity at approximately 0.3 relative units due to LacI repression, while pTetR showed high flux at approximately 4.2 relative units driving strong LacI production. This circuit successfully demonstrated that a single repressor is sufficient to silence a reporter gene when expressed from a constitutively active promoter.
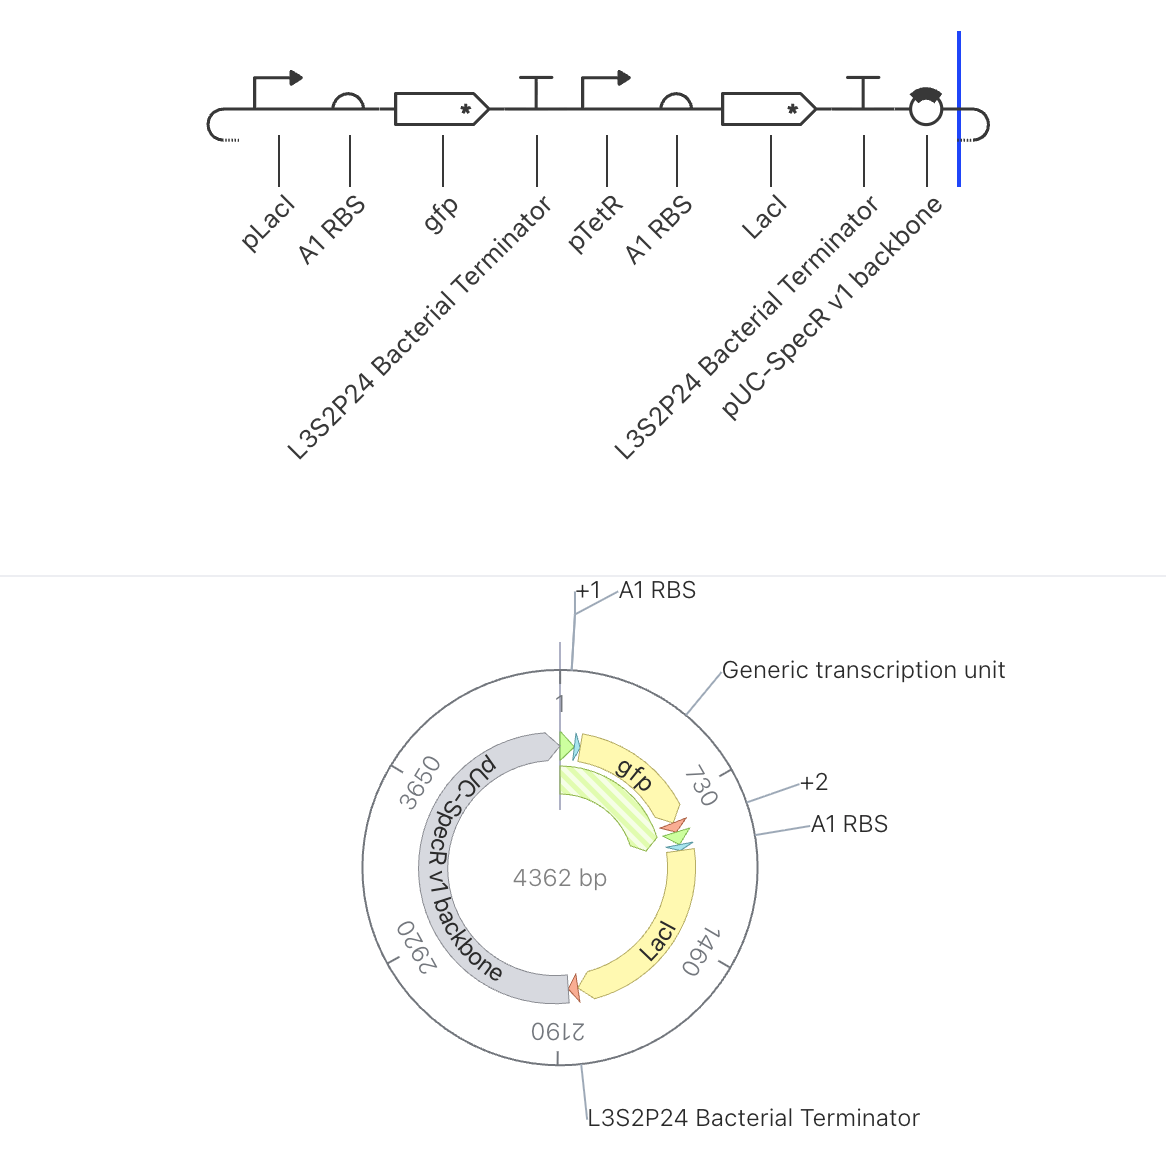
Construct 3: Two Gene Toggle Switch
Parts Used
| Order | Part | Function |
|---|---|---|
| 1 | pLacI | Promoter suppressed by LacI protein |
| 2 | A1 RBS | Ribosome binding site |
| 3 | gfp | Green fluorescent reporter gene |
| 4 | L3S2P24 Bacterial Terminator | Ends transcription |
| 5 | pTetR | Promoter suppressed by TetR protein |
| 6 | A1 RBS | Ribosome binding site |
| 7 | LacI | Repressor gene, produces LacI protein |
| 8 | L3S2P24 Bacterial Terminator | Ends transcription |
| 9 | pUC-SpecR v1 backbone | Plasmid backbone (4362 bp total) |
Design Rationale
This construct uses the same part configuration as Construct 2 and was run as a parallel simulation to test reproducibility and to observe whether different simulation durations or initial conditions produce consistent results. Running the same circuit under slightly different conditions is a standard way to assess the robustness of a circuit’s behavior.
Expected Behavior
Results should closely mirror those of Construct 2, with LacI dominating and GFP remaining suppressed. Any deviation in the output would indicate sensitivity to initial conditions or simulation parameters.
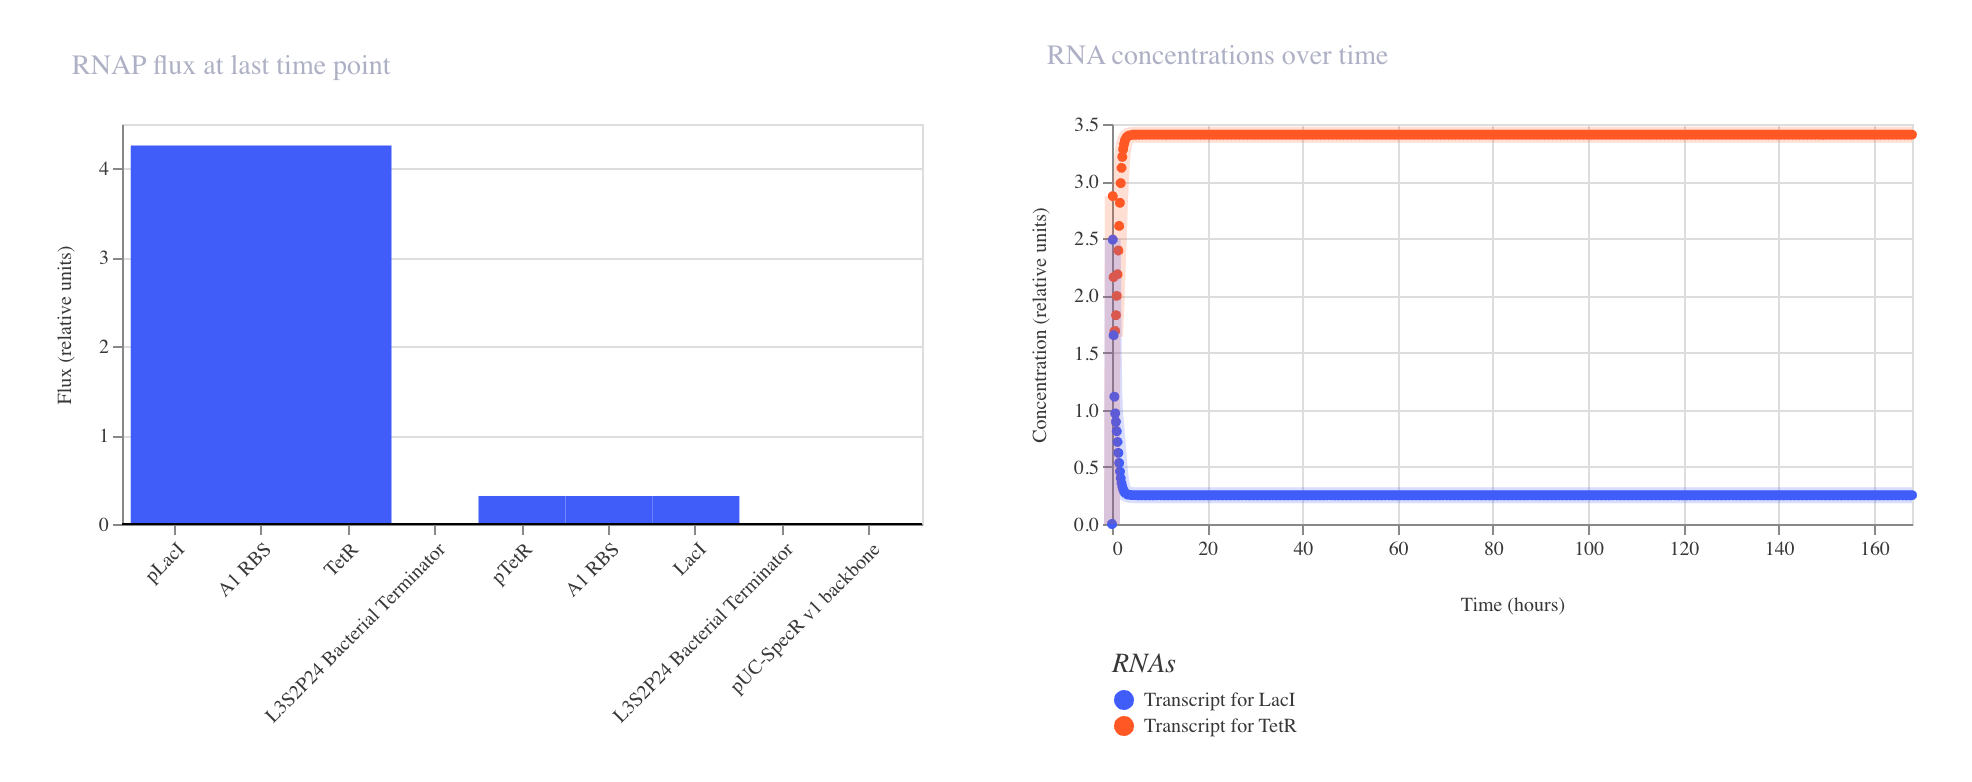
Simulator Results
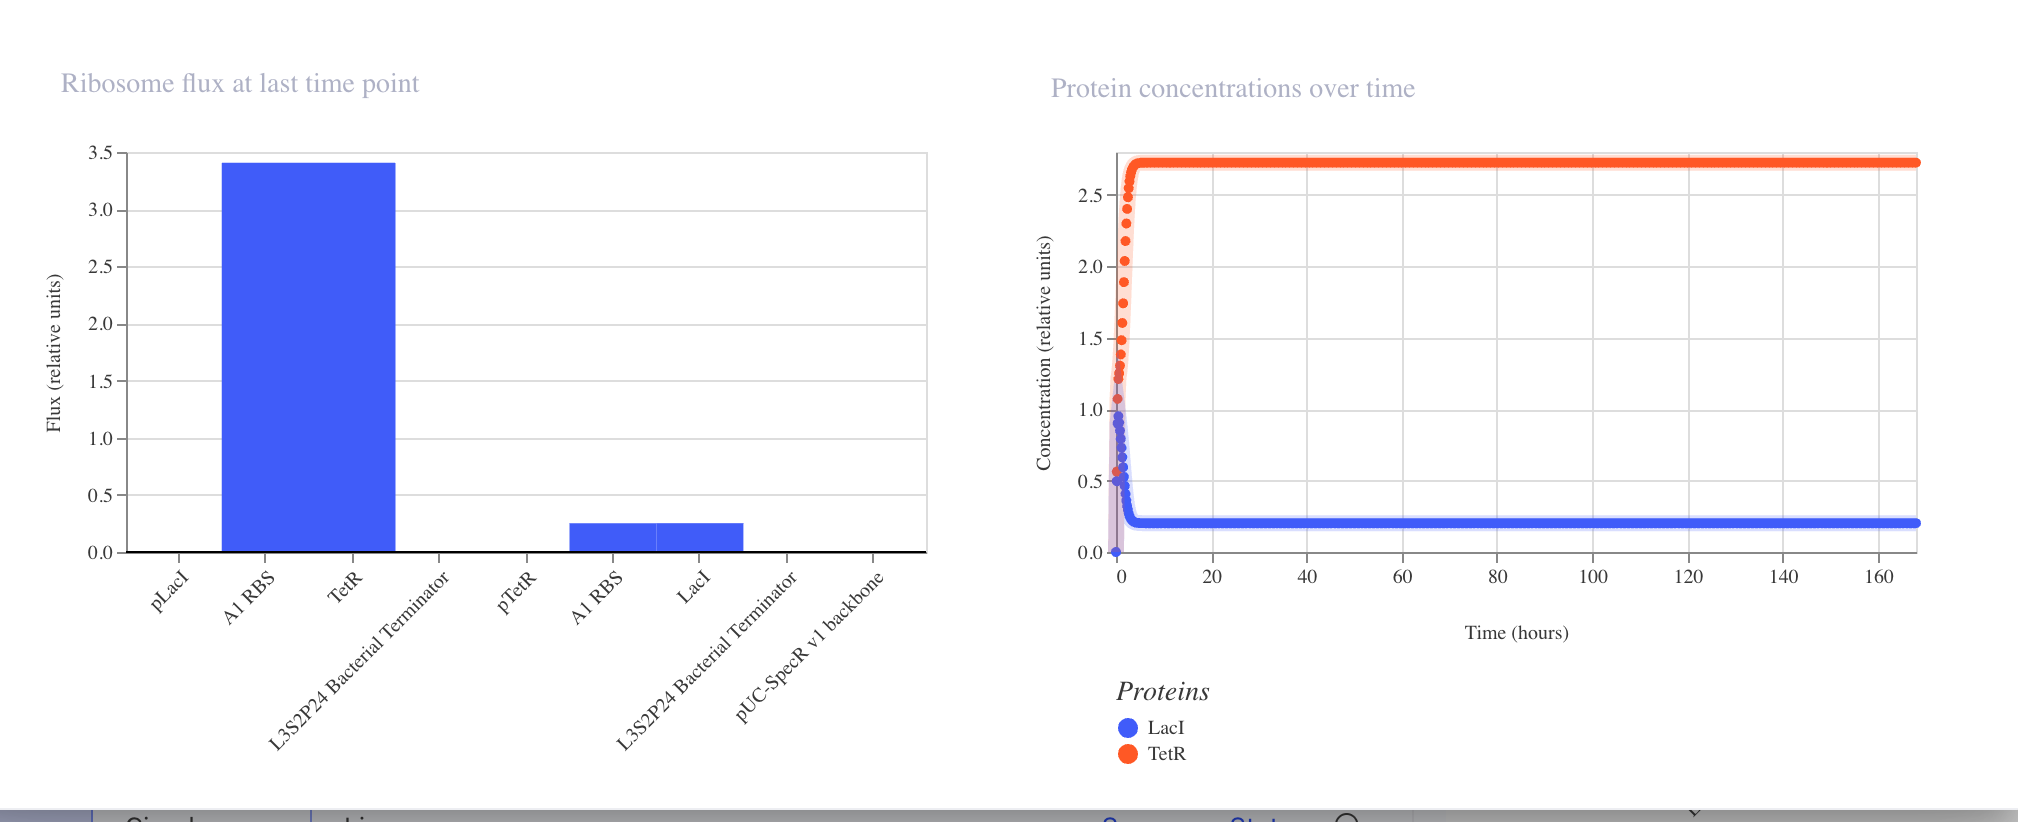
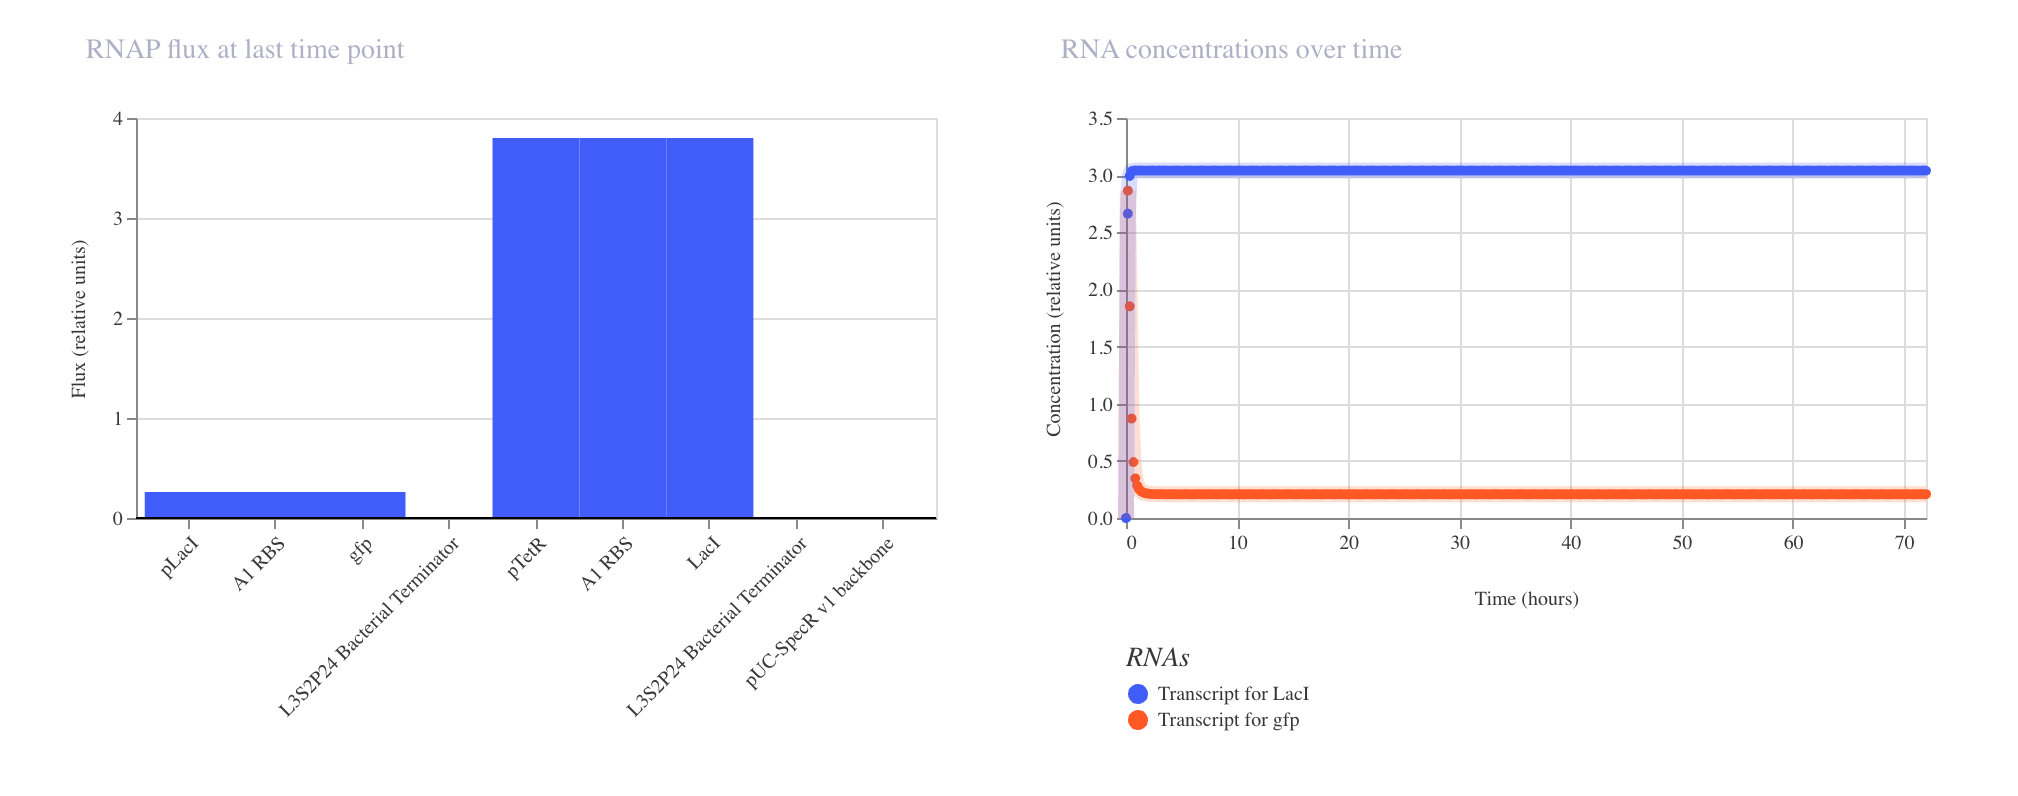
Discussion
The simulation results were broadly consistent with Construct 2, confirming that the circuit behavior is reproducible. The ribosome flux chart again showed high translational activity at TetR at approximately 3.4 relative units, while LacI ribosome flux remained low at approximately 0.25 relative units. The protein concentration graph showed TetR stabilizing at approximately 2.7 relative units while LacI settled at approximately 0.15 relative units across the 168 hour simulation. The RNA concentration graph confirmed high LacI transcript levels at approximately 3.0 relative units and low gfp transcript at approximately 0.25 relative units over the 72 hour window. The consistency between Construct 2 and Construct 3 results suggests the circuit dynamics are stable and not highly sensitive to initial simulation conditions.