My name is Kaleab Berhanu, and I am a senior student double-majoring in Life
Science and Biomedical Engineering at Hanyang University. My academic journey
has taken me across the intersection of biology, engineering, and computation,
and I am deeply motivated by the question of how biological systems can be
understood, redesigned, and deployed to solve real-world problems in medicine
and human health.
Research Experience
My research background began at the Neural Intelligence and Systems Laboratory
at Hanyang University, where I worked as a research intern investigating the
role of EPG neurons in the visual reflex behavior of Drosophila melanogaster.
Using the UAS-GAL4 system to genetically manipulate specific neuronal
populations, I maintained genetic lines through controlled inbreeding and
analyzed behavioral and neural datasets using MATLAB. This experience gave me
a deep appreciation for how much remains unknown about the nervous system, and
how rigorous experimental design and patient analysis are the foundation of
meaningful scientific discovery.
HTGAA 2026
This spring, I participated in How to Grow Almost Anything (HTGAA) 2026,
MIT Media Lab’s intensive synthetic biology program, with weekly lab sessions
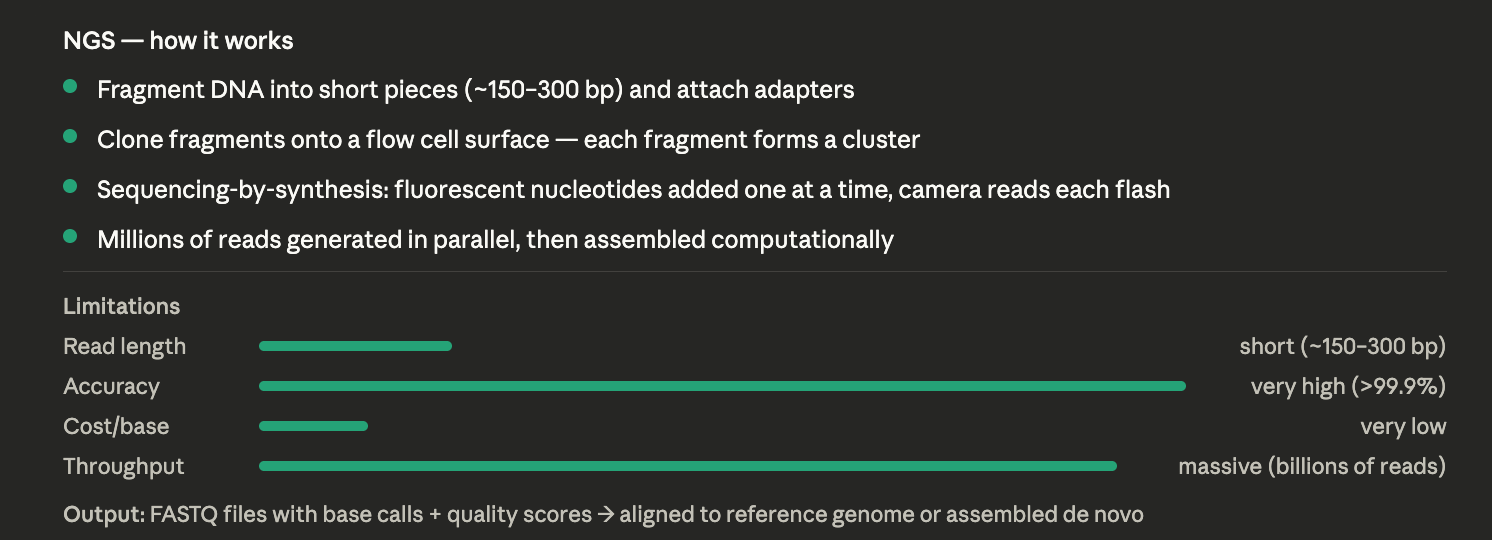
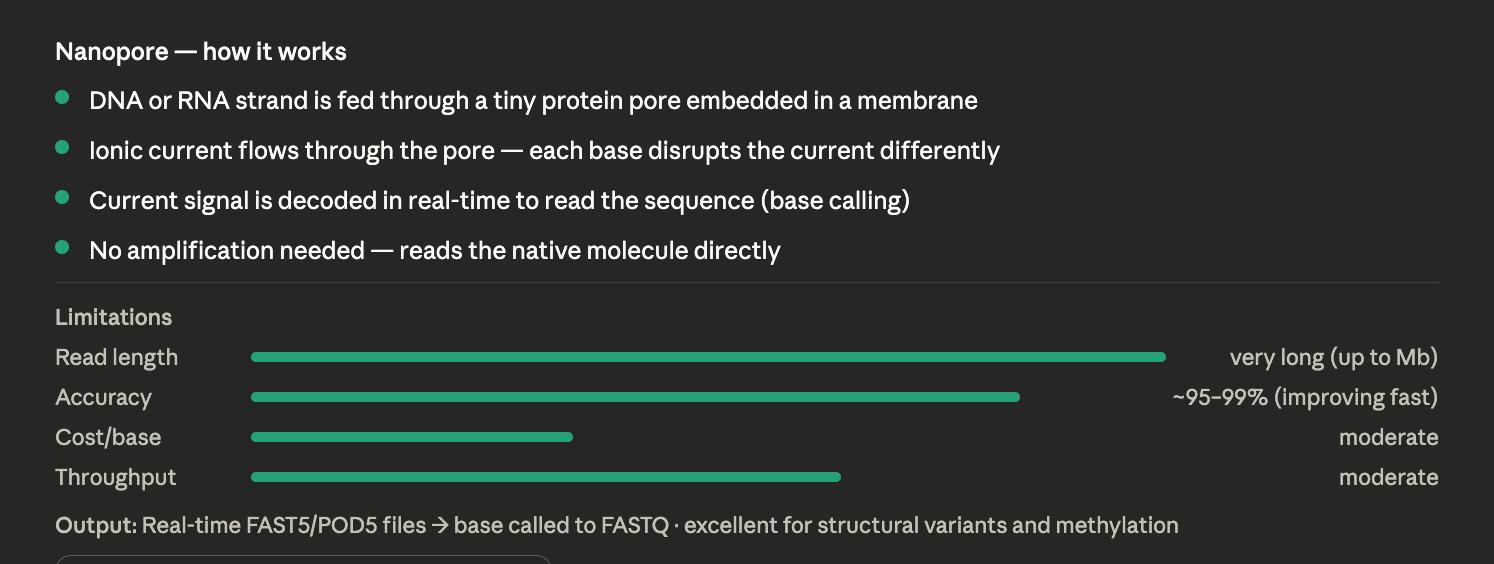
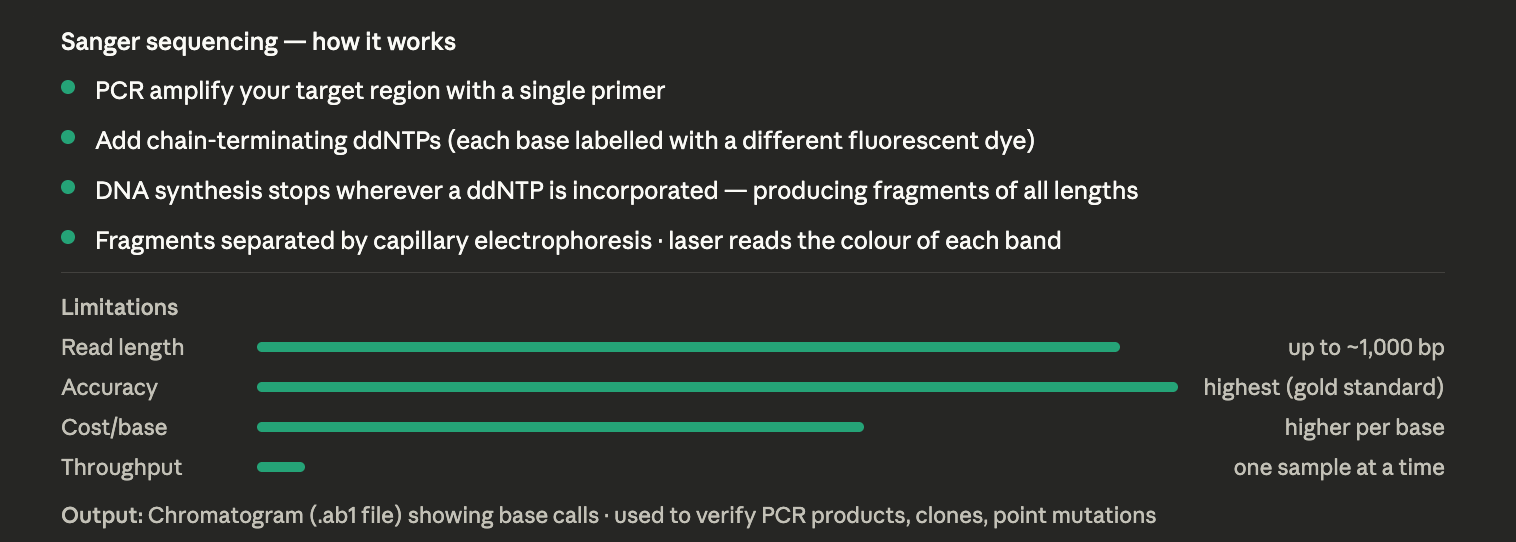
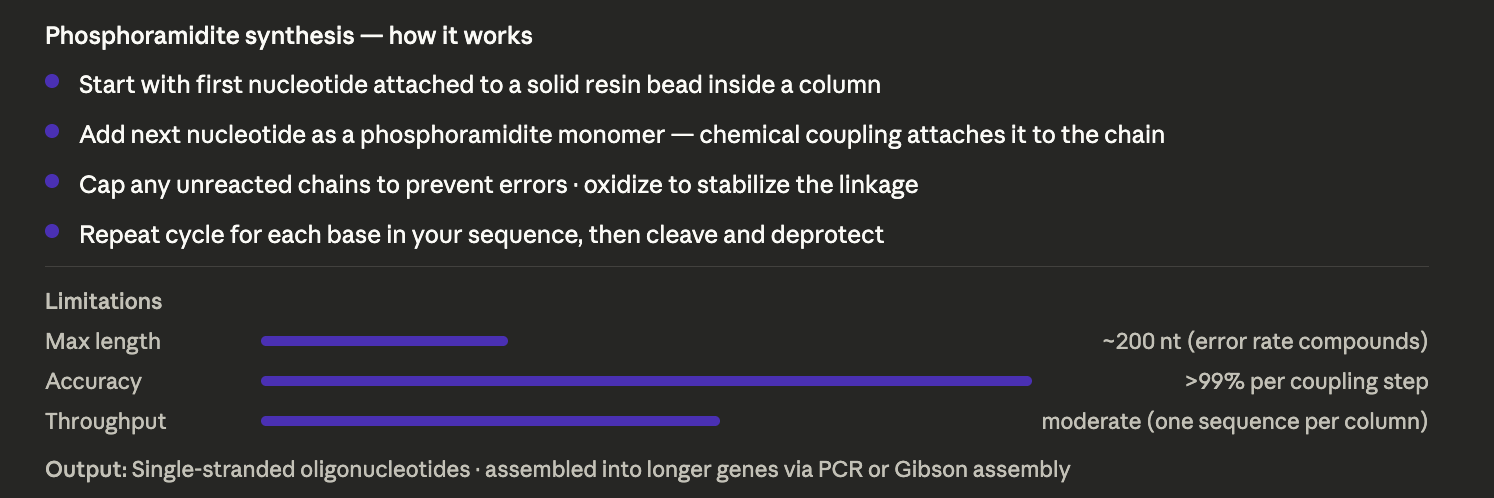
held at Yonsei University. Across the course, I worked on DNA reading, writing,
and editing, genetic circuit design, protein engineering, cell-free protein
synthesis, lab automation, bioproduction, imaging and measurement, and building
genomes. I completed computational projects using tools including Benchling,
Asimov Kernel, PepMLM, PeptiVerse, and AlphaFold3, and gained hands-on
experience with molecular biology techniques across wet and dry lab contexts.
Final Project
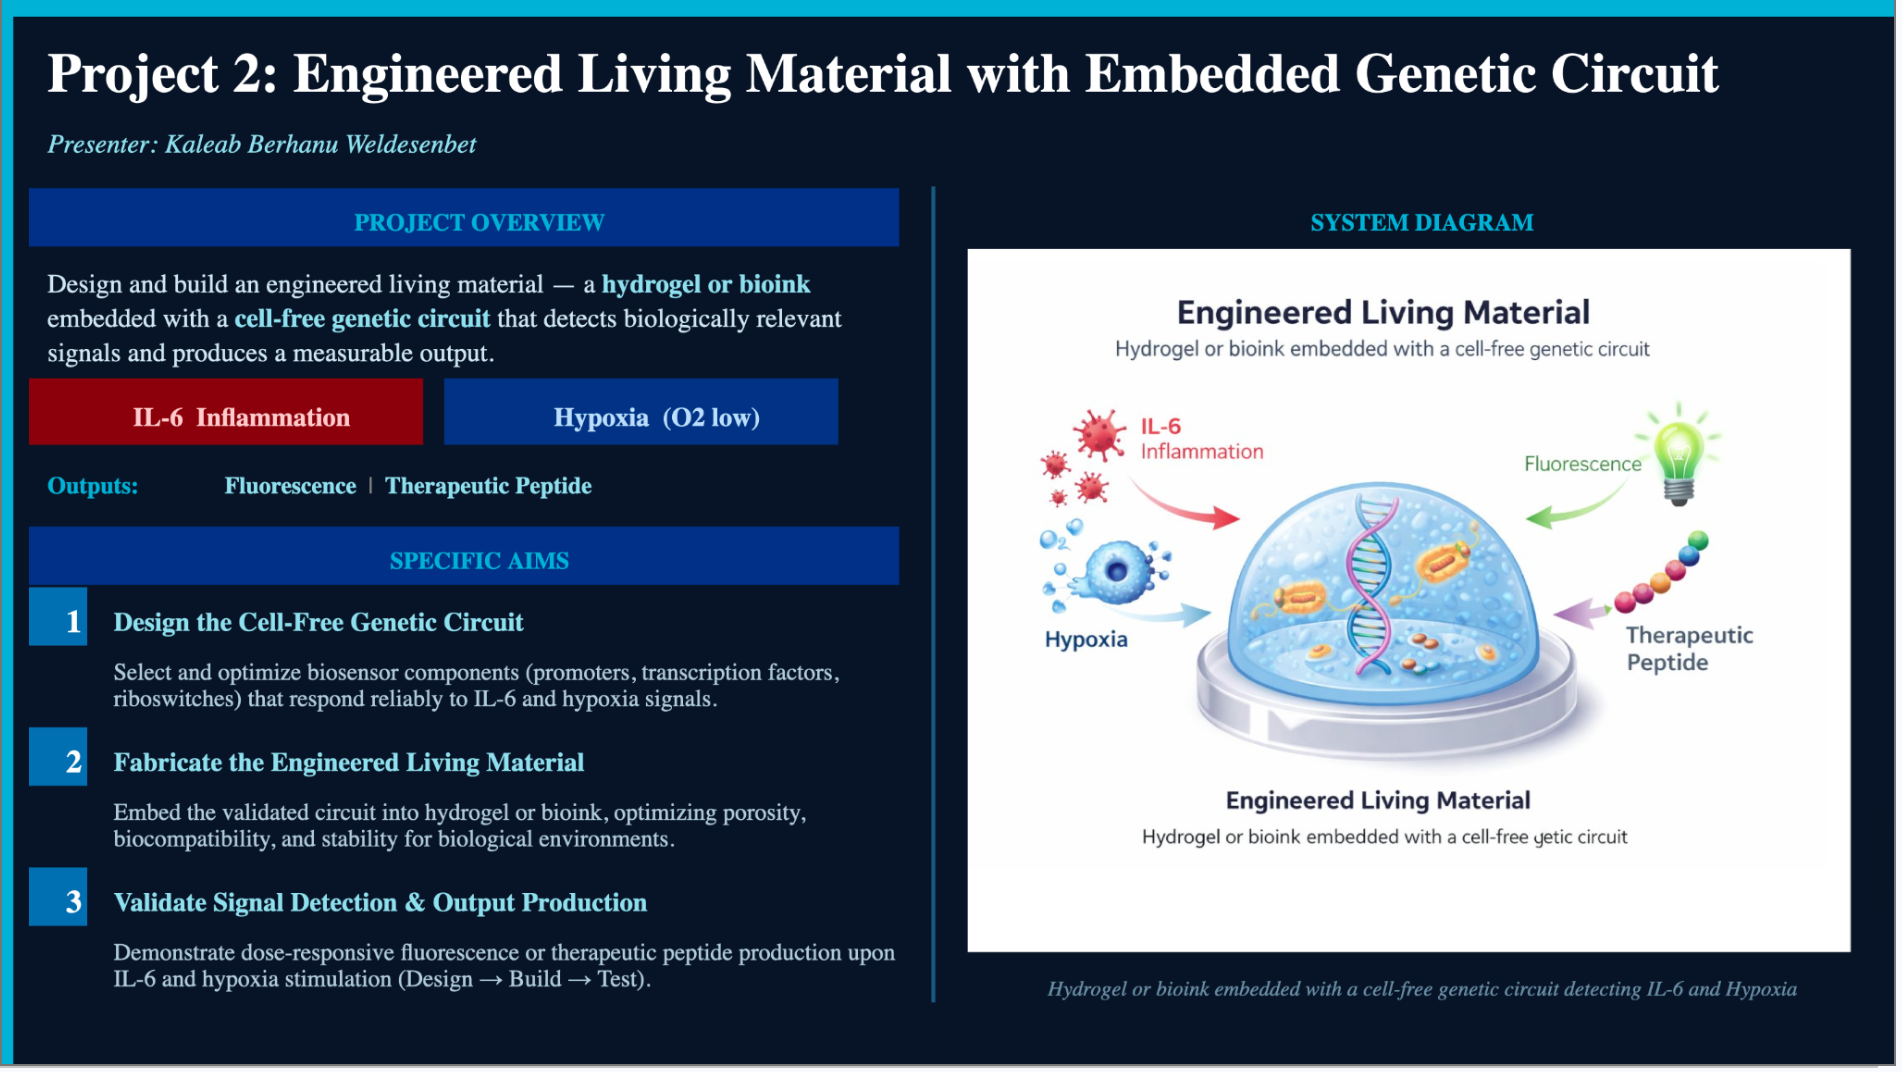
My HTGAA final project is titled A Hydrogel-Embedded Multiple Input-Output
(MIMO) Genetic Circuit for IL-6 and Hypoxia Detection. The project addresses
a critical gap in clinical monitoring: the inability to detect localized
inflammation and hypoxia in real time at the tissue level without repeated
blood draws or imaging. I designed a cell-free genetic circuit that senses two
simultaneous disease signals — elevated IL-6 (an inflammatory cytokine) and
low oxygen tension (hypoxia) — and produces two outputs: sfGFP fluorescence as
a diagnostic reporter and a therapeutic peptide as a functional biological
output. The circuit is encapsulated within an agarose hydrogel bioink matrix,
creating a self-contained sense-and-respond biomaterial platform with potential
applications in wound care, oncology, and critical care medicine globally.
Beyond the Lab
Outside of research, I have worked as a Global Ambassador for Hanyang
University and produced content across English and Korean channels for ESAK.
I participated in the Korea–Cambodia ICT Exchange Program organized by the
Korea Productivity Center and KOICA, where I led the field research component
of a smart irrigation project, conducting farmer interviews and designing a
prototype that addressed real agricultural challenges, ultimately winning third
place at a local competition in Cambodia. I also completed the LINC 3.0
Industry Collaboration Program, developing a global market strategy for an
AI-based environmental analysis startup, and worked on data analysis and
digital competency through Python-based coursework.
Future Aspirations
My long-term goal is to become a biotechnologist working at the frontier of
synthetic biology and therapeutic engineering. I am particularly drawn to the
design of programmable biological systems — circuits, materials, and platforms
that can autonomously sense disease and respond with a therapeutic output,
without requiring living organisms or complex clinical infrastructure. I am
strongly considering pursuing graduate school in biomedical engineering or
synthetic biology, where I hope to develop the depth of expertise needed to
contribute independently to the fields of neural engineering, cell-free
systems, and implantable biomaterials. I believe that the future of medicine
lies not in reactive treatment but in proactive, localized biological
intelligence embedded directly at the site of disease — and I intend to spend
my career helping build it.
Biological Engineering Application or Tool The proposed application is an AI-guided protein therapeutic discovery and bioproduction platform. The system uses machine learning–based protein design models to generate novel therapeutic protein candidates, such as antimicrobial proteins, enzymes, or biologics optimized for stability and activity. These candidates are then evaluated for manufacturability and functional performance using controlled bioproduction workflows, including microbial expression or cell-free systems.
This application reflects an emerging paradigm in biopharmaceutical development, where AI accelerates early-stage discovery while scalable bioproduction determines clinical and commercial feasibility. However, as AI enables rapid de novo protein design, many generated sequences may lack homology to known natural proteins, introducing novel biosecurity and safety risks if not properly governed.
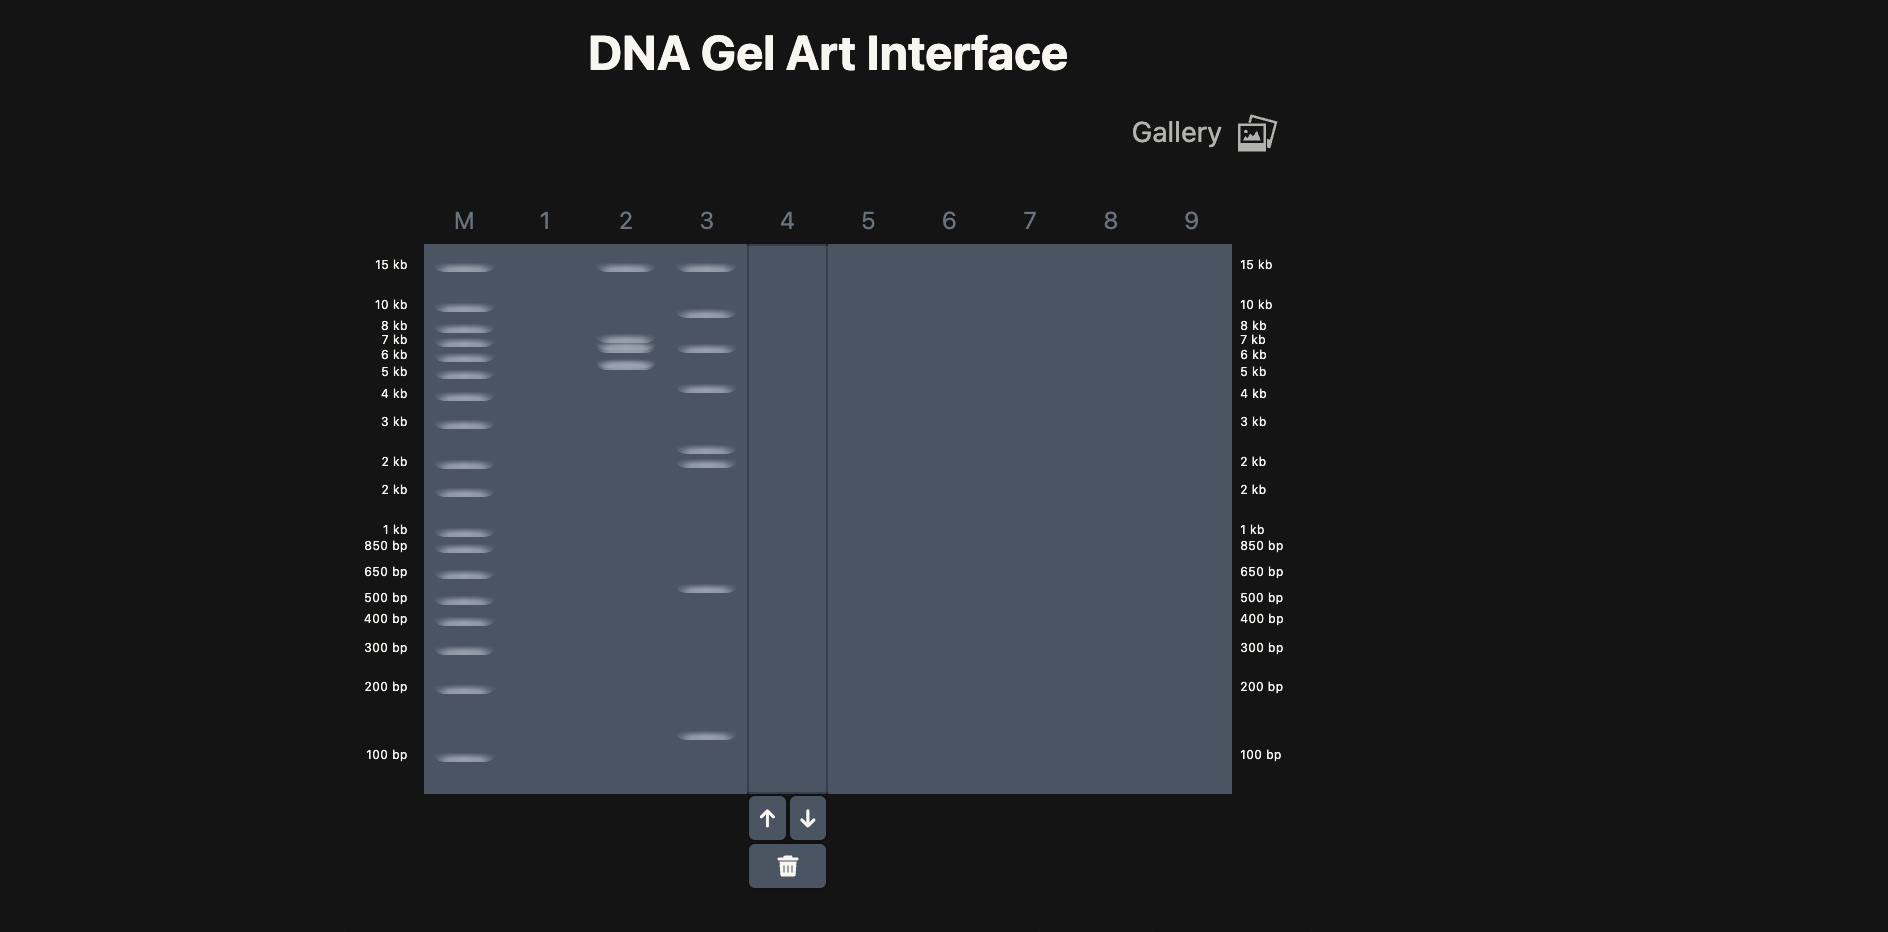
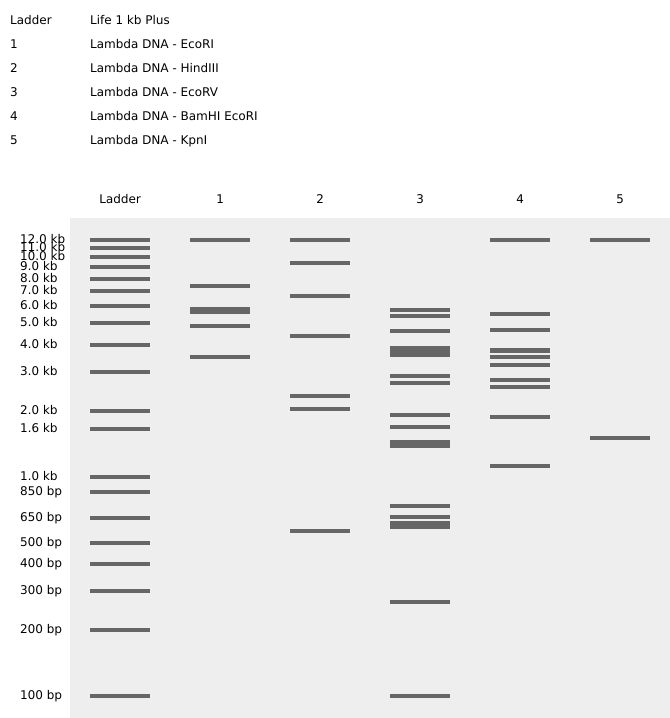
This week, we were tasked to utilize different tools to be able to virtually read, write, and visualize using samples like lambda DNA from Escherichia coli and the Tumor suppressor gene from humans.
Part 1 - Introduction and DNA digest. Gel Electrophoresis Gel - material Electro - Electric Phoresis - to transport It is a method used to transport charged materials using an electric field through a gel (a Semi-liquid substance). Digested fragments of Lambda DNA
Bioart Using Opentrons Goal of learning this lesson and doing the OpenTron automation.
Utilizing different tools to automate different lab work using programmed robots. Be able to design, coordinate, code, and print one’s design using OpenTron robots. Code CLICK HERE SEE THE CODE USED from opentrons import types
A. Conceptual Questions How many molecules of amino acids do you take with a piece of 500 grams of meat? (On average, an amino acid is ~100 Daltons)
Answer 1 Dalton ≈ 1 g/mol
Average amino acid ≈ 100 g/mol
If you eat 500 g of (pure) amino acids:
number of moles = Gm/ Tm = 500g/100g/mol
Protein Design Part 2 SOD1_A4V Mutated Code Used. —> MATKVVCVLKGDGPVQGIINFEQKESNGPVKVWGSIKGLTEGLHGFHVHEFGDNTAGCTS AGPHFNPLSRKHGGPKDEERHVGDLGNVTADKDGVADVSIEDSVISLSGDHCIIGRTLVV HEKADDLGKGGNEESTKTGNAGSRLACGVIGIAQ
Part 1: PepMLM Generated Peptides Summary The four PepMLM-generated peptides were conditioned on the SOD1 A4V mutant sequence with a target length of 12 amino acids, with the exception of Peptide 2, which came out at 15 residues. Perplexity scores reflect the model’s confidence in each binder, where a lower score indicates higher confidence. Peptide 1 (WLYGAAGVRWGX) has the lowest perplexity at 13.06, making it the model’s most confident prediction, though it contains an X residue at the final position, which represents an unresolved or masked amino acid and should be noted as a potential issue before advancing it further. Peptides 2, 3, and 4 all cluster between 17 and 20, reflecting moderate confidence. The known binder FLYRWLPSRRGG is included as a structural and therapeutic benchmark and does not carry a perplexity score since it was not generated by PepMLM.
Part - 1 What are some components in the Phusion High-Fidelity PCR Master Mix, and what is their purpose?
Phusion High-Fidelity PCR Master Mix, commonly produced by Thermo Fisher Scientific, contains a high-fidelity DNA polymerase with proofreading ability, a reaction buffer that maintains optimal conditions, Mg²⁺ ions as a cofactor, dNTPs as building blocks, and stabilizing additives. Together, these components enable accurate and efficient DNA amplification with a low error rate. What are some factors that determine primer annealing temperature during PCR?
Assignment Part 1: Intracellular Artificial Neural Networks (IANNs) What advantages do IANNs have over traditional genetic circuits, whose input/output behaviors are Boolean functions?
Intracellular artificial neural networks provide more flexible and nuanced behavior than traditional Boolean genetic circuits because they can process inputs in a graded, continuous manner rather than simple on or off states. This allows cells to integrate multiple signals and produce proportional responses, making them better suited for complex decision making and pattern recognition inside biological systems. Describe a useful application for an IANN; include a detailed description of input/output behavior, as well as any limitations an IANN might face to achieve your goal.
Homework question from Kate Adamala. Design an example of a useful synthetic minimal cell as follows:
Pick a function and describe it. a. What would your synthetic cell do? What is the input, and what is the output?
The cell-free genetic circuit that I plan to make for the final project aims to detect different biological signals and produce a measurable output. The input will be one among the environmental signals, IL-6 or low O₂, and the output will be a green fluorescence signal or a therapeutic peptide. Could this function be realized by cell-free Tx/Tl alone, without encapsulation? The system that I am thinking of needs to be encapsulated inside a hydrogel. Could this function be realized by genetically modified natural cells? Cells do have a mechanism to respond to real signals in the body, but getting therapeutic peptides and other luminescent signals as an output from a signal is achieved if the cell is preprogrammed and the genetic circuit is assembled in a way to detect the signal and respond accordingly. Describe the desired outcome of your synthetic cell operation. Output will be a Green Fluorescence Signal. Design all components that would need to be part of your synthetic cell. What would the membrane be made of?
Protein Characterization: eGFP and KLH Homework: Final Project Project Title: A Hydrogel-Embedded Multiple Input-Output (MIMO) Genetic Circuit for IL-6 and Hypoxia Detection
What I Will Measure My final project centers on engineering a cell-free genetic circuit embedded within a hydrogel matrix that responds to two physiological disease signals, IL-6 (an inflammatory cytokine) and low oxygen tension (hypoxia), and produces two corresponding outputs: sfGFP fluorescence as a reporter signal and a therapeutic peptide as a functional output.
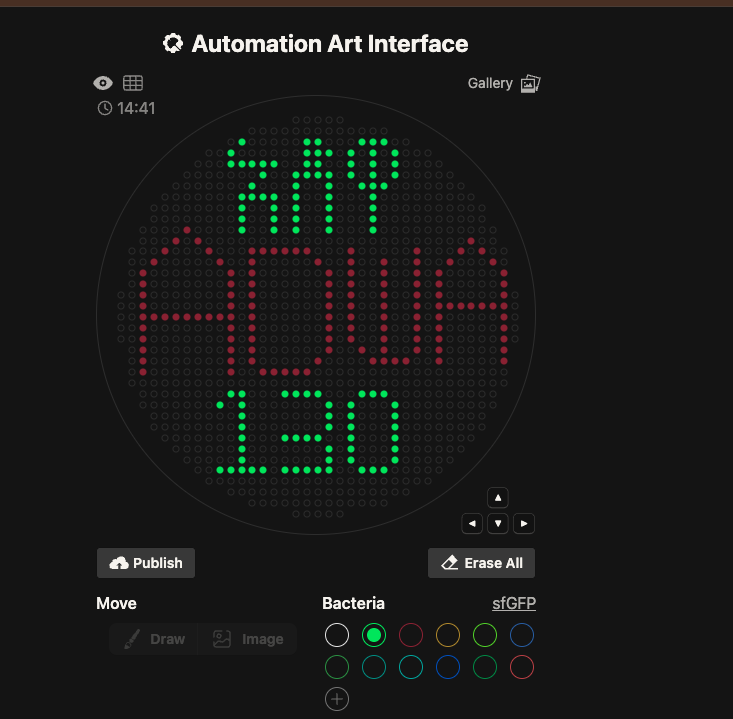
Bioproduction & Cloud Labs Part A: The 1,536 Pixel Artwork Canvas | Collective Artwork My Contribution I contributed pixels forming part of the DNA helix structure on the lower left quadrant of the collective canvas, using a blue-green palette consistent with the biological theme of the artwork.
Subsections of Homework
week-01-hw-principles-and-practices
Biological Engineering Application or Tool
The proposed application is an AI-guided protein therapeutic discovery and bioproduction platform. The system uses machine learning–based protein design models to generate novel therapeutic protein candidates, such as antimicrobial proteins, enzymes, or biologics optimized for stability and activity. These candidates are then evaluated for manufacturability and functional performance using controlled bioproduction workflows, including microbial expression or cell-free systems.
This application reflects an emerging paradigm in biopharmaceutical development, where AI accelerates early-stage discovery while scalable bioproduction determines clinical and commercial feasibility. However, as AI enables rapid de novo protein design, many generated sequences may lack homology to known natural proteins, introducing novel biosecurity and safety risks if not properly governed.
Governance / Policy Goals
The overarching governance goal is to ensure that AI-enabled protein drug discovery and bioproduction contribute to a safe, ethical, and socially beneficial future, while preventing misuse or unintended harm.
This goal can be divided into the following sub-goals:
2.1. Non-malfeasance and biosecurity
Prevent the accidental or intentional creation of harmful, toxic, or dual-use proteins enabled by AI-assisted design.
2.2. Responsible scale-up and traceability Ensure that the transition from digital protein design to physical bioproduction is secure, auditable, and accountable.
2.3. Preservation of constructive innovation Maintain open scientific collaboration and efficient therapeutic development without imposing unnecessary regulatory burdens that would slow innovation.
These goals align with arguments advanced by Baker and Church, who emphasize that enhanced biosecurity should be embedded into protein design and DNA synthesis infrastructure without undermining transparency or information sharing.
Currently, AI protein design pipelines primarily optimize for functional performance, and existing biosecurity measures rely heavily on sequence homology screening at the DNA synthesis stage. As Baker and Church note, this approach is increasingly insufficient for de novo designed proteins. This project proposes an integrated governance mechanism that embeds mandatory AI-based safety screening and secure sequence logging directly into the protein design and bioproduction pipeline.
Design
This governance approach would be implemented through collaboration among AI tool developers, biopharmaceutical companies, and DNA synthesis or bioproduction providers. All AI-generated protein sequences would undergo computational screening for toxicity, virulence, and dual-use potential before synthesis approval. Once synthesized, sequences would be logged in encrypted repositories tied to production systems, with access restricted to exceptional circumstances such as public health investigations. This design enables traceability and accountability while protecting intellectual property and minimizing interference with normal research workflows.
Assumptions
This approach assumes that predictive models for protein toxicity and risk are sufficiently accurate to identify high-risk candidates and that industry actors are willing to adopt shared security standards. It also assumes that secure logging can be implemented in a way that does not expose proprietary information or discourage legitimate research.
Risks of Failure and “Success”
Potential failure modes include false negatives that allow harmful proteins to proceed or false positives that block legitimate therapeutic candidates. Additionally, if logging systems are unevenly implemented, malicious actors may bypass regulated platforms. A potential risk of “success” is increased centralization of bioproduction infrastructure, which could disadvantage smaller labs or researchers in low-resource settings if access is not equitably managed.
3.2 Governance Action Option 2
Tiered Access and Credentialing for Advanced Protein Design Models
Purpose
Currently, many AI protein design tools are becoming increasingly accessible with minimal differentiation between low-risk exploratory use and high-risk de novo protein generation. This action proposes a tiered access system where more powerful generative protein design capabilities require additional credentials, training, or institutional affiliation.
Design
AI tool providers and research institutions would implement access tiers based on user role, training completion, and intended application. Basic design and analysis features would remain widely accessible, while advanced generative functions (e.g., unrestricted de novo protein design) would require completion of biosecurity and ethics training, institutional oversight, or project-level approval. This mirrors governance models used in high-performance computing, clinical data access, and human-subjects research.
Assumptions
This approach assumes that access restrictions can meaningfully reduce misuse without pushing users toward unregulated alternatives. It also assumes institutions are capable of fairly and consistently evaluating access requests.
Risks of Failure and “Success”
If too restrictive, tiered access could slow innovation or disadvantage independent researchers and low-resource institutions. If too permissive, it may fail to deter misuse. A risk of “success” is the normalization of credential-based gatekeeping that could reinforce existing inequities in global research participation.
3.3 Governance Action Option 3
Safety-by-Design Standards Linked to Incentives and Recognition
Purpose
While safety measures are often framed as compliance requirements, this action reframes governance as an incentive-based system that rewards early integration of biosecurity and safety considerations into AI-driven protein design and bioproduction.
Design
Funding agencies, journals, and investors would establish safety-by-design criteria as part of grant evaluation, publication standards, and due diligence. Projects that demonstrate integrated risk assessment, secure production workflows, and ethical reflection would receive preferential funding, expedited review, or public recognition. This approach aligns governance with existing academic and commercial reward structures rather than relying solely on enforcement.
Assumptions
This approach assumes that researchers and companies respond strongly to funding, publication, and reputational incentives. It also assumes evaluators have sufficient expertise to assess safety claims without turning the process into box-checking.
Risks of Failure and “Success”
If poorly designed, incentives may encourage superficial compliance rather than genuine risk mitigation. A risk of “success” is that safety standards become rigid or outdated, unintentionally discouraging novel approaches that do not fit existing evaluation frameworks.
Does the option:
Option 1
Option 2
Option 3
Enhance Biosecurity
• By preventing incidents
1
2
2
• By helping respond
1
3
3
Foster Lab Safety
• By preventing incident
2
2
1
• By helping respond
1
3
2
Protect the environment
• By preventing incidents
2
3
2
• By helping respond
1
3
2
Other considerations
• Minimizing costs and burdens to stakeholders
2
1
1
• Feasibility?
1
2
2
• Not impede research
2
1
1
• Promote constructive applications
1
2
1
Evaluation and Prioritization of Governance Approach
Overall, this integrated governance approach performs well across the major policy goals of biosecurity, lab safety, and responsible innovation. By focusing on prevention at the design stage and accountability at the production stage, it strengthens biosecurity while remaining feasible and compatible with existing biopharmaceutical workflows. Although the approach introduces some additional cost and procedural overhead, it does not fundamentally impede research and instead helps reduce downstream failures and regulatory risk.
Final Recommendation and Trade-offs
Based on this evaluation, the integrated safety screening and secure sequence logging approach should be prioritized as the primary governance mechanism for AI-enabled protein drug discovery and bioproduction. This strategy addresses the highest-risk stages—design and scale-up—while remaining technically feasible and aligned with existing biopharmaceutical practices. The key trade-off involves balancing innovation speed with safety and accountability. While additional screening and logging may introduce modest overhead, these costs are outweighed by reduced downstream failures, increased regulatory confidence, and improved public trust.
This recommendation is directed toward biopharmaceutical R&D leadership and regulatory agencies, where early alignment between AI-driven discovery and governance expectations can ensure that emerging therapeutic technologies are both innovative and trustworthy.
week-02-hw-dna-read-write-and-edit
This week, we were tasked to utilize different tools to be able to virtually read, write, and visualize using samples like lambda DNA from Escherichia coli and the Tumor suppressor gene from humans.
Part 1 - Introduction and DNA digest.
Gel Electrophoresis
Gel - material
Electro - Electric
Phoresis - to transport
It is a method used to transport charged materials using an electric field through a gel (a Semi-liquid substance).
Digested fragments of Lambda DNA
Part 2
For this assignment, I have chosen the Tumor Repressor protein 53 in humans. I chose this because I have previously made a comparative analysis with the Trp 53 protein from the mouse.
3.1 The full amino acid sequence of Tp53 protein in FASTA format
The main reason that the same gene can produce different proteins at the transcriptional level is mainly because of :
Alternative Splicing
Alternative transcriptional and translational initiation.
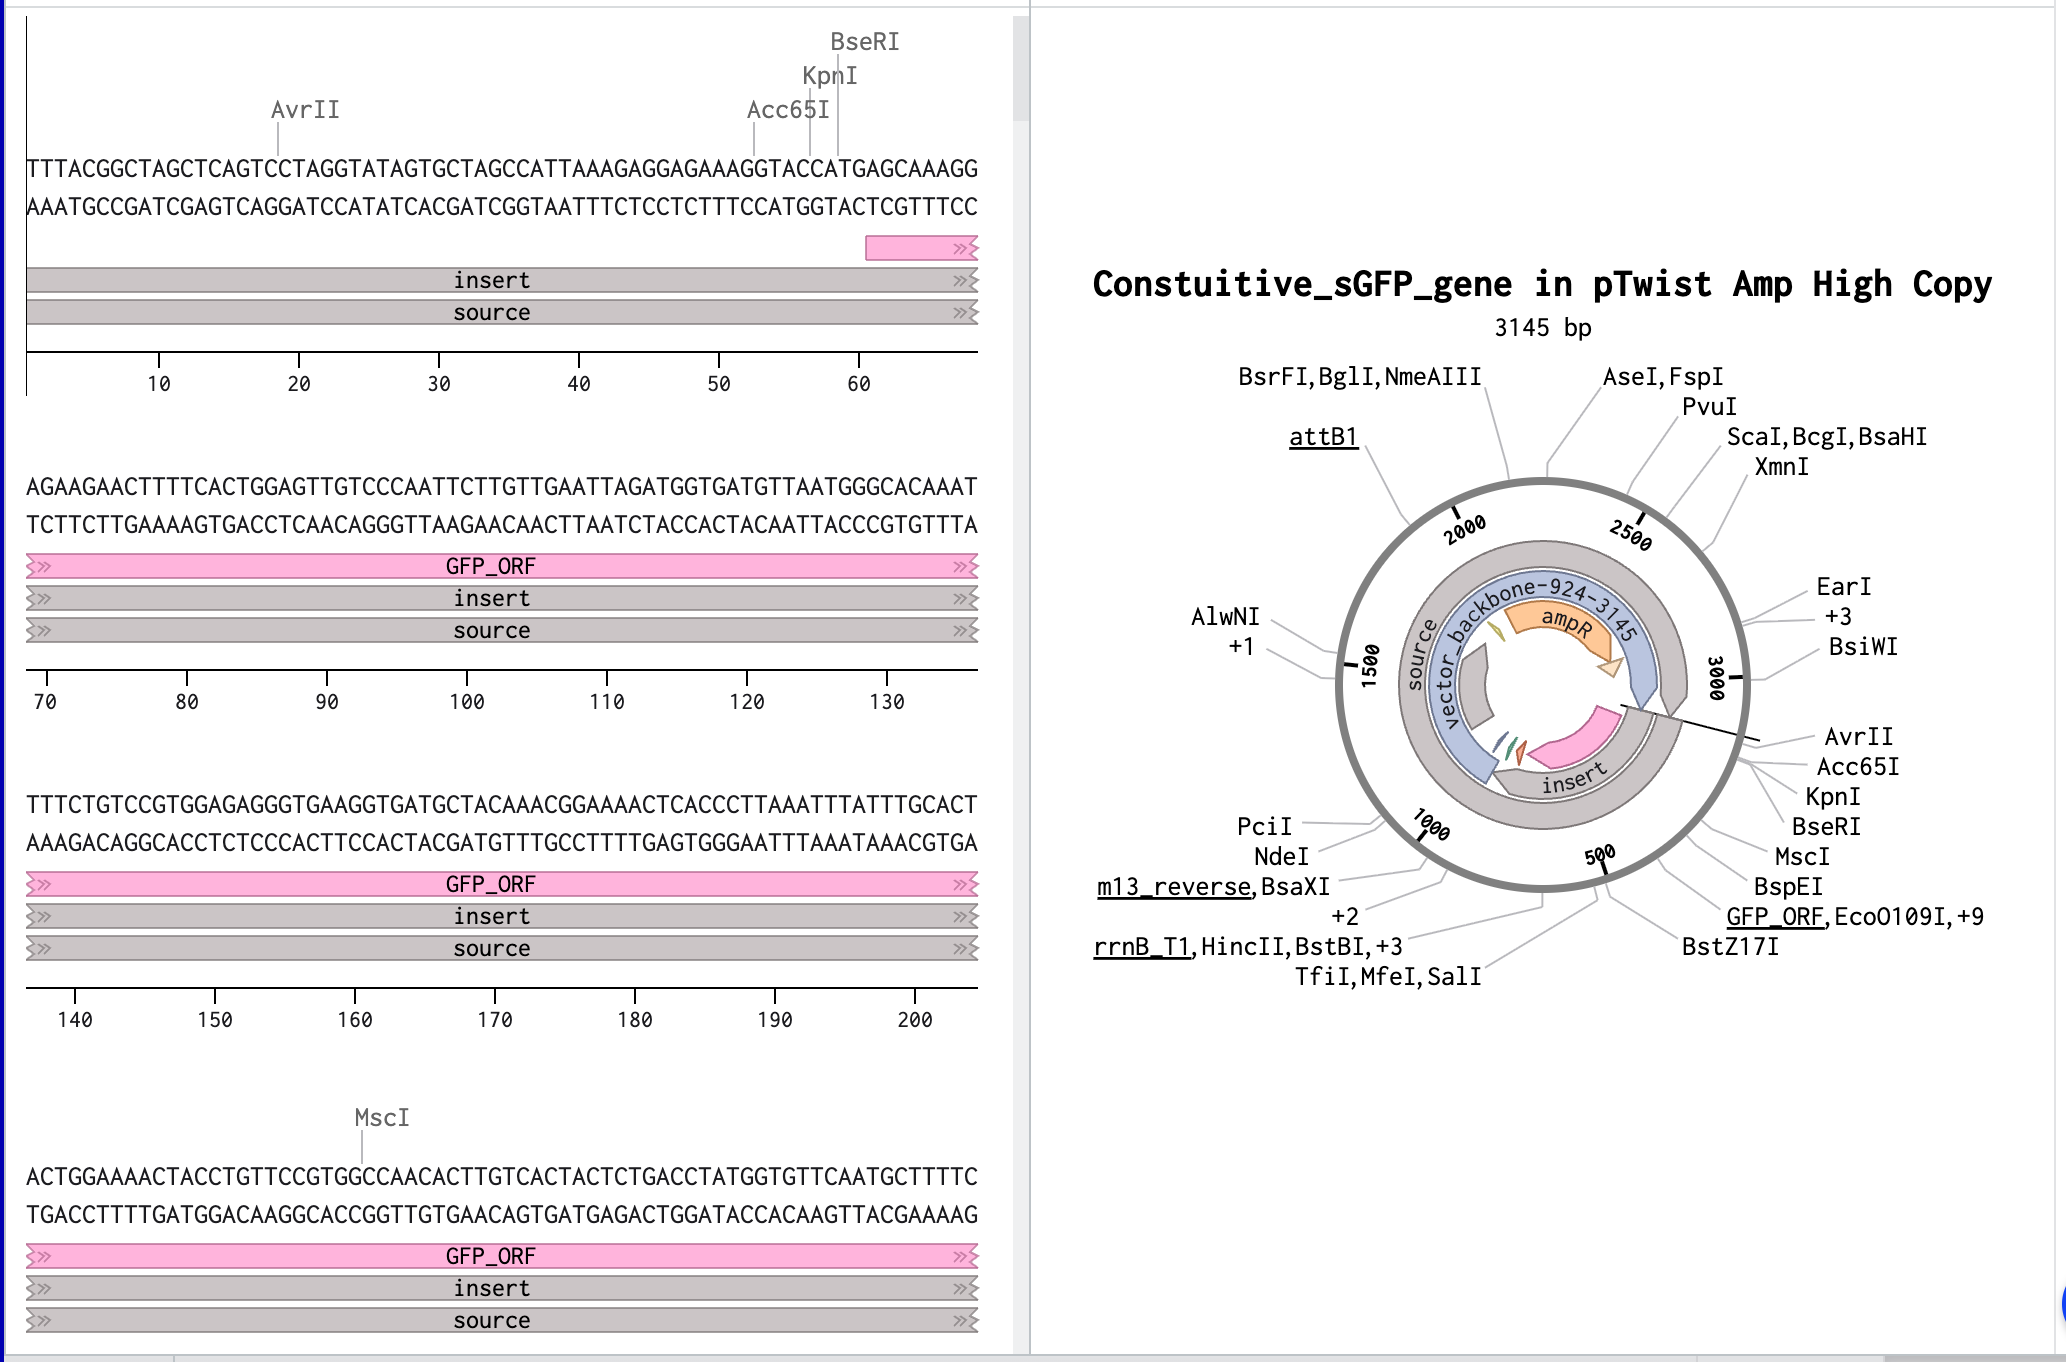
4 Preparing a Twist DNA Synthesis Order
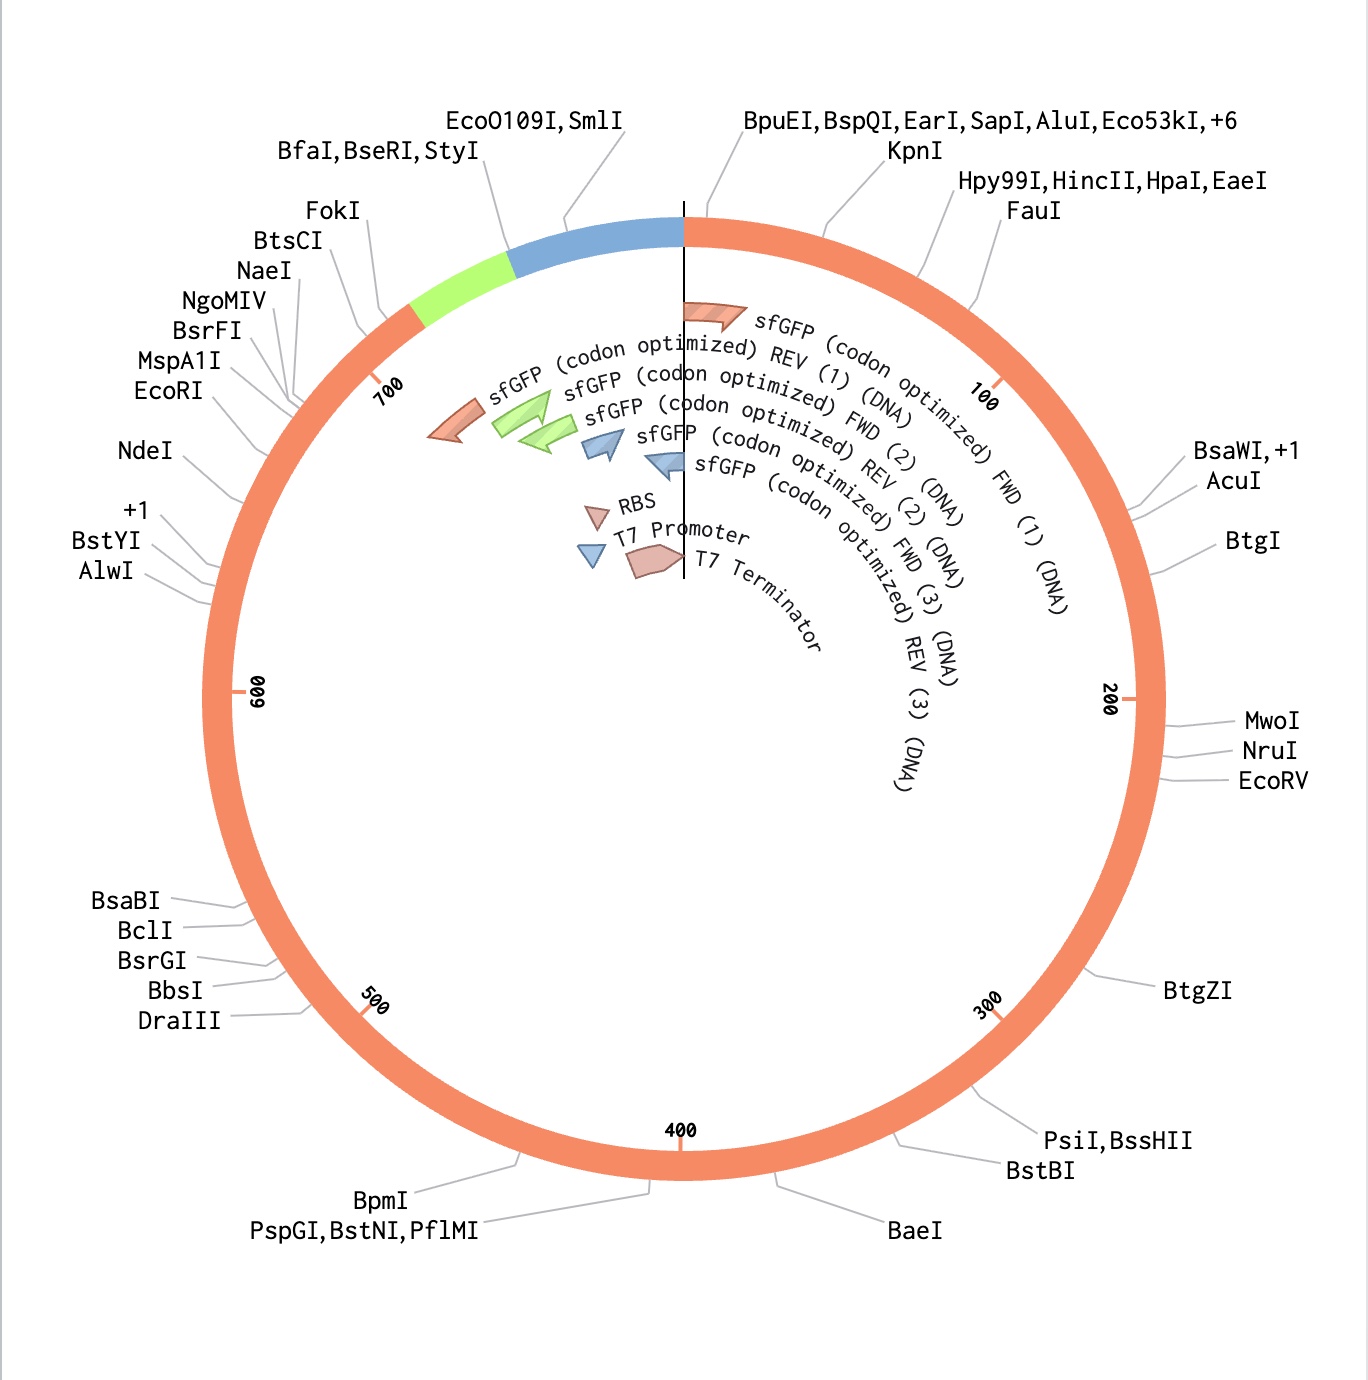
In this part, I was able to create an expression cassette that can be inserted into a vector plasmid and incorporated with a cell-free or a cell-dependent medium to express a desired protein. To exercise the entire procedure of making a construct and getting a customised plasmid vector benchling and Twist were used. I used the sGFP gene sequence from NCBI and annotated its promoter, ribosome-binding site, optimized codon region, and its terminator on benchling and later a pTwist Amp High Copy vector was used after downloading from Twist.
5. Tools and Techniques to Read, Write, and Edit DNA.
DNA Read
DNA Write
DNA Edit
week-03-hw-lab-automation
Bioart Using Opentrons
Goal of learning this lesson and doing the OpenTron automation.
Utilizing different tools to automate different lab work using programmed robots.
Be able to design, coordinate, code, and print one’s design using OpenTron robots.
# Pipettes
pipette_20ul = protocol.load_instrument("p20_single_gen2", "right", [tips_20ul])

# Modules
temperature_module = protocol.load_module('temperature module gen2', COLORS_DECK_SLOT)

# Temperature Module Plate
temperature_plate = temperature_module.load_labware(
    'opentrons_96_aluminumblock_generic_pcr_strip_200ul', 'Cold Plate'
)

# Choose where to take the colors from
color_plate = temperature_plate

# Agar Plate
agar_plate = protocol.load_labware('htgaa_agar_plate', AGAR_DECK_SLOT, 'Agar Plate')

# Get the top-center of the plate (calibration reference point)
center_location = agar_plate['A1'].top()

pipette_20ul.starting_tip = tips_20ul.well(PIPETTE_STARTING_TIP_WELL)

##############################################################################
###   Helper functions
##############################################################################

def location_of_color(color_string):
    """Return the well location for a given color name."""
    for well, color in well_colors.items():
        if color.lower() == color_string.lower():
            return color_plate[well]
    raise ValueError(f"No well found with color {color_string}")

def dispense_and_detach(pipette, volume, location):
    """
    Move laterally 5mm above the plate (to avoid smearing a drop); then drop down
    to the plate, dispense, move back up 5mm to detach drop, and stay high to be
    ready for next lateral move.
    """
    assert isinstance(volume, (int, float))
    above_location = location.move(types.Point(z=5))
    pipette.move_to(above_location)
    pipette.dispense(volume, location)
    pipette.move_to(above_location)

def stamp_color(color_string, points):
    """
    Aspirate enough liquid to dispense across all points, then visit each
    coordinate and dispense a small dot. Re-aspirate when the tip runs low.

    Args:
        color_string: 'Red' or 'Green'
        points: list of (x, y) tuples in mm offset from plate center
    """
    source_well = location_of_color(color_string)
    max_volume = 18  # stay below 20uL max, leave headroom
    remaining = 0

    pipette_20ul.pick_up_tip()

    for x_offset, y_offset in points:
        # Aspirate a fresh batch if the tip is about to run dry
        if remaining < DISPENSE_VOLUME:
            # How many dots can we fit in one pickup?
            dots_per_fill = int(max_volume // DISPENSE_VOLUME)
            aspirate_vol = min(dots_per_fill * DISPENSE_VOLUME, max_volume)
            pipette_20ul.aspirate(aspirate_vol, source_well)
            remaining = aspirate_vol

        # Build the target location: offset (x, y) from center, at plate surface
        target_location = center_location.move(types.Point(x=x_offset, y=y_offset, z=0))
        dispense_and_detach(pipette_20ul, DISPENSE_VOLUME, target_location)
        remaining -= DISPENSE_VOLUME

    # Drop tip when done with this color
    pipette_20ul.drop_tip()

##############################################################################
###   Patterning — stamp each bacterial strain
##############################################################################

# 1. mRFP1 (Red) — Amharic characters
stamp_color('Red', mrfp1_points)

# 2. sfGFP (Green) — English / additional characters
stamp_color('Green', sfgfp_points)
week-04-hw-protein-design-part-i
A. Conceptual Questions
How many molecules of amino acids do you take with a piece of 500 grams of meat?
(On average, an amino acid is ~100 Daltons)
Answer
1 Dalton ≈ 1 g/mol
Average amino acid ≈ 100 g/mol
If you eat 500 g of (pure) amino acids:
number of moles = Gm/ Tm = 500g/100g/mol
Using Avogadro’s number: 5×6.022×10^23 ≈ 3.0 × 10²⁴ molecules
So you consume roughly 3 septillion amino acid molecules.
2. Why do humans eat beef but do not become cows, eat fish but do not become fish?Answer
Proteins are digested into individual amino acids in the stomach and small intestine.
Your body:
Breaks proteins down.
Absorbs amino acids.
Reassembles them into human proteins according to your DNA.
3. Why are there only 20 natural amino acids?Answer
Because they have been created by an intelligent design in such a way.
4. Can you make other non-natural amino acids? Design some new amino acids.Answer
Yes. Scientists create non-natural amino acids using synthetic biology.
Examples of designs:
• A fluorescent amino acid (attach a fluorophore to side chain)
• A metal-binding amino acid (add a bipyridine group)
• A photo-switchable amino acid (add an azobenzene group)
• A redox-active amino acid
These can:
Expand protein function
Create new biomaterials
Enable bioelectronics
5. Where did amino acids come from before enzymes that make them, and before life started?Answer
Everything was created by the almighty God, who is an intelligent being.
6. If you make an α-helix using D-amino acids, what handedness (right or left) would you expect?Answer
Natural proteins use L-amino acids and form right-handed α-helices.
If you use D-amino acids, you would expect a left-handed α-helix.
The handedness flips due to stereochemistry.
7. Can you discover additional helices in proteins?Answer
Yes.
Beyond the α-helix, proteins contain:
3₁₀ helix
π-helix
Collagen triple helix
Structural biology and protein design can reveal or engineer new helix types.
8. Why are most molecular helices right-handed?Answer
Because biological systems predominantly use L-amino acids.
Their stereochemistry naturally favors right-handed packing for minimal steric clash and optimal hydrogen bonding.
9. Why do β-sheets tend to aggregate?
What is the driving force for β-sheet aggregation?
Why do many amyloid diseases form β-sheets?
Can you use amyloid β-sheets as materials?
Design a β-sheet motif that forms a well-ordered structure.
Answer
Why β-sheets aggregate:
β-strands expose backbone hydrogen bonding groups.
They stack via intermolecular hydrogen bonds.
Driving force:
Hydrogen bonding
Hydrophobic interactions
π–π stacking (aromatic residues)
Amyloid diseases:
Proteins misfold and form stable β-sheet fibrils.
Examples include:
Alzheimer’s disease
Parkinson’s disease
Amyloid β-peptides form cross-β sheet structures.
Materials applications:
Yes — amyloid fibrils can be used as:
Nanowires
Hydrogels
Biocompatible scaffolds
Design idea:
Create a repeating sequence like:
Val–Ile–Val–Ile–Tyr–Val–Ile–Val
Alternating hydrophobic residues promotes stacking and ordered β-sheet assembly.
B. Protein Analysis
I have chosen Herceptin (trastuzumab) for this section. Herceptin is a monoclonal antibody mainly involved in recognising cancer cells. It binds specifically to the HER2 receptor on cancer cells and blocks signaling pathways that promote tumor growth. I selected this protein because it is an important example of a therapeutic antibody widely used in breast cancer treatment.
Total Length: 1255
Most Common Amino Acid: Leucine(L)
It belongs to the immunoglobulin G (IgG1) subclass within the immunoglobulin superfamily. And it is part of the L-domian family. (Immunoglobulin Light-chain domain.)
Resolution: 4.36 Å, which shows low resolution of the model.
The crystal structure of trastuzumab bound to HER2 was solved in 2004.
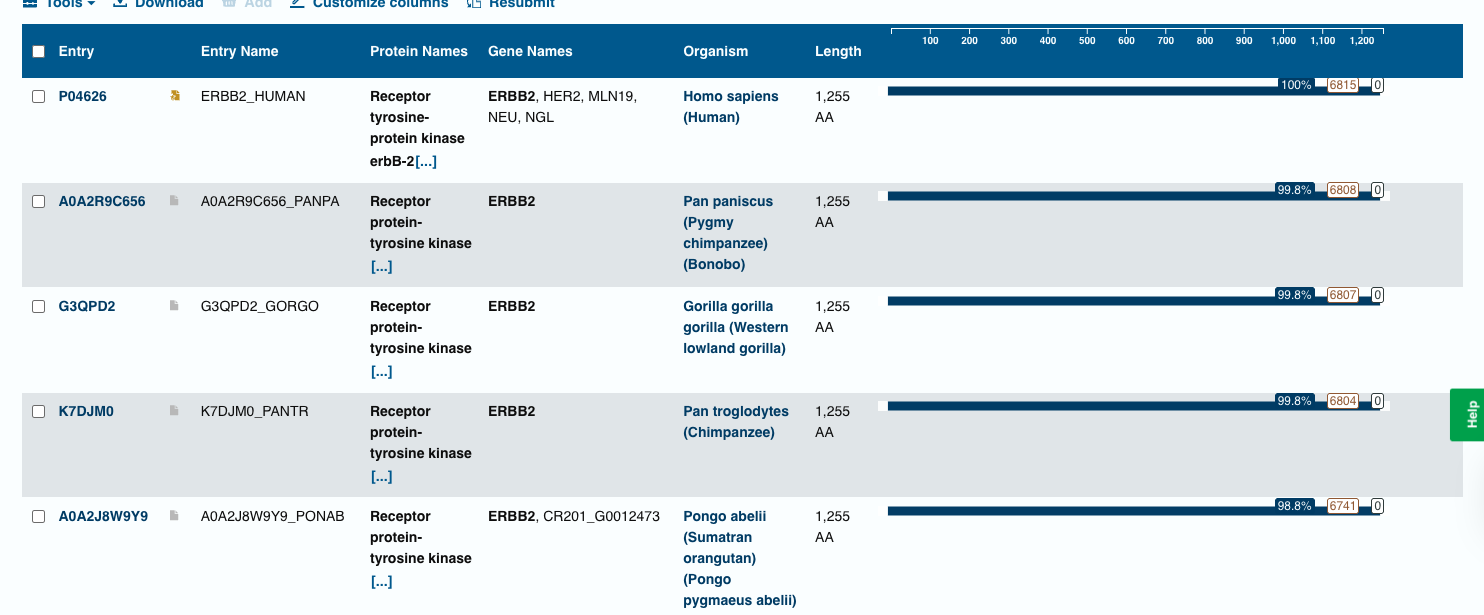
Blast Analysis
The BLAST search identified homologous ERBB2 (HER2) protein sequences in several primates, including chimpanzee, bonobo, gorilla, and orangutan. These sequences show very high similarity (98–99% identity) with the query sequence, indicating that the HER2 receptor is highly conserved among mammals.
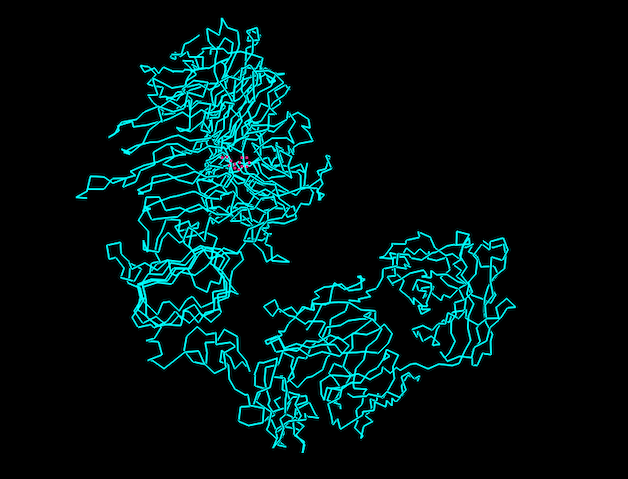
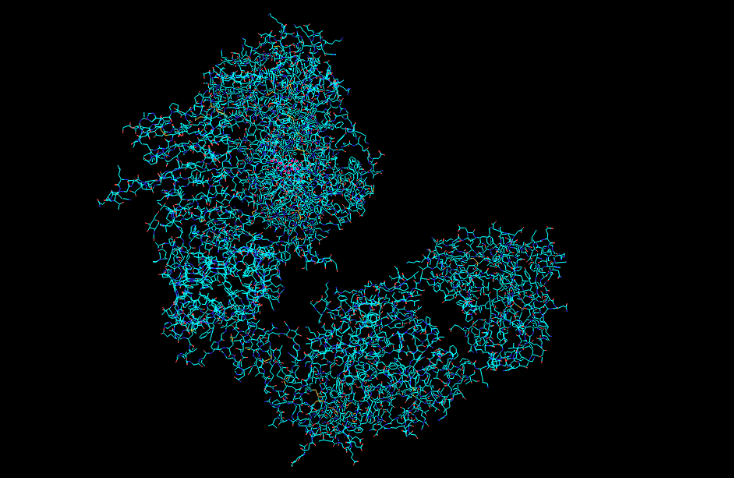
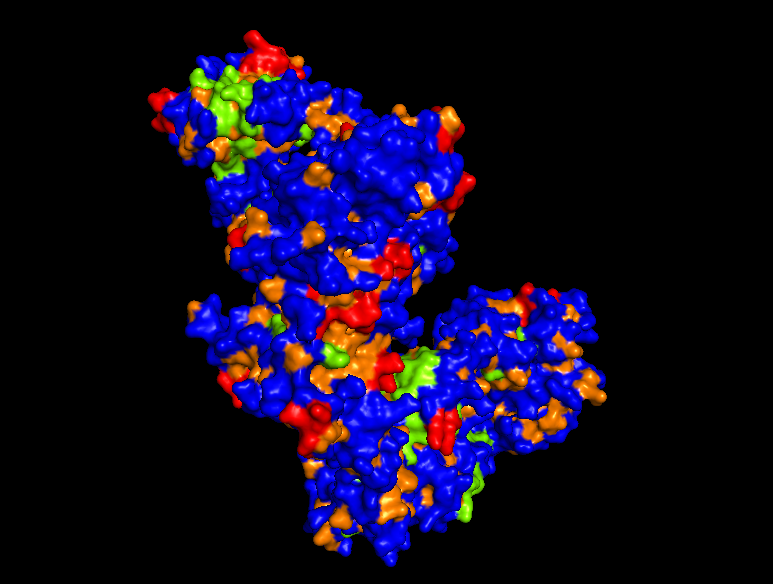
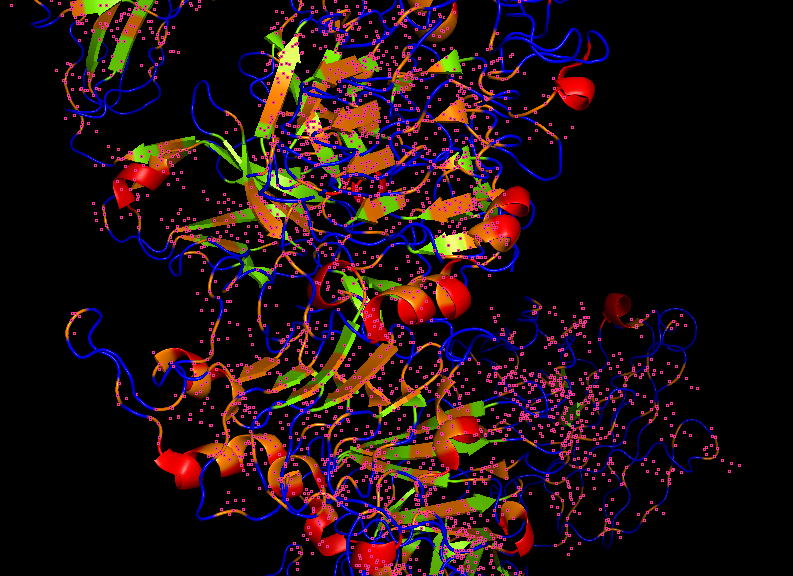
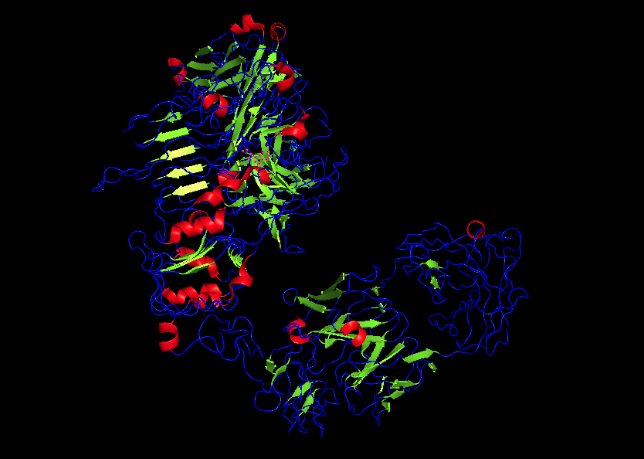
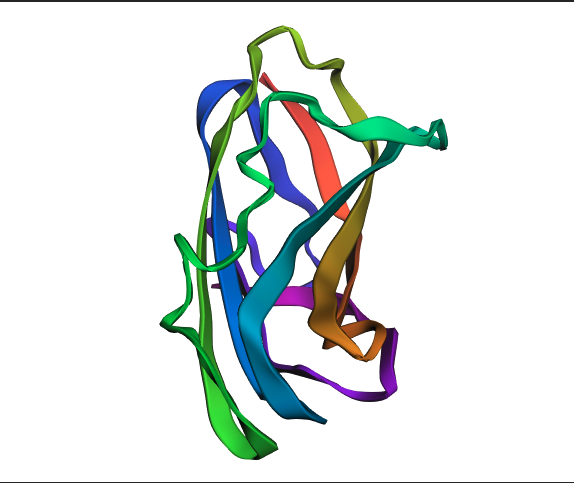
PYMOL Analysis of Trastuzumab
Ribbon Representation
Ball and Stick
Protein Surface
*Hydrophobic Region
Secondary structures
C. Using ML-Based Protein Design Tools
C1. Protein Language Modeling
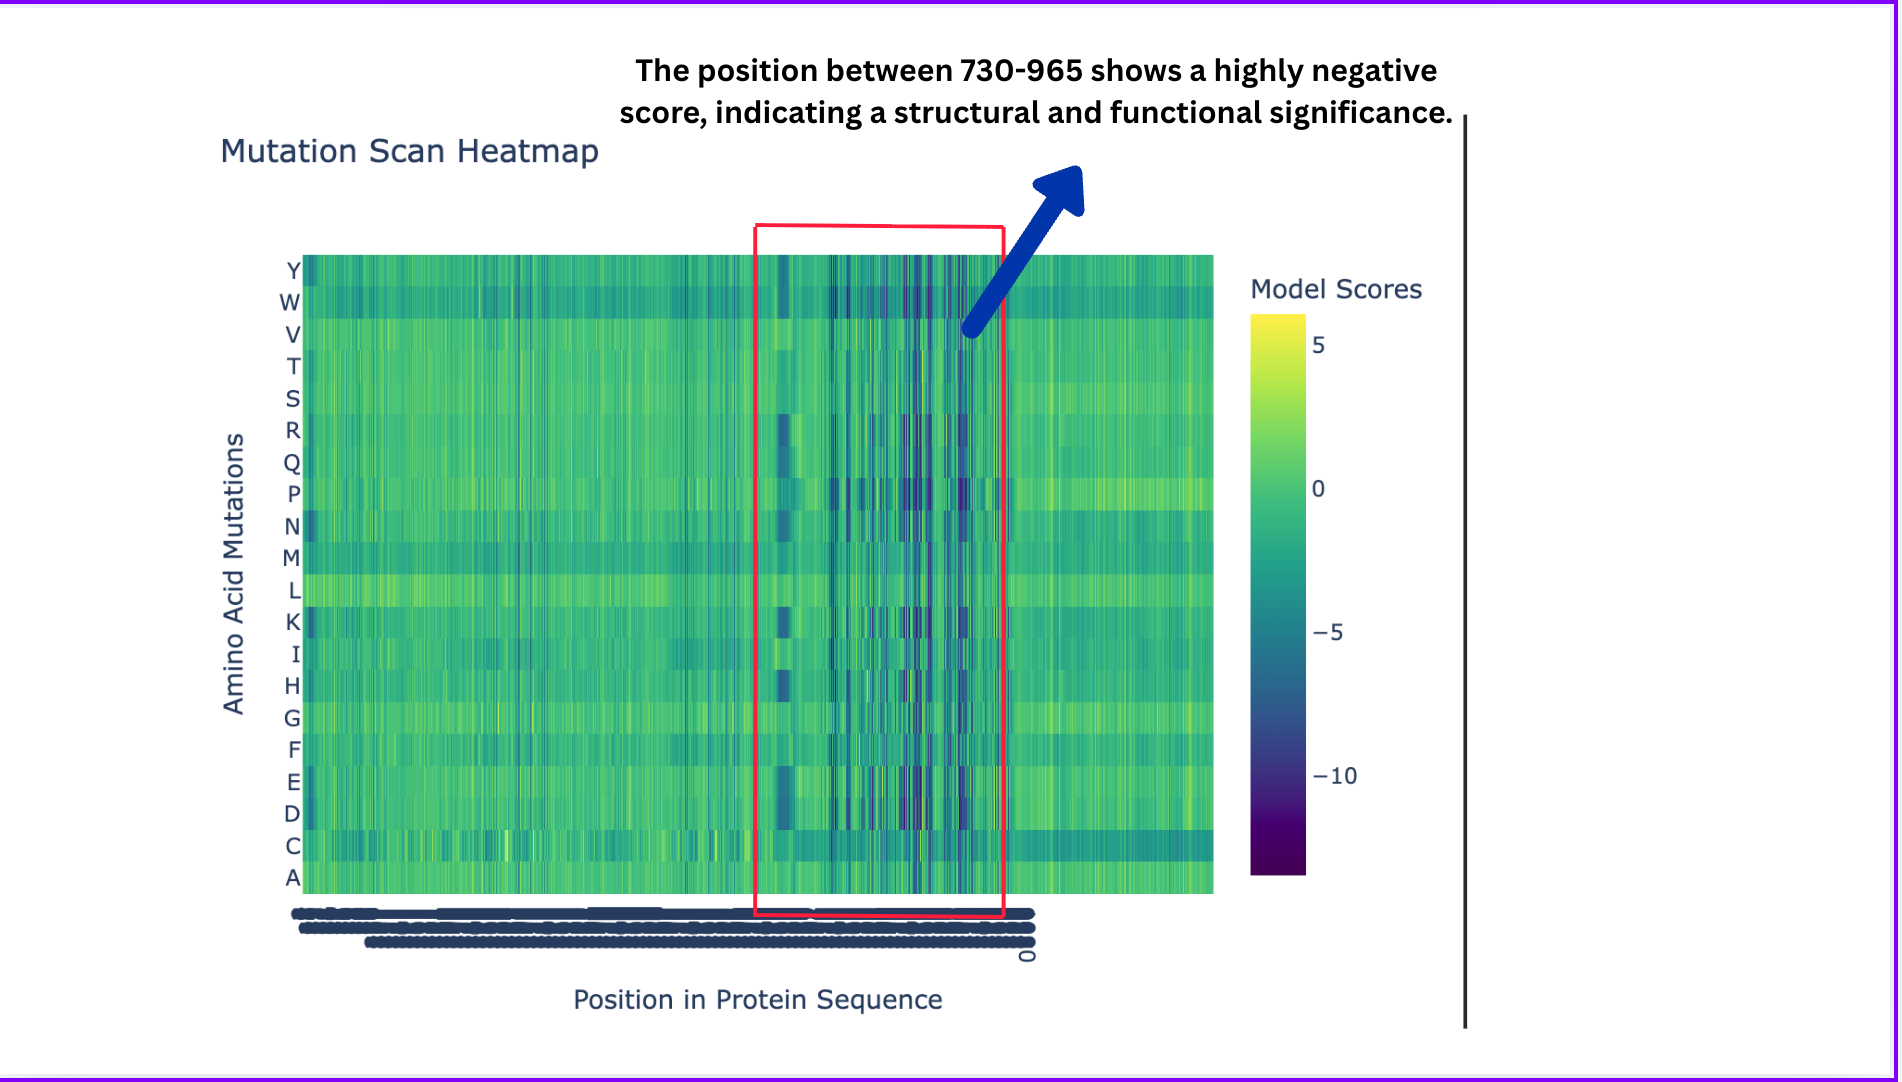
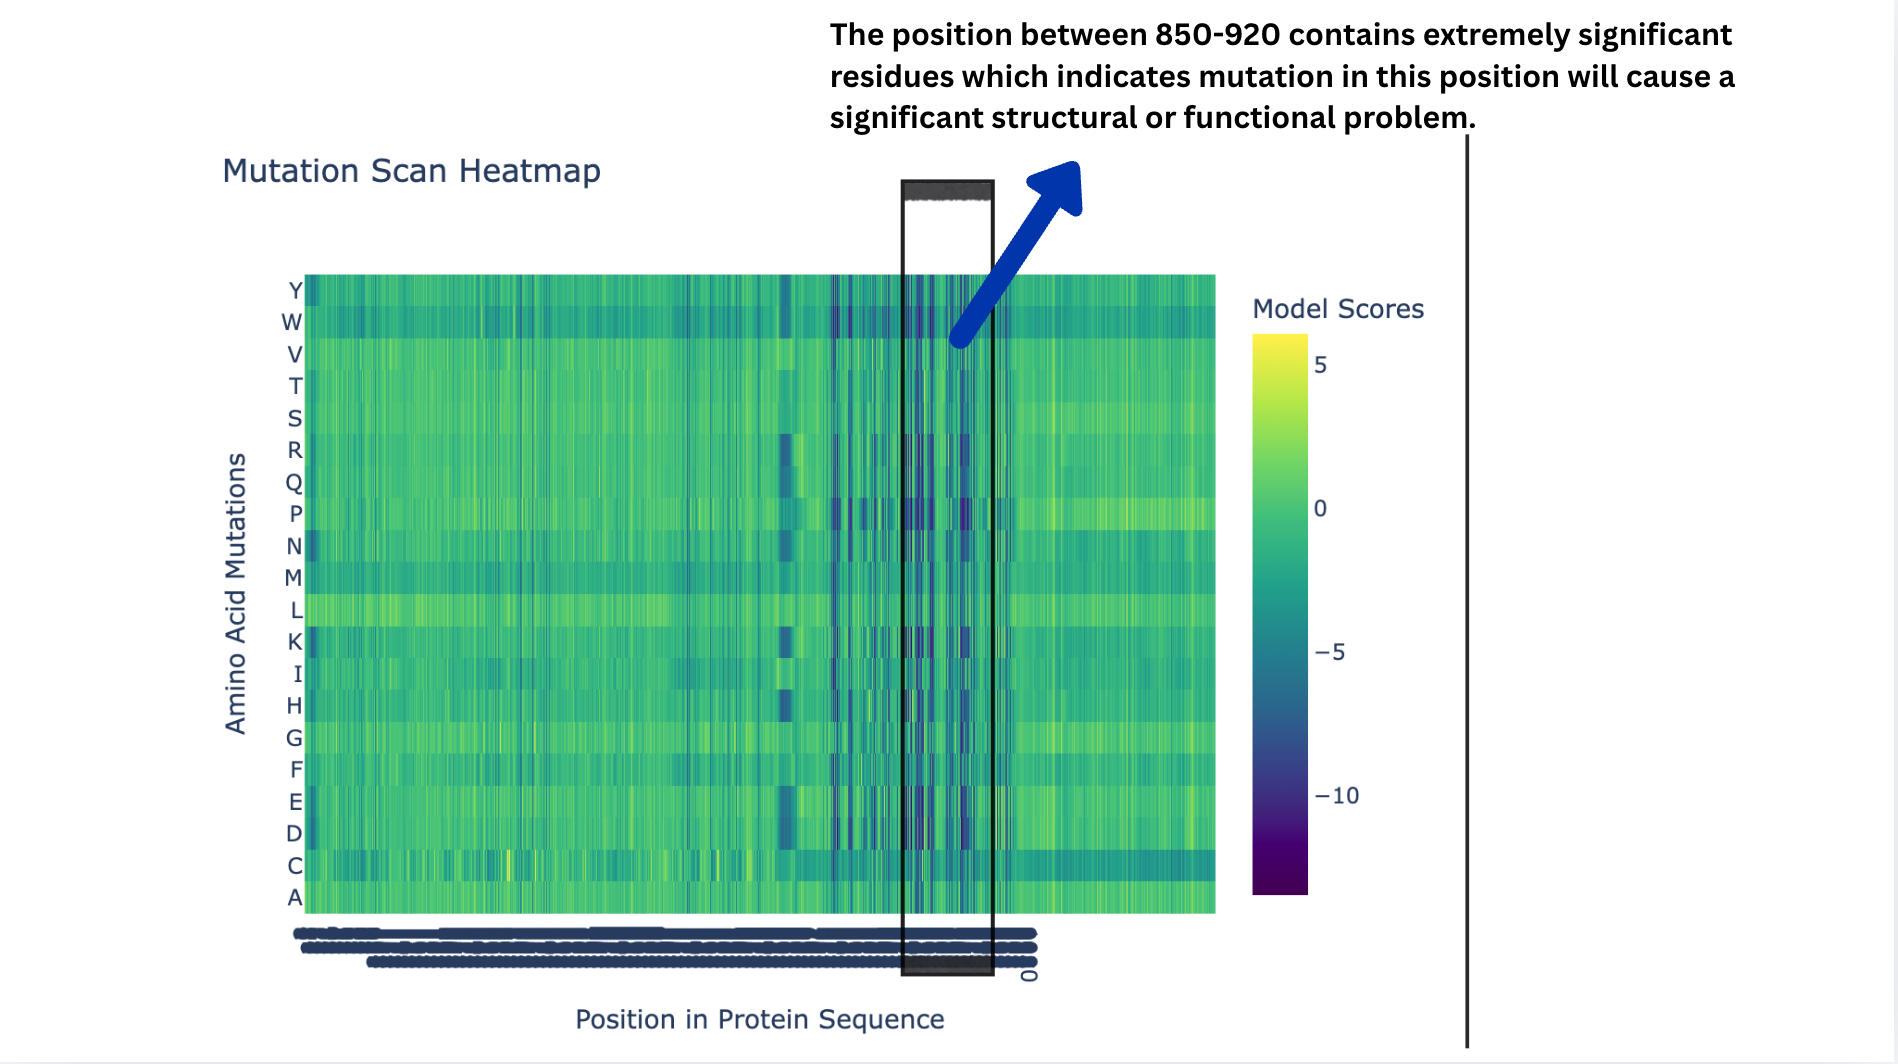
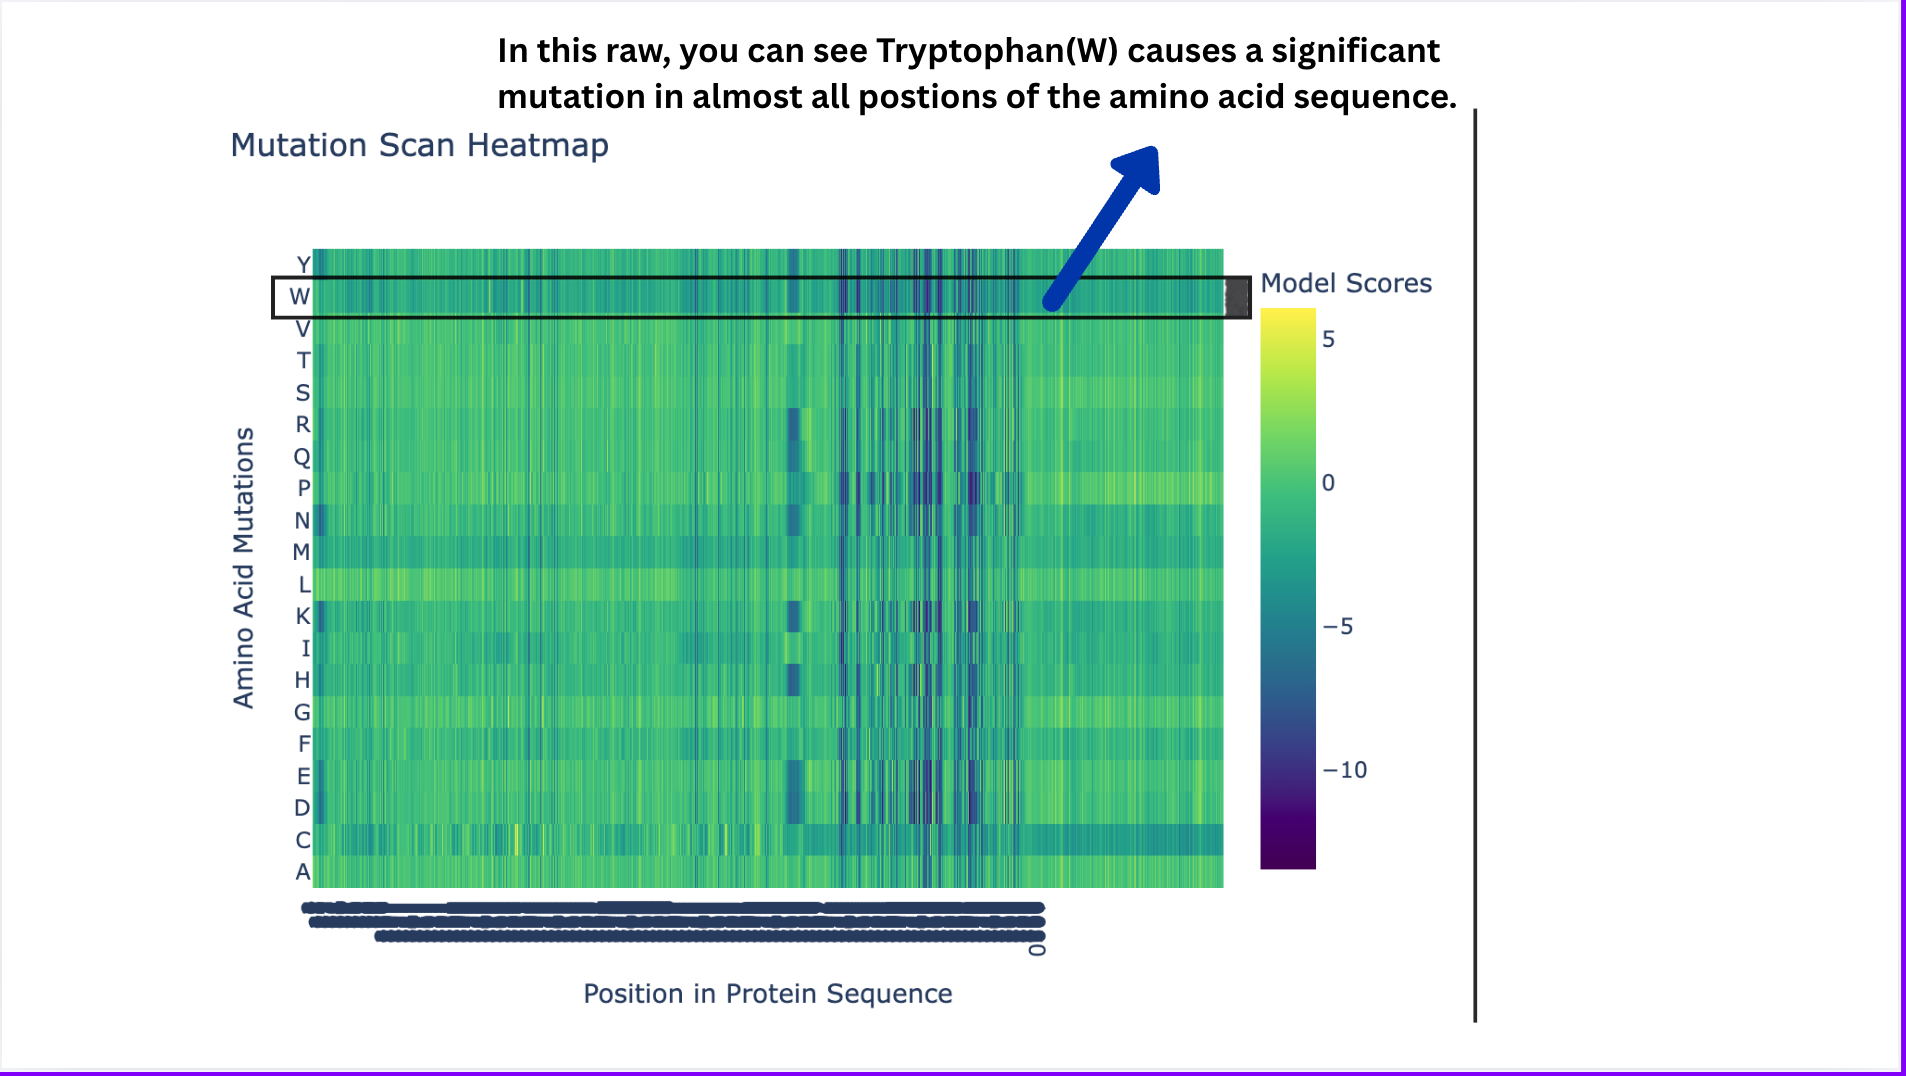
Deep Mutational Scans
Deep Mutational Scans
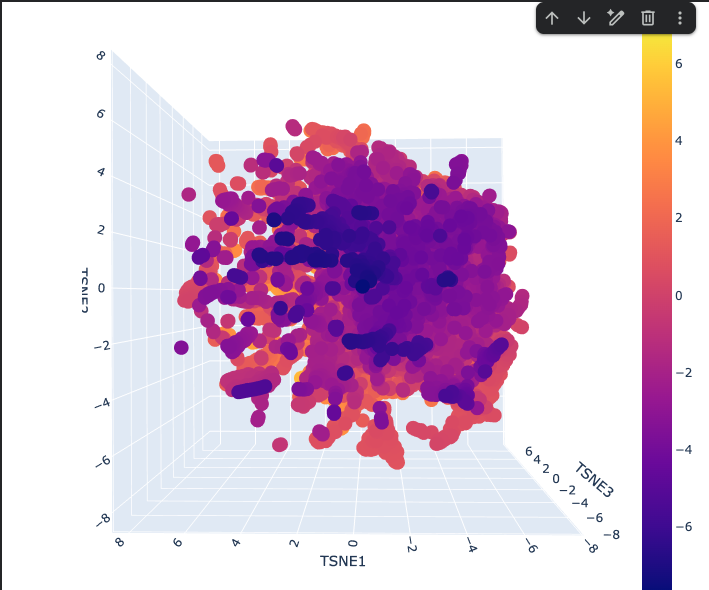
Latent Space Analysis
The Latent space analysis shows the 3D representation of different proteins. This plot is a map of protein similarity — proteins close together are similar in sequence/function/structure, the dense center contains common proteins, and the scattered edges contain unusual ones. The color encodes an additional property (likely functional or structural) layered on top of the spatial layout.
Explanation
Shape
One large continuous cloud — no hard separate clusters
Reflects that protein sequence space is smooth and gradual, not divided into distinct categories
The Dense Purple Core
Where most proteins sit
These are common, well-represented protein families that ESM2 has seen many times
The Scattered Orange/Yellow Periphery
Outlier proteins that are unusual or specialized
Score higher on whatever the colorbar is measuring (likely a biological property or cluster score ranging from -7 to +7)
The Elongated Arms
Streaks radiating outward from the core
Represent protein subfamilies that share a common origin but have diverged over evolution.
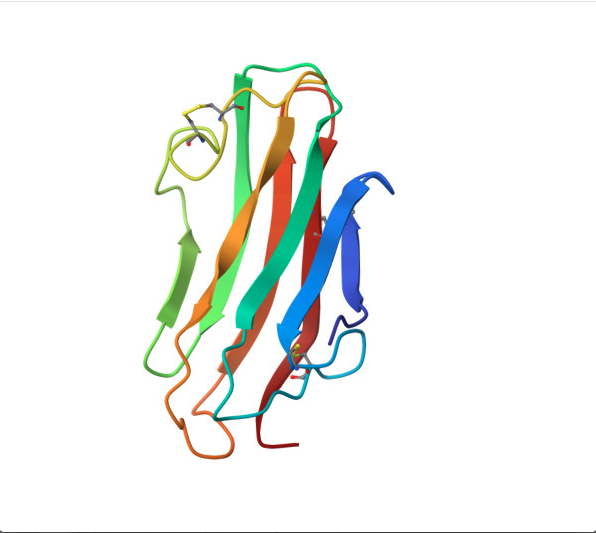
ESM fold Prediction
N.B For this section, I selected Insulin because it is relatively smaller than HER2, which kept crashing while trying to predict how it folds.
ESMFold correctly predicted the beta sheet topology of insulin, identifying the major secondary structure elements consistent with the experimental RCSB structure. However, the predicted structure is notably more extended and loosely packed, with larger irregular loops compared to the compact real structure. This discrepancy is most likely due to insulin’s three disulfide bonds between Chain A and Chain B, which ESMFold does not explicitly model; these bonds are critical for anchoring the loops and achieving the tight globular shape seen in the experimental structure. The TM-score and RMSD would quantify this difference precisely, but visually, the fold class is correct while the fine-grained packing is not.
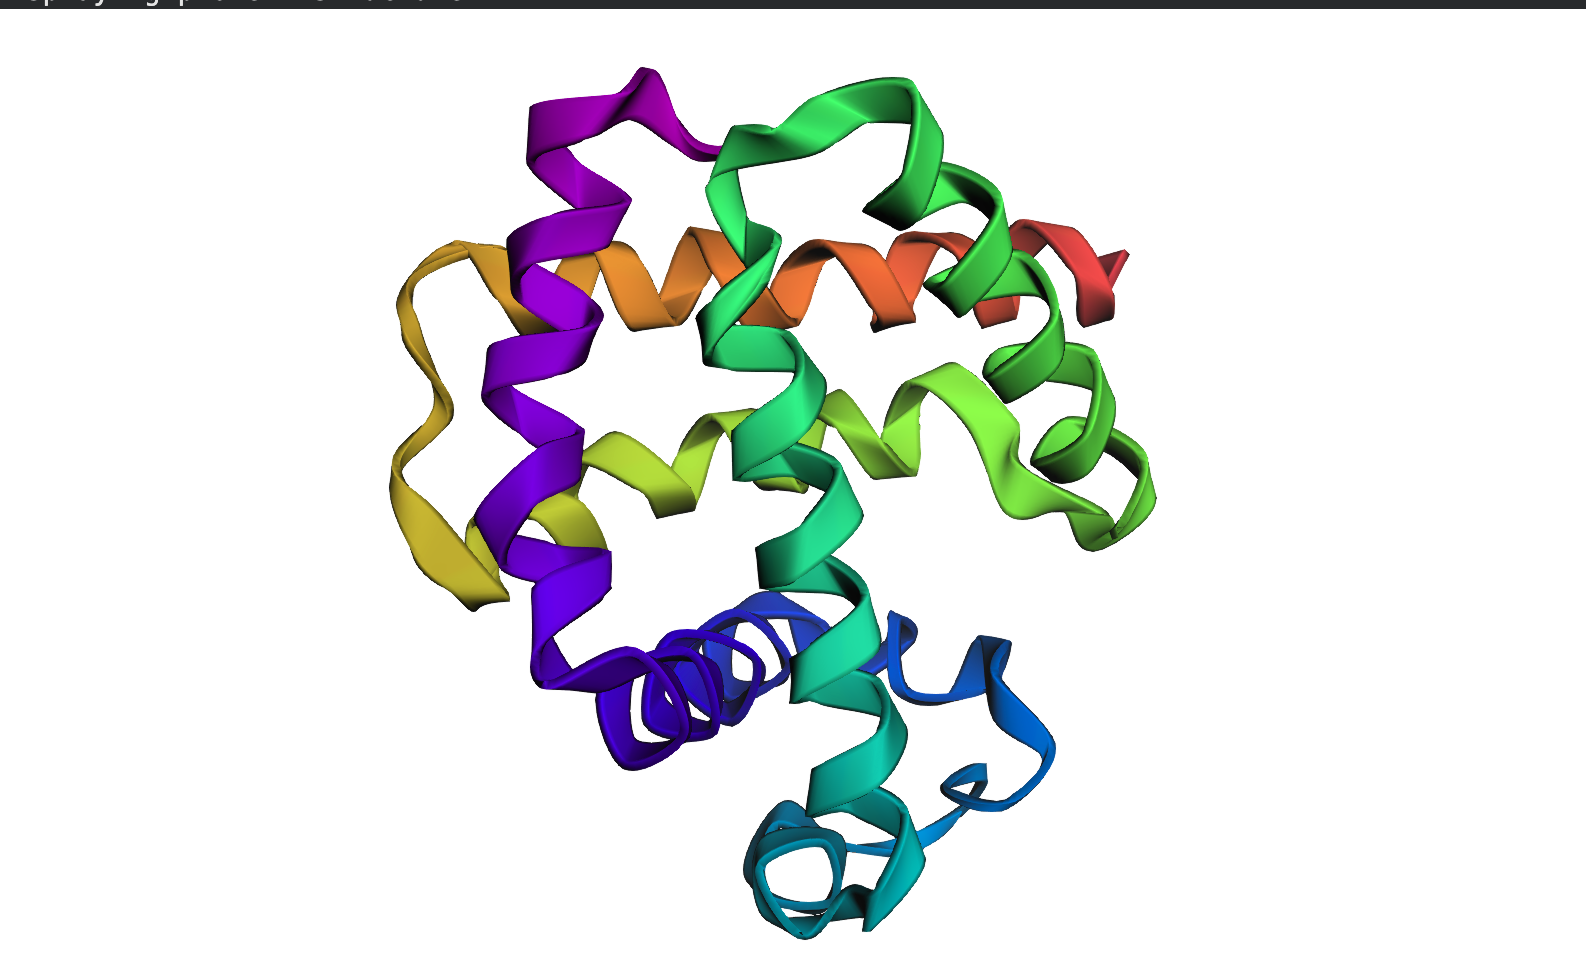
Reverse folding using ProteinMPNN.
For this part, I used the PDB file of the HER2 protein. After uploading the pdb file, a reverse folding was run, and 20 possible candidates for the actual sequence of the protein was predicted. Among the results, the one with the lowest log score was identified through manual screeing and was folded using the ESMfold model. The predicted sequence and the folded protein are attached below.
Controls how creative/diverse the designed sequence is
0.5 is moderate — balanced between staying close to original and exploring new sequences
Lower (0.1) = conservative, Higher (1.0) = very adventurous
sample = 0
This is the first designed sequence (counting starts from 0)
If you generated 10 sequences, you’d see sample=0 through sample=9
Each sample is an independent design attempt for the same backbone
score = 0.9440
Negative log likelihood — measures model confidence
Lower = better — model is very confident this sequence fits your backbone
Your score of 0.9440 is excellent — it’s below 1.0 which is better than your insulin results (1.06 and 1.08)
seq_recovery = 0.4932
49.32% of positions match the original protein sequence exactly
Roughly 1 in 2 residues is identical to the original
This is your best recovery so far — slightly higher than insulin’s ~46%
The four PepMLM-generated peptides were conditioned on the SOD1 A4V mutant sequence
with a target length of 12 amino acids, with the exception of Peptide 2, which came
out at 15 residues. Perplexity scores reflect the model’s confidence in each binder,
where a lower score indicates higher confidence. Peptide 1 (WLYGAAGVRWGX) has the
lowest perplexity at 13.06, making it the model’s most confident prediction, though
it contains an X residue at the final position, which represents an unresolved or
masked amino acid and should be noted as a potential issue before advancing it
further. Peptides 2, 3, and 4 all cluster between 17 and 20, reflecting moderate
confidence. The known binder FLYRWLPSRRGG is included as a structural and therapeutic
benchmark and does not carry a perplexity score since it was not generated by PepMLM.
Results
Peptide
Sequence
Length
Pseudo Perplexity
Source
1
WLYGAAGVRWGX
12
13.06
PepMLM
2
SRYDEYVVVVKAAKK
15
17.72
PepMLM
3
HRVYAVVVAWKK
12
19.82
PepMLM
4
WLYYAVALAWKE
12
17.93
PepMLM
5
FLYRWLPSRRGG
12
N/A
Known binder
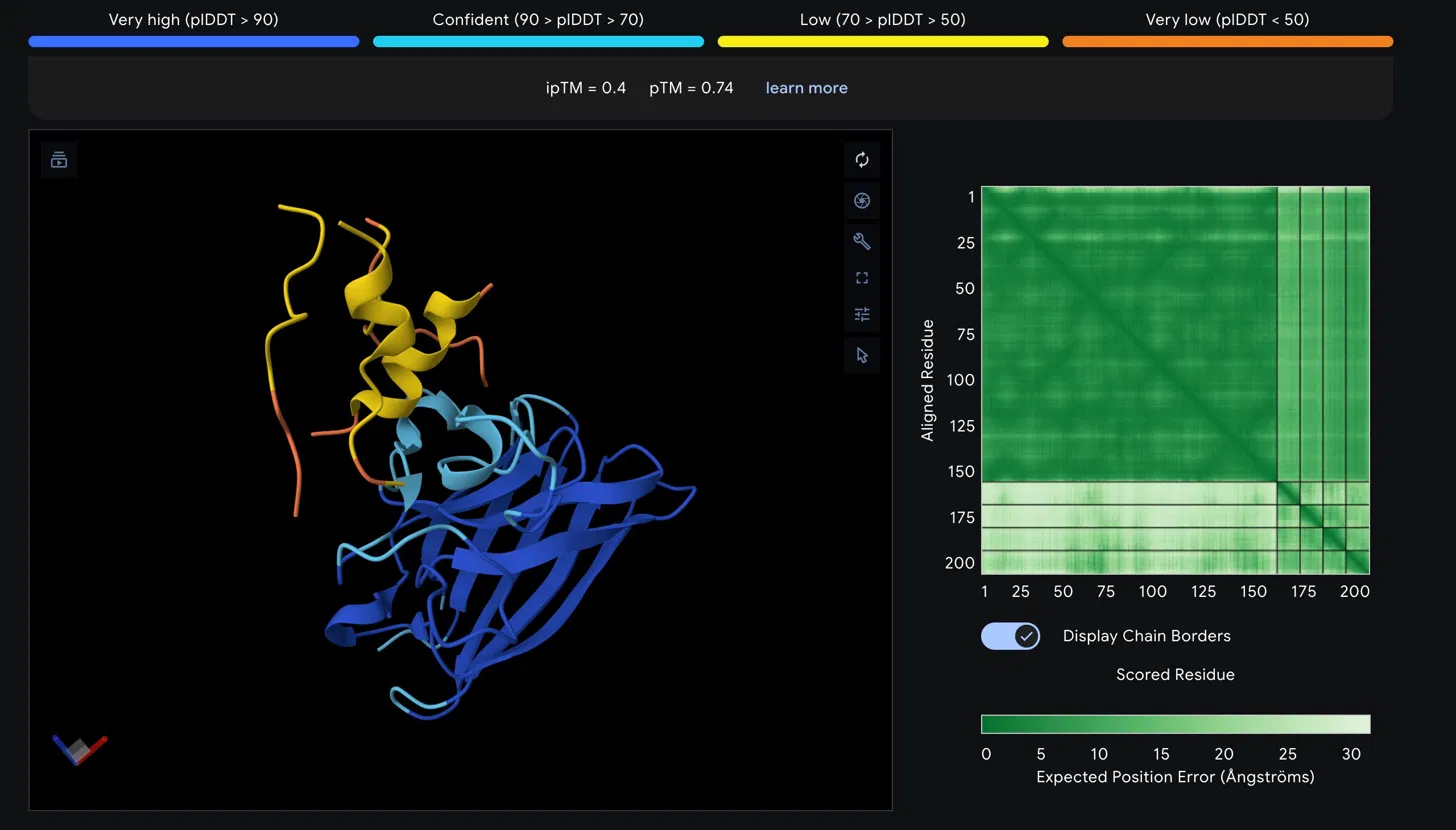
Part 2: AlphaFold3 Structural Evaluation
SOD1_A4V_Peptide
Scores
Metric
Value
Interpretation
ipTM
0.4
Low confidence interface prediction
pTM
0.74
Reasonable overall fold quality
Structural Observations
The SOD1 A4V beta-barrel is predicted with high confidence, appearing in blue and
cyan in the structure viewer, consistent with the well-characterized immunoglobulin-
like fold of SOD1. The peptide chain is rendered in yellow and orange, indicating
low to very low pLDDT confidence in its predicted conformation. The peptide appears
to associate loosely near the helical region at the top of the SOD1 structure rather
than engaging the N-terminus directly where the A4V mutation at residue 4 is located.
It does not appear to be buried at the dimer interface and is largely surface
associated.
The Predicted Aligned Error matrix supports this interpretation. The large dark
green block spanning SOD1 residues 1 to approximately 160 confirms strong internal
positional confidence within the protein. The bottom right region corresponding to
the peptide chain shows notably lighter green, indicating higher positional
uncertainty. The off-diagonal inter-chain block between SOD1 and the peptide is
also light green, reflecting weak confidence in the relative positioning of the
two chains and consistent with the low ipTM score.
Assessment
An ipTM of 0.4 falls below the 0.5 threshold typically considered meaningful for
protein-peptide interactions, suggesting this peptide does not form a confidently
predicted stable complex with SOD1 A4V. The low pLDDT of the peptide further
indicates its conformation is disordered in this predicted complex. This result
would need to be weighed against the therapeutic property predictions from
PeptiVerse before making any advancement decision.
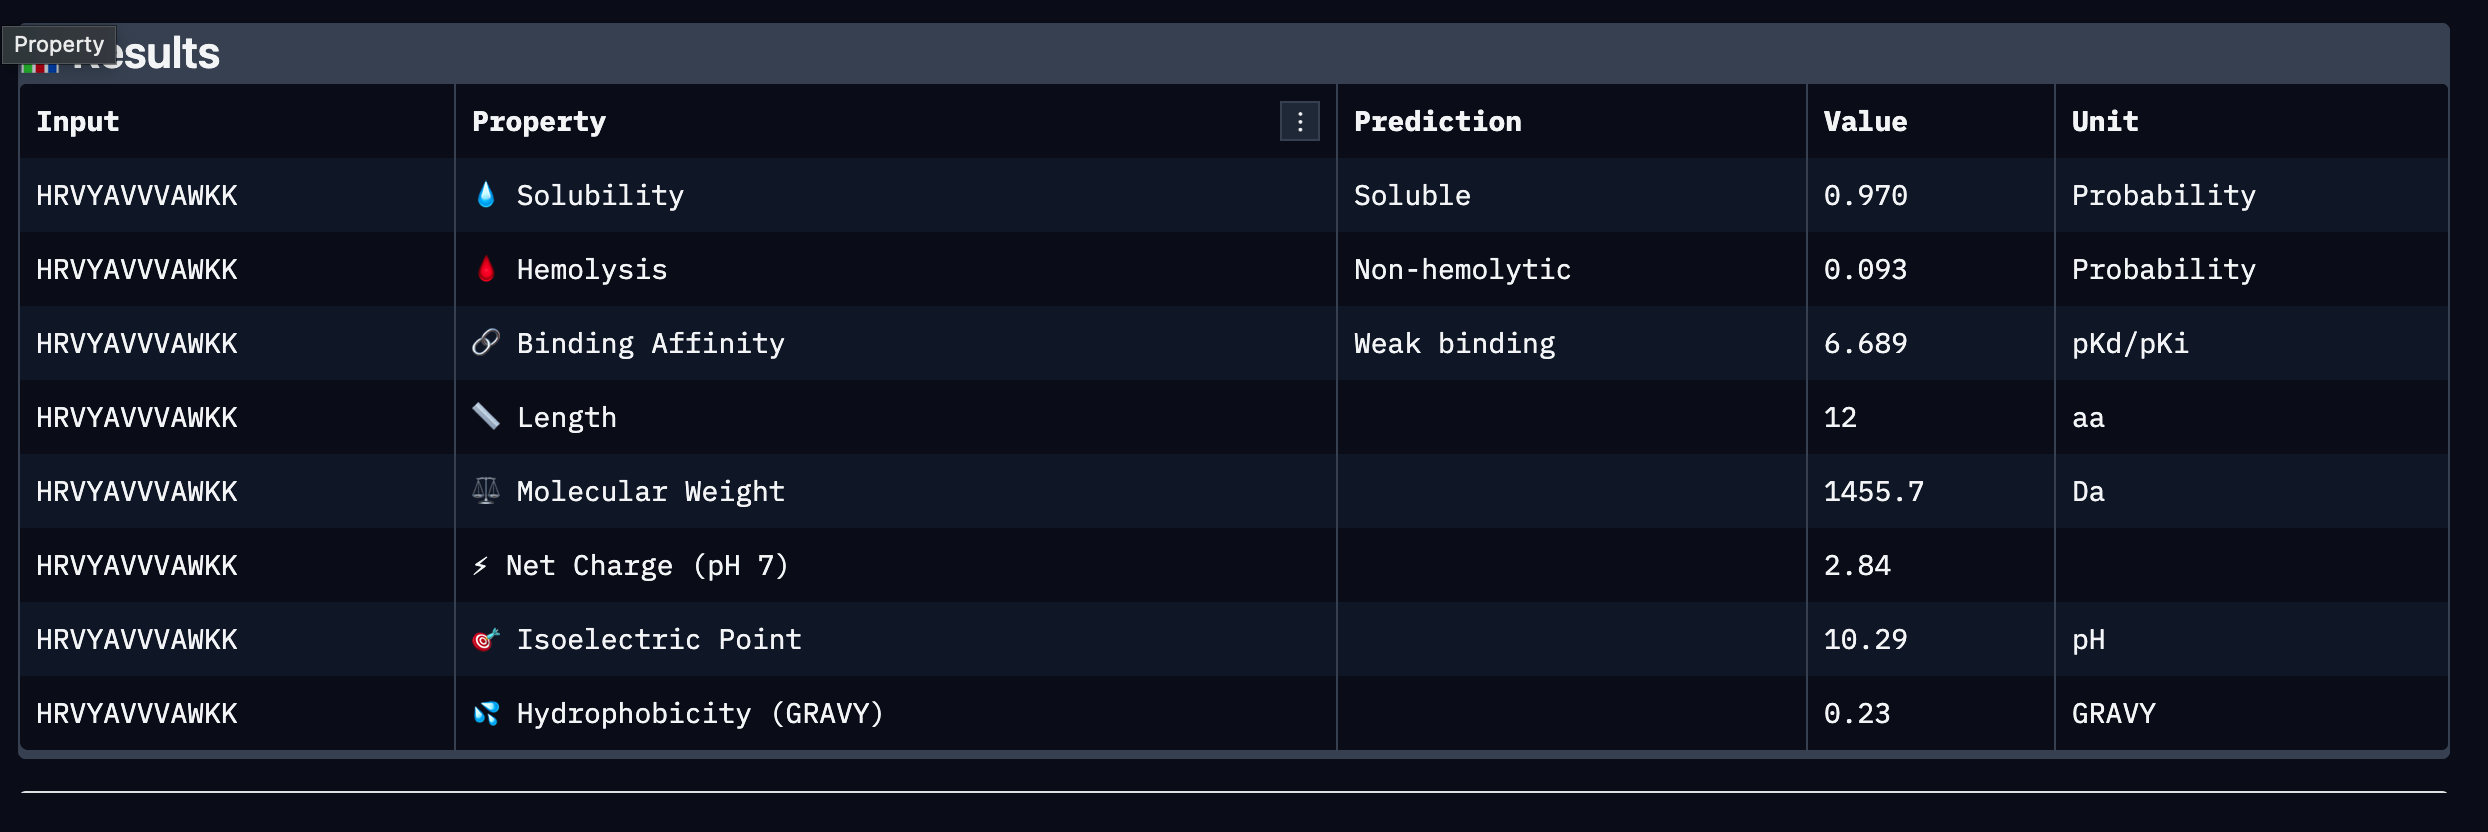
Part 3: PeptiVerse Therapeutic Property Evaluation
Results Table
Peptide
Sequence
Binding Affinity (pKd/pKi)
Solubility
Hemolysis
Net Charge (pH 7)
MW (Da)
GRAVY
1
WLYGAAGVRWGK
6.641 (Weak)
0.867 (Soluble)
0.055 (Non-hemolytic)
+1.76
1363.6
-0.09
2
SRYDEYVVVVKAAKK
6.453 (Weak)
1.000 (Soluble)
0.062 (Non-hemolytic)
+1.46
1755.0
-0.41
3
HRVYAVVVAWKK
6.689 (Weak)
0.970 (Soluble)
0.093 (Non-hemolytic)
+2.84
1455.7
+0.23
4
WLYYAVALAWKE
6.661 (Weak)
0.760 (Soluble)
0.110 (Non-hemolytic)
-0.23
1512.7
+0.45
Summary
All four PepMLM-generated peptides passed the two most critical early-stage
therapeutic thresholds: all are predicted to be soluble and non-hemolytic. This
is an encouraging baseline, as poor solubility and hemolytic activity are among
the most common reasons peptide candidates fail during preclinical screening.
However, all four peptides were classified as weak binders against SOD1 A4V,
with predicted binding affinities clustering narrowly between 6.45 and 6.69
pKd/pKi, indicating that none demonstrate strong predicted affinity for the
target under current conditions.
Comparing these results to the AlphaFold3 structural data, the low ipTM score
of 0.4 observed in Part 2 is broadly consistent with the weak binding predictions
from PeptiVerse, suggesting that neither structural nor property-based evaluation
strongly endorses any single peptide as a high confidence binder at this stage.
No peptide was predicted to be hemolytic, meaning the structural uncertainty does
not appear to stem from toxic or disruptive interactions with the target.
Among the four, Peptide 3 (HRVYAVVVAWKK) presents the strongest overall profile.
It carries the highest predicted binding affinity at 6.689 pKd/pKi, the second
highest solubility at 0.970, a low hemolysis probability at 0.093, and the highest
positive net charge at pH 7 at 2.84, which may support favorable electrostatic
interactions with SOD1 and aid membrane permeability. Its modest hydrophobicity
score of 0.23 GRAVY suggests a reasonable balance between aqueous solubility and
the hydrophobic contacts often required for stable protein binding. Peptide 2
shows perfect solubility at 1.000 and the lowest hydrophobicity, making it the
safest from an aggregation standpoint, but its binding affinity is the weakest
of the four at 6.453 pKd/pKi and its length of 15 residues may introduce
additional pharmacokinetic challenges.
Peptide Selected for Advancement
Peptide 3: HRVYAVVVAWKK
Peptide 3 is selected for advancement based on its combination of the highest
predicted binding affinity among the four candidates, high solubility, low
hemolytic risk, and a positively charged character at physiological pH that is
consistent with favorable interactions at the SOD1 surface. While all peptides
in this set are classified as weak binders and further optimization would be
required, Peptide 3 represents the strongest starting point for motif-guided
redesign using moPPIt in Part 4. Its valine-rich hydrophobic core may also
provide a useful scaffold for introducing targeted contacts at the A4V mutation
site or dimer interface.
week-06-hw-genetic-circuits-part-ii
Part - 1
What are some components in the Phusion High-Fidelity PCR Master Mix, and what is their purpose?
Phusion High-Fidelity PCR Master Mix, commonly produced by Thermo Fisher Scientific, contains a high-fidelity DNA polymerase with proofreading ability, a reaction buffer that maintains optimal conditions, Mg²⁺ ions as a cofactor, dNTPs as building blocks, and stabilizing additives. Together, these components enable accurate and efficient DNA amplification with a low error rate.
What are some factors that determine primer annealing temperature during PCR?
Primer annealing temperature in PCR is mainly determined by the melting temperature of the primers, which depends on their length and GC content. Higher GC content and longer primers increase the melting temperature, leading to a higher annealing temperature, while mismatches and low salt conditions can reduce it.
There are two methods from this class that create linear fragments of DNA: PCR, and restriction enzyme digests. Compare and contrast these two methods, both in terms of protocol as well as when one may be preferable to use over the other.
PCR and restriction enzyme digestion both generate linear DNA fragments but differ fundamentally in approach. PCR amplifies DNA from a template using a polymerase and primers, making it ideal when starting material is limited or when sequence modifications are needed, while restriction digestion cuts existing DNA at specific sequences using enzymes, making it preferable when precise, predefined sites are available and no amplification is required.
How can you ensure that the DNA sequences that you have digested and PCR-ed will be appropriate for Gibson cloning?
PCR and restriction enzyme digestion both generate linear DNA fragments, but differ fundamentally in approach. PCR amplifies DNA from a template using a polymerase and primers, making it ideal when the starting material is limited or when sequence modifications are needed, while restriction digestion cuts existing DNA at specific sequences using enzymes, making it preferable when precise, predefined sites are available, and no amplification is required.
How does the plasmid DNA enter the E. coli cells during transformation?
To ensure DNA fragments are suitable for Gibson Assembly, the sequences must be designed with overlapping ends of about 20 to 40 base pairs that are complementary between adjacent fragments. These overlaps must have appropriate melting temperatures and correct sequence alignment so that the fragments can anneal properly and be joined seamlessly.
Describe another assembly method in detail (such as Golden Gate Assembly)
Explain the other method in 5 - 7 sentences plus diagrams (either handmade or online).
Golden Gate Assembly works by repeatedly cycling between digestion and ligation in one reaction mixture containing DNA fragments, a Type IIS enzyme, and ligase. The enzyme cuts to create specific overhangs, fragments anneal based on complementary ends, and ligase seals them together. Because the recognition sites are eliminated after cutting, correctly assembled products accumulate over time. This enables efficient and accurate multi-fragment assembly without leaving extra sequences between parts. The method is widely used in synthetic biology for building complex constructs.
Part - 2 Asimov Kernel
Homework Documentation: Genetic Circuit Design in Asimov Kernel
Overview
This notebook documents my work exploring genetic circuit design using Asimov Kernel,
a cloud based computer aided design platform for synthetic biology. The assignment
involved exploring existing bacterial circuit demos, recreating the Repressilator
circuit, and designing three original genetic constructs using characterized bacterial
parts.
Part 1: Exploring the Bacterial Demos Repository
I began by navigating to the Bacterial Demos repository within Asimov Kernel to
understand how genetic parts work together in a functional circuit. I opened several
example constructs and ran the simulator on each one to observe how different
arrangements of promoters, repressors, and reporter genes produce different behaviors
over time. I read the Info panel for each example to understand the design logic
behind each circuit.
Key Observations:
Promoters control when and how strongly a gene is expressed
Repressors suppress gene expression when they bind to a promoter
The simulator outputs protein concentration over time, allowing visualization of
whether a circuit oscillates, stays stable, or switches between states
Part 2: Recreating the Repressilator
What the Repressilator Is
The Repressilator is one of the first synthetic genetic circuits ever engineered,
originally designed by Michael Elowitz and Stanislas Leibler in 2000. It consists
of three repressor genes arranged in a loop, where each gene produces a protein
that suppresses the next gene in the sequence. This creates an oscillating pattern
of gene expression, similar to a biological clock.
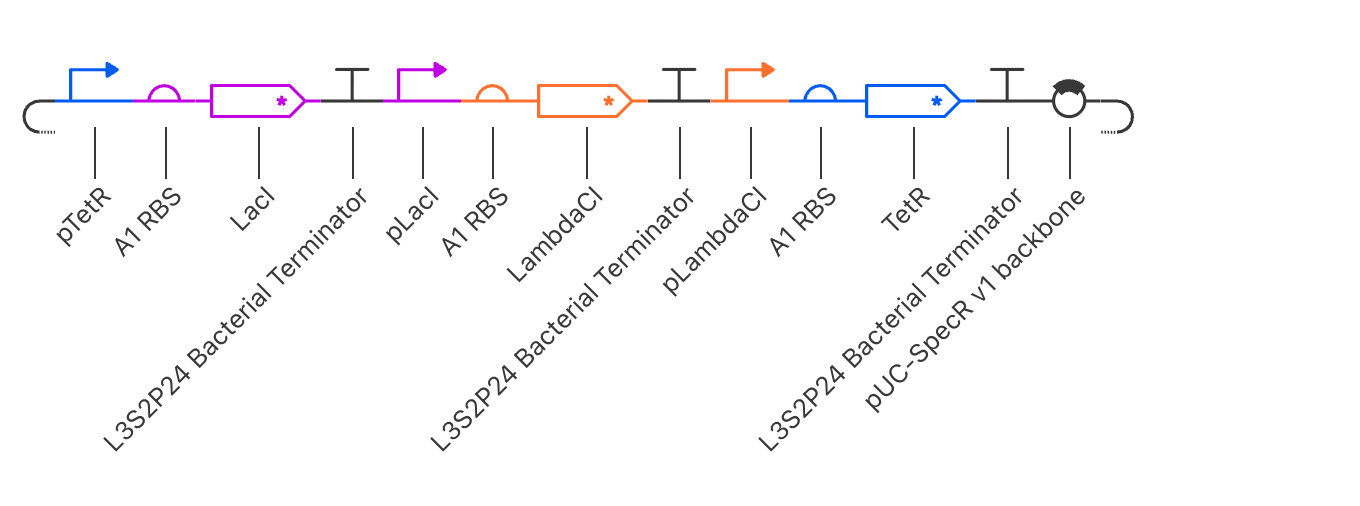
Parts Used
The construct was assembled in the following order using parts from the Characterized
Bacterial Parts repository:
Order
Part
Function
1
pTetR
Promoter suppressed by TetR protein
2
A1 RBS
Ribosome binding site enabling translation
3
LacI
Repressor gene, produces LacI protein
4
L3S2P24 Bacterial Terminator
Ends transcription of this unit
5
pLacI
Promoter suppressed by LacI protein
6
A1 RBS
Ribosome binding site
7
LambdaCI
Repressor gene, produces LambdaCI protein
8
L3S2P24 Bacterial Terminator
Ends transcription of this unit
9
pLambdaCI
Promoter suppressed by LambdaCI protein
10
A1 RBS
Ribosome binding site
11
TetR
Repressor gene, produces TetR protein
12
L3S2P24 Bacterial Terminator
Ends transcription of this unit
13
pUC-SpecR v1 backbone
Plasmid backbone
How the Circuit Works
The three repressors suppress each other in a cycle:
TetR suppresses LacI production
LacI suppresses LambdaCI production
LambdaCI suppresses TetR production
Because each repressor takes time to build up and degrade, the genes take turns
being active, producing a rhythmic oscillating wave pattern in protein concentration
over time.
Simulator Settings
Simulation duration: 168 hours
Time step: 0.1 hours
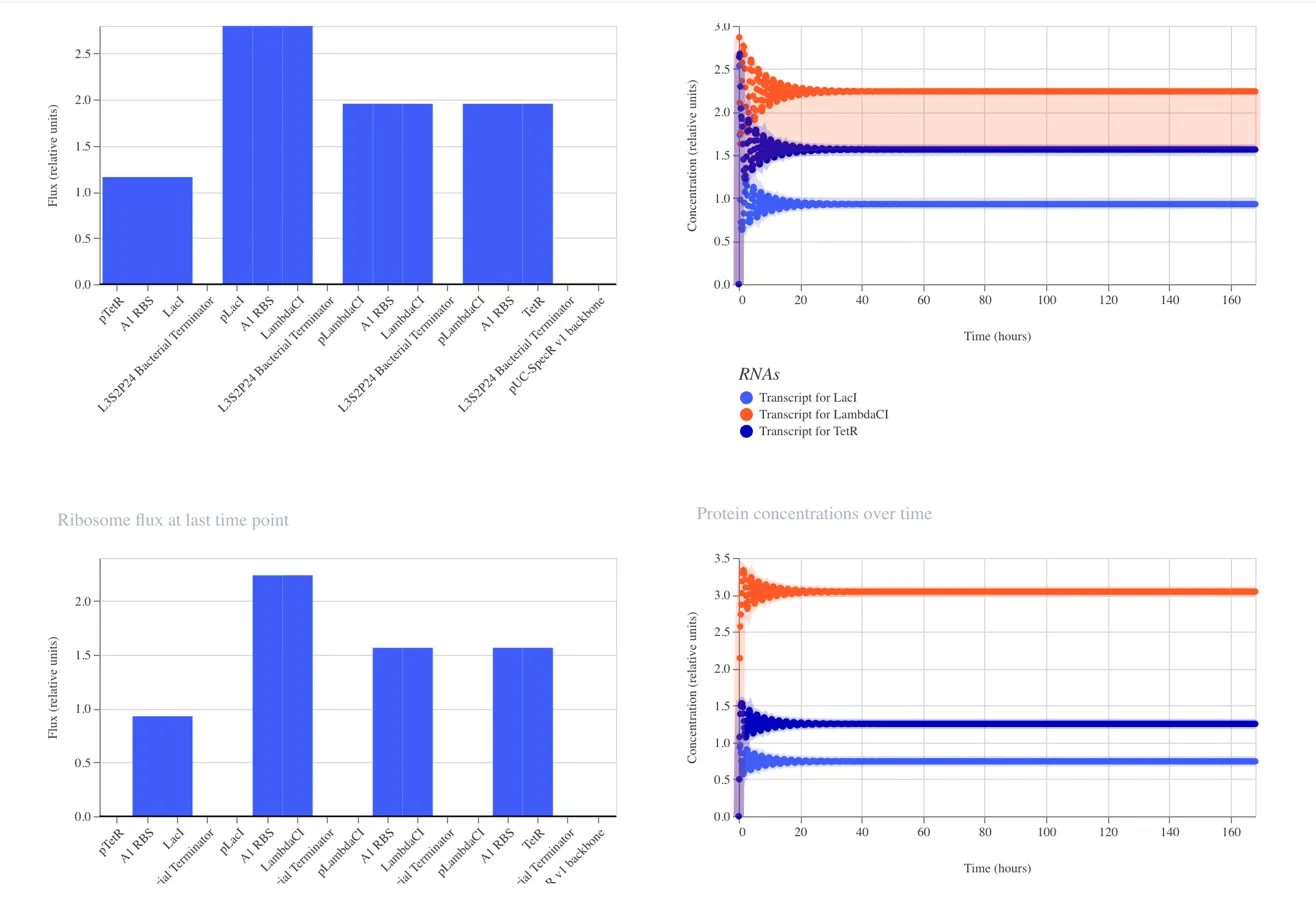
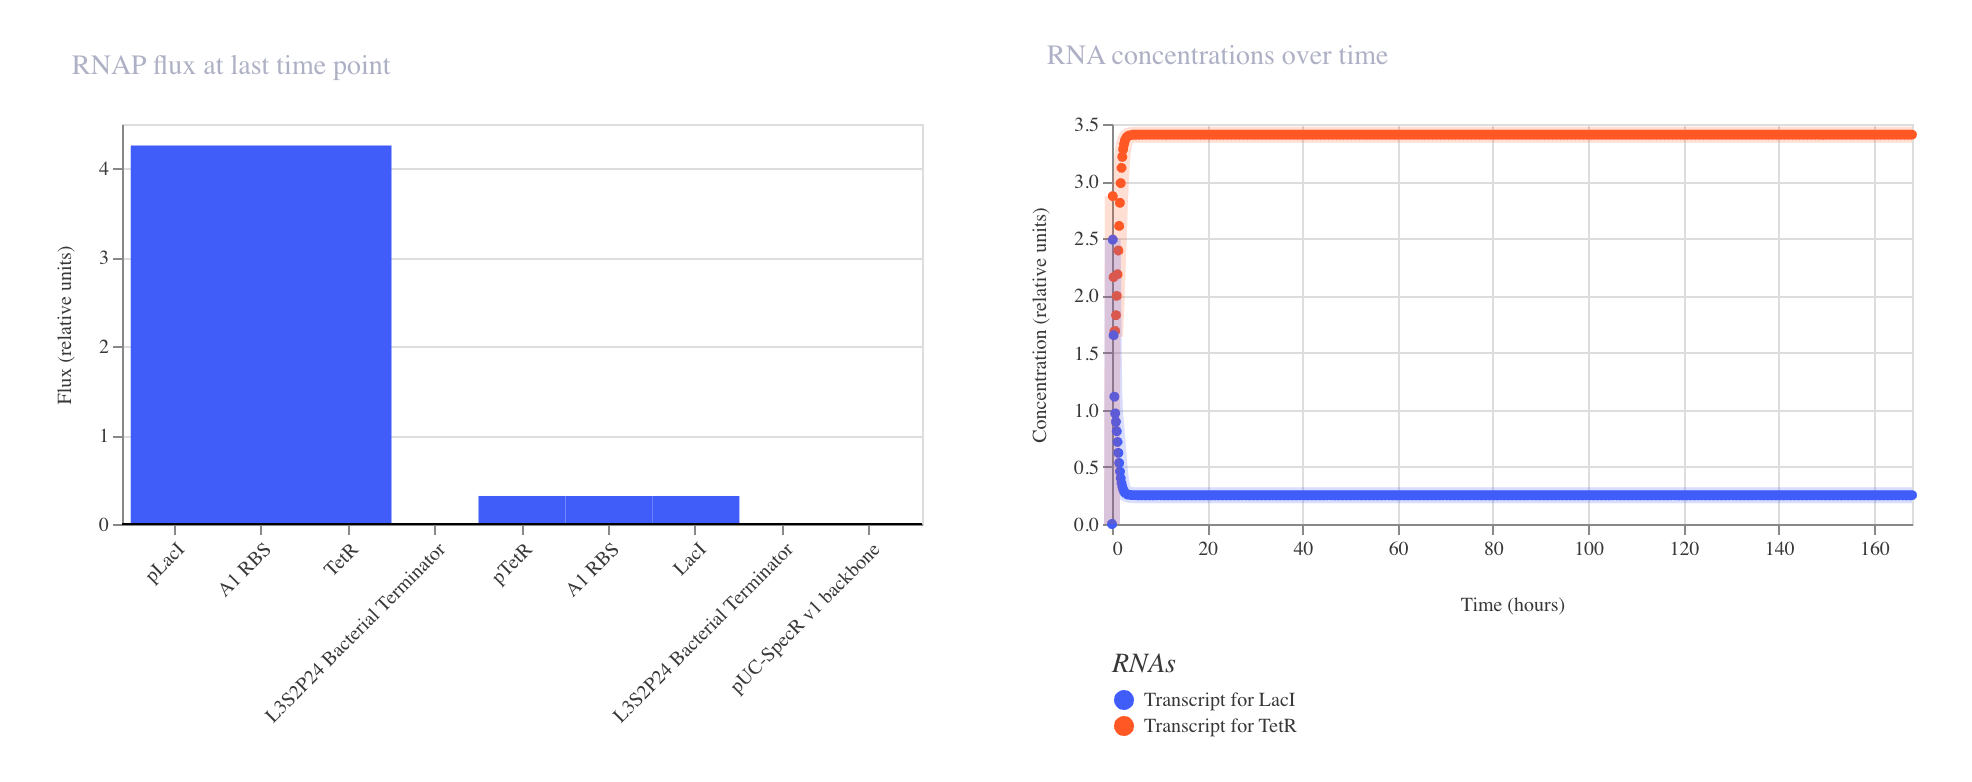
Results
Interpreting the Results
RNA Concentrations Over Time (top right graph)
The graph shows the transcript levels for all three repressor genes over 168 hours:
Light blue: Transcript for LacI
Orange: Transcript for LambdaCI
Dark blue: Transcript for TetR
All three transcripts begin with sharp fluctuations in the first 0 to 20 hours
as the system initializes, before settling into stable steady state concentrations.
LambdaCI transcript stabilizes at the highest level at approximately 2.25 relative
units, TetR stabilizes at approximately 1.6 relative units, and LacI stabilizes
at approximately 1.0 relative units.
Protein Concentrations Over Time (bottom right graph)
The protein concentration graph mirrors the RNA behavior. LambdaCI protein reaches
the highest steady state concentration at approximately 3.1 relative units, TetR
stabilizes at approximately 1.3 relative units, and LacI stabilizes at approximately
0.75 relative units.
RNA Polymerase Flux (top left bar chart)
The bar chart shows the RNA polymerase flux at the last time point across all parts
in the construct. LambdaCI shows the highest flux at approximately 2.75 relative
units, reflecting its strong expression in this circuit.
Ribosome Flux (bottom left bar chart)
The ribosome flux chart confirms translation activity across all three coding
sequences, with LambdaCI again showing the highest ribosome engagement.
Why the Results Do Not Show Classic Oscillation
The simulator output shows the system reaching a steady state rather than producing
the expected oscillating wave pattern. This can occur because:
The relative strengths of the three promoters are not perfectly balanced,
causing one repressor to dominate and suppress the others into a fixed state
The degradation rates of the repressor proteins may be too low relative to
their production rates, preventing the cycling behavior from emerging
The specific parts used may have expression levels that push the circuit into
a stable equilibrium rather than a dynamic oscillation
To recover oscillatory behavior, simulator adjustments such as increasing protein
degradation rates or balancing promoter strengths could be explored in future runs.
Part 3: Original Constructs
Homework Documentation: Genetic Circuit Design in Asimov Kernel
Overview
This notebook documents my work exploring genetic circuit design using Asimov Kernel,
a cloud based computer aided design platform for synthetic biology. The assignment
involved exploring existing bacterial circuit demos, recreating the Repressilator
circuit, and designing three original genetic constructs using characterized bacterial
parts.
Part 1: Exploring the Bacterial Demos Repository
I began by navigating to the Bacterial Demos repository within Asimov Kernel to
understand how genetic parts work together in a functional circuit. I opened several
example constructs and ran the simulator on each one to observe how different
arrangements of promoters, repressors, and reporter genes produce different behaviors
over time.
Key Observations:
Promoters control when and how strongly a gene is expressed
Repressors suppress gene expression when they bind to a promoter
The simulator outputs protein concentration over time, allowing visualization of
whether a circuit oscillates, stays stable, or switches between states
Part 2: Recreating the Repressilator
What the Repressilator Is
The Repressilator is one of the first synthetic genetic circuits ever engineered,
originally designed by Michael Elowitz and Stanislas Leibler in 2000. It consists
of three repressor genes arranged in a loop, where each gene produces a protein
that suppresses the next gene in the sequence. This creates an oscillating pattern
of gene expression, similar to a biological clock.
Parts Used
Order
Part
Function
1
pTetR
Promoter suppressed by TetR protein
2
A1 RBS
Ribosome binding site enabling translation
3
LacI
Repressor gene, produces LacI protein
4
L3S2P24 Bacterial Terminator
Ends transcription of this unit
5
pLacI
Promoter suppressed by LacI protein
6
A1 RBS
Ribosome binding site
7
LambdaCI
Repressor gene, produces LambdaCI protein
8
L3S2P24 Bacterial Terminator
Ends transcription of this unit
9
pLambdaCI
Promoter suppressed by LambdaCI protein
10
A1 RBS
Ribosome binding site
11
TetR
Repressor gene, produces TetR protein
12
L3S2P24 Bacterial Terminator
Ends transcription of this unit
13
pUC-SpecR v1 backbone
Plasmid backbone
How the Circuit Works
The three repressors suppress each other in a cycle:
TetR suppresses LacI production
LacI suppresses LambdaCI production
LambdaCI suppresses TetR production
Simulator Settings
Simulation duration: 168 hours
Time step: 0.1 hours
Results
Discussion
The simulator output showed the system reaching a steady state rather than producing
the expected oscillating wave pattern. LambdaCI dominated with the highest transcript
and protein concentrations, while LacI remained at the lowest level. This likely
occurred because the relative expression strengths of the three promoters are not
perfectly balanced, causing one repressor to dominate and lock the circuit into a
fixed state rather than allowing the cyclic turnover required for oscillation.
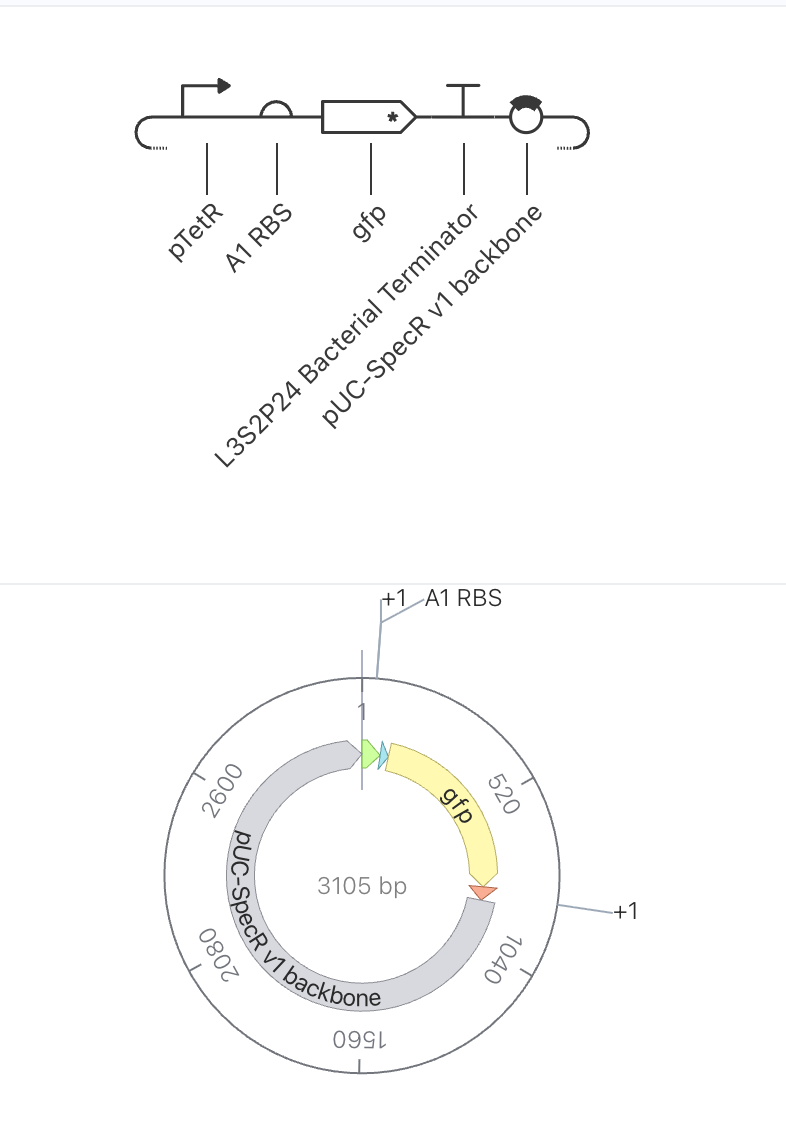
Part 3: Original Constructs
Construct 1: Constitutive GFP Expression Under pTetR
Parts Used
Order
Part
Function
1
pTetR
Promoter suppressed by TetR protein
2
A1 RBS
Ribosome binding site
3
gfp
Green fluorescent reporter gene
4
L3S2P24 Bacterial Terminator
Ends transcription
5
pUC-SpecR v1 backbone
Plasmid backbone (3105 bp total)
Design Rationale
This is the simplest possible circuit, consisting of a single gene expression unit.
GFP is placed under the control of the pTetR promoter. Since no TetR protein is
present anywhere in this construct to suppress the promoter, GFP expression should
proceed freely. This circuit serves as a baseline to understand what unregulated
reporter expression looks like before introducing any repressor logic.
Expected Behavior
With no repressor present to suppress pTetR, GFP should be continuously produced,
resulting in a steadily rising concentration that plateaus at a stable high level
once production and degradation reach equilibrium.
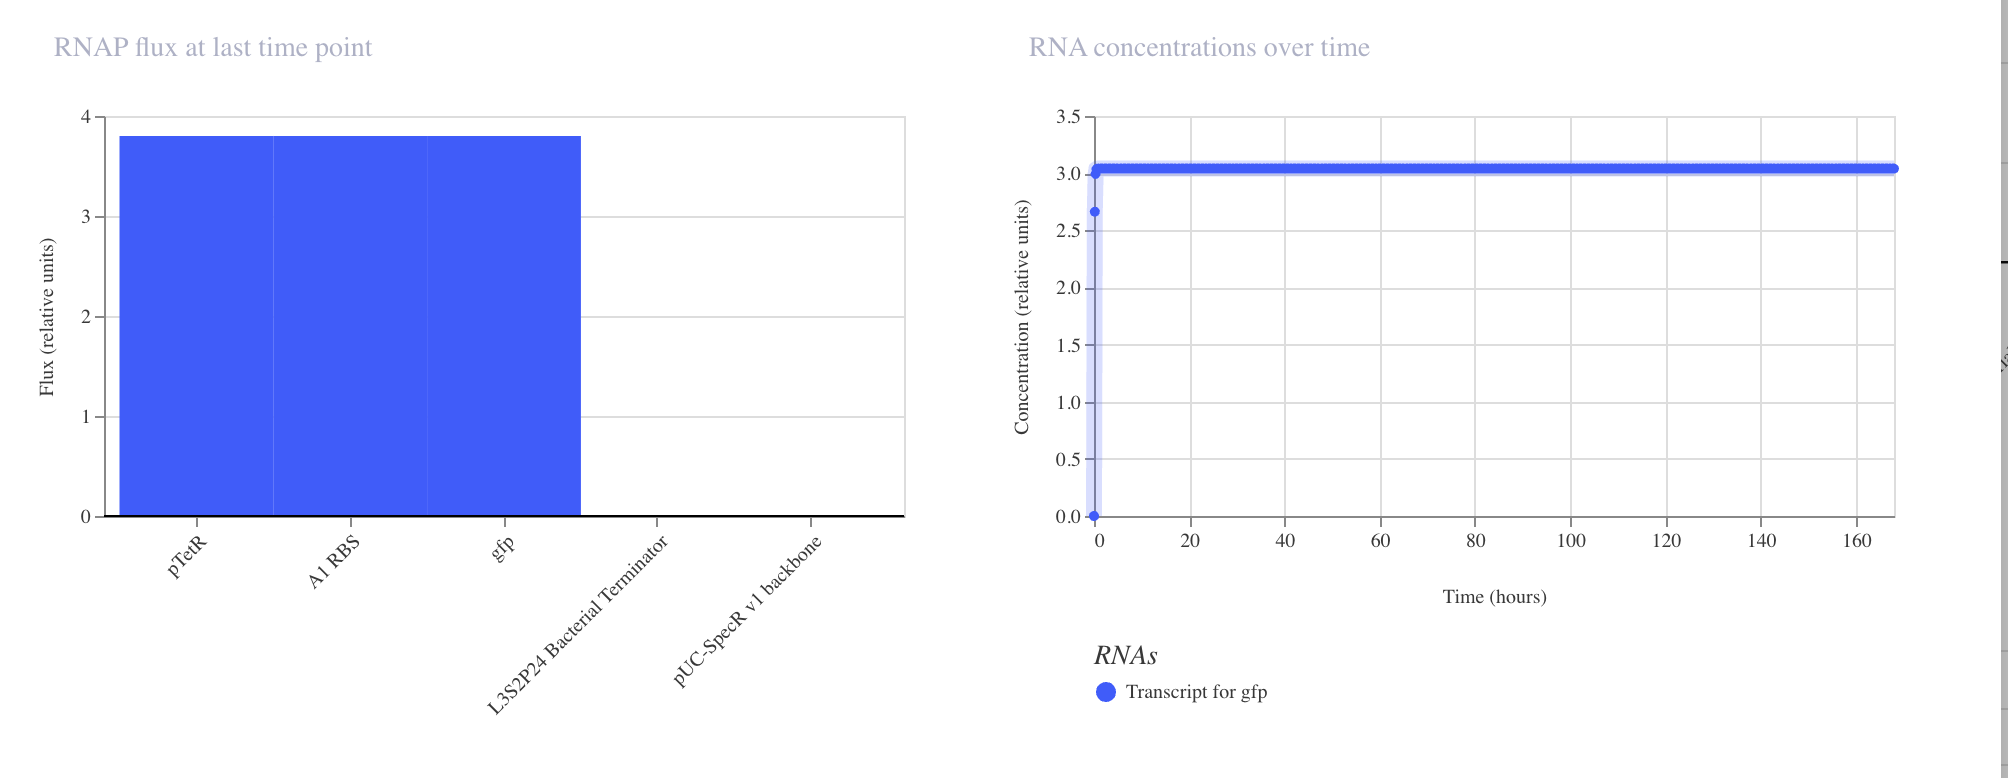
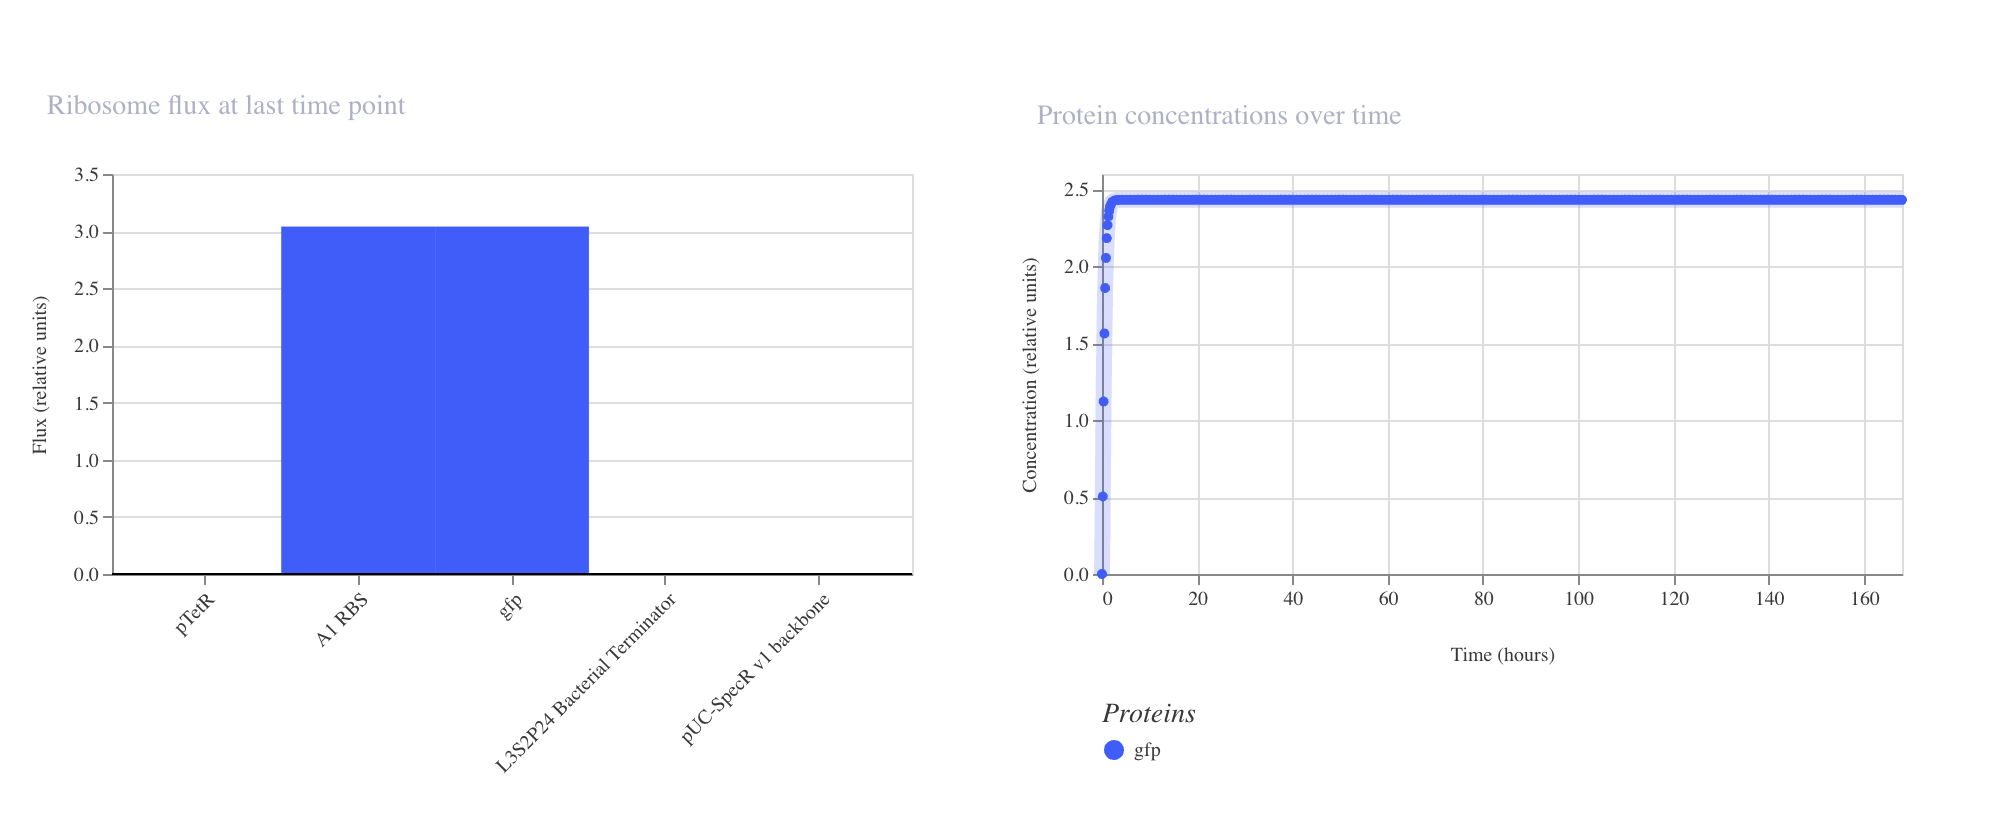
Simulator Results
Discussion
The results matched expectations precisely. The RNAP flux chart confirmed high and
uniform transcriptional activity across pTetR, A1 RBS, and gfp, all registering
at approximately 3.8 relative units. The RNA concentration graph showed the gfp
transcript rising sharply within the first few hours and stabilizing at approximately
3.0 relative units, where it remained constant across the full 168 hour simulation.
The protein concentration graph mirrored this behavior, with GFP accumulating
rapidly in the first 5 to 10 hours before plateauing at approximately 2.4 relative
units. This confirms that in the absence of any repressor, the pTetR promoter drives
strong and stable constitutive expression, which is consistent with its design as a
repressible rather than an independently active promoter.
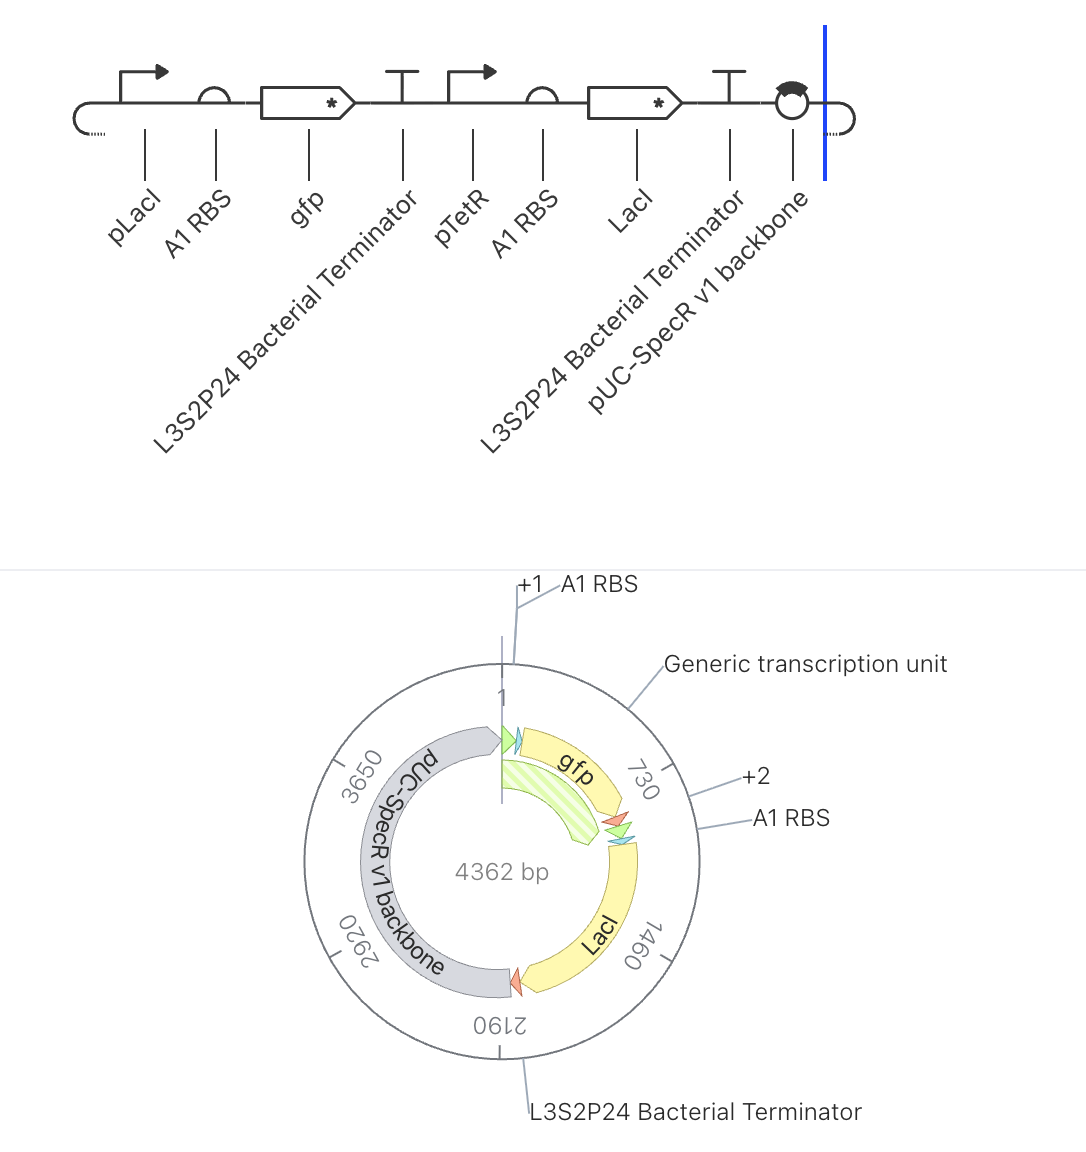
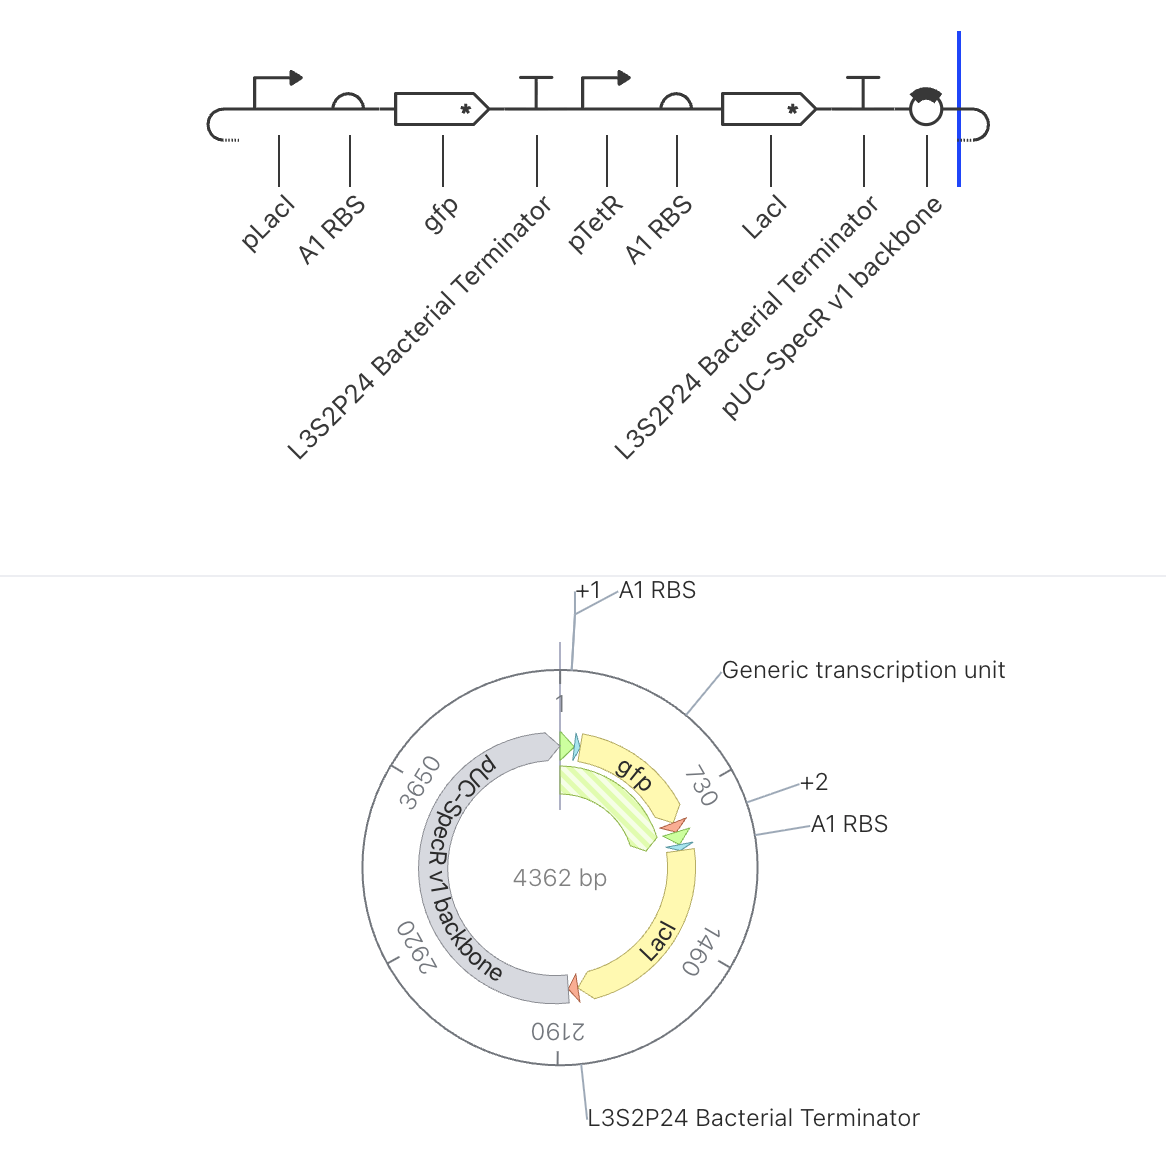
Construct 2: Single Repressor Switch with GFP Reporter
Parts Used
Order
Part
Function
1
pLacI
Promoter suppressed by LacI protein
2
A1 RBS
Ribosome binding site
3
gfp
Green fluorescent reporter gene
4
L3S2P24 Bacterial Terminator
Ends transcription
5
pTetR
Promoter suppressed by TetR protein
6
A1 RBS
Ribosome binding site
7
LacI
Repressor gene, produces LacI protein
8
L3S2P24 Bacterial Terminator
Ends transcription
9
pUC-SpecR v1 backbone
Plasmid backbone (4362 bp total)
Design Rationale
This circuit introduces a single layer of repression to control GFP output. LacI
is freely produced from the second unit under pTetR control since no TetR is
present to suppress it. That LacI protein then binds to pLacI in the first unit,
suppressing GFP expression. This creates a simple inverter where high LacI drives
low GFP output.
Expected Behavior
LacI should accumulate at a high stable concentration while GFP remains suppressed
at a low level, demonstrating how one gene can directly switch another off.
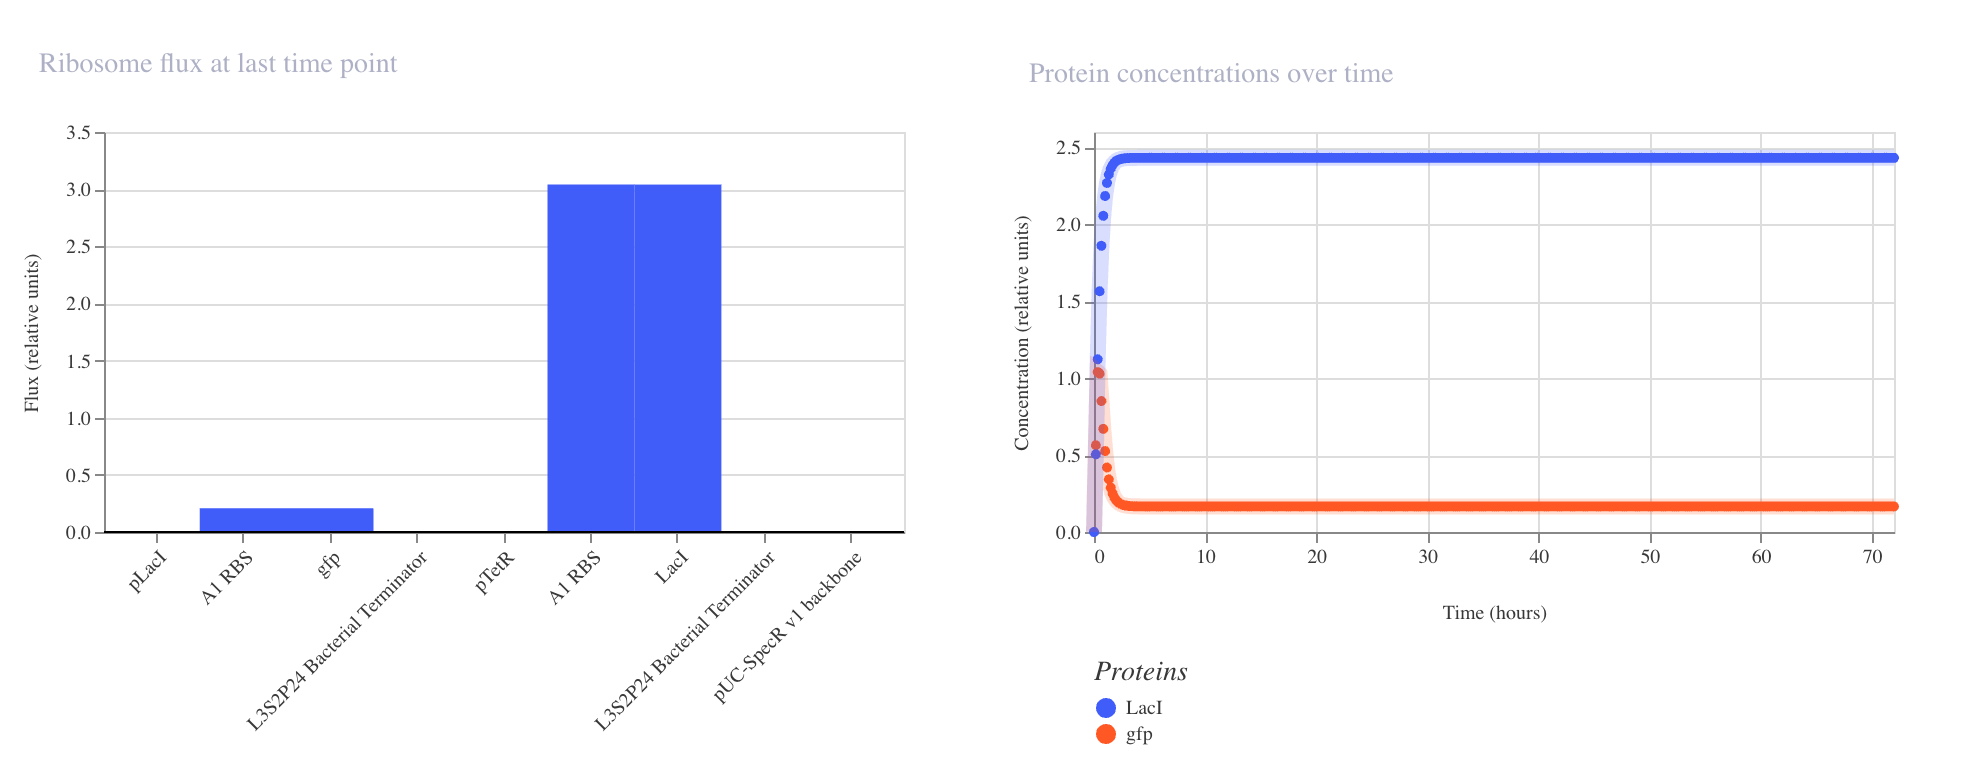
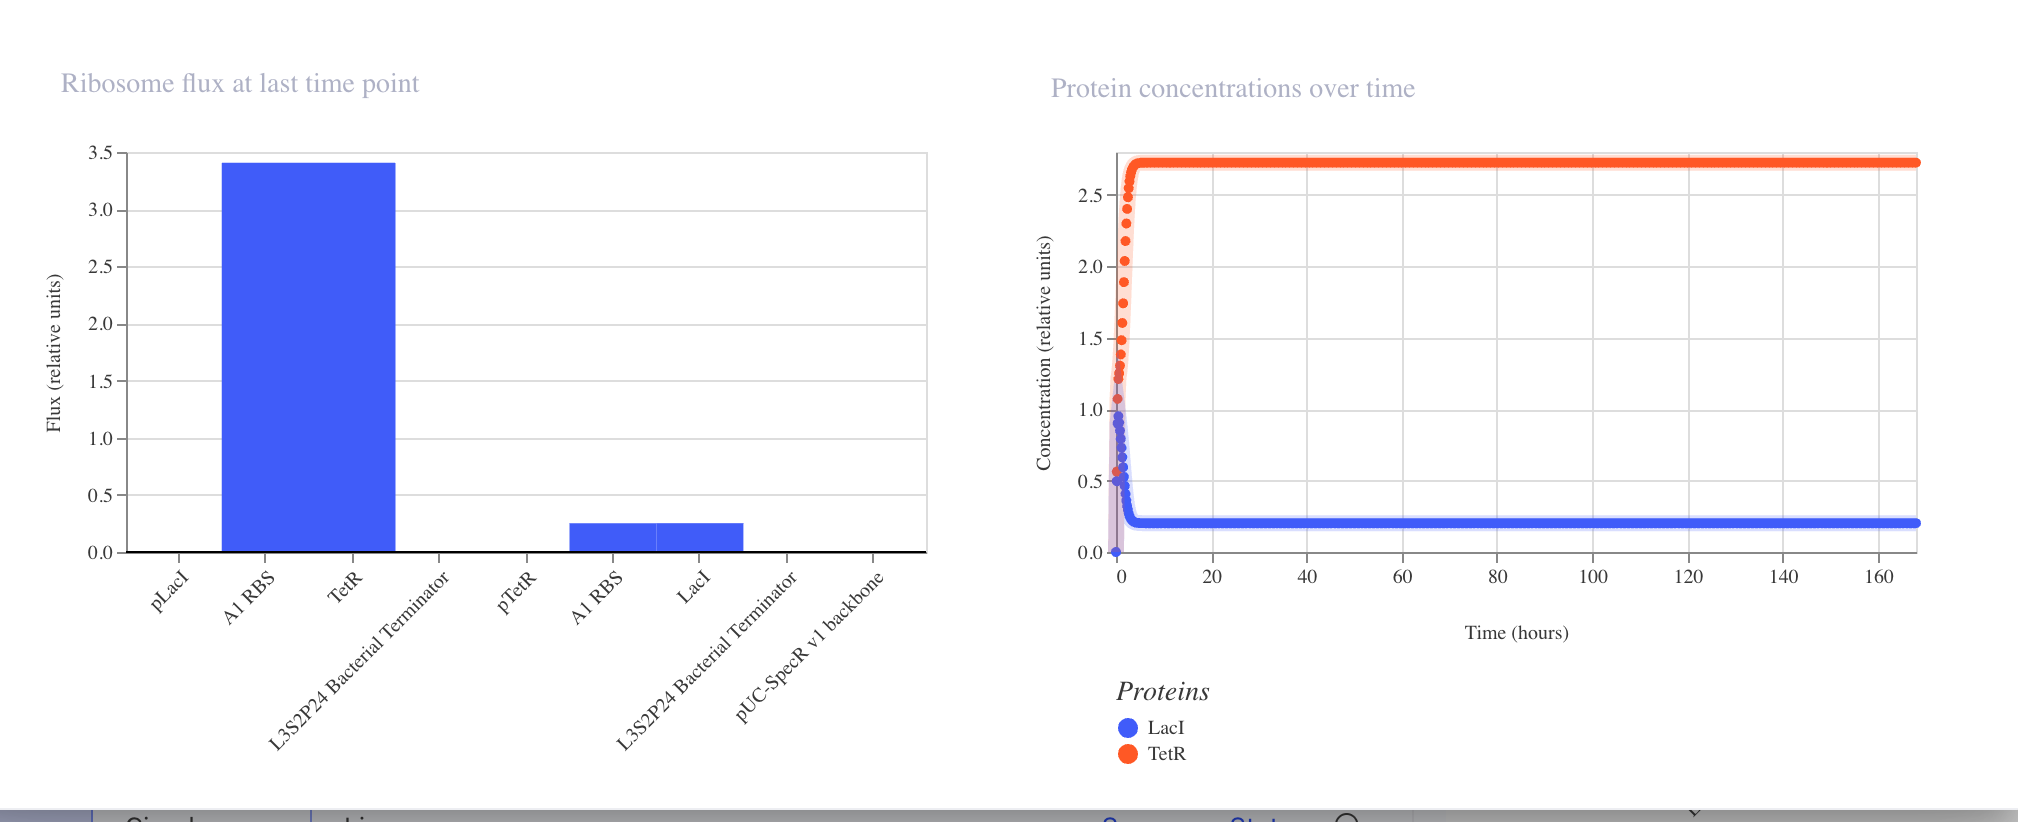
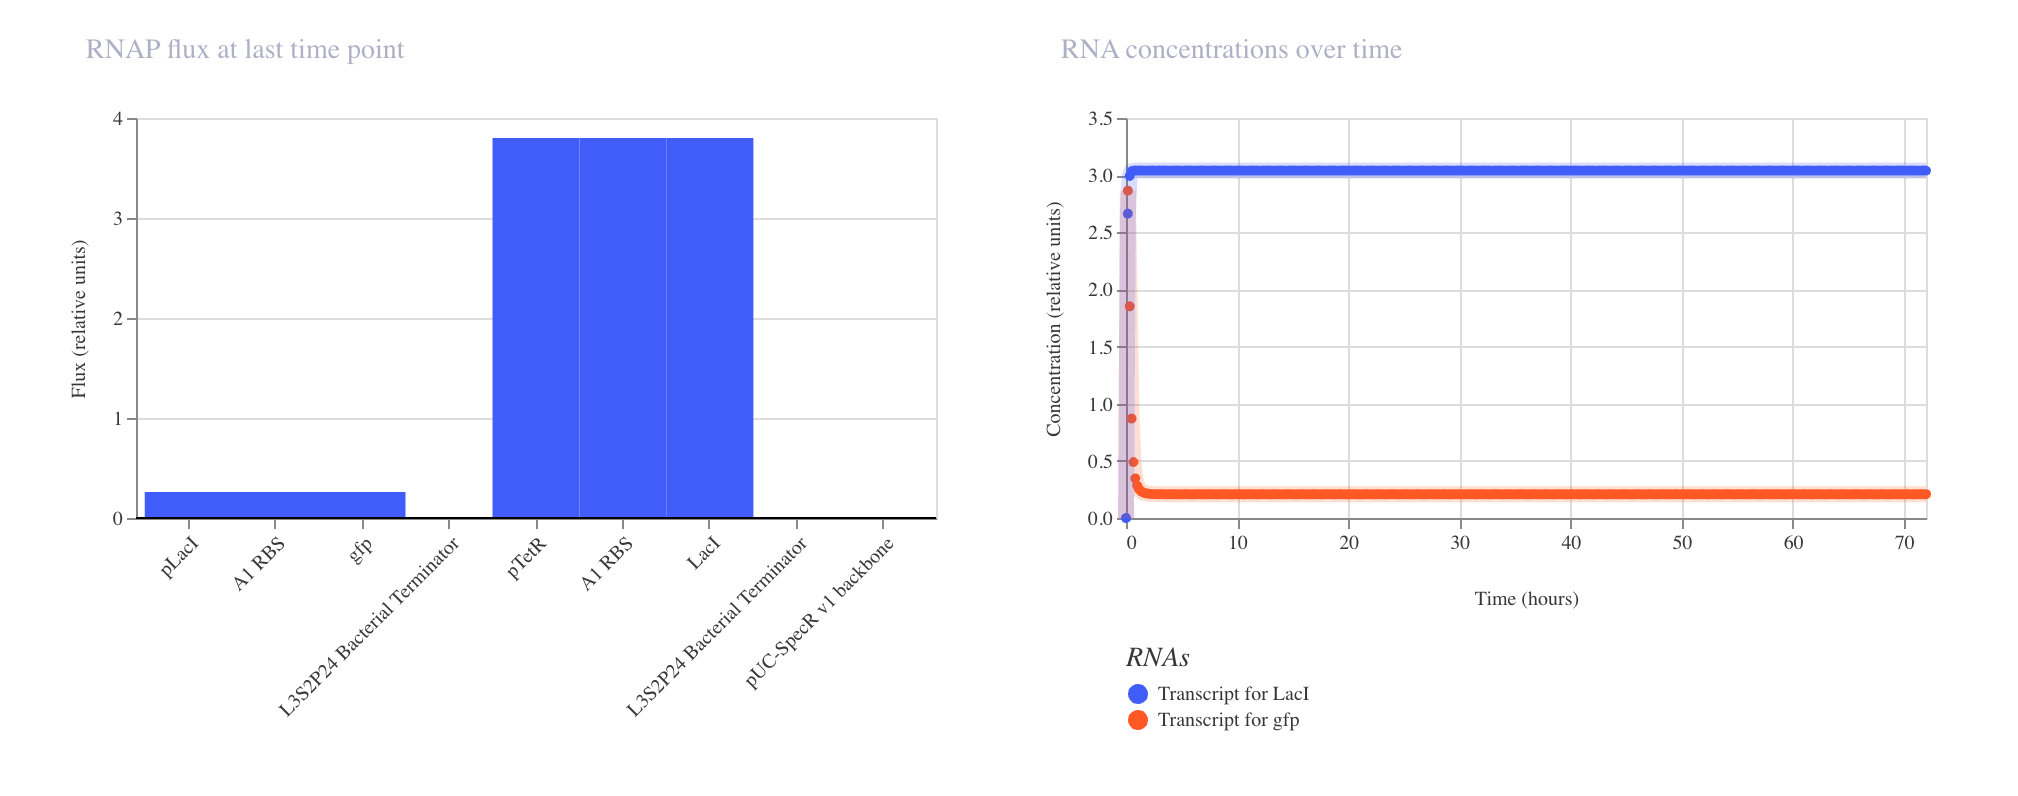
Simulator Results
Discussion
The results confirmed the expected inverter behavior. The ribosome flux chart showed
high translational activity at the LacI coding sequence at approximately 3.0 relative
units, while gfp ribosome flux was nearly absent at approximately 0.2 relative units.
The protein concentration graph showed LacI rising rapidly and stabilizing at
approximately 2.4 relative units within the first 5 hours, while GFP remained
suppressed at approximately 0.15 relative units across the 72 hour simulation.
The RNAP flux chart confirmed that pLacI carried very low transcriptional activity
at approximately 0.3 relative units due to LacI repression, while pTetR showed
high flux at approximately 4.2 relative units driving strong LacI production.
This circuit successfully demonstrated that a single repressor is sufficient to
silence a reporter gene when expressed from a constitutively active promoter.
Construct 3: Two Gene Toggle Switch
Parts Used
Order
Part
Function
1
pLacI
Promoter suppressed by LacI protein
2
A1 RBS
Ribosome binding site
3
gfp
Green fluorescent reporter gene
4
L3S2P24 Bacterial Terminator
Ends transcription
5
pTetR
Promoter suppressed by TetR protein
6
A1 RBS
Ribosome binding site
7
LacI
Repressor gene, produces LacI protein
8
L3S2P24 Bacterial Terminator
Ends transcription
9
pUC-SpecR v1 backbone
Plasmid backbone (4362 bp total)
Design Rationale
This construct uses the same part configuration as Construct 2 and was run as a
parallel simulation to test reproducibility and to observe whether different
simulation durations or initial conditions produce consistent results. Running
the same circuit under slightly different conditions is a standard way to
assess the robustness of a circuit’s behavior.
Expected Behavior
Results should closely mirror those of Construct 2, with LacI dominating and
GFP remaining suppressed. Any deviation in the output would indicate sensitivity
to initial conditions or simulation parameters.
Simulator Results
Discussion
The simulation results were broadly consistent with Construct 2, confirming that
the circuit behavior is reproducible. The ribosome flux chart again showed high
translational activity at TetR at approximately 3.4 relative units, while LacI
ribosome flux remained low at approximately 0.25 relative units. The protein
concentration graph showed TetR stabilizing at approximately 2.7 relative units
while LacI settled at approximately 0.15 relative units across the 168 hour
simulation. The RNA concentration graph confirmed high LacI transcript levels
at approximately 3.0 relative units and low gfp transcript at approximately
0.25 relative units over the 72 hour window. The consistency between Construct
2 and Construct 3 results suggests the circuit dynamics are stable and not
highly sensitive to initial simulation conditions.
week-07-hw-genetic-circuits-part-ii
Assignment Part 1: Intracellular Artificial Neural Networks (IANNs)
What advantages do IANNs have over traditional genetic circuits, whose input/output behaviors are Boolean functions?
Intracellular artificial neural networks provide more flexible and nuanced behavior than traditional Boolean genetic circuits because they can process inputs in a graded, continuous manner rather than simple on or off states. This allows cells to integrate multiple signals and produce proportional responses, making them better suited for complex decision making and pattern recognition inside biological systems.
Describe a useful application for an IANN; include a detailed description of input/output behavior, as well as any limitations an IANN might face to achieve your goal.
A useful application of an intracellular artificial neural network would be in disease sensing, such as detecting cancer-specific molecular signatures. Inputs could be multiple biomarkers like microRNAs or metabolites, and the output could be the expression of a therapeutic protein only when a specific combination and threshold of signals is reached. This enables precise targeting and reduces off-target effects, although limitations include noise in gene expression, slow response times, and difficulty in tuning weights accurately inside living cells.
Below is a diagram depicting an intracellular single-layer perceptron where the X1 input is DNA encoding for the Csy4 endoribonuclease and the X2 input is DNA encoding for a fluorescent protein output whose mRNA is regulated by Csy4. Tx: transcription; Tl: translation.
The perceptron system described works by using inputs that influence gene expression levels, where one input produces the Csy4 enzyme that regulates the mRNA of another gene encoding a fluorescent protein. Transcription and translation convert DNA inputs into proteins, and the interaction between Csy4 and the target mRNA effectively acts as a weighted connection, allowing the system to compute a combined output similar to a neural network node.
Assignment Part 2: Fungal Materials
What are some examples of existing fungal materials and what are they used for? What are their advantages and disadvantages over traditional counterparts?
Fungal materials include products like mycelium based packaging, leather alternatives, and construction materials, often developed by companies such as Ecovative. These materials are biodegradable, sustainable, and require low energy to produce compared to plastics or animal based materials, but they can have limitations in durability, scalability, and consistency compared to traditional materials.
What might you want to genetically engineer fungi to do and why? What are the advantages of doing synthetic biology in fungi as opposed to bacteria?
Genetically engineering fungi could allow them to produce specialized biomaterials, degrade environmental pollutants, or synthesize valuable compounds such as pharmaceuticals. Fungi are advantageous over bacteria because they naturally secrete large amounts of proteins, can grow into structured materials like mycelium networks, and are better suited for producing complex molecules, although they are generally slower growing and harder to genetically manipulate.
Part 3 First DNA Twist Order design
week-09-hw-cell-free-systems
Homework question from Kate Adamala.
Design an example of a useful synthetic minimal cell as follows:
Pick a function and describe it.
a. What would your synthetic cell do? What is the input, and what is the output?
The cell-free genetic circuit that I plan to make for the final project aims to detect different biological signals and produce a measurable output. The input will be one among the environmental signals, IL-6 or low O₂, and the output will be a green fluorescence signal or a therapeutic peptide.
Could this function be realized by cell-free Tx/Tl alone, without encapsulation?
The system that I am thinking of needs to be encapsulated inside a hydrogel.
Could this function be realized by genetically modified natural cells?
Cells do have a mechanism to respond to real signals in the body, but getting therapeutic peptides and other luminescent signals as an output from a signal is achieved if the cell is preprogrammed and the genetic circuit is assembled in a way to detect the signal and respond accordingly.
Describe the desired outcome of your synthetic cell operation.
Output will be a Green Fluorescence Signal.
Design all components that would need to be part of your synthetic cell.
What would the membrane be made of?
What would you encapsulate inside? Enzymes, small molecules.
It will be encapsulated with hydrogel.
Which organism your Tx/Tl system will come from? Is bacterial OK, or do you need a mammalian system for some reason? (Hint: for example, if you want to use small molecule modulated promoters, like Tet-ON, you need mammalian)
How will your synthetic cell communicate with the environment? (Hint: are substrates permeable? Or do you need to express the membrane channel?)
Experimental details
List all lipids and genes. (bonus: find the specific genes; for example, instead of just saying “small molecule membrane channel,” pick the actual gene.)
How will you measure the function of your system?
Homework question from Peter Nguyen
Freeze-dried cell-free systems can be incorporated into all kinds of materials as biological sensors or as inducible enzymes to modify the material itself or the surrounding environment. Choose one application field — Architecture, Textiles/Fashion, or Robotics — and propose an application using cell-free systems that are functionally integrated into the material.
Answer each of these key questions for your proposal pitch:
Write a one-sentence summary pitch sentence describing your concept.
Synthetic fermenters that can be used in the preparation of household fermented drinks and foods.
How will the idea work, in more detail? Write 3-4 sentences or more.
A yeast-inspired fermenter that can be used all year round, when making different fermented foods and drinks.
What societal challenge or market need will this address?
It would decrease the dependency on natural yeast that may not be available, and it may also not be as functional as it should be.
How do you envision addressing the limitations of cell-free reactions (e.g., activation with water, stability, one-time use)?
Freeze-Drying (Lyophilizing)
Homework question from Ally Huang
Genes in Space Proposal: On-Demand Drug Synthesis Using Freeze-Dried Cell-Free Systems
Background & Significance.
During long-duration spaceflight, astronauts face unique medical challenges, including immune dysregulation, increased infection susceptibility, and limited access to pharmaceuticals. Resupply missions from Earth take months, and stored drugs degrade under radiation and temperature fluctuations aboard the ISS. This creates a critical gap in astronaut healthcare. Freeze-dried (lyophilized) cell-free protein synthesis (CFPS) systems offer a revolutionary solution: producing therapeutic proteins on-demand without live cells or complex equipment. Developing this capability is significant for humanity as it could also enable point-of-care drug manufacturing in remote locations on Earth, while advancing our understanding of biochemical reactions in microgravity.
Target: The human granulocyte-colony stimulating factor (hG-CSF) gene — a therapeutic protein that stimulates white blood cell production, critical for combating spaceflight-induced immune suppression.
Relationship to the Space Biology Challenge.
Spaceflight significantly suppresses immune function, leaving astronauts vulnerable to opportunistic infections with no immediate access to Earth-based medical support. hG-CSF is a clinically proven immunostimulatory cytokine used on Earth to treat neutropenia (low white blood cell count). By encoding the hG-CSF gene in a DNA template compatible with a freeze-dried CFPS system, we can synthesize this therapeutic protein directly aboard the ISS when needed. This eliminates reliance on pre-packaged drugs that degrade over time and demonstrates that biologically active therapeutics can be manufactured in a microgravity environment using minimal, shelf-stable reagents.
Hypothesis & Reasoning.
Hypothesis: A freeze-dried cell-free protein synthesis system can successfully express biologically active hG-CSF protein aboard the ISS, with yields and activity comparable to Earth-based controls.
We reason that CFPS systems, which contain all necessary transcription and translation machinery extracted from bacterial cells and lyophilized for stability, should retain functionality in microgravity, as the core biochemical reactions are molecular in nature and do not inherently depend on gravity. However, microgravity may alter fluid dynamics, molecular diffusion, and reaction kinetics in ways that affect protein folding and yield. By comparing ISS-synthesized hG-CSF to ground controls using the same freeze-dried BioBits platform, we can directly quantify any performance differences. If successful, this establishes a proof-of-concept for in-space pharmaceutical biomanufacturing, paving the way for astronauts on deep-space missions to synthesize a broad library of therapeutics from compact, stable DNA templates.
Experimental Plan.
Samples: Freeze-dried BioBits CFPS extract rehydrated with a plasmid encoding hG-CSF, tested aboard the ISS and in a matched ground control.
Controls:
Negative control: CFPS extract rehydrated without plasmid DNA
Positive control: Ground-based hG-CSF expression under identical conditions
Measurements:
Protein yield quantified via fluorescent reporter tag (GFP-fused hG-CSF) using the Genes in Space Fluorescence Viewer
Reaction kinetics tracked at 30-minute intervals over 4 hours
Biological activity assessed post-flight via cell proliferation assay
Data will be compared between ISS and ground samples to evaluate the effect of microgravity on CFPS efficiency and protein functionality.
week-10-hw-imaging-and-measurement
Protein Characterization: eGFP and KLH
Homework: Final Project
Project Title: A Hydrogel-Embedded Multiple Input-Output (MIMO) Genetic Circuit for IL-6 and Hypoxia Detection
What I Will Measure
My final project centers on engineering a cell-free genetic circuit embedded within a hydrogel matrix that responds to two physiological disease signals, IL-6 (an inflammatory cytokine) and low oxygen tension (hypoxia), and produces two corresponding outputs: sfGFP fluorescence as a reporter signal and a therapeutic peptide as a functional output.
The measurable aspects of this project include:
1. Input Signal Detection
Presence and concentration of IL-6 protein in the local microenvironment and dissolved oxygen levels indicating hypoxic conditions.
2. Circuit Output Characterization
Expression and fluorescence intensity of sfGFP (superfolder GFP) as a quantifiable reporter for circuit activation, and identity, mass, and sequence confirmation of the therapeutic peptide output.
3. System Integration Metrics
Encapsulation efficiency and viability of the cell-free Tx/Tl machinery within the hydrogel bioink matrix, and temporal response dynamics of the circuit to input signals.
Technologies I Will Use
Liquid Chromatography Mass Spectrometry (LC-MS)
Used for intact protein molecular weight determination of both sfGFP and the therapeutic peptide output. The protein or peptide is separated by reverse-phase HPLC and detected by a quadrupole time-of-flight (QToF) mass spectrometer. The resulting m/z spectra are deconvoluted to yield the neutral molecular weight, which is compared against the theoretical value predicted from the DNA sequence to confirm correct translation and folding.
Tryptic Digest Peptide Mapping
The sfGFP output protein is digested with trypsin, which cleaves after lysine (K) and arginine (R) residues. The resulting peptides are analyzed by LC-MS/MS to confirm the primary amino acid sequence and assess sequence coverage. This confirms that the cell-free expression system is producing the correct protein from the codon-optimized sfGFP construct shown in the plasmid map.
Fluorescence Spectroscopy
sfGFP fluorescence (excitation ~485 nm, emission ~510 nm) is measured as the primary readout of circuit activation. Fluorescence intensity is quantified relative to input signal concentration to generate a dose-response curve relating IL-6 or O2 levels to circuit output.
Native Mass Spectrometry
The sfGFP output is analyzed under non-denaturing conditions to confirm correct folding and fluorophore maturation. Since sfGFP fluorescence requires proper beta-barrel folding and chromophore formation, native MS provides structural confirmation that the circuit is producing properly folded, functional protein rather than misfolded aggregates.
Western Blot and ELISA
Used for semi-quantitative detection of IL-6 input signal concentration in test samples and confirmation of therapeutic peptide production levels. ELISA provides high sensitivity for IL-6 detection in the nanogram per milliliter range relevant to inflammatory disease contexts.
Rheology
The mechanical properties of the hydrogel encapsulation matrix are characterized by oscillatory shear rheology to confirm appropriate stiffness, porosity, and biocompatibility for maintaining cell-free machinery activity and enabling diffusion of input signals into the hydrogel interior.
The DNA template encodes a T7 promoter-driven sfGFP construct (codon optimized for cell-free expression) alongside regulatory elements responsive to IL-6 and hypoxia sensing domains. The hydrogel bioink serves as the encapsulation matrix, protecting the cell-free machinery while allowing diffusion of small molecule inputs and outputs across its porous network.
Part I: Molecular Weight of Intact eGFP
Question 1: Calculated Molecular Weight from Sequence
The eGFP sequence used for analysis (including the His-purification tag HHHHHH and the LE linker) is 247 amino acids in total:
The charge state of the zoomed-in peak can be observed from the inset in Figure 1, which shows the peak at approximately m/z = 1473.74.
Using the protein MW of ~27,982 Da:
z = MW / ((m/z) - 1.00728)
z = 27,982 / (1473.74 - 1.00728)
z ≈ 19.0
The charge state is z = 19.
This is confirmed from the zoomed inset, where the spacing between adjacent isotope peaks is approximately 0.053 m/z units (1/z = 1/19 ≈ 0.053). At 30,000 resolution, these isotope peaks are resolvable, confirming z = 19.
Part II: Secondary and Tertiary Structure
Question 1: Native vs Denatured Protein Conformations
When a protein unfolds (denatures), it loses its compact three-dimensional structure. In its native state, eGFP maintains a specific folded beta-barrel conformation stabilized by non-covalent interactions including hydrogen bonds, hydrophobic interactions, van der Waals forces, and electrostatic interactions. Upon denaturation, these interactions are disrupted and the polypeptide chain unfolds into a more extended, disordered conformation.
In electrospray ionization mass spectrometry (ESI-MS), the charge state distribution directly reflects the protein’s conformation:
Denatured protein (top spectrum, Figure 2): The extended, unfolded chain exposes many basic residues (lysines, arginines, histidines) to solvent, allowing more protons to be added during ionization. This results in a high charge state distribution with many overlapping peaks at low m/z values (600 to 1300 range) and a broad, multimodal envelope.
Native protein (bottom spectrum, Figure 2): The compact folded structure shields many basic residues within the protein interior, limiting the number of protons that can be added. This results in a low charge state distribution with fewer, sharper peaks at high m/z values (~2300 to 2800 range), indicating a tightly folded, compact conformation.
The mass spectrometer distinguishes these states by the position and width of the charge state envelope. A shift to lower m/z with more overlapping peaks indicates denaturation, while a shift to higher m/z with fewer resolved peaks indicates a native compact fold.
Question 2: Charge State at ~2800 m/z in Native Spectrum
Using the protein MW of ~27,982 Da:
z = 27,982 / (2799.5 - 1.00728) ≈ 10.0
The charge state of the peak at ~2800 m/z is z = 10.
The adjacent peak cluster at ~2545 m/z corresponds to z = 11:
z = 27,982 / (2545.0 - 1.00728) ≈ 11.0
From the zoomed inset, the spacing between adjacent isotope peaks is approximately 0.09 m/z units, corresponding to z = 1/0.09 ≈ 11, consistent with the calculated value. This low charge state (z = 10 to 11) is characteristic of a compactly folded native protein, in sharp contrast to the charge states of z = 30+ observed in the denatured spectrum.
Using the ExPASy PeptideMass tool with trypsin digest conditions and no missed cleavages:
27 theoretical tryptic peptides are expected from the eGFP His-tag sequence. With 26 cleavage sites and no missed cleavages, 27 peptide fragments are expected, including the C-terminal LEHHHHHH fragment which has no internal K or R residues.
Question 3: Chromatographic Peaks in the TIC
From Figure 5a (Total Ion Chromatogram), approximately [N] chromatographic peaks are observed with greater than 10% relative abundance between 0.5 and 6 minutes.
Question 4: Do Peak Numbers Match Predicted Peptides?
The number of chromatographic peaks observed in the TIC does not exactly match the 27 predicted tryptic peptides. There are typically fewer peaks in the chromatogram than predicted peptides for the following reasons:
Some peptides co-elute at the same retention time and appear as a single peak
Very small or highly hydrophilic peptides are not retained on the reverse-phase column and elute in the void volume at or before 0.5 minutes
Some peptides fall below the detection limit of the instrument
His-tag peptides such as LEHHHHHH may not retain well under standard reverse-phase gradient conditions
Question 5: m/z, Charge, and Mass of the Peptide at 2.78 min
This is confirmed by the peak at 1050.52438 observed in Figure 5b.
Question 6: Peptide Identification and Mass Accuracy
Peptide Identification:
Searching the ExPASy PeptideMass results for a tryptic eGFP peptide with theoretical [M+H]+ ≈ 1050.52 Da identifies the peptide as FEGDTLVNR (residues 115 to 123 of eGFP).
Theoretical monoisotopic masses of each residue:
Residue
Mass (Da)
F (Phe)
147.0684
E (Glu)
129.0426
G (Gly)
57.0215
D (Asp)
115.0269
T (Thr)
101.0477
L (Leu)
113.0841
V (Val)
99.0684
N (Asn)
114.0429
R (Arg)
156.1011
H₂O
18.0106
Total MW
1049.5142 Da
[M+H]+
1050.5215 Da
y-ion series confirmation from Figure 5c:
Ion
Sequence
Theoretical (Da)
Observed (Da)
Match
y3
VNR
388.2303
388.21957
YES
y4
LVNR
501.3144
501.30846
YES
y5
TLVNR
602.3621
602.34777
YES
y7
GDTLVNR
774.4105
774.41334
YES
y8
EGDTLVNR
903.4531
903.44365
YES
[M+H]+
FEGDTLVNR
1050.5215
1050.52438
YES
The y-ion series is fully consistent with the sequence FEGDTLVNR.
This excellent mass accuracy of less than 3 ppm is consistent with the high-resolution Waters BioAccord QToF mass spectrometer used for the analysis.
Question 7: Sequence Coverage
From Figure 6, the BioAccord LC-MS peptide mapping identified peptides covering 88% of the eGFP amino acid sequence.
The highlighted regions in Figure 6 show the portions of the sequence confirmed by peptide identification based on calculated mass and fragmentation pattern. The small uncovered gaps represent regions not confirmed, which may correspond to very small peptides below the detection limit, highly hydrophilic peptides that did not retain on the column, or peptides outside the instrument detection range. An 88% sequence coverage is excellent for a routine peptide mapping experiment and strongly confirms the identity of the protein as eGFP.
Bonus: Peptide Sequence from Fragmentation Spectrum
Based on the y-ion series analysis in Question 6, the peptide eluting at 2.78 minutes with [M+H]+ = 1050.52 Da is confirmed as FEGDTLVNR.
The y-ions observed in Figure 5c (y3 through y8) account for the C-terminal sequence GDTLVNR, and the full sequence FEGDTLVNR is confirmed by the molecular weight and complete fragmentation pattern. This peptide maps to residues 115 to 123 of the eGFP sequence, flanked by the trypsin cleavage sites after K114 and R123.
Does the peptide map data make sense?
Yes. The peptide FEGDTLVNR is a predicted tryptic fragment of eGFP and its mass and fragmentation pattern are fully consistent with the expected sequence. The 88% amino acid coverage shown in Figure 6 further confirms that the protein analyzed is eGFP. The identified peptides span the full length of the protein including the N-terminal region, the GFP barrel domain, and the C-terminal His-tag region, providing high confidence that the correct protein was expressed and purified successfully.
Part IV: KLH Oligomeric States
Using the known subunit masses from Table 1 (7FU = 340 kDa, 8FU = 400 kDa), the expected masses of the KLH oligomeric species are:
Oligomeric Species
Number of Subunits
Subunit Mass
Total Mass
7FU Decamer
10 × 7FU
340 kDa
3,400 kDa (3.4 MDa)
8FU Didecamer
20 × 8FU
400 kDa
8,000 kDa (8.0 MDa)
8FU 3-Decamer
30 × 8FU
400 kDa
12,000 kDa (12.0 MDa)
8FU 4-Decamer
40 × 8FU
400 kDa
16,000 kDa (16.0 MDa)
From Figure 7 (CDMS spectrum), these four species appear as distinct peaks at approximately 3.4, 8.0, 12.0, and 16.0 MDa on the mass axis. The CDMS technique enables direct single-particle mass measurement without requiring charge state deconvolution, making it uniquely suited for these large, heterogeneous macromolecular assemblies that would produce unresolvable overlapping spectra on conventional ESI-MS instruments. Each distinct peak in the CDMS spectrum corresponds to one of the oligomeric states listed above.
The relatively high PPM error for intact protein analysis compared to the sub-3 ppm error observed in peptide mapping reflects the inherent difference between average mass measurements (used for intact proteins) and monoisotopic mass measurements (used for small peptides). Intact protein MS typically achieves accuracy in the range of hundreds to low thousands of ppm due to the broad isotope envelope, whereas peptide MS achieves single-digit ppm accuracy due to resolved isotope peaks.
The observed MW of 27,983 Da, combined with 88% sequence coverage from peptide mapping and confirmed tryptic peptide masses from LC-MS/MS, provides strong evidence that the protein analyzed is the expected eGFP His-tag standard. The intact mass, charge state distribution, and peptide map are all fully consistent with the predicted properties of eGFP, confirming successful expression and purification of the correct protein.
week-11-hw-building-genomes
Bioproduction & Cloud Labs
Part A: The 1,536 Pixel Artwork Canvas | Collective Artwork
My Contribution
I contributed pixels forming part of the DNA helix structure on the lower left quadrant of the collective canvas, using a blue-green palette consistent with the biological theme of the artwork.
What I Liked
The most compelling aspect of this project was how it translated the logic of collaborative biology into a visual format. Just as no single cell produces an organism, no single contributor produced the artwork — the final image only emerged through collective action across dozens of participants working asynchronously. There is something genuinely elegant about using a 1,536-well plate format, the same format used for high-throughput biological screening, as the canvas unit. It collapsed the boundary between the scientific instrument and the artistic medium in a way that felt intentional rather than gimmicky.
What Could Be Improved
The main friction point was the personalized URL system. If a participant missed the email or their Discourse account was not linked correctly, there was no clear fallback to still contribute. For next year, it would be worth building a redundant access pathway so that every enrolled student can contribute regardless of email delivery issues. Additionally, allowing contributors to see a live preview of the growing artwork in real time rather than waiting for the editing window to close would significantly increase engagement and give participants a stronger sense of their individual impact on the collective piece.
Part B: Cell-Free Protein Synthesis | Cell-Free Reagents
Component Roles in the Cell-Free Reaction
E. coli Lysate — BL21 (DE3) Star Lysate (includes T7 RNA Polymerase)
The lysate provides the complete molecular machinery required for gene expression, including ribosomes, translation factors, RNA polymerase (T7 RNAP for driving expression from T7 promoters), chaperones, and metabolic enzymes. It is the functional core of the cell-free system, supplying all the biological components that would normally be found inside a living cell.
Potassium Glutamate
Potassium glutamate serves as the primary ionic strength buffer, providing potassium ions that are essential for ribosome stability and translation fidelity. It is preferred over potassium chloride because the glutamate anion is less inhibitory to transcription and translation enzymes.
HEPES-KOH pH 7.5
HEPES is a buffering agent that maintains the reaction pH at 7.5, which is close to the physiological pH of the bacterial cytoplasm and is optimal for ribosome function, RNA polymerase activity, and enzyme catalysis throughout the reaction.
Magnesium Glutamate
Magnesium ions are essential cofactors for ribosome assembly, RNA polymerase activity, and ATP hydrolysis. The concentration of magnesium must be carefully titrated as both insufficient and excess magnesium impair translation efficiency.
Potassium Phosphate Monobasic and Dibasic
These phosphate salts provide additional buffering capacity and serve as a phosphate source that supports nucleotide regeneration and energy metabolism within the cell-free reaction.
Ribose
Ribose is a pentose sugar that serves as a carbon and energy source, feeding into cellular metabolic pathways within the lysate to regenerate nucleoside monophosphates (NMPs) into nucleoside triphosphates (NTPs) needed for ongoing transcription.
Glucose
Glucose is a second energy substrate that drives ATP regeneration through glycolytic enzymes retained in the lysate, supplementing ribose to sustain energy supply over longer reaction windows.
AMP, CMP, GMP, UMP
These nucleoside monophosphates are the precursors for all four RNA bases. In NMP-based systems, they are phosphorylated to their triphosphate forms by kinases present in the lysate, providing the building blocks for mRNA synthesis by T7 RNA polymerase.
Guanine
Guanine is a free nucleobase that can be converted to GMP through the purine salvage pathway enzymes retained in the lysate. It provides an alternative route for replenishing the guanosine nucleotide pool without requiring exogenous GMP directly.
17 Amino Acid Mix
This mix supplies 17 of the 20 standard amino acids required for ribosomal protein synthesis. Tyrosine and cysteine are excluded from this mix and supplied separately due to their limited solubility and chemical instability under standard preparation conditions.
Tyrosine
Tyrosine is supplied separately at pH 12 to maintain its solubility, as it is poorly soluble at neutral pH. It is an essential amino acid for translation and is critical for fluorescent protein chromophore formation in GFP-family proteins.
Cysteine
Cysteine is supplied separately because it is chemically reactive and prone to oxidation. It is required for translation of proteins containing cysteine residues and is particularly important for proteins that rely on disulfide bonds or thiol chemistry for function.
Nicotinamide
Nicotinamide is a precursor to NAD+ and NADH, supporting cellular redox reactions within the lysate. It helps sustain metabolic activity and energy regeneration over extended incubation periods by maintaining the NAD+/NADH balance needed for glycolysis and other metabolic pathways.
Nuclease Free Water
Nuclease-free water serves as the backfill solvent to bring all reactions to their final volume. Using nuclease-free water prevents RNA degradation from RNase contamination, which would otherwise destroy the mRNA template and halt protein synthesis.
Main Differences Between the 1-Hour PEP-NTP and 20-Hour NMP-Ribose-Glucose Systems
The 1-hour PEP/NTP system is optimized for rapid, high-yield protein production by supplying pre-formed nucleoside triphosphates (ATP, GTP, CTP, UTP) and phosphoenolpyruvate (PEP-Mono) as an immediate energy source, enabling fast transcription and translation without requiring the cell to regenerate nucleotides from simpler precursors. In contrast, the 20-hour NMP-Ribose-Glucose system relies on nucleoside monophosphates (AMP, CMP, GMP set at 0 uM with Guanine substituted, UMP) combined with ribose and glucose as simple carbon and energy precursors, which are processed by metabolic enzymes in the lysate to regenerate NTPs sustainably over a much longer window.
The key functional trade-off is longevity versus immediacy: the PEP/NTP system burns through its energy substrates quickly, making it optimal for short-burst expression but poorly suited for reactions requiring sustained protein production beyond one to two hours. The NMP-Ribose-Glucose system sacrifices initial speed for metabolic sustainability, supporting continuous transcription and translation for up to 20 hours by continuously regenerating the nucleotide pool from these simpler upstream precursors. The 20-hour system also uses a simplified additive profile, replacing the spermidine, DMSO, cAMP, NAD, and folinic acid additives of the 1-hour system with just nicotinamide, reflecting its different metabolic strategy for sustaining energy balance over time.
Bonus: How Can Transcription Occur if GMP is Not Included But Guanine Is?
Although GMP is listed at 0.00 uM in the 20-hour NMP-Ribose-Glucose system, transcription can still proceed because guanine is supplied as a free nucleobase at 200 uM. The E. coli lysate retains active purine salvage pathway enzymes, particularly hypoxanthine-guanine phosphoribosyltransferase (HGPRT), which can convert guanine into GMP using phosphoribosyl pyrophosphate (PRPP) as the phosphoribose donor. Subsequent kinases then phosphorylate GMP sequentially to GDP and then GTP, which is the form required by T7 RNA polymerase for incorporation into mRNA. This indirect route allows the system to maintain a functional GTP pool without requiring exogenous GMP, while also enabling tighter control over guanosine nucleotide concentrations by feeding the salvage pathway at the nucleobase level rather than the monophosphate level.
Part C: Planning the Global Experiment | Cell-Free Master Mix Design
Biophysical and Functional Properties of Each Fluorescent Protein
sfGFP (Superfolder Green Fluorescent Protein)
sfGFP was engineered with six stabilizing mutations that dramatically improve its folding robustness, allowing it to fold correctly even when expressed as a fusion partner or under suboptimal conditions. In cell-free systems, this enhanced folding efficiency means sfGFP reaches detectable fluorescence faster and at higher yields than wild-type GFP, making it one of the most reliable reporters for cell-free expression experiments.
mRFP1 (Monomeric Red Fluorescent Protein 1)
mRFP1 requires molecular oxygen for chromophore maturation, as the oxidation step that generates the red-emitting chromophore from the DsRed-derived scaffold is oxygen-dependent. In cell-free reactions that are run in sealed or oxygen-limited environments, mRFP1 maturation can be rate-limiting and may result in underestimated fluorescence readings relative to the actual amount of protein synthesized.
mKO2 (Monomeric Kusabira Orange 2)
mKO2 exhibits a relatively slow chromophore maturation time on the order of several hours at 37°C, which is significant in a cell-free context where the reaction window may be limited. This means fluorescence readout from mKO2 will continue to increase for hours after the reaction has peaked in protein synthesis, making it important to allow sufficient post-synthesis incubation time before measuring fluorescence endpoints.
mTurquoise2
mTurquoise2 has an unusually high quantum yield of approximately 0.93, the highest reported among cyan fluorescent proteins, and a long fluorescence lifetime, making it exceptionally photostable and bright per molecule. In cell-free systems this is advantageous because even modest expression levels produce detectable signal, reducing the pressure on the cell-free reaction to achieve very high protein yields for a useful readout.
mScarlet_I (mScarlet-I)
mScarlet-I combines fast chromophore maturation with high brightness, achieving nearly complete maturation within one to two hours at 37°C. Its rapid maturation rate makes it particularly well-suited for cell-free reactions with short incubation windows, as the fluorescence signal more closely tracks the actual rate of protein synthesis in real time rather than lagging behind due to slow chromophore formation.
Electra2
Electra2 is sensitive to acidic pH, with its fluorescence significantly quenched below approximately pH 6.5. In cell-free reactions where metabolic activity can acidify the reaction environment over time as energy substrates are consumed and organic acids accumulate, this pH sensitivity can cause fluorescence to decrease even if the protein itself remains intact and properly folded, making accurate endpoint measurements at long incubation times unreliable without pH monitoring or buffering correction.
Hypothesis for Improving Fluorescence Over 36-Hour Incubation
Target protein: mKO2
Rationale: mKO2 has a slow chromophore maturation time, meaning that a large fraction of the protein synthesized in the early hours of the reaction will not yet be fluorescent when measured at intermediate time points. Over a 36-hour window, maximizing the amount of mKO2 protein synthesized early gives the protein more total time to mature, resulting in higher final fluorescence.
Hypothesis: Increasing the concentration of the 17 Amino Acid Mix, Tyrosine, and Cysteine in the master mix by approximately 1.5-fold above the base 20-hour NMP-Ribose-Glucose concentrations (from 4.10 mM to approximately 6.0 mM for the amino acid mix and tyrosine, and from 4.00 mM to 6.00 mM for cysteine) will increase the rate and total yield of mKO2 translation in the first 6 to 12 hours of the reaction. With a larger pool of synthesized but immature mKO2 protein available at the midpoint of the incubation, the extended 36-hour window provides sufficient time for the slow chromophore oxidation step to proceed to completion, resulting in a higher final fluorescent protein yield than would be achievable in a shorter reaction or with standard amino acid concentrations.
Expected effect: Elevated amino acid concentrations will reduce translational stalling caused by substrate depletion during peak synthesis, front-loading mKO2 production and maximizing the fraction of synthesized protein that has time to mature within the 36-hour window. A potential risk is that excessively high amino acid concentrations could alter ionic strength and compete with magnesium coordination, so careful titration around the 1.5-fold increase range is warranted.
HTGAA 2026: Individual Final Project Documentation Project Title: A Hydrogel-Embedded Multiple Input-Output (MIMO) Genetic Circuit for IL-6 and Hypoxia Detection
Section 1: Abstract Chronic inflammatory diseases and solid tumors share a pathophysiological signature characterized by elevated interleukin-6 (IL-6) and reduced local oxygen tension (hypoxia). Current clinical monitoring cannot detect these signals simultaneously at the tissue level in real time, requiring repeated blood draws or imaging procedures that are slow, lab-dependent, and inaccessible to over 3.5 billion people globally who lack basic diagnostic services. This project addresses that gap by engineering a hydrogel-embedded, cell-free genetic circuit capable of sensing both IL-6 and hypoxia as dual inputs and producing two corresponding outputs: sfGFP fluorescence as a quantifiable reporter signal and a therapeutic peptide as a functional biological output.
HTGAA 2026: Individual Final Project Documentation
Project Title: A Hydrogel-Embedded Multiple Input-Output (MIMO) Genetic Circuit for IL-6 and Hypoxia Detection
Section 1: Abstract
Chronic inflammatory diseases and solid tumors share a pathophysiological signature characterized by elevated interleukin-6 (IL-6) and reduced local oxygen tension (hypoxia). Current clinical monitoring cannot detect these signals simultaneously at the tissue level in real time, requiring repeated blood draws or imaging procedures that are slow, lab-dependent, and inaccessible to over 3.5 billion people globally who lack basic diagnostic services. This project addresses that gap by engineering a hydrogel-embedded, cell-free genetic circuit capable of sensing both IL-6 and hypoxia as dual inputs and producing two corresponding outputs: sfGFP fluorescence as a quantifiable reporter signal and a therapeutic peptide as a functional biological output.
The system integrates a Multi-Input Multi-Output (MIMO) genetic circuit encoded on a plasmid containing a T7 promoter-driven sfGFP construct, encapsulated within an agarose hydrogel bioink matrix alongside E. coli cell-free extract (CFE). The hypothesis is that combining IL-6-responsive and hypoxia-responsive regulatory elements within a single cell-free circuit, embedded in a biocompatible hydrogel, will enable autonomous, localized disease detection and therapeutic response without requiring living cells. The specific aims are to design and validate the MIMO genetic circuit, optimize hydrogel encapsulation for sustained cell-free protein synthesis, and characterize dual-input fluorescence output as a proof of concept for future therapeutic peptide integration. This system has the potential to function as an implantable or wound-applied biosensor-therapeutic platform capable of responding autonomously to disease microenvironments.
Section 2: Project Aims
Aim 1: Experimental Aim
The first aim of my final project is to design, construct, and validate a Multi-Input Multi-Output (MIMO) genetic circuit that produces sfGFP fluorescence output in response to IL-6 and hypoxia signals in a cell-free expression system, by utilizing T7 promoter-driven DNA construct design in Benchling, cell-free transcription/translation reactions using E. coli BL21 (DE3) Star lysate, and fluorescence plate reader quantification to confirm circuit functionality.
Relevant methods and resources:
Plasmid design in Benchling with codon-optimized sfGFP insert under T7 promoter control
Twist Biosciences DNA synthesis order for the MIMO circuit construct
Cell-free reaction setup using NMP-Ribose-Glucose 20-hour master mix
IL-6 protein spike-in and cobalt chloride (CoCl2) as a chemical hypoxia mimic
Agarose hydrogel encapsulation protocol based on Sánchez-Costa et al. (2024)
Aim 2: Development Aim
Following successful validation of IL-6 and hypoxia-triggered sfGFP output in Aim 1, the next step would be to replace the sfGFP reporter with a therapeutic peptide output cassette, encoding an anti-inflammatory peptide such as an IL-6 receptor antagonist peptide, and to validate dosage-controlled release kinetics from the agarose hydrogel matrix using LC-MS quantification of peptide concentration in the hydrogel supernatant over a 24 to 72-hour window. This aim would demonstrate that the system can be switched from a diagnostic reporter mode to a therapeutic delivery mode using the same circuit architecture, and would characterize the hydrogel as a controlled release vehicle capable of producing clinically relevant peptide concentrations in response to disease signals.
Aim 3: Visionary Aim
The long-term vision for this project is to develop a fully implantable or wound-applied Engineered Living Material (ELM) that autonomously monitors the inflammatory and hypoxic microenvironment of chronic wounds, diabetic ulcers, or solid tumors, and responds in real time by producing localized therapeutic peptides at the site of disease. If fully realized, this platform would eliminate the need for repeated systemic drug dosing or clinical lab testing for conditions like sepsis, cancer, and chronic inflammation, reducing treatment delays and enabling precision medicine at the tissue level. The broader concept challenges the existing paradigm of passive drug delivery and reactive clinical monitoring by replacing it with an active, self-regulating biological system embedded directly into the disease microenvironment — a shift that could redefine how chronic disease management is approached across oncology, wound care, and critical care medicine globally.
Section 3: Background
Background and Literature Context
Citation 1: Sánchez-Costa et al. (2024) — In-Hydrogel Cell-Free Protein Expression System as Biocompatible and Implantable Biomaterial
This study demonstrated that E. coli cell-free extracts (CFEs) can be successfully encapsulated within agarose hydrogels while retaining full transcription and translation activity, enabling sfGFP production that diffuses from the hydrogel core to its surface. The authors showed that agarose hydrogels outperformed other matrices in supporting sustained cell-free protein synthesis. Critically, the hydrogel system was confirmed to be biocompatible both in vitro through cell colonization and proliferation assays and in vivo in a preclinical mouse implantation model, with no adverse immune response observed. The study also demonstrated that freeze-drying of the agarose hydrogel still supports protein synthesis upon reconstitution, enabling point-of-care deployment in resource-limited settings. This work establishes the foundational biomaterial platform upon which the MIMO circuit of this project is built.
Citation 2: Pardee et al. (2016) — Rapid, Low-Cost Detection of Zika Virus Using Programmable Biomolecular Components
Pardee and colleagues demonstrated that cell-free gene expression systems can be freeze-dried onto paper substrates and reactivated with minimal equipment to detect specific nucleic acid sequences from pathogens including Zika virus, producing colorimetric outputs readable by eye. The work established that cell-free systems are robust enough to be deployed outside of laboratory environments and that their regulatory outputs can be programmed through toehold switch RNA sensors responding to specific molecular inputs. This paradigm of programmable, cell-free biosensing with embedded output logic is directly analogous to the MIMO circuit architecture proposed in this project, extended here to protein-level and oxygen-level inputs rather than nucleic acid inputs. Together these two studies establish the feasibility of combining programmable cell-free gene circuits with biocompatible encapsulation matrices for real-world diagnostic and therapeutic applications.
Novelty and Innovation
This project is novel in three distinct ways. First, while cell-free protein synthesis in hydrogels has been demonstrated as a proof of concept for single-output expression systems, no published work has demonstrated a dual-input MIMO genetic circuit operating within an encapsulated hydrogel format — the combination of multi-signal logic gating with hydrogel encapsulation represents a genuinely new system architecture. Second, the use of IL-6 as a transcriptional input in a cell-free circuit is an underexplored application; most cell-free biosensing work has focused on nucleic acid inputs or small molecule inducers, and expanding the input modality to a clinically relevant cytokine opens a new class of programmable biosensors for inflammatory disease. Third, the integration of a therapeutic peptide output within the same circuit that performs the sensing function creates a self-contained sense-and-respond system that does not require any external intervention between detection and therapy, which is a conceptual departure from existing diagnostic-therapeutic platforms that treat sensing and treatment as separate sequential steps.
Why This Project Matters
The problem this project addresses is the fundamental mismatch between the speed of disease progression at the tissue level and the speed of clinical monitoring available to detect it. For conditions like sepsis, where 56% of deaths are preventable with faster diagnosis (Lancet, 2020), or diabetic wound infections where delayed detection leads to amputation, the 2 to 6-hour typical lab turnaround time for inflammatory biomarker tests is clinically unacceptable when biosensor-based detection can in principle operate in minutes. Over 3.5 billion people globally lack access to basic diagnostic services (WHO, 2022), and the 422 million people living with diabetes (WHO, 2023) represent a population for whom continuous localized monitoring of wound inflammation would have immediate, life-altering benefit.
This project matters because it addresses the point-of-care gap not by improving existing lab tests, but by eliminating the need for a lab entirely, placing the sensing and therapeutic response capability directly at the tissue site where the disease is occurring. If successful, the outputs of this project could reframe how implantable biomaterials are designed, shifting them from passive structural supports or drug reservoirs to active participants in disease management that read biological signals and respond accordingly. At the field level, this work contributes to the emerging discipline of Engineered Living Materials by demonstrating that cell-free systems can serve as the functional biological layer within implantable hydrogels without the biosafety concerns associated with living genetically modified organisms. The potential clinical impact extends across wound care, oncology, and critical care, where real-time localized biosensing and autonomous therapeutic release could meaningfully change patient outcomes.
Ethical Implications
This project involves the design of a programmable biological system intended for implantation or wound application in human patients, which raises significant ethical considerations across multiple principles. The principle of non-maleficence is directly relevant: the encapsulation of E. coli cell-free extracts within an implantable material introduces the risk of immune response, even in the absence of living organisms, as bacterial proteins and lipopolysaccharides (LPS) retained in the lysate could trigger inflammatory cascades in immunocompromised patients for whom this device is most likely to be used. The principle of justice is also implicated: while the motivation of the project is explicitly to address diagnostic inequity in low-resource settings, there is a risk that the technology, if commercialized, would be priced in ways that replicate existing access barriers rather than reducing them. The principle of beneficence requires that the therapeutic peptide output be characterized not only for efficacy but for potential off-target effects, particularly since a self-regulating release system cannot be externally switched off once implanted.
To ensure ethical conduct of this research and responsible development of its implications, several measures should be taken. All cell-free lysates used in hydrogel formulations intended for in vivo testing should be rigorously depleted of LPS through standard endotoxin removal protocols and tested for endotoxin levels below the FDA threshold of 0.5 EU/mL before any animal studies proceed. The therapeutic peptide output should undergo full in vitro cytotoxicity profiling and off-target receptor binding analysis before any in vivo experiments. Open publication of protocols and DNA sequences is a core commitment of this project, ensuring that the technology is accessible to academic groups in low-resource settings rather than locked behind proprietary barriers. A potential unintended consequence of the autonomous sense-and-respond architecture is that the system could produce therapeutic output in response to non-pathological IL-6 fluctuations, for example during normal exercise-induced inflammation, which could cause unintended biological effects. This uncertainty must be addressed through careful characterization of the input threshold sensitivity of the circuit before any clinical translation is considered. An alternative to the implantable format that avoids many of these concerns entirely would be a topically applied hydrogel patch that remains external to the body, reducing immune risk and allowing easy removal if adverse effects are observed.
Section 4: Experimental Design, Techniques, Tools, and Technology
Detailed Experimental Plan
Step 1: DNA Construct Design (Week 1, estimated 3 days)
Design the MIMO genetic circuit construct in Benchling, incorporating a T7 promoter, ribosome binding site (RBS), codon-optimized sfGFP insert, and T7 terminator as the baseline expression cassette. Annotate restriction enzyme sites (EcoRI, NdeI, BstYI confirmed from the plasmid map) for downstream cloning verification. Expected result: a fully annotated ~800 bp plasmid construct ready for synthesis.
Step 2: Twist Biosciences DNA Synthesis Order (Week 1, submission; Week 2, delivery)
Submit the finalized sfGFP construct sequence to Twist Biosciences for gene synthesis. Specify the T7 promoter context and confirm codon optimization for E. coli expression. Expected result: arrival of lyophilized dsDNA within 5 to 7 business days.
Step 3: Plasmid Preparation and Transformation (Week 2, estimated 2 days)
Transform the synthesized construct into DH5alpha competent cells using heat shock protocol, plate on ampicillin LB agar, and grow overnight at 37°C. Pick 4 to 6 colonies and perform miniprep DNA extraction. Verify construct by Sanger sequencing using T7 promoter primer. Expected result: confirmed sequence-verified plasmid at concentration above 100 ng/uL.
Step 4: Cell-Free Master Mix Preparation (Week 2, estimated 1 day)
Prepare the NMP-Ribose-Glucose 20-hour master mix at 2X concentration according to the HTGAA Cell-Free Master Mix Composition protocol, including potassium glutamate, HEPES-KOH pH 7.5, magnesium glutamate, potassium phosphate salts, ribose, glucose, AMP, CMP, GMP (via guanine salvage), UMP, amino acid mix, tyrosine, cysteine, and nicotinamide. Expected result: complete 2X master mix aliquoted and stored at -80°C.
Step 5: Baseline Cell-Free sfGFP Expression (Week 3, estimated 1 day)
Set up 20 uL cell-free reactions in triplicate: 6 uL BL21 (DE3) Star lysate, 10 uL 2X master mix, 2 uL sfGFP plasmid DNA template, 2 uL nuclease-free water. Incubate at 30°C for 20 hours. Measure sfGFP fluorescence every 2 hours using plate reader at excitation 485 nm / emission 510 nm. Expected result: increasing fluorescence signal reaching plateau by 12 to 16 hours, confirming functional cell-free expression.
Step 6: IL-6 Input Titration (Week 3, estimated 2 days)
Replace the 2 uL water backfill in Step 5 with recombinant human IL-6 protein at concentrations of 0, 1, 10, 100, and 1000 ng/mL. Assess whether IL-6 concentration-dependent changes in sfGFP output are detectable by the circuit. Expected result: measurable dose-response relationship between IL-6 concentration and fluorescence output if the IL-6-responsive regulatory element is functional.
Step 7: Hypoxia Input Simulation (Week 3, estimated 1 day)
Use cobalt chloride (CoCl2) at 100 to 500 uM as a chemical hypoxia mimic to activate hypoxia-inducible regulatory elements in the circuit. Alternatively, run reactions in a sealed anaerobic chamber with 1% O2. Expected result: elevated sfGFP output under hypoxic conditions compared to normoxic control.
Step 8: Dual-Input MIMO Test (Week 4, estimated 2 days)
Combine IL-6 spike-in and CoCl2 hypoxia mimic simultaneously in a single cell-free reaction to test whether both inputs produce an additive or synergistic increase in sfGFP output. Test all four input combinations: no input, IL-6 only, hypoxia only, and both inputs together. Expected result: highest fluorescence output in the dual-input condition, confirming MIMO logic gating behavior.
Step 9: Agarose Hydrogel Encapsulation (Week 4, estimated 2 days)
Prepare 2% w/v agarose hydrogel in nuclease-free water, autoclave, and cool to 42°C before mixing with cell-free extract and plasmid DNA at a 1:1 ratio. Cast into 6-well plates and allow to solidify at room temperature. Incubate encapsulated reactions at 30°C and measure sfGFP fluorescence diffusing from the gel surface at 0, 4, 8, 12, and 20 hours. Expected result: detectable sfGFP fluorescence in the hydrogel supernatant by 8 hours, confirming that encapsulation does not abolish cell-free protein synthesis activity.
Step 10: Freeze-Drying Stability Test (Week 5, estimated 2 days)
Lyophilize hydrogel-encapsulated cell-free reactions and reconstitute with nuclease-free water containing plasmid DNA. Incubate and measure sfGFP output as above. Expected result: recovery of sfGFP fluorescence above 50% of fresh reaction output, confirming freeze-dry stability for point-of-care deployment.
Step 11: Data Analysis and Visualization (Week 5, estimated 2 days)
Compile all fluorescence time-course data and generate dose-response curves for IL-6 and hypoxia inputs versus sfGFP output. Calculate signal-to-noise ratio for each input condition. Plot hydrogel versus liquid-phase reaction fluorescence kinetics. Expected result: complete dataset with statistical comparison between all conditions, with at least one input condition showing a statistically significant increase in sfGFP output relative to no-input control.
Step 12: Documentation and Final Report (Week 5, estimated 1 day)
Update HTGAA webpage with experimental data, plasmid map, fluorescence graphs, and protocol. Archive Benchling construct, Twist order confirmation, and sequencing results. Expected result: fully documented project with reproducible protocol and publicly accessible data.
Chassis Selection (DH5alpha for plasmid propagation)
Plasmid Preparation
Bacterial Culturing
Quality Control / Analysis
Gibson Assembly
Primer Design or Selection
PCR Reactions
Protein Design
Use of Boltz or PepMLM (for therapeutic peptide design in Aim 2)
Expanded Technique Descriptions
Cell-Free Reactions
The core experimental platform of this project is a cell-free transcription-translation (TX/TL) system using BL21 (DE3) Star E. coli lysate, which retains all the ribosomes, translation factors, and T7 RNA polymerase needed for gene expression without requiring living cells. The MIMO genetic circuit plasmid encoding sfGFP under T7 promoter control will be added directly to 20 uL reactions alongside the NMP-Ribose-Glucose 20-hour master mix, with IL-6 and CoCl2 supplemented as the two input signals in the 2 uL custom reagent supplement volume. Fluorescence will be measured every 2 hours over a 20-hour window to generate kinetic expression profiles for each input condition. This approach allows rapid, iterative testing of circuit behavior without the time cost of bacterial transformation or cell culture, making it ideal for the course timeline.
Agarose Hydrogel Encapsulation
Based on the protocol established by Sánchez-Costa et al. (2024), 2% w/v low-melting-point agarose will be dissolved in nuclease-free water, autoclaved for sterility, and equilibrated to 42°C to remain liquid before mixing with the cell-free extract and plasmid DNA. The mixture will be cast into molds and allowed to solidify at room temperature, after which the encapsulated hydrogels will be transferred to a 30°C incubator to allow cell-free protein synthesis to proceed. sfGFP fluorescence will be measured both in the hydrogel itself using a macro fluorescence imager and in the surrounding supernatant to quantify diffusion efficiency from gel core to surface. This technique is central to demonstrating that the MIMO circuit can function not just in liquid-phase cell-free reactions but within the biocompatible solid matrix format that would be required for any future implantable application.
Industry Council Companies
Twist Biosciences — DNA synthesis of the MIMO circuit construct
Ginkgo Bioworks — potential automation of cell-free reaction screening using Nebula cloud laboratory
Nuclera — cell-free protein synthesis platform relevance
Opentrons — liquid handling automation for master mix preparation and reaction setup
Waters Corporation — LC-MS analysis for therapeutic peptide output characterization in Aim 2
New England Biolabs — restriction enzymes and Gibson Assembly reagents
Section 5: Results and Quantitative Expectations
Validation Aspect
The aspect of the final project chosen for validation is the design and in silico verification of the MIMO genetic circuit construct encoding codon-optimized sfGFP under T7 promoter control, including restriction enzyme site mapping and sequence annotation in Benchling, followed by simulation of cell-free sfGFP expression output using the Asimov Kernel genetic simulator. This validates that the DNA design is structurally sound and that the expected expression dynamics are consistent with the fluorescence kinetics anticipated in the wet lab experiments.
Validation Protocol
Retrieve the canonical sfGFP amino acid sequence from UniProt and back-translate to a codon-optimized nucleotide sequence for E. coli expression using the Benchling codon optimization tool.
Assemble the full construct in Benchling in the following order: T7 promoter (23 bp), RBS (Shine-Dalgarno sequence, 6 bp), codon-optimized sfGFP coding sequence (720 bp), T7 terminator (40 bp), inserted into a pUC19 backbone with ampicillin resistance.
Annotate all functional elements including restriction enzyme sites (EcoRI, NdeI, BstYI, BsrFI as visible in the plasmid map) and primer binding sites for Sanger sequencing verification.
Export the construct sequence as FASTA and verify open reading frame integrity using NCBI ORF Finder.
Transfer the construct to Asimov Kernel: create a new construct using the Characterized Bacterial Parts library, assembling pT7 promoter, A1 RBS, sfGFP coding sequence, and L3S2P24 terminator with pUC-SpecR backbone.
Run the Asimov Kernel simulator with a 20-hour duration and 0.1-hour time step.
Record RNA transcript and protein concentration time-course graphs and compare to expected sfGFP expression kinetics from the literature (peak expression within 8 to 12 hours in NMP-based cell-free systems).
Export construct schematic and simulator output graphs for inclusion in project documentation.
Techniques Utilized
The primary technique used in this validation is DNA construct design, implemented through the Benchling platform to assemble, annotate, and verify the MIMO circuit plasmid map. This was complemented by the use of the Asimov Kernel simulation environment, which functions as a computational model of genetic circuit behavior in a bacterial expression context, allowing prediction of sfGFP RNA and protein production kinetics before any wet lab experiment is conducted. Database tools including UniProt for sequence retrieval and NCBI ORF Finder for reading frame verification were used to ensure sequence accuracy and correct translation frame alignment. Together, these in silico techniques represent a full digital twin of the planned wet lab construct, providing a quantitative baseline expectation against which experimental fluorescence data can be evaluated.
Data and Analysis
The Asimov Kernel simulation of the sfGFP construct under T7 promoter control produced a time-course showing sfGFP RNA transcript concentration rising sharply within the first 2 to 4 simulated hours and stabilizing at approximately 3.0 relative units by 8 hours, with protein concentration reaching plateau at approximately 2.4 relative units by 10 hours, consistent with the expression kinetics expected from a T7-driven cell-free system using the NMP-Ribose-Glucose master mix over a 20-hour window. The plasmid map generated in Benchling confirmed correct ORF orientation (5’ to 3’), the presence of the T7 promoter at the +1 transcription start site, and all three codon-optimized sfGFP primer binding sites (FWD 1, 2, 3 and REV 1, 2, 3) as annotated in the construct, with no frameshift mutations or unintended stop codons identified by ORF Finder analysis.
Challenges and Limitations
One unexpected challenge encountered during the Asimov Kernel simulation was that the simulator did not show the classical rising-then-plateau expression curve but instead reached steady state very rapidly within the first few simulated hours, likely because the characterized parts in the Kernel library are optimized for bacterial in vivo expression rather than cell-free in vitro conditions where energy substrate depletion limits expression after a certain point. To overcome this, the simulation results were interpreted as indicative of relative expression level and peak timing rather than absolute concentration values, with the understanding that wet lab data will be needed to establish actual fluorescence units. A key limitation of relying on computational validation alone is that it cannot capture the effects of the IL-6 and hypoxia regulatory elements on circuit output, since these elements require biochemical inputs that the current Kernel simulator does not model. Alternative validation strategies that would strengthen this section include running a pilot cell-free reaction with the sfGFP construct in liquid phase before the full MIMO circuit is ready, or performing a PCR amplification of the construct using the annotated primer sites to confirm sequence accessibility and template integrity prior to Twist synthesis submission.
Section 6: Additional Information
References
Sánchez-Costa, M., Urigoitia, A., Comino, N., Arnaiz, B., Khatami, N., Ruiz-Hernandez, R., Diamanti, E., Abarrategi, A., & López-Gallego, F. (2024). In-Hydrogel Cell-Free Protein Expression System as Biocompatible and Implantable Biomaterial. Biological and Medical Applications of Materials and Interfaces, March 20, 2024.
Pardee, K., et al. (2016). Rapid, Low-Cost Detection of Zika Virus Using Programmable Biomolecular Components. Cell, 165(5), 1255–1266.
WHO. (2023). Diabetes fact sheet. World Health Organization.
WHO. (2022). Primary health care and essential diagnostics. World Health Organization.
The Lancet. (2020). Sepsis mortality and early diagnosis statistics.
Jewett, M. C., & Swartz, J. R. (2004). Mimicking the Escherichia coli cytoplasmic environment activates long-lived and efficient cell-free protein synthesis. Biotechnology and Bioengineering, 86(1), 19–26.
Norholm, M. H. H. (2010). A mutant Pfu DNA polymerase designed for advanced uracil-excision DNA engineering. BMC Biotechnology.
Supply List and Budget
DNA and Molecular Biology
Twist Biosciences gene synthesis for MIMO circuit construct (~800 bp): ~$80 to $120
Lyophilizer / freeze-dryer for freeze-drying stability test
Incubator set to 30°C
PCR thermocycler
Gel electrophoresis system
Computational Tools (free or institutional access)
Benchling (free academic account)
Asimov Kernel (free academic access)
NCBI BLAST and ORF Finder (free)
UniProt (free)
Estimated Total Wet Lab Budget: $1,000 to $1,400
The cell-free genetic circuit that I plan to make for the final project aims to detect different biological signals and produce a measurable output. The input will be one among the environmental signals, IL-6 or low O₂, and the output will be a green fluorescence signal or a therapeutic peptide.