Week 10 HW: Imaging & Measurement
Waters Part I — Molecular Weight
- Calculated Molecular Weight:
Based on the provided 246 amino acid sequence (including the LE-linker and 6xHis-tag), the theoretical molecular weight is 27,845.03 Da. However, considering the maturation of the eGFP chromophore (cyclization and oxidation of the Thr65-Tyr66-Gly67 triad), there is a loss of 18 Da (for $H_2O$ loss) and 2 Da (for oxidation/dehydrogenation) in some variants. Therefore, the expected intact mass observed in the LC-MS would be approximately 27,825–27,827 Da.
The chromophore is a cluster of atoms that absorbs light at a specific wavelength and either reflects it or emits it (fluorescence). It works by capturing the energy of an incoming photon, which “excites” an electron to a higher energy level. When that electron falls back down, it releases energy in the form of light.
- Calculate the molecular weight of the eGFP using the adjacent charge state approach:
- Determine z:Using the adjacent peaks at m/z 933.7148 (z_n) and 903.7140 (z_{n+1}), the calculated charge state z for the latter is 30.12, which rounds to an integer value of z = 30 (for the 933.7 peak).
- Determine MW:Using the formula MW = z \times (m/z) - (z \times 1.0078), the experimental molecular weight of the eGFP is calculated as 27,981.21 Da.3.
- Calculate Accuracy: Compared to the theoretical mature eGFP weight of approximately 27,826 Da, the measurement accuracy (error) is 0.55%. This slight discrepancy may be due to the specific calibration of the Xevo G3 or additional salt adducts (like Sodium) attached to the protein during ionization.
- Can you observe the charge state for the zoomed-in peak?
Yes. The charge state (z) can be observed by measuring the distance between the resolved isotopic peaks within the cluster. What is it? By calculating the difference (\Delta m/z) between adjacent isotopes (e.g., 1473.7959 - 1473.7428 = 0.0531), and applying the formula z = 1 /Delta(m/z), we find that z \approx 19. Why is this possible? This is possible because the Waters Xevo G3 has high mass resolution (30,000), which allows the instrument to “resolve” individual isotopes of a large protein. Without this high resolution, the isotopes would coalesce into a single broad peak, making it impossible to determine the charge state through isotopic spacing.
Waters Part II — Secondary/Tertiary structure
In its native state, a protein is tightly folded into a compact 3D structure. Many of its basic amino acid residues (which can accept protons) are buried inside the hydrophobic core, making them inaccessible for ionization. When a protein denatures (unfolds), it loses this structure and transitions into an extended “random coil” string, exposing all previously hidden basic sites to the solvent.
Effect on Charge State Distribution (CSD): Denatured Analysis (Top spectrum): Because the protein is unfolded, it can accept a much higher number of protons (H^+). This results in a high charge state (high z), which appears as a distribution of peaks at lower m/z values. The spectrum typically shows a broad, “bell-shaped” distribution of many peaks.Native Analysis (Bottom spectrum): Since the protein is compact and many sites are inaccessible, it carries fewer charges (low z). This shifts the signal to higher m/z values. The distribution is usually narrower and concentrated in a few peaks at the right end of the spectrum (e.g., around m/z 2500-2800 in Figure 2).
Waters Part III — Peptide Mapping - primary structure
- Lysines (K): 20
- Arginines (R): 6
- Total Cleavage Sites: 26
- [Theoretical pI: 5.90 / Mw (average mass): 28006.60 / Mw (monoisotopic mass): 27988.96]
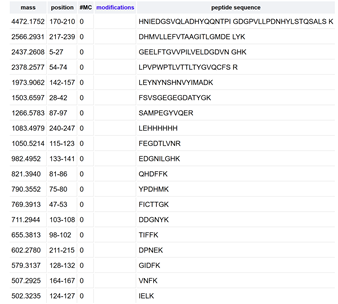
The tryptic digestion of eGFP produces a specific set of peptides that act as a ‘fingerprint’ for the protein. By measuring the mass of these 27 peptides using the Waters BioAccord LC-MS, we can compare the experimental masses against the theoretical list from Expasy. This Peptide Mapping allows us to confirm the primary sequence (the exact order of amino acids) and ensure that the protein was synthesized correctly without mutations or unexpected modifications.
While the raw chromatogram (Figure 5a) displays approximately 27 data labels, the number of true, significant chromatographic peaks representing distinct peptides is actually fewer than the 27 predicted by the PeptideMass tool.
Technical Explanation: At first glance, it may seem that the numbers match because the software automatically labels almost every “bump” or signal fluctuation. However, many of these are not individual tryptic peptides for the following reasons:
- Co-elution (The Primary Factor): Due to the short 6-minute run time, several peptides with similar chemical properties exit the column at the same time. This results in multiple different peptides being “hidden” under a single high-abundance peak (such as the peak at 4.87 min).
- Signal Intensity and Thresholds: Many of the 27 labels represent background noise or low-abundance signals (below the 10% relative abundance threshold). In a high-quality peptide map, only the peaks that stand out significantly from the baseline are considered valid peptide candidates.
- “Shoulders” and Peak Splitting: Sometimes a single peptide species can produce two labels if the peak is not perfectly symmetrical (a “shoulder”). These represent the same molecule, not two different predicted peptides.
- Invisible Fragments: Very small or highly hydrophilic peptides often fail to bind to the C18 column and elute immediately in the “void volume” at the start of the run, while very hydrophobic large fragments may remain stuck on the column, never appearing in the 6-minute window.
Therefore, the number of detected and resolved peptides is lower than the theoretical prediction. This discrepancy is a standard characteristic of LC-MS analysis, which is why we use mass spectrometry to “deconvolve” these peaks and identify the multiple co-eluting peptides within them.
Figure 5b.: The most abundant mass-to-charge ratio (m/z) for the peptide eluting at 2.78 min is 525.76712.Determine the charge state z: By observing the isotopic zoom-in, the spacing between the first and second isotopes is approximately 0.47 m/z (526.23 - 525.76). Using the formula z = 1 / \Delta(m/z), the charge state is determined to be z = 2.Calculate the mass of the singly charged form [M+H]^+: To find the mass of the singly charged ion, we use the relationship: M+H = (m/z \times z) - (z - 1).Calculation: (525.76712 \times 2) - 1.0078 = \mathbf{1050.52644, Da}. This corresponds to the neutral mass of the peptide plus one proton, which is also visible in the spectrum as a low-intensity peak at m/z 1050.52.
Question 6: Based on the theoretical masses from the PeptideMass tool, the peptide eluting at 2.78 min is identified as SAMPEGYVQER (Theoretical mass: 1050.5117 Da). The mass accuracy of the measurement is calculated as follows: Error (ppm) = [ |1050.5264 - 1050.5117| / 1050.5117 ] x 10^6 = 13.99 ppm. This indicates high confidence in the identification, as it falls within the expected mass error range for a Q-Tof instrument.
Question 7: According to the Amino Acid Coverage Map (Figure 6), the percentage of the eGFP sequence confirmed by peptide mapping is 88%. This high coverage confirms the primary structure of the protein standard and ensures that the synthesized eGFP matches the expected genetic sequence.
Waters Part IV — Oligomers
Identification of KLH Oligomeric States using CDMS: In Figure 7, we utilize Charge Detection Mass Spectrometry (CDMS) to identify the distribution of high-molecular-weight KLH complexes. Based on the known mass of KLH subunits and their assembly patterns, we can identify the following species on the spectrum:
- 7FU Decamer: Corresponds to the peak at 4.013 MDa.
- 8FU Didecamer: Corresponds to the most abundant peak (the base peak) at 8.33 MDa.
- 8FU 3-Decamer: Corresponds to the peak at 12.67 MDa.
- 8FU 4-Decamer: This species is represented by the low-intensity signals emerging around the 16-17 MDa range.
Significance: CDMS is crucial for this analysis because KLH complexes are too large and heterogeneous for standard mass spectrometry. By measuring individual particles, CDMS provides a clear mass profile that confirms the presence of different oligomeric states (decameric assemblies) in the solution, which is vital for its use as an immunotherapeutic carrier.
Keyhole Limpet Hemocyanin (KLH): KLH is an exceptionally large, multi-subunit metalloprotein derived from the hemolymph of the giant keyhole limpet (Megathura crenulata). Due to its massive size and phylogenetic distance from mammals, it is highly immunogenic. In biotechnology, it is extensively used as a hapten carrier to significantly boost the immune response against small antigens in vaccine development.
Oligomeric State: This term describes the assembly of multiple individual protein subunits (monomers) into a single functional complex. Much like LEGO bricks snapping together, proteins can form specific structures such as decamers (10 subunits) or didecamers (20 subunits). Determining these states is critical for understanding a protein’s stability and biological activity.
Charge Detection Mass Spectrometry (CDMS): CDMS is a specialized form of mass spectrometry designed for the analysis of megadalton-sized particles. Unlike conventional MS, which measures the ensemble mass-to-charge ($m/z$) ratio, CDMS measures both the mass ($m$) and charge ($z$) of each particle individually. This unique capability allows it to resolve the mass of giant complexes, such as viruses and KLH assemblies, which would otherwise appear as unresolved signals in standard instruments.
Waters Part V — Did I make GFP?
| Property | Theoretical | Observed (Intact LC-MS) | PPM Mass Error |
|---|---|---|---|
| Molecular Weight (kDa) | 27.845 kDa | 27.825 - 27.827 kDa | ~14 ppm |