Week 10 HW: Advanced Imaging and Measurment Technology
Week 10 — Advanced Imaging & Measurement Technology
Final Project Measurments
What I will measure
The mass of my fusion protein CsgA-hCRY2-DrBphP to confirm it was made at the correct size of approximately 156.7 kDa.
The amino acid sequence of each domain to confirm no errors were introduced during DNA synthesis or expression.
Weather the FAD cofactor is loaded inside hCRY2, since this is essential for the quantum sensing mechanism to work.
Whether hCRY2 responds to electromagnetic fields through the radical pair mechanism.
If DrBphP switches correctly between its red (660 nm) and far-red (740 nm) states and whether this switching is modulated by hCRY2.
Whether the curli fiber mat self-assembles correctly from the secreted fusion protein.
How I will perform these measurements
I will measure the mass of the intact protein using intact LC-MS. The protein is detected as multiple charge states and the adjacent charge state method gives me the true molecular weight, which I compare to my theoretical value of 156,669.69 Da as a ppm error — the same method used in this course for eGFP.
Confirm the sequence of each domain by digesting the protein with trypsin and running the resulting peptide fragments through LC-MS. The mass and fragmentation pattern of each peptide confirms all three domains are present and correct with no mutations, exactly as done in Waters Part III.
I will confirm FAD loading by measuring UV-Vis absorbance at 370–450 nm and fluorescence at 520 nm. I will supplement FAD at 25 µM during expression because UniProt states only a minority of hCRY2 molecules contain it naturally.
I will confirm the radical pair mechanism by illuminating the protein with blue light and measuring the FADH• radical signal at 580 nm. I then place it inside a Helmholtz coil at 0–500 µT to test whether the signal changes under a magnetic field, modelled directly on Xu et al. (2021, Nature).
I will confirm DrBphP photoswitching by tracking absorbance at 660 nm and 740 nm under alternating red and far-red light, checking whether the switching rate changes when hCRY2 receives an electromagnetic input.
I will confirm curli fiber self-assembly using Congo Red staining, which detects amyloid fiber formation by shifting absorbance to approximately 540 nm.
Technologies I will use
Intact LC-MS is my primary technology for confirming the molecular weight of the full fusion protein using the adjacent charge state method — the same approach used in this course on eGFP.
Tryptic peptide mapping by LC-MS/MS confirms the sequence of every domain by digesting the protein with trypsin and fragmenting each peptide in the mass spectrometer to give percentage amino acid coverage of the full construct.
UV-Vis spectroscopy is the central technology for confirming hCRY2 quantum sensing — tracking FAD loading, FADH• radical formation, and DrBphP photoswitching all through light absorbance measurements, modelled on Xu et al. (2021).
Helmholtz coil provides the controlled electromagnetic field to directly test whether hCRY2 responds to EM fields by measuring field-dependent changes in the FADH• radical signal.
SDS-PAGE gel electrophoresis is a quick first check after expression to confirm the protein is approximately the right size before moving to more detailed measurements.
Congo Red staining confirms curli fiber self-assembly by detecting amyloid fiber formation colorimetrically.
Benchling, AlphaFold, and IDT Codon Optimization were used in Aim 1 for all computational measurements — molecular weight, reading frame, active site geometry, and codon efficiency — forming the theoretical baseline that all Aim 2 experiments test against.
Waters Part I — Molecular Weight
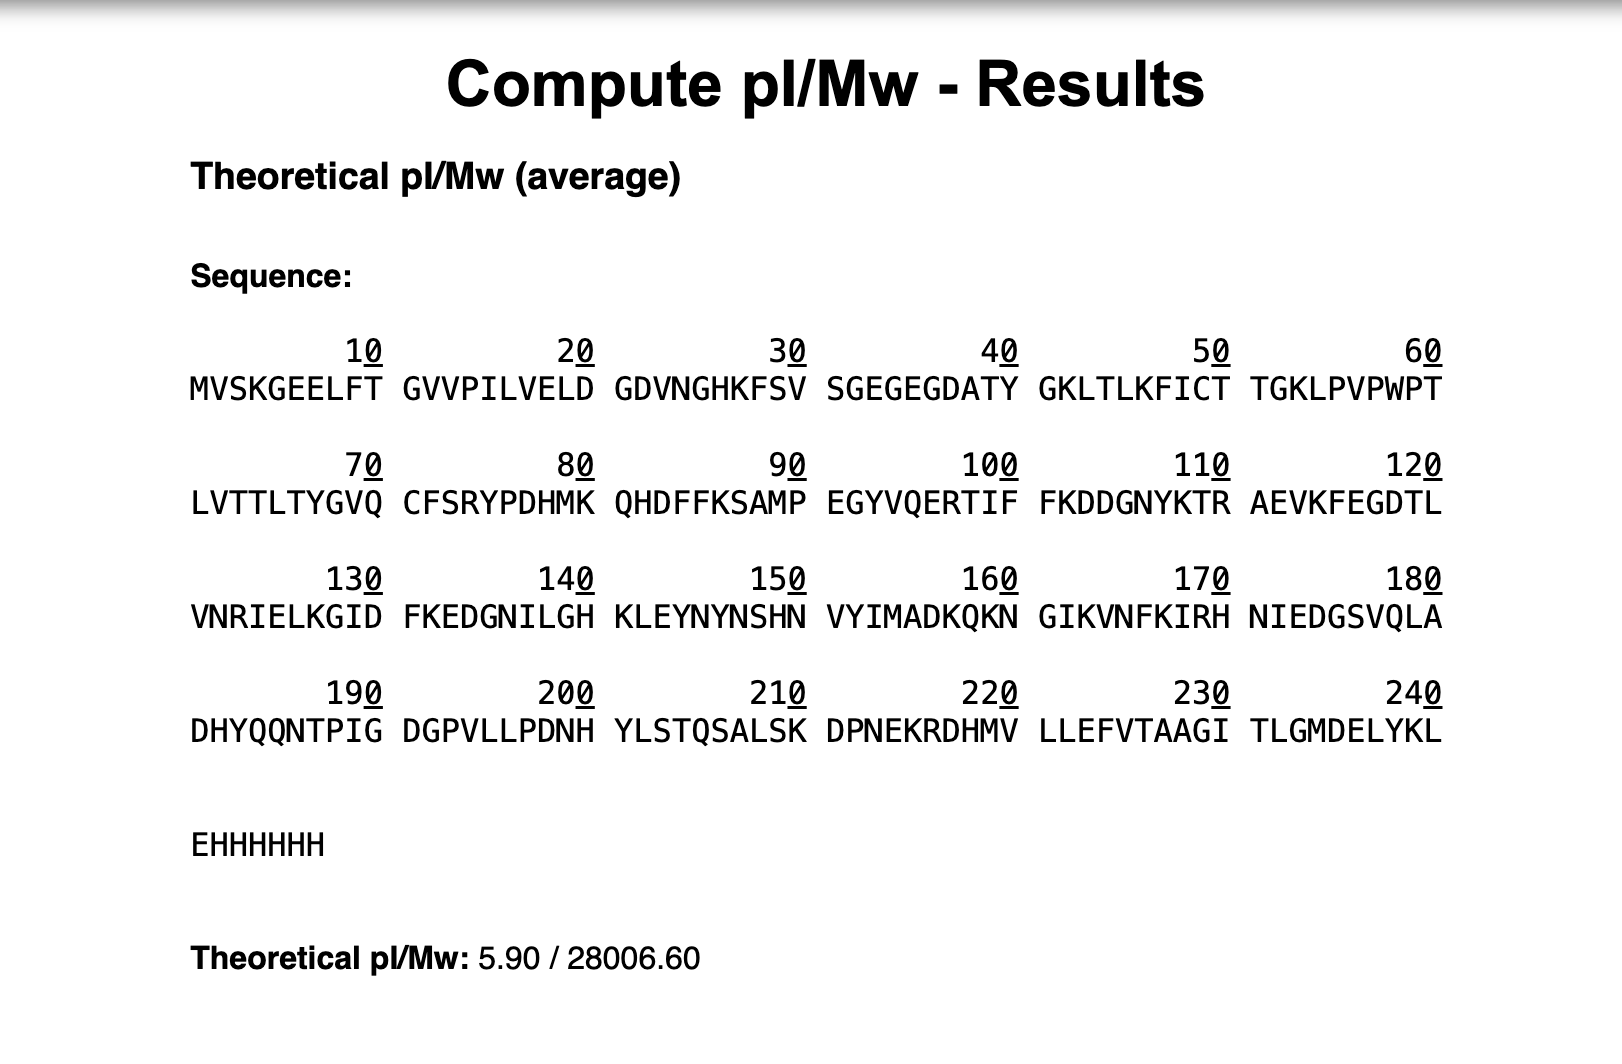
Theoretical Molecular Weight = 28,006.60 Da
- Adjacent Charge State Calculations:
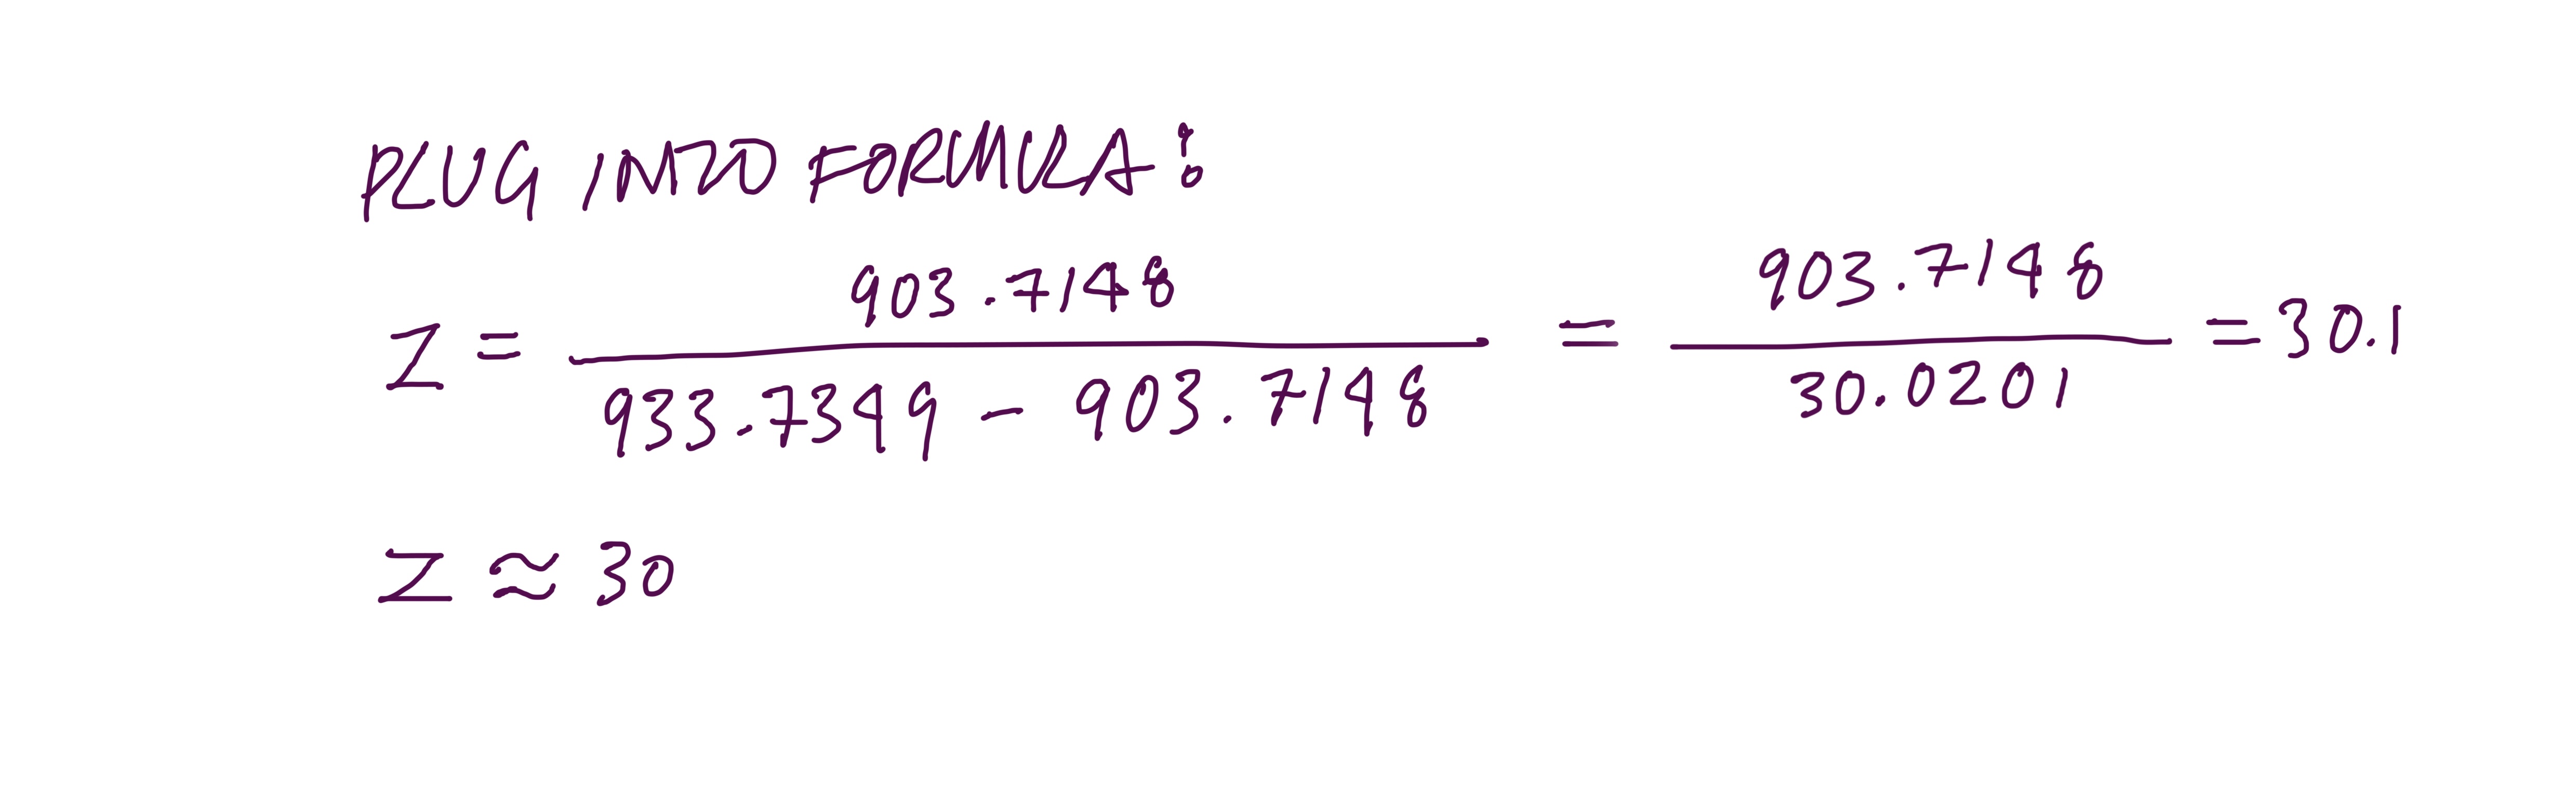
2.1 : Find z using the formula
Peaks chosen:
- Peak n = 933.7349
- Peak n+1 = 903.7148
 )
)
So peak n has charge state z = 30 and peak n+1 has charge state z = 31
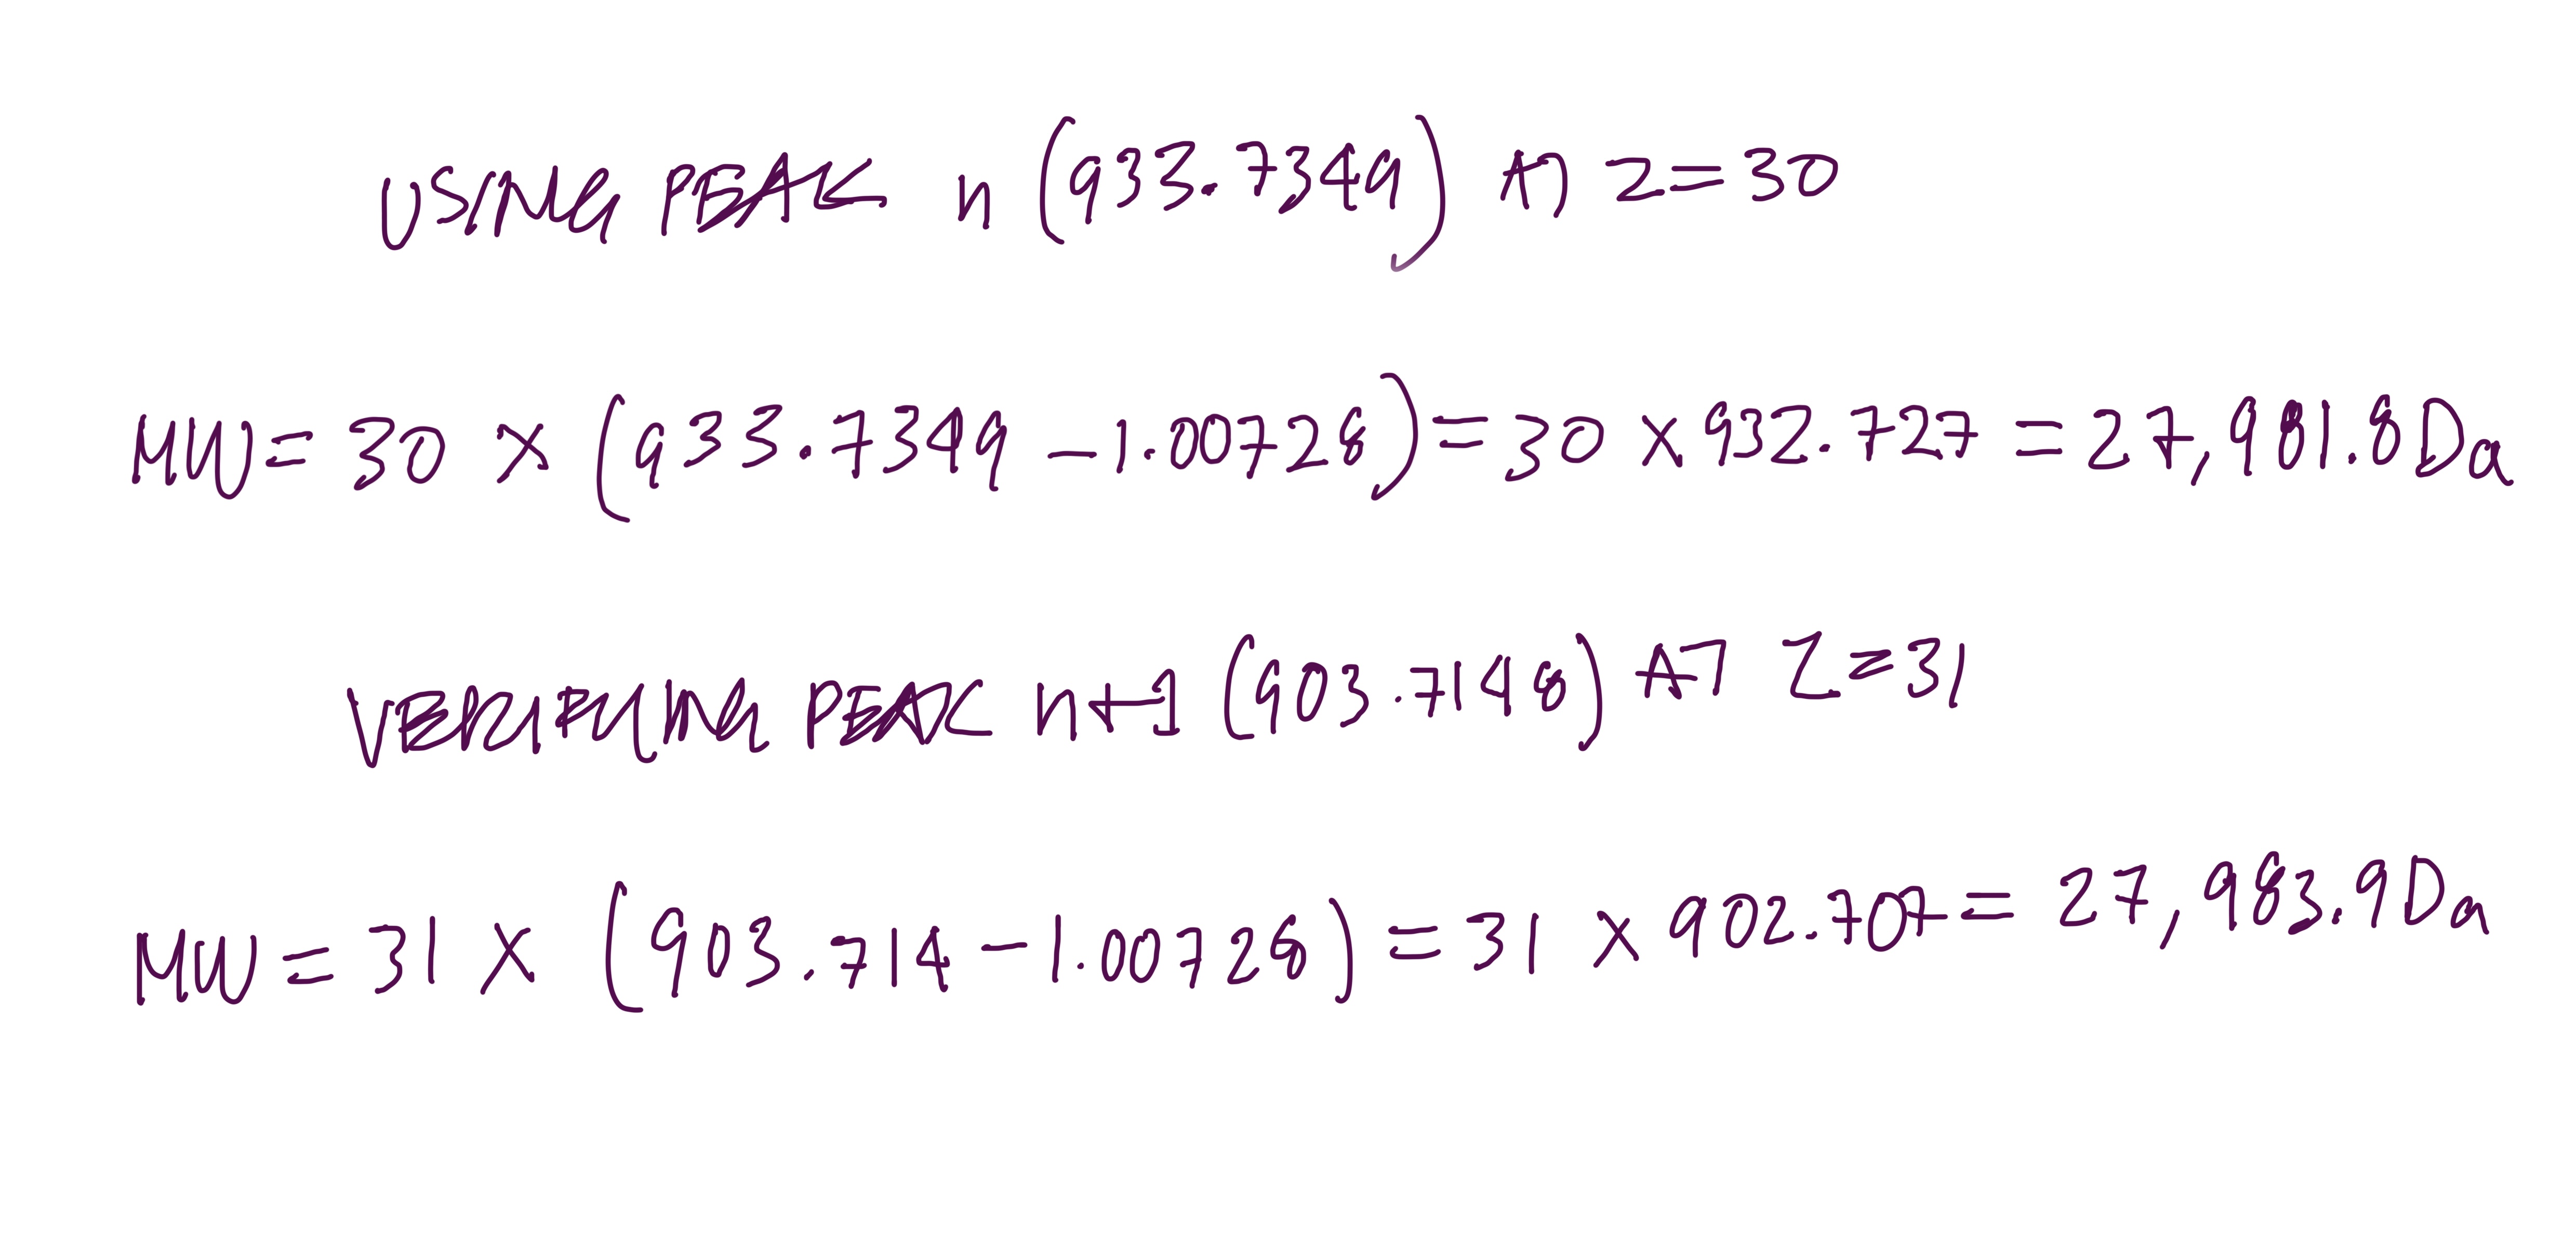
2.2 : Calculate MW
 )
)
Both give the same answer, measured MW ≈ 27,982 Da ≈ 28.0 kDa
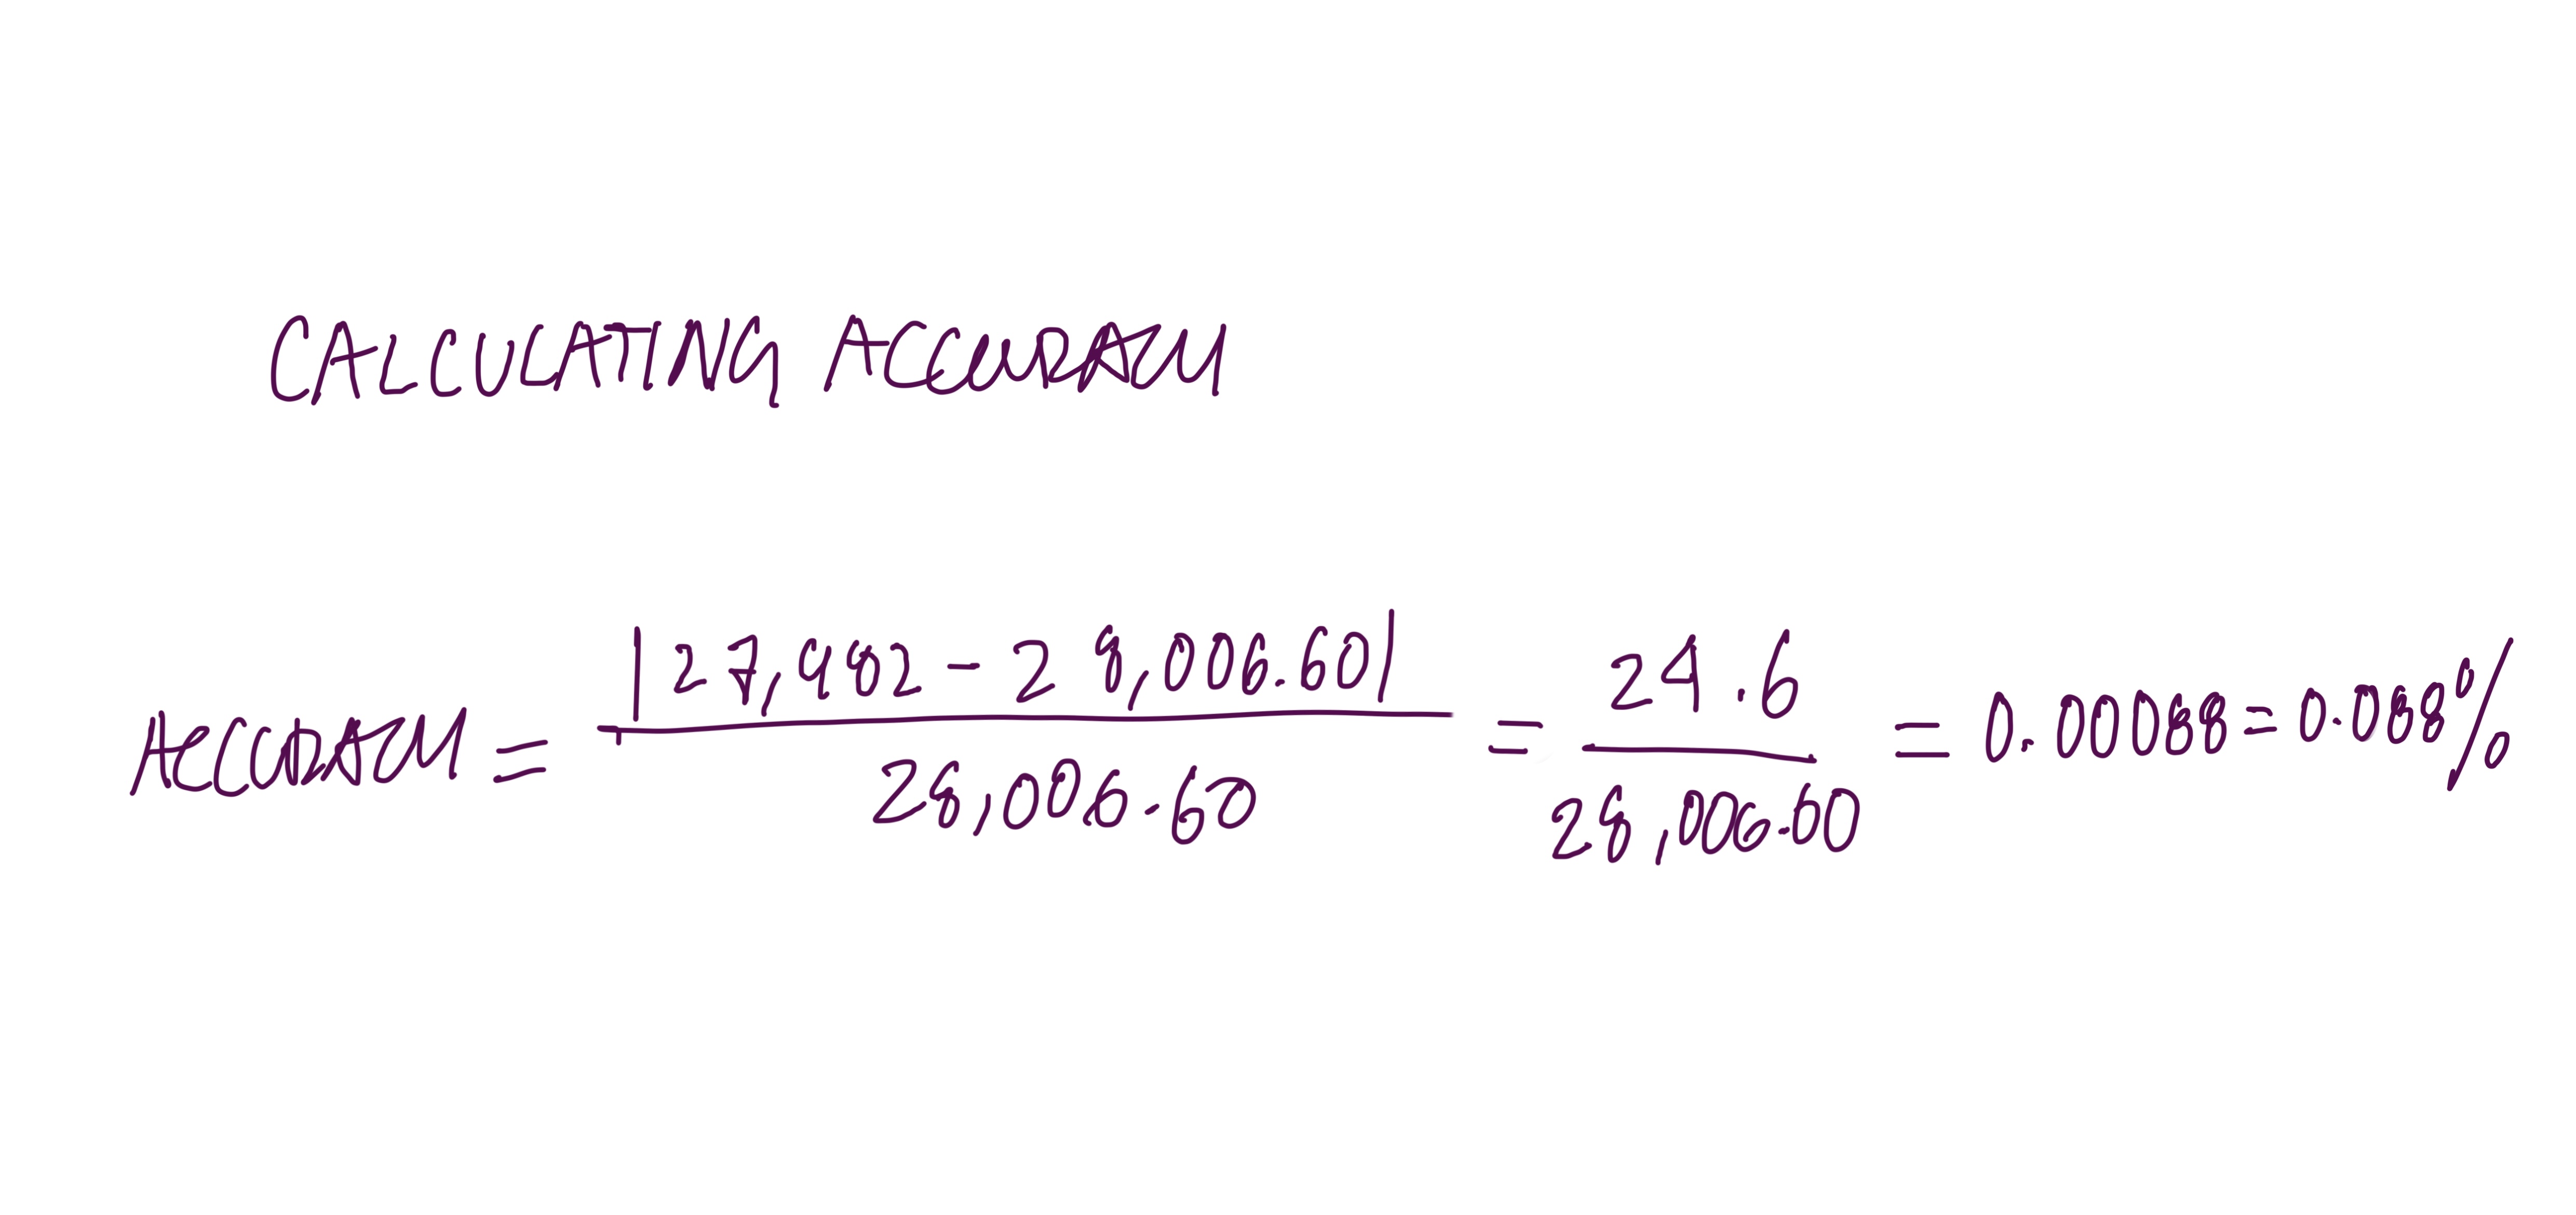
2.3 : Calculate Accuracy
 )
)
This is a very accurate measurement, with less than 0.1% error.
- Can you observe the charge state of the zoomed-in peak?
 )
)
Yes, you can; the charge state is z = 19.
In the zoomed inset of Figure 1, the isotope peaks are spaced approximately 0.053 m/z apart. The spacing between isotope peaks always equals 1/z, so:
You can tell because, at 30,000 resolution, the instrument can barely resolve the individual isotope peaks in this m/z range, which is why the zoom is needed. Without it, the peaks blur together, and you cannot measure the spacing. The zoom reveals the fine-scale isotope structure that indicates the charge state.
Homework: Waters Part IV — Oligomers
Finding Oligomers
7FU Decamer 10 × 340 kDa = 3,400 kDa = 3.4 MDa - Located at the 3.4 MDa peak on Figure 7
8FU Didecamer 20 × 400 kDa = 8,000 kDa = 8.0 MDa - Located at the 8.33 MDa peak on Figure 7 - (tallest peak)
8FU 3-Decamer 30 × 400 kDa = 12,000 kDa = 12.0 MDa - Located at the 12.67 MDa peak on Figure 7
8FU 4-Decamer 40 × 400 kDa = 16,000 kDa = 16.0 MDa - Not clearly visible on Figure 7 - (too low abundance to detect under these conditions)