Week 10: Advanced Imaging & Measurement Technology
Homework: Final Project
Please identify at least one (ideally many) aspect(s) of your project that you will measure. It could be the mass or sequence of a protein, the presence, absence, or quantity of a biomarker, etc.
Please describe all of the elements you would like to measure, and furthermore describe how you will perform these measurements. What are the technologies you will use (e.g., gel electrophoresis, DNA sequencing, mass spectrometry, etc.)? Describe in detail
I’ve written most of these up in my Final Project Protocol. My project requires a genetic switch to show an off/on fluorescence effect so I’m not measuring gradual trends in fluorescence. My main measurements will relate to:
- preparing proportions for the Agar LB mix with chloramphenicol. Measuring millilitres of water, grams of agar and grams of chloramphenicol.
- bacterial transformation measurements. Temperature to measure the critical range for where competent E. coli are shocked and made receptive to accepting plasmids. Measuring time to wait for competent bacteria to absorb plasmids.
- preparation of acetic acid solutions. Volumetric calculations to create separate solutions with pH 5.5 and pH 7.0. A pH meter will be needed to verify pH of solutions.
- measuring dimensions of the 3D printed Green man sculptures I plan to create. I need to be careful measuring the dimensions of printed sculptures because I’ll need to contain the printed shape within a slightly larger bioreactor.
Waters Part I — Molecular Weight
We will analyze an eGFP standard on a Waters Xevo G3 QTof MS system to determine the molecular weight of intact eGFP and observe its charge state distribution in the native and denatured (unfolded) states. The conditions for LC-MS analysis of intact protein cause it to unfold and be detected in its denatured form (due to the solvents and pH used for analysis).
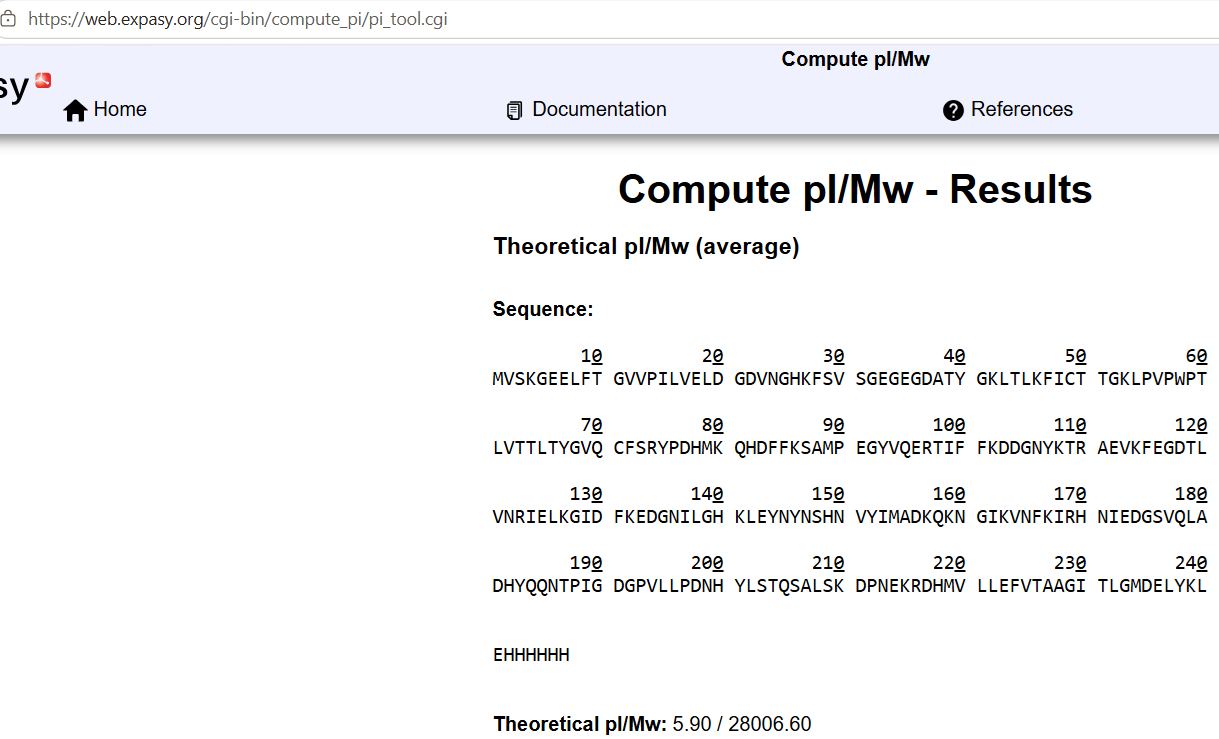
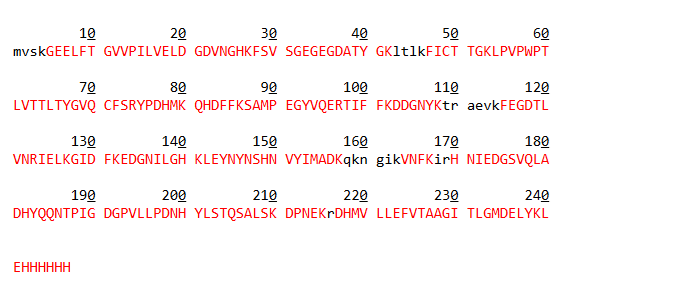
1. Based on the predicted amino acid sequence of eGFP (see below) and any known modifications, what is the calculated molecular weight? You can use an online calculator like the one at https://web.expasy.org/compute_pi/
2. Calculate the molecular weight of the eGFP using the adjacent charge state approach described in the recitation. Select two charge states from the intact LC-MS data (Figure 1) and Determine for each adjacent pair of peaks using the prescribed formula ()
Here is the table I produced through a spreadsheet:
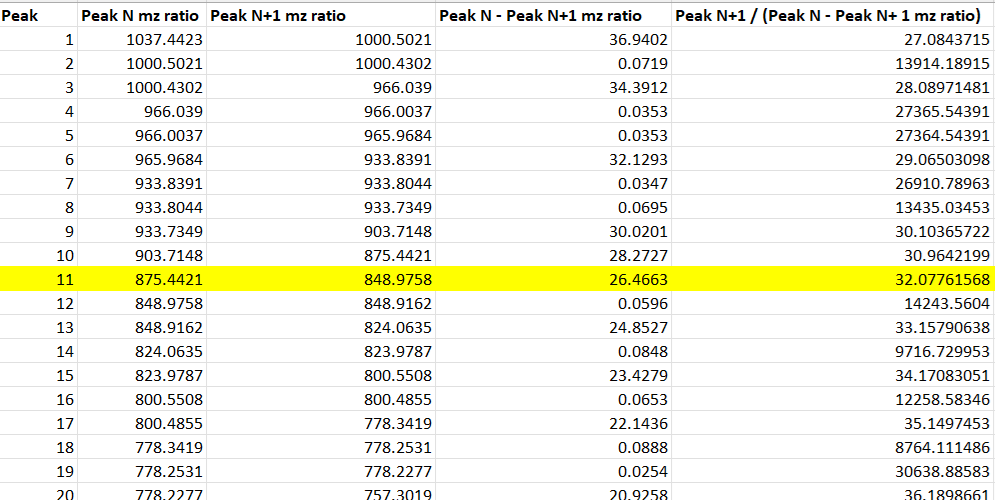
To calculate the weight of the molecule, I would look at the highest peak (Peak 11), and calculate:
molecular weight = m/z ratio x z = 875.9758 x 32.07761568 = 28099.22
The theoretical weight provided by Expasy is 28006.60.
Accuracy = (|MW-experiment - MW-theoretical|) / MW-theory Accuracy = (28099.22 - 28006.60)/28006.60 Accuracy = 0.0033070776
**2.1 Determine for each adjacent pair of peaks (n, n+1) using the formula: Z = M(Zn+1) / ()
Waters III - Peptide Mapping - primary structure
1. How many Lysines (K) and Arginines (R) are in eGFP? Please circle or highlight them in the eGFP sequence given in Waters Part I question 1 above. (Note: adding the sequence to Benchling as an amino acid file and clicking biochemical properties tab will show you a count for each amino acid)
There are 20 Lysines (K) and 6 Arginines (R) in this sequence: MVSKGEELFTG VVPILVELDG DVNGHKFSVS GEGEGDATYG KLTLKFICTT GKLPVPWPTL VTTLTYGVQC FSRYPDHMKQ HDFFKSAMPE GYVQERTIFF KDDGNYKTRA EVKFEGDTLV NRIELKGIDF KEDGNILGHK LEYNYNSHNV YIMADKQKNG IKVNFKIRHN IEDGSVQLAD HYQQNTPIGD GPVLLPDNHY LSTQSALSKD PNEK****RDHMVL LEFVTAAGIT LGMDELYKLE HHHHHH
**2.How many peptides will be generated from tryptic digestion of eGFP?
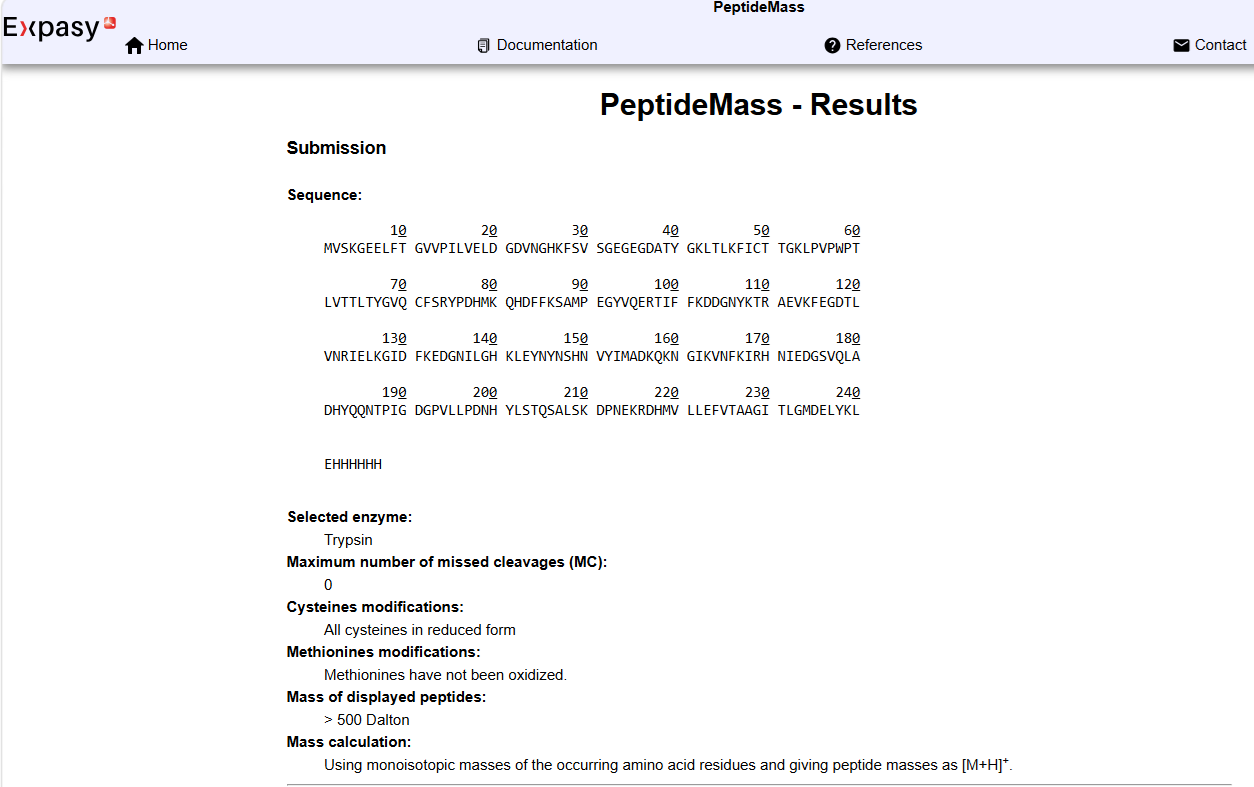
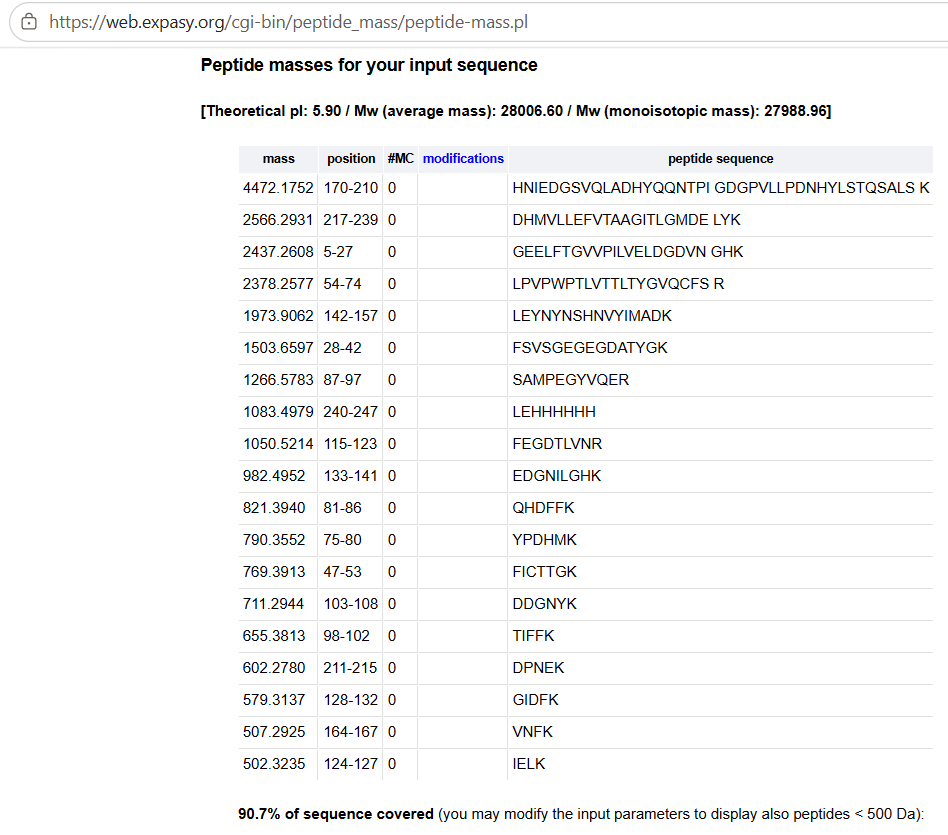
Based on the count shown in the table of peptides, there are 19 peptides.
3. Based on the LC-MS data for the Peptide Map data generated in lab (please use Figure 5a as a reference) how many chromatographic peaks do you see in the eGFP peptide map between 0.5 and 6 minutes? You may count all peaks that are >10% relative abundance.
First, I interpret >10% relative abundance as meaning >10% of 1.2e7 which would be > 1.2e6 - between the second and third tick marks on the y axis. I counted 18
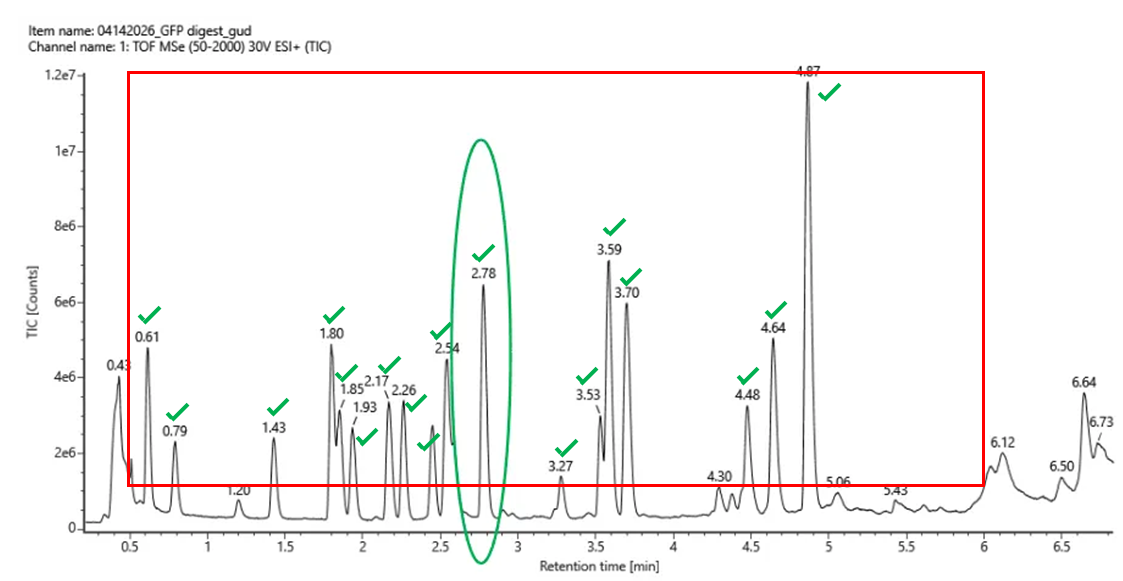
4. Assuming all the peaks are peptides, does the number of peaks match the number of peptides predicted from question 2 above? Are there more peaks in the chromatogram or fewer?
There are fewer peaks than predicted. The difference may owe to limitations interpreting the graph. The point at 4.30 minutes just touches the line but is not above it. Other people may think of including that point in the list of peaks if they think it is greater than 10% of relative abundance.
5.Identify the mass-to-charge (m/z) of the peptide shown in Figure 5b. What is the charge (z) of the most abundant charge state of the peptide (use the separation of the isotopes to determine the charge state). Calculate the mass of the singly charged form of the peptide ([M+H]+) based on its (m/z) and z.
The two successive peaks showing the most abundance are 525.76712 and 526.25918. Using the formula for z mentioned earlier,
= 525.76712/(526.25918 - 525.76712) = 525.76712/0.49798 = 1055.7996
Calculating the mass of that peptide it would be = (m/z) x z = 525.76712 x 1055.7996 = 555104.71 Daltons - which is wrong.
6. Identify the peptide based on comparison to expected masses in the PeptideMass tool. What is mass accuracy of measurement? Please calculate the error in ppm. My answer in 5 is clearly wrong and don’t think it’s useful to calculate the accuracy as it is just too far away from any of the predicted peptide masses. However, based on the recitation video, you would calculate the ppm error by multiplying the accuracy by 1000000.
7. What is the percentage of the sequence that is confirmed by peptide mapping? 88%.
Waters Part V - Did I make GFP?
Thoeretical weight: 28006.6 Daltons (28.0066 kDa) Observed weight on the Intact LC-MS: 28099.22 Daltons (28.09922kDa) PPM mass error: = accuracy x 1000000 = 0.0033070776 x 1000000 = 3,307 ppm.