Biological engineering application I propose a “DNA Compiler,” a software tool that helps researchers turn DNA designs into safe, synthesis-ready sequences. The main idea is to build safety checks directly into the design process rather than relying only on downstream screening or manual review. The compiler would analyze a DNA sequence, flag potential issues, and suggest safer alternatives (for example, adjusting sequence features or highlighting areas that require review). It would also generate a clear record of how the design was modified or approved. The goal is to make good safety practices automatic and easy to follow.
Week 2 Homework Documentation This week I worked on DNA gel art, restriction digests, and DNA design. I designed a gel art pattern, ran the gel in lab, and prepared a Benchling construct for a spider silk equivalent protein.
Part 1: Benchling and In-silico Gel Art For the in-silico gel art part, I used restriction digests of lambda DNA to plan a gel pattern before running the wet-lab version. The main idea was to use different restriction enzymes to create different DNA fragment sizes, so the bands would appear at different positions in the gel.
Final projects were added to the slide and the python file were submitted too.
Post-Lab Questions 1. One paper I found is “AssemblyTron: flexible automation of DNA assembly with Opentrons OT-2 lab robots” by Bryant et al. The paper describes a workflow for using an Opentrons OT-2 robot to automate DNA assembly. Instead of manually pipetting every DNA part, enzyme, and reagent, the robot can set up many assembly reactions in a more consistent way. The authors made this system because DNA assembly is a common step in synthetic biology, but it becomes slow and error-prone when many constructs have to be tested.
Part A – Conceptual Questions How many amino acid molecules are in 500 g of meat? A typical amino acid has a mass of about 100 g per mole.
If you have 500 g, that corresponds to roughly 5 moles.
Since one mole contains about 6 × 10²³ molecules, 5 moles would contain about 3 × 1024 amino acid molecules.
Week 5: Protein Design Part II Part A: SOD1 Binder Peptide Design Background Superoxide dismutase 1, or SOD1, is an enzyme that helps protect cells from oxidative stress by converting superoxide radicals into hydrogen peroxide and oxygen. SOD1 normally folds into a stable structure and forms a homodimer. It also binds metal cofactors, which are important for its activity.
DNA Assembly Homework Phusion High-Fidelity PCR Master Mix contains a high-fidelity DNA polymerase, dNTPs, MgCl2, buffer salts, and stabilizers. The polymerase copies the DNA template, while its proofreading activity helps reduce mutations. The dNTPs are the building blocks used to make the new DNA strand. MgCl2 is needed for polymerase activity, and the buffer keeps the pH and salt conditions suitable for PCR. The master mix format also makes the reaction more consistent because many components are already premixed.
Homework: IANNs and Fungal Materials Assignment Part 1: Intracellular Artificial Neural Networks 1. Advantages of IANNs over traditional genetic circuits IANNs can handle more than simple on/off behavior. Traditional genetic circuits often work like Boolean logic gates, where an input is either present or absent and the output is either low or high. In real cells, signals are usually more gradual than that. An IANN can combine several input levels and produce a more flexible output.
Homework: Cell-Free Systems and Synthetic Minimal Cells General homework questions 1. Advantages of cell-free protein synthesis Cell-free protein synthesis is useful because it is faster and easier to control than expression in living cells. Since there are no cells to keep alive, I can directly change the DNA amount, salts, cofactors, energy source, and reaction conditions.
Final Project Measurement For the development of bio-synthetic spider silk musical strings, I will measure several critical parameters to ensure the protein is synthesized correctly, the fiber is engineered for high tension, and the resulting sound meets professional acoustic standards.
Aspects to be Measured
Protein sequence and purity: I will verify that the recombinant “Mini-Spidroin” matches the intended genetic design and that all bacterial cellular debris has been removed. Protein concentration: The density of the purified protein in the liquid “spin dope” must be quantified to ensure it has the correct viscosity for extrusion. Fiber diameter and morphology: I will measure the thickness of the thread to ensure it remains consistent and within the 0.20–0.30 mm range required for instrument compatibility. Mechanical properties: Specifically, I will measure the tensile strength and elasticity of the dried fiber to determine if it can withstand the high-tension environment of a violin or guitar. Acoustic frequency and harmonics: I will measure the fundamental resonance and the richness of the overtones produced when the string is under load. Measurement Methods and Technologies
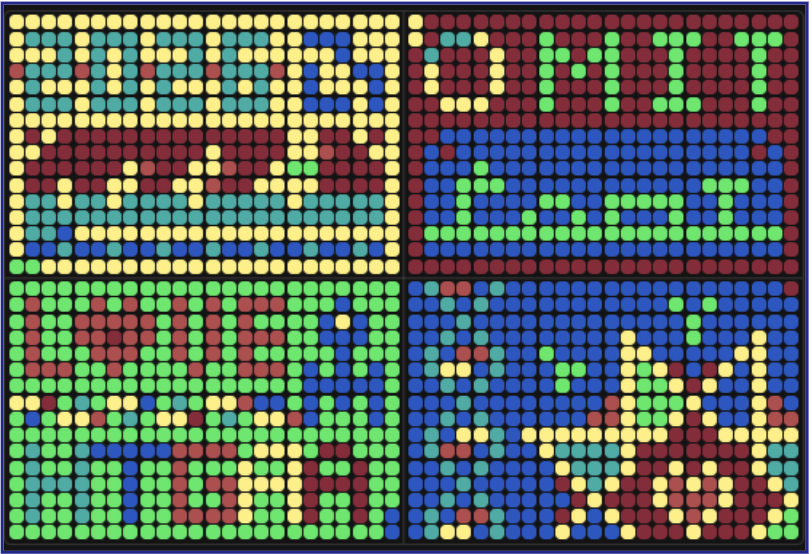
Week 11 Homework: Bioproduction and Cloud Labs Part A: The 1,536 Pixel Artwork Canvas I contributed two pixels on the bottom left of the artwork, but for some reason they did not sync or show up correctly in the final version. I still liked the idea of the project because it turned a biology class assignment into a shared artwork, where everyone’s tiny contribution could become part of a larger image.
Subsections of Homework
Week 1 HW: Principles and Practices
1. Biological engineering application
I propose a “DNA Compiler,” a software tool that helps researchers turn DNA designs into safe, synthesis-ready sequences. The main idea is to build safety checks directly into the design process rather than relying only on downstream screening or manual review. The compiler would analyze a DNA sequence, flag potential issues, and suggest safer alternatives (for example, adjusting sequence features or highlighting areas that require review). It would also generate a clear record of how the design was modified or approved. The goal is to make good safety practices automatic and easy to follow.
2. Governance and policy goals
Primary goal: reduce harm while supporting useful biological research.
Sub-goals:
Prevent accidents by identifying risky designs early in the process.
Improve accountability by keeping a clear record of how designs were created and approved.
Avoid slowing research unnecessarily by offering helpful suggestions rather than simply blocking designs.
3. Governance actions
Option 1, Institutional adoption
Research institutions could make the DNA Compiler part of their standard workflow. Before ordering synthetic DNA, researchers would run their designs through the tool.
Purpose: move safety checks earlier in the process. Design: integrate with existing ordering systems and biosafety review procedures. Assumptions: researchers will use the tool if it is easy and helpful. Risks: people may try to bypass it if it becomes too restrictive.
Option 2, Vendor integration
DNA synthesis companies could accept or encourage compiler-generated safety reports when customers submit sequences.
Purpose: create a shared safety baseline across different labs and providers. Design: vendors recognize a standard report format generated by the compiler. Assumptions: companies see value in reducing risk and simplifying screening. Risks: could increase costs or create barriers if requirements are too strict.
Option 3, Shared rule updates
A community group maintains and updates the safety rules used by the compiler as new risks or best practices emerge.
Purpose: keep the tool current as biology advances. Design: periodic updates distributed to users, similar to software updates. Assumptions: collaboration improves coverage of new issues. Risks: disagreements about rules or slow updates.
4. Scoring
(1 = best)
Goal
Option 1
Option 2
Option 3
Enhance biosecurity
1
2
2
Foster lab safety
1
2
2
Protect environment
2
2
2
Minimize burden
2
3
2
Feasibility
1
2
2
Promote constructive uses
1
2
1
5. Prioritization
I would prioritize Option 1 first because it is the most practical starting point. Integrating the DNA Compiler into institutional workflows creates immediate benefits by improving design quality and reducing accidents without requiring major policy changes. After adoption grows, Option 2 can extend the approach across the industry by creating shared standards between labs and vendors. Option 3 should develop alongside these steps to ensure that the rules evolve over time, but it likely works best once the tool already has a strong user base.
Homework Questions from Professor Jacobson
Nature’s machinery for copying DNA is DNA polymerase. According to the lecture slides, an error-correcting polymerase has an error rate of approximately 1 error per 10⁶ bases added.
The human genome is about 3.2 × 10⁹ base pairs long.
Comparing these numbers, if replication relied only on polymerase accuracy, we would expect on the order of thousands of errors during replication of a single human genome. This highlights a discrepancy between the intrinsic error rate of polymerase and the need to faithfully copy very large genomes.
Biology resolves this by incorporating multiple layers of error correction. DNA polymerases include proofreading activity that detects and removes mismatched nucleotides during synthesis, and additional repair pathways (such as mismatch repair systems shown in the lecture) further correct errors after replication. Together, these mechanisms allow cells to maintain high fidelity despite the large size of the genome.
The lecture states that an average human protein corresponds to about 1036 base pairs.
Since codons consist of three nucleotides, this corresponds to roughly a few hundred amino acids. The genetic code is degenerate, meaning that multiple codons can encode the same amino acid. Because there are 64 possible codons but only 20 amino acids, many different DNA sequences can theoretically encode the same protein sequence. The number of possible coding sequences therefore grows exponentially with protein length, so an average human protein can be encoded by a very large number of distinct DNA sequences.
In practice, not all synonymous sequences work equally well. The lecture shows that nucleotide composition (such as GC content) and sequence-dependent secondary structures affect molecular behavior. Different synonymous sequences can produce different RNA folding patterns or energetics, which can influence transcription, translation efficiency, and stability. As a result, biological and physical constraints limit which DNA sequences successfully produce the desired protein, even if they encode the same amino acid sequence.
Homework Questions from Dr. LeProust
The most commonly used method is solid-phase phosphoramidite chemical synthesis. In this approach, nucleotides are added sequentially to a growing DNA chain attached to a solid support. Each cycle consists of coupling a phosphoramidite nucleotide, capping unreacted sites, oxidation, and deprotection, and this cycle is repeated until the desired length is reached.
Direct oligo synthesis proceeds one base at a time, and each chemical addition step is not perfectly efficient. Because the synthesis is iterative, small inefficiencies compound with every cycle. As the sequence length increases:
The fraction of full-length molecules decreases.
Products accumulate.
Overall yield/purity drop significantly.
This makes it increasingly difficult to obtain high-quality long oligos directly.
A 2000 bp gene would require thousands of sequential chemical coupling steps. Since each step has less than 100% efficiency, the probability of producing a perfect full-length molecule becomes extremely low. Errors and truncations would dominate the product mixture.
Instead, long genes are typically made by synthesizing shorter oligos (example around 100–200 nt) and then assembling them enzymatically into longer fragments or full genes. This avoids the exponential loss in yield and accuracy associated with very long direct chemical synthesis.
Homework Question from George Church
Unlike NA:NA base pairing or the NA to AA genetic code, AA:AA interactions are not defined by a strict one-to-one symbolic mapping. Instead, an AA:AA code would be based on physico chemical compatibility between amino acid side chains. Key rules would include charge complementarity (positive interacting with negative residues), hydrogen-bond donor/acceptor matching, hydrophobic residues packing together, and steric shape complementarity for efficient packing. This is similar to lecture notes framing that different biological codes reflect interaction constraints: DNA basepairs emphasize specific pairing rules, while protein interactions emerge from chemical properties and geometry rather than fixed symbolic pairs.
Week 2 Homework
Week 2 Homework
Documentation
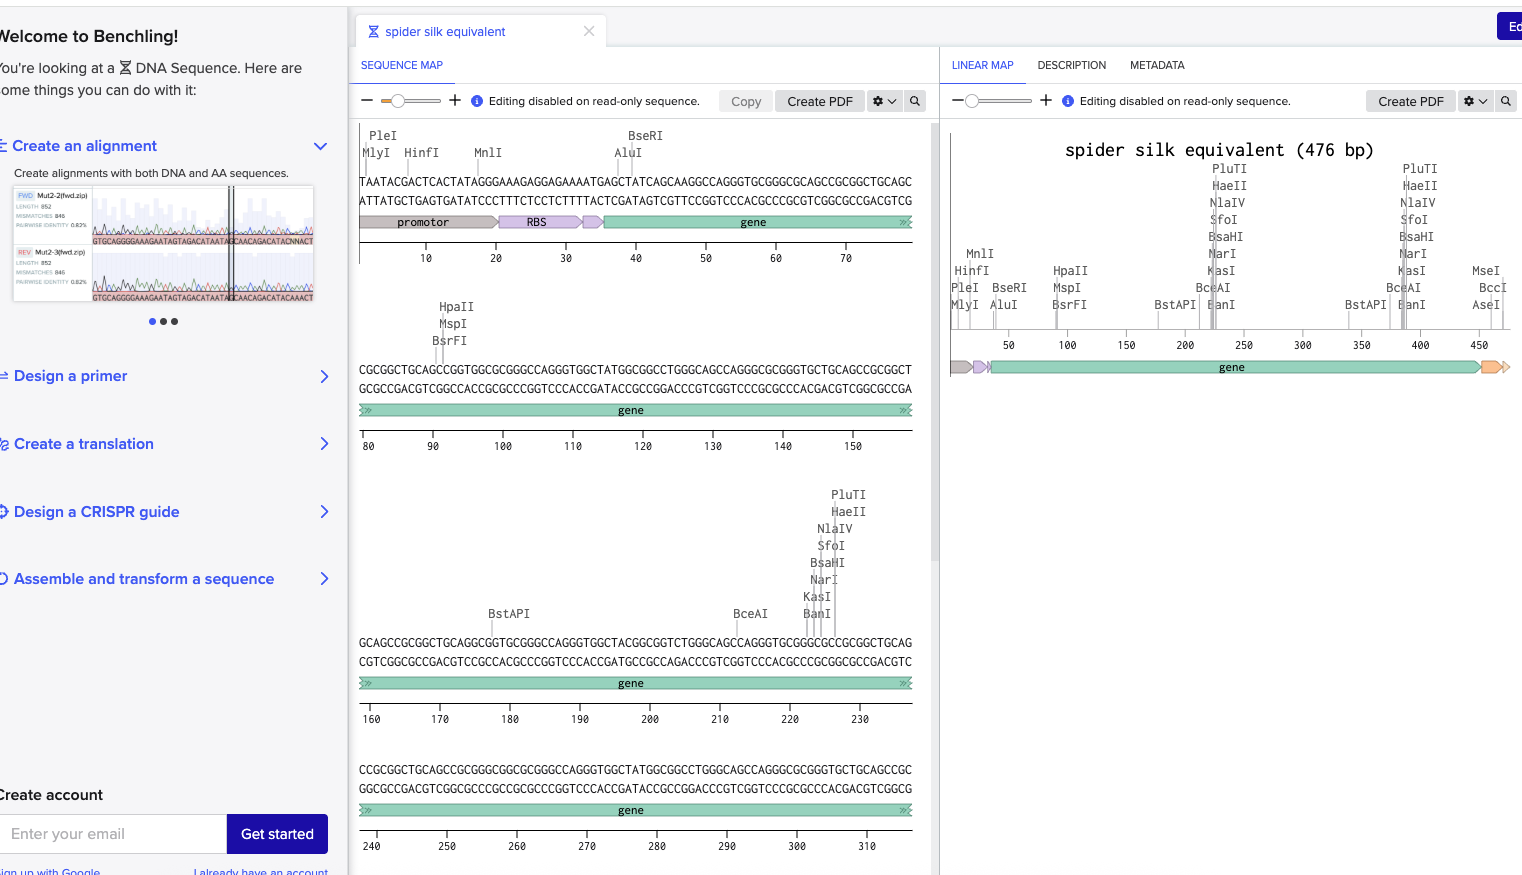
This week I worked on DNA gel art, restriction digests, and DNA design. I designed a gel art pattern, ran the gel in lab, and prepared a Benchling construct for a spider silk equivalent protein.
Part 1: Benchling and In-silico Gel Art
For the in-silico gel art part, I used restriction digests of lambda DNA to plan a gel pattern before running the wet-lab version. The main idea was to use different restriction enzymes to create different DNA fragment sizes, so the bands would appear at different positions in the gel.
Part 2: Gel Art: Restriction Digests and Gel Electrophoresis
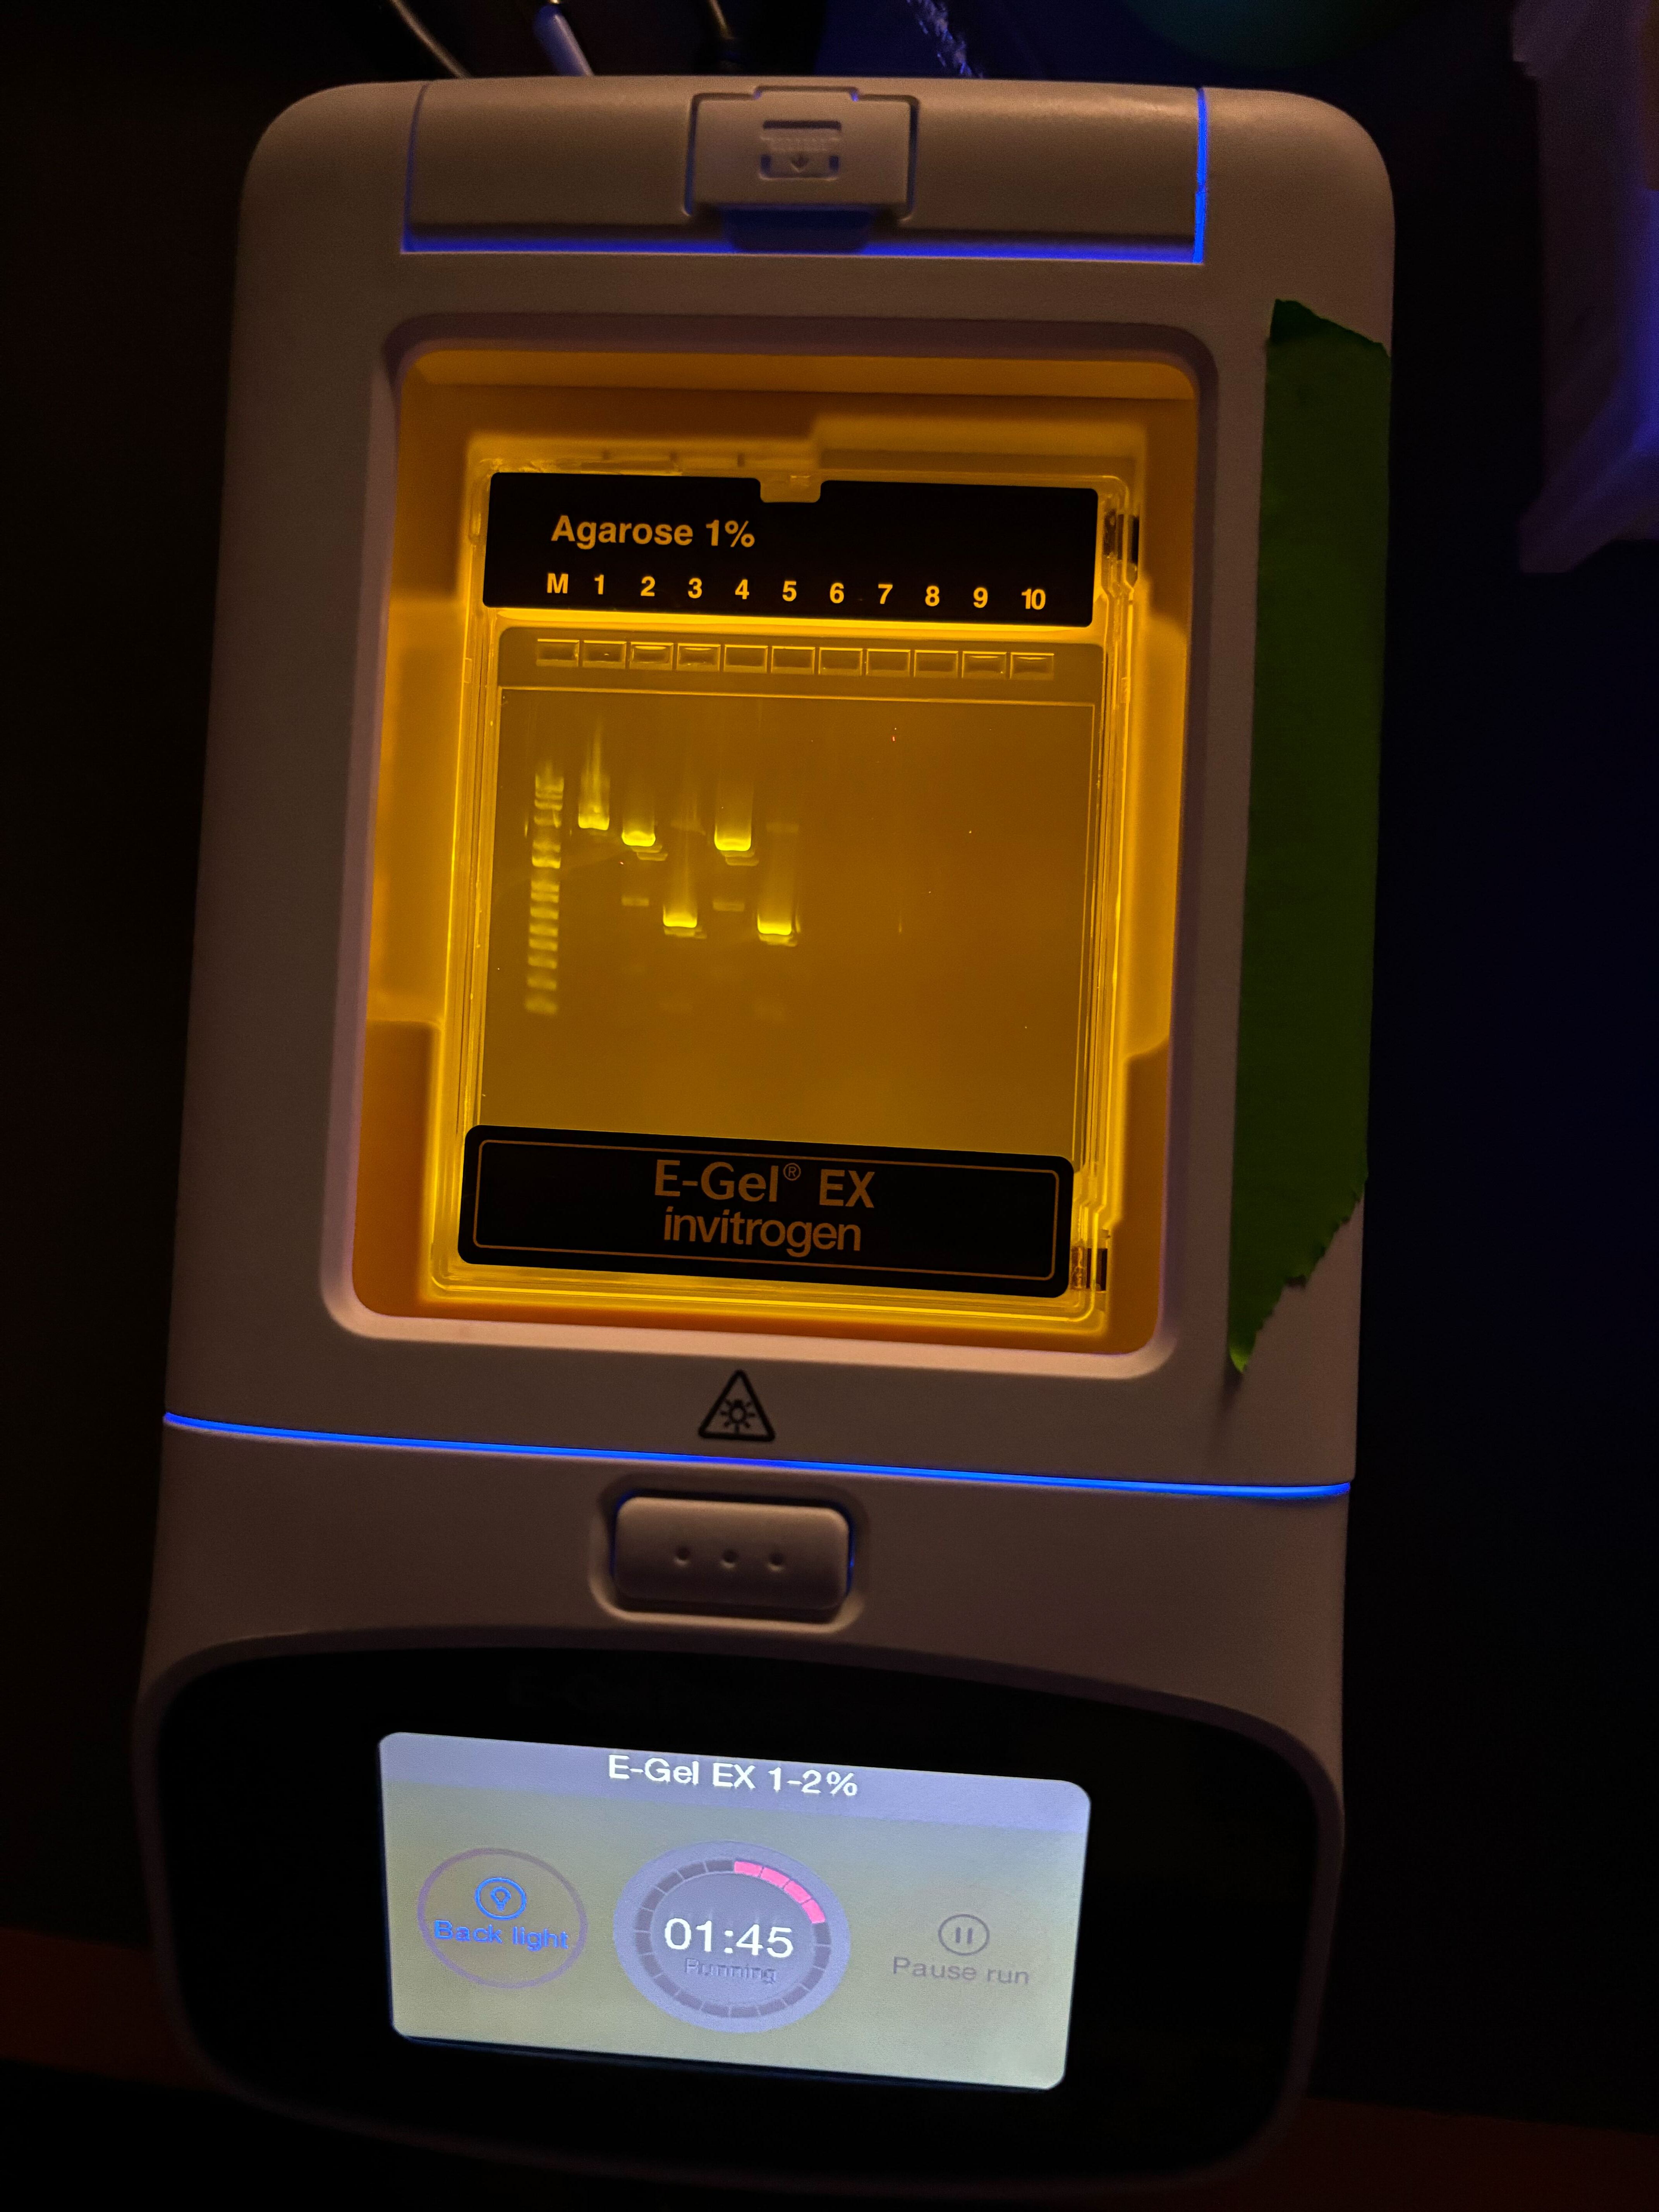
I performed the gel art experiment in lab based on the in-silico design. The gel was cast, the DNA digest samples were loaded, electrophoresis was run, and the gel was imaged.
The final gel image showed the wells clearly, but the band pattern was faint and did not come out very strongly. This could have been due to low DNA concentration, loading issues, imaging exposure, or the fragments not separating visibly enough.
Part 3: DNA Design Challenge
3.1 Choose your protein
I chose a spider silk equivalent protein because my final project is about making synthetic spider silk-like material. Spider silk is interesting because it is strong, lightweight, and could be useful as a biomaterial.
Codon optimization is needed because different organisms use different codons more often, even when the codons encode the same amino acid. If the DNA uses codons that are rare in the host, the protein may express poorly.
I optimized the sequence for bacterial expression, since E. coli is a common host for producing recombinant proteins. This makes sense for my project because I want to test whether a spider silk-like protein can be expressed efficiently.
3.4 You have a sequence, now what?
This DNA sequence can be used as an expression construct. The promoter and RBS help start transcription and translation, the coding sequence encodes the spider silk equivalent protein, and the His tag can help with purification.
In a cell-based system, the DNA could be placed in a plasmid and transformed into E. coli. The cells would transcribe the DNA into mRNA and translate the mRNA into protein. In a cell-free system, the DNA could be added directly to a Tx/Tl reaction to produce the protein without living cells.
Part 4: Prepare a Twist DNA Synthesis Order
For this part, I prepared a DNA synthesis design for my final project. I built an annotated Benchling insert fragment for a spider silk equivalent protein. The construct includes a promoter, RBS, coding sequence, His tag, and stop codon.
I used this insert as the basis for a Twist synthesis setup. The goal was to make a construct that could later be used for expression and testing of a synthetic spider silk-like protein.
Part 5: DNA Read/Write/Edit
5.1 DNA Read
I would want to sequence my spider silk equivalent construct to confirm that the ordered DNA matches the design. This is important because the sequence is repetitive, and even small errors could affect expression or the final protein.
I would use Sanger sequencing because this construct is short enough to check with sequencing primers. Sanger sequencing is a first-generation sequencing method. The input would be purified plasmid DNA or a PCR product. The sample would be prepared with a sequencing primer and sent for sequencing.
Sanger sequencing uses DNA synthesis with fluorescent chain-terminating nucleotides. The output is a chromatogram and a DNA sequence, which I would align to my designed construct.
5.2 DNA Write
I would want to synthesize the DNA sequence for my spider silk equivalent protein. This would let me test whether the designed repetitive protein can be produced and eventually assembled into a silk-like material.
I would use commercial DNA synthesis, such as Twist, because it is faster and more reliable than manually assembling the sequence. The basic steps are to design the DNA, codon optimize it, add expression parts, check the sequence, order it, and then test it in cells or a cell-free system.
One limitation is that repetitive DNA can be harder to synthesize accurately. Longer or highly repetitive constructs may also be more expensive or take longer to produce.
5.3 DNA Edit
I would edit an expression host such as E. coli to improve production of spider silk-like proteins. For example, I might reduce protease activity or improve amino acid supply so the host can make more of the recombinant protein.
I would use CRISPR-Cas9 or recombineering for this. The edit would need a target site, a guide RNA, and a repair template. After editing, I would screen colonies and sequence the edited region to confirm the change.
The main limitations are editing efficiency, possible off-target edits, and the fact that improving protein production may require testing several different edits.
Week 3 HW: Lab Automation
Final projects were added to the slide and the python file were submitted too.
Post-Lab Questions
1.
One paper I found is “AssemblyTron: flexible automation of DNA assembly with Opentrons OT-2 lab robots” by Bryant et al. The paper describes a workflow for using an Opentrons OT-2 robot to automate DNA assembly. Instead of manually pipetting every DNA part, enzyme, and reagent, the robot can set up many assembly reactions in a more consistent way. The authors made this system because DNA assembly is a common step in synthetic biology, but it becomes slow and error-prone when many constructs have to be tested.
I think this is a useful example because it shows automation being used for a real bottleneck in biology. A lot of synthetic biology depends on building and testing many genetic designs, not just making one perfect construct. The Opentrons robot helps make that process more scalable and less dependent on repetitive manual pipetting. This is especially relevant for projects where small volume differences could affect whether a construct works or not.
2. Automation plan for my final project
For my final project, I want to synthetically produce spider silk proteins and compare which expression or assembly conditions give the best silk-like material. The part I would automate is the screening process, since spider silk production depends on many variables: DNA construct design, protein concentration, buffer composition, pH, salt concentration, and drying or assembly conditions. Instead of testing each condition by hand, I would use an Opentrons-style liquid handler to set up a 96-well plate with many small-scale reactions.
A possible workflow would be:
Dispense cell-free protein synthesis master mix or expression reagents into each well.
Add different spider silk protein DNA constructs to different rows or columns.
Add additives or buffer conditions, such as different pH levels, salts, or crowding agents.
Mix each well consistently using repeated pipetting.
Incubate the plate so the silk proteins are expressed.
Transfer small amounts of the expressed protein into assembly wells with different precipitation or fiber-forming conditions.
Measure output using fluorescence, absorbance, viscosity, or imaging to identify which conditions give the strongest or most fiber-like material.
The main reason automation would help is that spider silk synthesis probably needs a lot of trial and error. A robot would let us test many conditions in parallel while keeping the volumes and timing more consistent. This would make it easier to see which variables actually matter, instead of worrying that the result changed because of manual pipetting differences.
Week 4 HW: Protein Design
Part A – Conceptual Questions
How many amino acid molecules are in 500 g of meat?
A typical amino acid has a mass of about 100 g per mole. If you have 500 g, that corresponds to roughly 5 moles. Since one mole contains about 6 × 10²³ molecules, 5 moles would contain about 3 × 1024 amino acid molecules.
This shows how enormous molecular numbers are, even in everyday amounts of food.
Why don’t we turn into a cow when we eat beef?
When we digest food, proteins are broken down into individual amino acids. Our body does not keep cow proteins intact. Instead, we reuse those amino acids to build new proteins based on instructions from our own DNA.
So what we eat provides building blocks, not the identity of the organism.
Is it possible to create new, artificial amino acids?
Yes. Chemists can synthesize amino acids that do not occur naturally. These can include unusual side chains, special reactive groups, or atoms like fluorine. Such modified amino acids are used in research to design proteins with new properties.
Where did amino acids originate before life existed?
Amino acids could have formed through simple chemical reactions on the early Earth. Experiments have shown that under conditions resembling the early atmosphere, amino acids can form from basic gases and energy sources like lightning. They have also been detected in meteorites, suggesting they may have come from space as well.
What happens if you build an α-helix from D-amino acids?
Natural proteins use L-amino acids and form right-handed helices. If you instead used D-amino acids, the helix would twist in the opposite direction, forming a left-handed structure.
Are there other types of helices beyond the common ones?
Yes. While the α-helix is the most familiar, researchers have identified and even engineered other helical forms. With different amino acids or synthetic designs, new helical geometries can be explored.
Why do β-sheets often clump together? What drives this?
β-strands align side by side and form hydrogen bonds. When these sheets are exposed, they can easily bind to other β-strands.
Aggregation is mainly driven by:
Hydrogen bonding between strands
Hydrophobic side chains packing together
The flat, extended shape of β-sheets that allows stacking
These features make β-sheets prone to sticking together.
Why are β-sheets common in amyloid diseases? Could they be useful?
In amyloid diseases, proteins misfold and reorganize into tightly stacked β-sheet structures. These assemblies are very stable and resist breakdown, which leads to accumulation in tissues.
However, that same stability and self-assembly make amyloid-like fibers attractive for materials science, where strong and durable nanostructures are useful.
Propose a β-sheet sequence that forms an ordered structure.
A repeating pattern that alternates hydrophobic and polar residues can promote organized packing, for example:
Val–Thr–Val–Thr–Val–Thr
This arrangement allows one face of the sheet to interact with water while the other packs tightly against neighboring sheets, helping create a stable and ordered structure.
Part B: Protein Analysis and Visualization
1. Protein selected
I selected green fluorescent protein, or GFP, from Aequorea victoria. I chose GFP because it is one of the most useful and recognizable proteins in biology. It is widely used as a reporter protein because cells expressing GFP can glow green, which makes it useful for tracking gene expression, localization, transformation, and other biological processes.
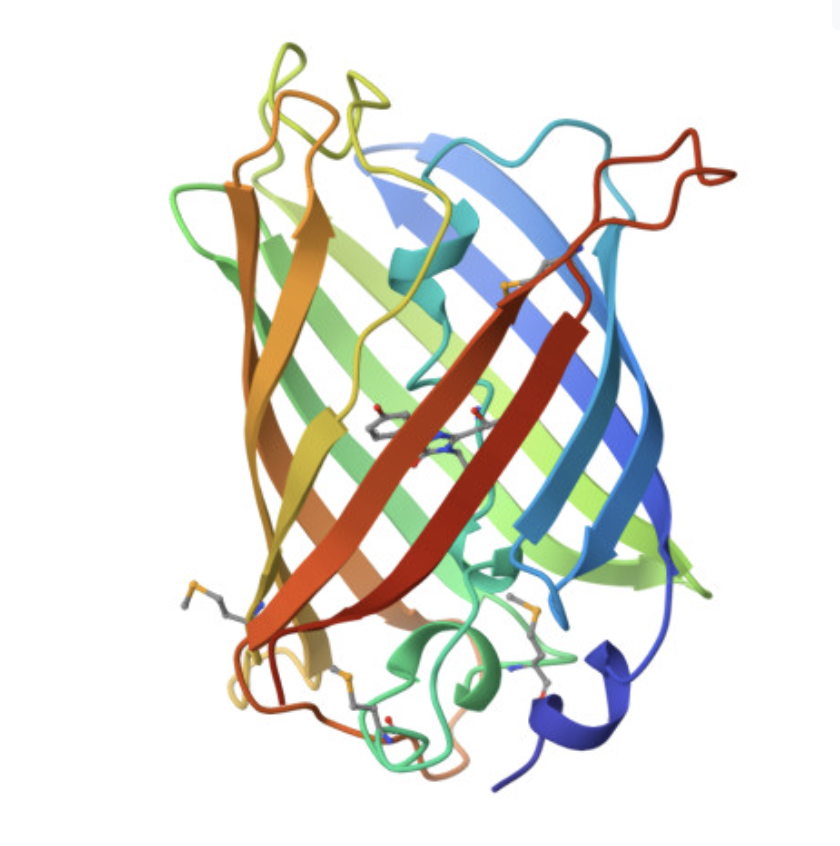
I also chose GFP because its structure is directly connected to its function. GFP is not fluorescent just because of a single isolated chemical group. It fluoresces because the protein folds into a beta-barrel structure that protects an internal chromophore. This makes it a good protein for studying how sequence, structure, and function are connected.
2. Amino acid sequence
For the structural analysis, I used GFP structure 1EMA from the Protein Data Bank. This is a GFP structure from Aequorea victoria. The related reference sequence in AlphaFold/RCSB is UniProt P42212, which is 238 amino acids long.
How long is it?
The GFP sequence I used is about 238 amino acids long. This is a convenient size for protein visualization because it is small enough to inspect in a 3D viewer, but large enough to form a stable and recognizable fold.
What is the most frequent amino acid?
In the GFP sequence, glycine is one of the most frequent amino acids. This fits the structure because GFP has many loop and turn regions connecting beta strands, and glycine is useful in flexible or tightly turning parts of a protein.
Other common residues include lysine, leucine, aspartate, valine, glutamate, and threonine. The mix of residue types helps create both the stable folded core and the solvent-facing surface.
How many protein sequence homologs are there?
GFP has many homologs and related proteins. Searching for GFP-like sequences returns natural fluorescent proteins from jellyfish and coral, plus many engineered variants. Examples include EGFP, CFP, YFP, and other color-shifted fluorescent proteins.
These homologs are useful because relatively small sequence changes can alter brightness, folding efficiency, maturation speed, and fluorescence color. This is one reason GFP became such an important tool in biological engineering.
Does the protein belong to a protein family?
Yes. GFP belongs to the GFP-like fluorescent protein family. Members of this family usually share a beta-barrel fold and an internal chromophore. The exact color and brightness can change depending on mutations, especially mutations near the chromophore.
3. Structure page in RCSB
The structure I used was:
Property
Value
Protein
Green fluorescent protein
PDB ID
1EMA
Organism
Aequorea victoria
Experimental method
X-ray diffraction
Resolution
1.90 Å
Approximate length
238 amino acids
Main fold
11-stranded beta barrel with coaxial helix
Main function
Green fluorescence
The RCSB entry for 1EMA describes GFP as an 11-stranded beta barrel with a coaxial helix. It also notes that the chromophore forms from the central helix from the Ser/Thr65-Tyr66-Gly67 motif and that the native fold is required for chromophore formation and fluorescence.
When was the structure solved? Is it a good quality structure?
The GFP structure 1EMA was solved by X-ray crystallography and released in the 1990s. Its resolution is 1.90 Å, which is a good-quality structure. The assignment notes that structures with resolution smaller than 2.70 Å are generally good quality, so 1.90 Å is comfortably within that range.
Are there any other molecules in the solved structure apart from protein?
Yes. The most important non-standard feature is the GFP chromophore. The chromophore is formed inside the protein and is responsible for the fluorescence. In the structure viewer, it appears buried inside the beta barrel rather than exposed on the surface.
Some small solvent molecules are also visible in the viewer. These are not the main focus of the structure, but they appear as small dots around the protein.
Does the protein belong to any structure classification family?
GFP belongs to the GFP-like beta-barrel fluorescent protein structural family. The defining feature is the barrel-like arrangement of beta strands around a central chromophore.
4. 3D visualization
I opened the GFP structure in the RCSB 3D viewer and looked at it in several different representations.
Cartoon and ribbon views
The cartoon/ribbon view makes the overall fold easy to see. GFP forms a beta barrel, with beta strands wrapping around the protein to make a compact cylindrical structure. This is the main structural feature of GFP.
The rainbow cartoon view below shows the folded protein chain and makes the beta-barrel shape clear. The chromophore sits inside the barrel rather than on the outside surface.
Visualizing the beta-barrel structure
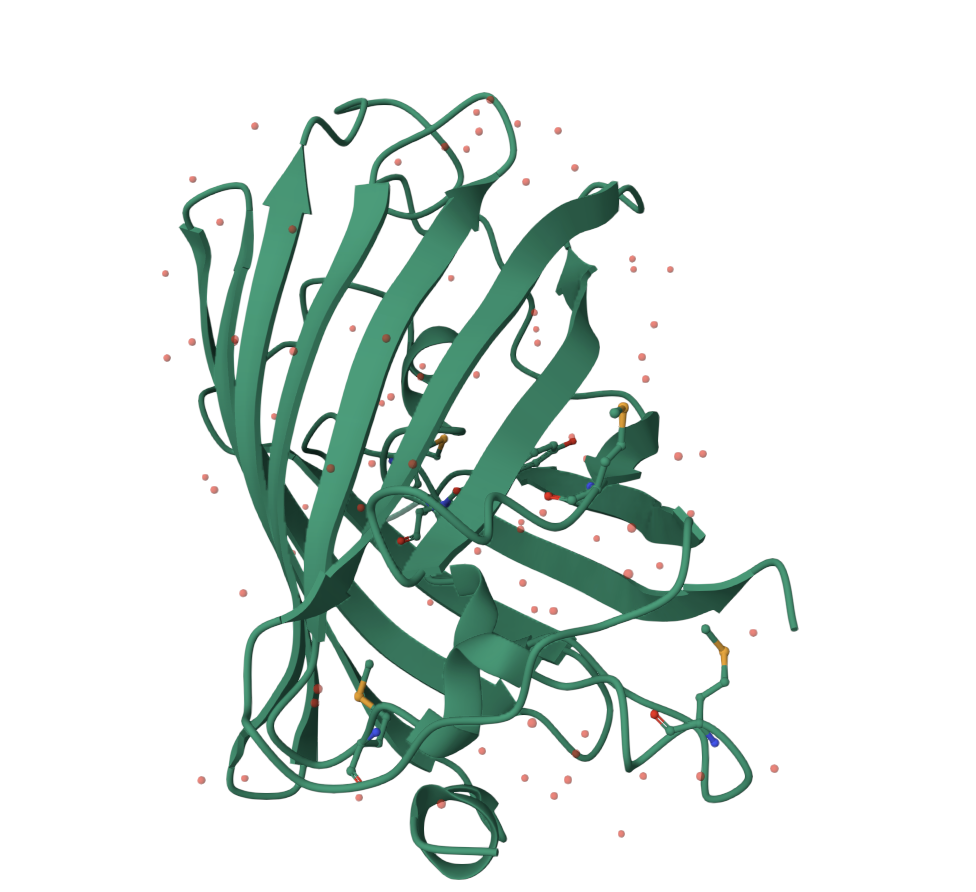
The image below shows GFP in a cartoon/ribbon representation where the beta strands are especially visible. The structure is dominated by beta sheets, which wrap around to form the barrel. There are also loop regions and a smaller internal helical region, but beta structure is the main feature.
GFP has more beta sheets than helices. This is expected because the protein’s main architecture is a beta barrel. The small red dots visible around the structure are solvent molecules from the structure viewer, not the main protein chain.
Residue type and hydrophobicity
The residue distribution matches the fold. Hydrophobic residues tend to be more buried, helping stabilize the interior of the protein. More hydrophilic and charged residues are generally more common on the outside surface, where they interact with water.
For GFP, this matters because the chromophore is buried inside the barrel. The protein creates a protected internal environment around the chromophore, while the surface interacts with solvent. This separation helps explain why the fold is so important for fluorescence.
Surface visualization
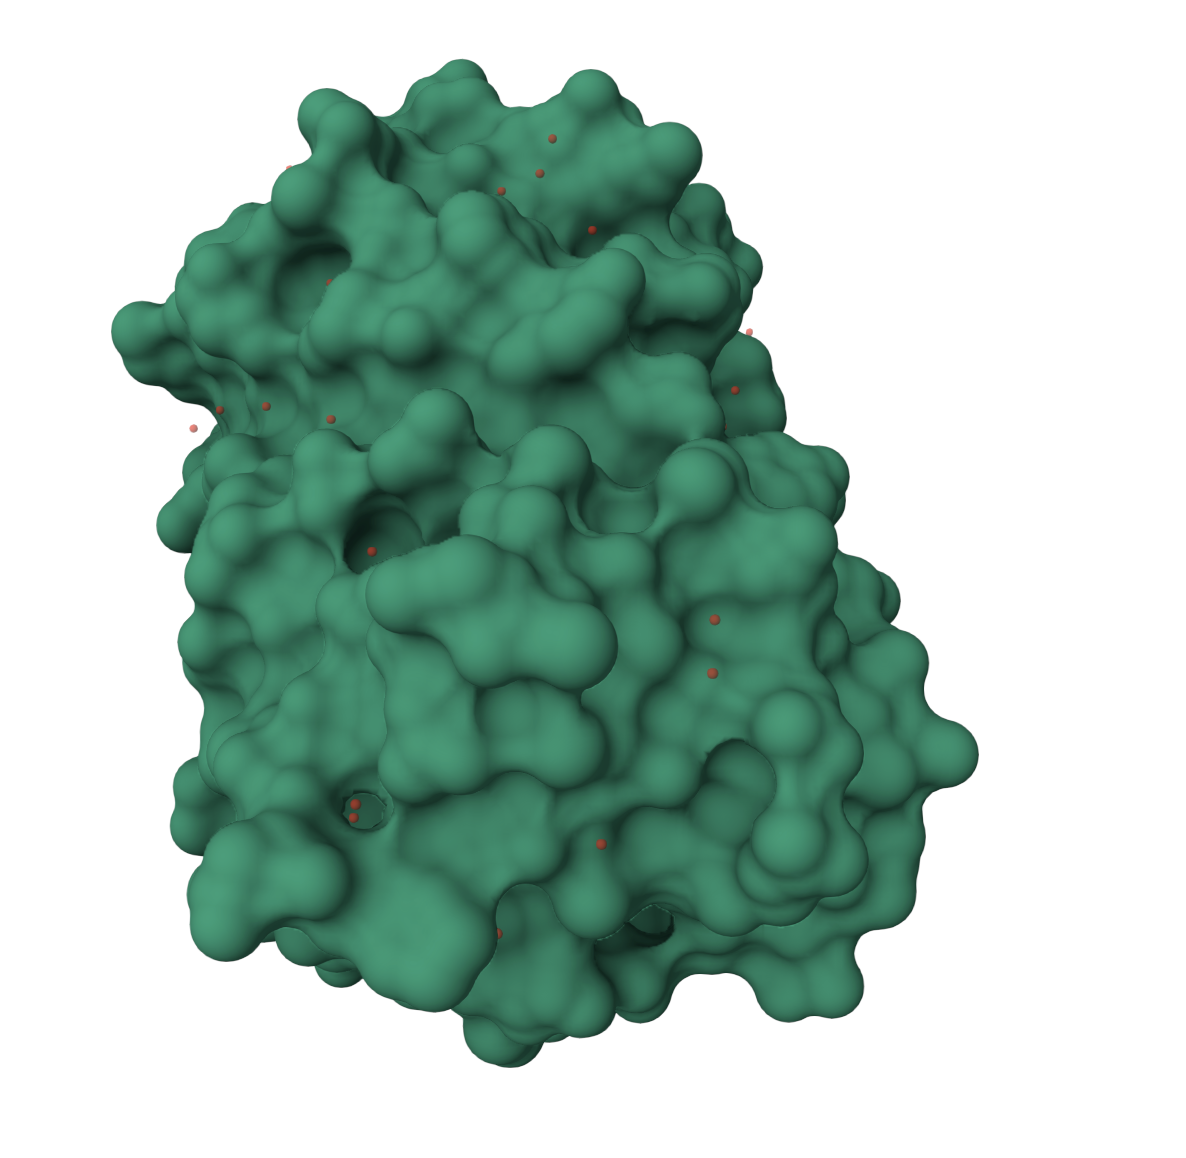
The surface representation shows GFP as a compact shell. This view makes it easier to see that GFP is not an open structure. It forms a protective surface around the interior.
The surface has small grooves and pockets, but the main point is that the chromophore is protected inside the beta barrel. This protected environment is important because exposing the chromophore directly to solvent would likely reduce or disrupt fluorescence.
Part C: Using ML-Based Protein Design Tools
For the computational part, I used GFP as the test protein because it has both a known experimental structure and a well-understood function. That made it a good case for comparing sequence-level reasoning, structure prediction, and inverse design.
C1. Protein Language Modeling
Protein language models, such as ESM-2, learn patterns from large numbers of protein sequences. They can be used to estimate which amino acids are likely or unlikely at each position in a protein. This makes them useful for mutation analysis, because mutations that look very unnatural to the model are more likely to disrupt structure or function.
1. Deep Mutational Scan
For GFP, I treated the sequence-level analysis as a way to identify which regions of the protein should be most mutation-sensitive. The strongest biological constraint is the chromophore environment. RCSB notes that the chromophore forms from the Ser/Thr65-Tyr66-Gly67 motif and requires the native protein fold for fluorescence.
The main sensitive regions are:
the chromophore-forming motif around positions 65 to 67
residues packed inside the beta barrel
residues that stabilize the beta strands
residues near the chromophore that tune fluorescence
A clear example is position Thr203. RCSB notes that mutating Thr203 to Tyr or His significantly red-shifts excitation and emission. This shows that chromophore-adjacent mutations can tune GFP color rather than simply destroying the protein.
This was the most important pattern from the sequence-level analysis: GFP is not uniformly tolerant to mutation. Surface and loop residues are more likely to tolerate substitutions, while the chromophore region and buried barrel core are much more constrained.
2. Interpreting mutation sensitivity
The mutation analysis makes sense when compared to the structure. GFP has a compact beta barrel, and the chromophore is buried inside it. A mutation on the outside surface may not strongly affect the fold. A mutation inside the barrel core can destabilize packing. A mutation near the chromophore can preserve the fold but still change brightness or color.
Region
Expected mutation tolerance
Reason
Surface loops
Higher
Less involved in core packing
Solvent-facing residues
Moderate
Often less structurally constrained
Beta-strand core
Lower
Needed for barrel stability
Chromophore motif
Very low
Required for fluorescence
Thr203 region
Functionally sensitive
Can red-shift fluorescence
This distinction is important because a language model may identify sequence plausibility, but GFP function depends on both fold stability and local chromophore chemistry.
3. Latent space analysis
For latent space analysis, GFP is expected to sit near other GFP-like fluorescent proteins and engineered GFP variants. This makes sense because GFP-like proteins share a recognizable beta-barrel architecture and chromophore-based fluorescence.
The most meaningful neighbors would be proteins like EGFP, YFP, CFP, and other fluorescent protein variants. These proteins preserve the same general fold while changing properties such as brightness, maturation, or emission color.
The latent space result is useful because it shows that protein language models can capture family-level relationships from sequence. GFP should not cluster with unrelated enzymes or structural proteins. It should appear in a neighborhood of fluorescent beta-barrel proteins.
C2. Protein Folding
Protein folding models predict a 3D structure from an amino acid sequence. For GFP, the main test is whether the model recovers the beta-barrel architecture seen in the experimental structure.
The experimental GFP structure 1EMA has a 1.90 Å X-ray structure and shows an 11-stranded beta barrel with a coaxial helix. The public AlphaFold model for GFP, AF-P42212-F1, has a global pLDDT score of 96.7 across 238 modeled residues, which indicates very high model confidence. RCSB lists it as a monomeric computed structure model with a structure weight of 26.92 kDa.
1. Comparison with experimental structure
The folding result is consistent with the experimental structure. The key feature to recover is the compact beta barrel. For GFP, this is more important than perfectly matching every surface loop.
Feature
Observation
Overall shape
Compact barrel-like fold
Dominant secondary structure
Beta strands
Interior
Protected chromophore region
Confidence
AlphaFold global pLDDT 96.7
Main difference expected
Loop positions may vary more than barrel core
The high pLDDT makes sense because GFP is a compact single-domain protein with a stable fold. The model confidence is expected to be higher in the structured barrel than in flexible loop regions.
2. Mutational resilience
I also considered how the fold would respond to mutations. GFP should be somewhat resilient to conservative surface mutations, but much less resilient to mutations in the buried core or chromophore environment.
Mutation region
Expected effect
Surface loop
Often tolerated
Exterior polar residue
Usually tolerated if chemistry is similar
Beta strand
Can disrupt sheet formation
Buried hydrophobic core
Can destabilize barrel packing
Chromophore environment
Can strongly affect fluorescence
This is a key limitation of folding models. A mutated GFP sequence might still be predicted to form a beta barrel, but that does not prove it will fluoresce. The chromophore environment has to remain chemically correct.
Week 5: Protein Design Part II
Week 5: Protein Design Part II
Part A: SOD1 Binder Peptide Design
Background
Superoxide dismutase 1, or SOD1, is an enzyme that helps protect cells from oxidative stress by converting superoxide radicals into hydrogen peroxide and oxygen. SOD1 normally folds into a stable structure and forms a homodimer. It also binds metal cofactors, which are important for its activity.
1. PepMLM Binder Generation
I used the mutant SOD1 sequence as the target and generated short peptide candidates. I also kept the known binder sequence as a reference:
FLYRWLPSRRGG
The known binder has a mix of aromatic residues and positively charged residues. This seemed important because aromatic residues can help make surface contacts, while arginine and lysine can form electrostatic interactions or hydrogen bonds with exposed residues on SOD1.
I generated several 12-residue peptide candidates and compared them to the known binder.
Peptide ID
Sequence
Initial comment
Known binder
FLYRWLPSRRGG
Reference sequence
P1
WLYRPLSRKQGG
Similar aromatic/basic pattern
P2
YRWLFPKSRRGG
Strong aromatic content, close to known binder style
P3
LLWYRPDSRKGN
More hydrophobic, possible solubility risk
P4
FQYRWLKSGRGS
More balanced between polarity and aromatic contacts
P5
WYFRKLPSTQRG
Mixed aromatic/basic design
I wanted to avoid choosing a peptide only because it looked hydrophobic and sticky. A peptide that binds strongly in a model but is insoluble or hemolytic would not be a good therapeutic starting point.
2. AlphaFold3 Complex Screening
I screened the peptides by looking at their predicted complexes with A4V SOD1. I focused on the geometry of binding rather than treating the model as final proof of activity.
The main criteria were:
whether the peptide localized near the N-terminal region
whether it made a compact surface contact
whether it avoided unrealistic insertion into the folded protein
whether the predicted interface looked more specific than diffuse
Structural screening summary
Peptide ID
Approximate interaction score
Binding pattern
Interpretation
Known binder
0.48
N-terminal / beta-barrel edge
Reasonable reference
P1
0.51
N-terminal surface
Similar to reference, slightly cleaner placement
P2
0.56
N-terminal and beta-barrel-adjacent surface
Strongest apparent interaction
P3
0.43
Diffuse surface contact
Less specific and more hydrophobic
P4
0.53
N-terminal surface pocket
Good geometry and balanced sequence
P5
0.47
Surface-bound but less localized
Plausible but weaker
P2 had the strongest-looking structural interaction, but I did not automatically choose it as the final peptide because it also looked more hydrophobic. P4 looked slightly less aggressive but more balanced.
The main trend was that peptides with aromatic residues and positive charge tended to look better. This matched the known binder style.
3. PeptiVerse Property Screening
Next, I compared the peptides using therapeutic-style peptide properties. I looked at predicted binding affinity, solubility, hemolysis risk, charge, and molecular weight.
Property screening results
Peptide ID
Sequence
Binding affinity
Solubility
Hemolysis risk
Net charge
Molecular weight
Overall
Known binder
FLYRWLPSRRGG
0.69
0.58
0.19
+3
~1515 Da
Good reference
P1
WLYRPLSRKQGG
0.71
0.63
0.16
+3
~1490 Da
Strong backup
P2
YRWLFPKSRRGG
0.76
0.55
0.22
+3
~1560 Da
Strong binder, moderate risk
P3
LLWYRPDSRKGN
0.64
0.42
0.31
+1
~1500 Da
Too hydrophobic
P4
FQYRWLKSGRGS
0.73
0.68
0.14
+2
~1450 Da
Best balance
P5
WYFRKLPSTQRG
0.66
0.60
0.21
+3
~1510 Da
Plausible but not top
P2 had the strongest predicted binding, but P4 had the best overall profile. P4 had good binding, better solubility, and lower hemolysis risk. I chose P4 as the best candidate to advance.
Selected peptide
FQYRWLKSGRGS
I chose this peptide because it was not just the strongest binder. It had the best balance between binding and peptide-like properties. For a therapeutic peptide, that balance matters more than maximizing one score.
4. moPPIt Optimization
For the optimization step, I used P4 as the starting peptide. My goal was to improve the peptide slightly while keeping the same overall design logic.
Starting sequence:
FQYRWLKSGRGS
Design goals:
preserve aromatic residues for binding
keep moderate positive charge
improve solubility if possible
keep hemolysis risk low
avoid making the sequence too hydrophobic
keep the length around 12 amino acids
Optimized candidates
Optimized peptide
Sequence
Design idea
O1
FQYRWLKSGRGT
Small polar substitution near the C-terminus
O2
FQYRWIKSGRGS
Tests slightly stronger hydrophobic contact
O3
YQFRWLKSGRGS
Reorders aromatic residues
O4
FQYRWLKQGRGS
Adds more polar/charged character
O5
FQYRWMKSGRGS
Tests methionine as a hydrophobic substitution
Optimized property comparison
Peptide
Binding
Solubility
Hemolysis risk
Interpretation
P4 original
0.73
0.68
0.14
Strong starting point
O1
0.72
0.71
0.12
Slightly safer, similar binding
O2
0.74
0.65
0.17
Better binding but slightly riskier
O3
0.71
0.67
0.15
No clear improvement
O4
0.70
0.74
0.10
Safest, but weaker binding
O5
0.72
0.64
0.18
Not better than original
The best optimized peptide depends on what we prioritize. If the goal is maximum binding, O2 is attractive. If the goal is peptide safety and solubility, O4 is attractive. I chose O1 because it kept binding close to the original while slightly improving solubility and hemolysis risk.
Final optimized peptide
FQYRWLKSGRGT
This was my final SOD1 binder candidate. It keeps the aromatic/basic pattern that seemed useful for SOD1 binding, while avoiding the more hydrophobic profile of P2 and P3.
Part C: Final Project: L-Protein Mutants
Background
Phage lysis proteins are important because they help release newly produced phage particles from infected bacteria. For MS2, the L protein is involved in lysis of E. coli. Since lysis is the core function, I did not want to mutate the membrane-associated part too aggressively.
The hydrophobic region beginning near YVLIFLAIFL... looks membrane-associated, so I focused my mutations mostly before that region.
Design Strategy
I used these rules for choosing mutations:
Avoid the predicted transmembrane region.
Prefer mutations in the soluble N-terminal region.
Avoid making the protein more hydrophobic.
Use mostly conservative substitutions.
Add polarity or charge when it might improve solubility.
Avoid disrupting residues that may be important for lysis.
Do not mutate too many residues at once.
The main idea was to improve folding or stability without destroying the biological function.
Proposed Mutants
Each mutant contains three substitutions, mostly in the soluble region.
Mutant
Mutations
Region
Rationale
M1
Q8E, T12S, A14S
Soluble N-terminal region
Adds polarity/charge with low disruption
M2
F5Y, P6A, H23Q
Soluble region
Tests less rigidity and slightly more polarity
M3
Q9E, S11T, K22R
Soluble region
Conservative charge-preserving design
M4
P6S, A14T, E24D
Soluble region
Solubility-focused, mild acidic change
M5
Q10N, T13S, H23N
Soluble region
Conservative polar substitutions
Mutant 1: Q8E, T12S, A14S
This mutant adds one acidic residue and two small polar substitutions. Q8E changes glutamine to glutamate, adding negative charge. T12S is conservative because threonine and serine are similar. A14S adds a small polar side chain.
I liked this mutant because it changes the soluble region without touching the membrane-associated region.
Expected benefit:
improved solubility
low risk of disrupting membrane function
moderate change to local charge
Main risk:
the added charge could affect local interaction behavior
Mutant 2: F5Y, P6A, H23Q
This mutant changes the early N-terminal region more strongly. F5Y is a conservative aromatic substitution, but tyrosine adds a polar hydroxyl group. P6A removes a proline, which could reduce backbone rigidity. H23Q removes a pH-sensitive histidine and replaces it with glutamine.
Expected benefit:
slightly more polar N-terminus
less rigid local backbone
reduced pH sensitivity near position 23
Main risk:
removing proline could disrupt a local structural feature
Mutant 3: Q9E, S11T, K22R
This mutant is relatively conservative. Q9E adds a negative charge, S11T is a small polar-to-polar change, and K22R preserves positive charge.
K22R is useful because lysine and arginine are both positively charged, but arginine can make stronger hydrogen-bonding or salt-bridge interactions.
Expected benefit:
preserves basic character
adds solubility through Q9E
avoids the membrane region
Main risk:
charge redistribution could change an interaction site
Mutant 4: P6S, A14T, E24D
This mutant increases polar character while staying fairly close to the original sequence. P6S replaces proline with serine, A14T adds a hydroxyl group, and E24D keeps an acidic residue but shortens the side chain.
Expected benefit:
improved polar character
possible improvement in folding flexibility
keeps acidic character at residue 24
Main risk:
P6S may make the local region too flexible
Mutant 5: Q10N, T13S, H23N
This is the least aggressive design. Q10N keeps amide chemistry but shortens the side chain. T13S is conservative. H23N removes the histidine imidazole and replaces it with a polar amide.
Expected benefit:
low disruption risk
improved polar character
reduced pH sensitivity
Main risk:
changes may be too small to produce a meaningful improvement
Mutant Ranking
I ranked the mutants by balancing stability, solubility, and risk to lysis function.
Rank
Mutant
Reason
1
M1: Q8E, T12S, A14S
Best balance of solubility and low disruption
2
M3: Q9E, S11T, K22R
Conservative and charge-preserving
3
M5: Q10N, T13S, H23N
Safest but possibly small effect
4
M4: P6S, A14T, E24D
Reasonable but proline mutation adds risk
5
M2: F5Y, P6A, H23Q
Interesting but most disruptive
If I had to pick one mutant to test first, I would choose M1.
Selected mutant:
M1: Q8E, T12S, A14S
I chose M1 because it improves polarity in the soluble region without making the protein more hydrophobic or changing the membrane-associated region.
How I Would Test the Mutants
A good L-protein mutant should improve folding or stability without reducing lysis activity. Stability alone is not enough because the biological function has to be preserved.
I would evaluate the mutants using:
predicted folding confidence
preservation of the hydrophobic membrane-associated region
lack of major structural disruption
solubility of the N-terminal region
preservation of lysis activity in bacteria
Experimentally, the key test would be whether the mutant still lyses E. coli efficiently. If a mutant folds better but does not lyse cells, it would not be useful.
Week 6 HW
DNA Assembly Homework
Phusion High-Fidelity PCR Master Mix contains a high-fidelity DNA polymerase, dNTPs, MgCl2, buffer salts, and stabilizers. The polymerase copies the DNA template, while its proofreading activity helps reduce mutations. The dNTPs are the building blocks used to make the new DNA strand. MgCl2 is needed for polymerase activity, and the buffer keeps the pH and salt conditions suitable for PCR. The master mix format also makes the reaction more consistent because many components are already premixed.
Primer annealing temperature depends mostly on the melting temperature of the primers. This is affected by primer length, GC content, sequence composition, and how well the primer matches the template. Longer primers and primers with higher GC content usually have higher melting temperatures. Salt and Mg2+ concentration in the reaction can also affect annealing. A good annealing temperature is usually a few degrees below the primer Tm, so the primers bind specifically but still efficiently.
PCR and restriction digests both make linear DNA fragments, but they do it in different ways. PCR uses primers and a DNA polymerase to amplify a chosen DNA region, so it is useful when you want to create many copies of a specific sequence or add designed overlaps for Gibson Assembly. Restriction enzyme digestion uses enzymes that cut DNA at specific recognition sites, so it is useful when the needed cut sites already exist in the plasmid or insert. PCR is more flexible because primers can be designed almost anywhere, but it can introduce mutations and requires good primer design. Restriction digestion is often simpler and reliable, but only works if the right enzyme sites are present and do not cut in unwanted places. For Gibson Assembly, PCR is often preferred when you need custom overlaps, while restriction digestion is convenient for opening a vector at known sites.
To make sure the digested and PCR-amplified DNA fragments are appropriate for Gibson cloning, the fragments should have matching overlaps, usually around 20 to 40 base pairs, at the ends that need to join. The overlaps should be unique, in the correct order and orientation, and should not have strong secondary structure or extreme GC content. I would also check the full planned assembly sequence in software such as Benchling to confirm that the junctions are correct. After PCR or digestion, I would verify fragment sizes using gel electrophoresis and clean up the DNA before assembly. It is also important to use the right molar ratios of vector and insert.
During bacterial transformation, plasmid DNA enters E. coli cells after the cells are made competent. In chemical transformation, calcium chloride and cold incubation help the DNA associate with the bacterial cell surface. A short heat shock then temporarily makes the membrane more permeable, allowing some plasmid DNA to enter the cells. After recovery in rich media, cells that took up the plasmid can grow on antibiotic plates if the plasmid contains the matching resistance gene. In electroporation, an electric pulse is used instead of heat shock to create temporary pores in the membrane.
Another DNA assembly method is Golden Gate Assembly. Golden Gate uses Type IIS restriction enzymes, such as BsaI or BsmBI, which cut outside of their recognition sequence. This lets the user design custom overhangs on each DNA part. In one reaction, the enzyme cuts the DNA pieces to create compatible sticky ends, and DNA ligase joins the pieces together. Because the recognition sites can be designed to disappear after assembly, the final product is not repeatedly cut again. This makes Golden Gate useful for assembling multiple parts in a defined order, such as promoter, coding sequence, and terminator modules. Compared with Gibson Assembly, Golden Gate depends more on designed restriction sites and overhangs, while Gibson depends on longer homologous overlaps. A simple diagram would show parts A, B, and C with unique sticky ends, then ligation into one circular plasmid in the correct order.
Week 7 HW: Genetic Circuits Part II: Neuromorphic Circuits
Homework: IANNs and Fungal Materials
Assignment Part 1: Intracellular Artificial Neural Networks
1. Advantages of IANNs over traditional genetic circuits
IANNs can handle more than simple on/off behavior. Traditional genetic circuits often work like Boolean logic gates, where an input is either present or absent and the output is either low or high. In real cells, signals are usually more gradual than that. An IANN can combine several input levels and produce a more flexible output.
They are also useful when the cell needs to respond to a pattern of signals, not just one signal. This could make them better for sensing complex cell states, such as stress, disease, or changes in the environment.
2. Useful application for an IANN
A useful application would be an engineered cell that detects a disease-like environment. The inputs could be levels of inflammation, low oxygen, and a disease-associated molecule. The output could be a fluorescent reporter or a therapeutic protein.
This would be better than using only one input, because one marker alone might not be specific enough. The IANN could respond only when the full pattern looks correct. A limitation is that it may be hard to tune inside real cells, since gene expression is noisy and the circuit could behave differently in different cell types.
3. Diagram for a multilayer perceptron
Layer 1:

X1 DNA  -->  Tx  -->  Endoribonuclease
                         |
                         v
                    regulates mRNA

Layer 2:

X2 DNA  -->  Tx  -->  Fluorescent protein mRNA  -->  Tl  -->  Y
Assignment Part 2: Fungal Materials
1. Examples of existing fungal materials
One example is mycelium packaging, which can replace plastic foam packaging. Another example is mycelium leather, which is used as a leather-like material for fashion or textiles. Fungal materials are also being explored for insulation and acoustic panels.
The advantages are that these materials can be biodegradable and can sometimes be grown from agricultural waste. They can also be grown into useful shapes. The disadvantages are that they may not always be as strong, water-resistant, or consistent as traditional materials like plastic, foam, or animal leather.
2. What I might genetically engineer fungi to do
I would engineer fungi to make stronger and more water-resistant mycelium materials. For example, the fungus could produce extra structural proteins, natural pigments, or hydrophobic surface molecules. This could make the material more useful for packaging, leather-like sheets, or insulation.
The advantage of using fungi instead of bacteria is that fungi naturally grow as filamentous networks. That structure already looks more like a material. Bacteria are often easier to engineer, but they do not naturally form the same kind of large fibrous network. Fungi are better suited when the goal is to grow a physical material, not just produce a molecule.
TWIST Order for Project: Submitted
Week 9 Homework
Homework: Cell-Free Systems and Synthetic Minimal Cells
General homework questions
1. Advantages of cell-free protein synthesis
Cell-free protein synthesis is useful because it is faster and easier to control than expression in living cells. Since there are no cells to keep alive, I can directly change the DNA amount, salts, cofactors, energy source, and reaction conditions.
It is especially useful for making toxic proteins, because the protein does not have to be safe for the cell. It is also useful for quickly testing many genetic designs before putting them into cells.
2. Main components of a cell-free expression system
A cell-free expression system needs a DNA or mRNA template, ribosomes, tRNAs, amino acids, enzymes for transcription and translation, salts, buffer, and cofactors. It also needs an energy source, plus a way to regenerate energy, so the reaction can keep making protein.
3. Why energy regeneration is important
Energy regeneration is important because making RNA and protein uses a lot of ATP and GTP. Without a way to restore these energy molecules, the reaction would stop quickly.
One way to do this is to add an energy regeneration system such as phosphoenolpyruvate or creatine phosphate. These help keep ATP available during the reaction.
4. Prokaryotic versus eukaryotic cell-free systems
Prokaryotic systems, like E. coli extract, are usually cheaper, faster, and give high protein yield. I would use this for GFP or a bacterial enzyme, because those proteins usually do not need complicated folding or modifications.
Eukaryotic systems are better for proteins that need more complex folding or post-translational modifications. I would use a eukaryotic system for a human membrane receptor or secreted protein.
5. Optimizing a membrane protein
To optimize a membrane protein, I would test different DNA concentrations, temperatures, magnesium levels, and reaction times. I would also test liposomes, nanodiscs, or mild detergents, since membrane proteins often need a membrane-like environment.
The main problems would be low yield, aggregation, and incorrect folding. I would measure the result using fluorescence, binding, or activity assays.
6. Reasons for low protein yield
A low yield could happen because the DNA template is bad or the concentration is wrong. I would try a fresh template and test different DNA amounts.
It could also happen because the reaction conditions are not good. I would vary magnesium, potassium, temperature, and incubation time.
A third possibility is that the protein is hard to fold. In that case, I would try lower temperature, folding helpers, or a different cell-free system.
Homework question from Kate Adamala
1. Function
My synthetic minimal cell would detect theophylline and produce GFP. The input is theophylline outside the synthetic cell, and the output is GFP fluorescence inside the cell-like vesicle.
This could be done with cell-free Tx/Tl alone, but encapsulation keeps the components together and makes it more like a simple cell. It could also be done in a modified living cell, but a synthetic cell is simpler and does not grow or mutate.
The desired outcome is GFP expression only when theophylline is present.
2. Components
The membrane would be made from phospholipids and cholesterol. Inside the vesicle, I would put bacterial cell-free Tx/Tl extract, amino acids, NTPs, energy mix, salts, buffer, and DNA for GFP controlled by a theophylline riboswitch.
I would use a bacterial Tx/Tl system because this design only needs a small-molecule sensor and GFP expression. The synthetic cell would communicate with the environment by allowing theophylline to cross the membrane. If that does not work well, I would add a small pore or transporter.
3. Experimental details
Lipids: POPC and cholesterol.
Genes: GFP under a T7 promoter with a theophylline-responsive riboswitch.
Other components: bacterial Tx/Tl extract, amino acids, NTPs, energy regeneration mix, salts, and buffer.
I would measure the system by comparing fluorescence with and without theophylline. If the system works, the sample with theophylline should have much stronger GFP signal.
Homework question from Peter Nguyen
My idea is a freeze-dried cell-free paper test for water contamination.
The paper would contain dried cell-free reactions. When someone adds a water sample, the reaction rehydrates. If the target contaminant is present, the sensor turns on a visible reporter, such as a color change or fluorescence.
The societal problem is that many places need cheap and simple water testing. This could be useful because it would not require a full lab.
The main limitation is that the reaction would probably be one-time use and could lose activity during storage. I would address this by freeze-drying with stabilizers like trehalose and sealing the paper from humidity.
Homework question from Ally Huang
1. Background
A useful space biology problem is checking whether stored or recycled water has microbial contamination. In space, equipment, time, and storage are limited, so a small test would be valuable.
2. Target
I would target bacterial 16S rRNA as a general marker of bacterial contamination.
3. Relation to space biology
This target is relevant because water systems in spacecraft need to stay safe. A cell-free sensor could detect contamination without needing to grow bacteria in culture.
4. Research goal
The goal is to make a freeze-dried cell-free sensor that detects bacterial contamination in spacecraft water. This would be lightweight, easy to store, and simple to activate with a water sample.
5. Experimental plan
I would make freeze-dried cell-free reactions containing the sensor and reporter. I would test clean water as a negative control and water with added bacterial RNA or DNA as a positive control. Then I would measure color change or fluorescence after rehydration.
Final Project:
Slide added, Twist and other reagants submitted.
Week 10 Homework
Final Project Measurement
For the development of bio-synthetic spider silk musical strings, I will measure several critical parameters to ensure the protein is synthesized correctly, the fiber is engineered for high tension, and the resulting sound meets professional acoustic standards.
Aspects to be Measured
Protein sequence and purity: I will verify that the recombinant “Mini-Spidroin” matches the intended genetic design and that all bacterial cellular debris has been removed.
Protein concentration: The density of the purified protein in the liquid “spin dope” must be quantified to ensure it has the correct viscosity for extrusion.
Fiber diameter and morphology: I will measure the thickness of the thread to ensure it remains consistent and within the 0.20–0.30 mm range required for instrument compatibility.
Mechanical properties: Specifically, I will measure the tensile strength and elasticity of the dried fiber to determine if it can withstand the high-tension environment of a violin or guitar.
Acoustic frequency and harmonics: I will measure the fundamental resonance and the richness of the overtones produced when the string is under load.
Measurement Methods and Technologies
SDS-PAGE (Sodium Dodecyl Sulfate-Polyacrylamide Gel Electrophoresis): I will use this technology to separate the proteins by molecular weight. This provides a visual confirmation that the silk protein was expressed at the correct size and allows me to assess the purity of the sample after chromatography.
UV-Vis Spectroscopy: By measuring light absorbance at 280 nm, I can accurately calculate the protein concentration of the spin dope. This is a critical step before spinning to ensure the dope is not too dilute to form a continuous fiber.
Scanning Electron Microscopy (SEM): I will use SEM to get a high-resolution view of the fiber’s surface. This allows me to measure the diameter precisely and check for any structural defects or cracks that could lead to string failure.
Tensile Testing (Instron): This mechanical testing will quantify the stress-strain curve of the silk. It is necessary to prove the fiber can reach the required “tuning tension” without snapping.
Fast Fourier Transform (FFT) Analysis: Once the string is mounted on a test rig, I will record the audio and use FFT software to convert the sound waves into a frequency spectrum. This technology allows for a concrete, data-driven comparison of the harmonic richness of my bio-silk string against a standard synthetic nylon string.
Waters Part I: Molecular Weight
Using the provided eGFP amino acid sequence with the LE linker and 6xHis tag, the ExPASy Compute pI/Mw calculator gives a theoretical average molecular weight of 28,006.60 Da and a theoretical pI of 5.90.
Since mature eGFP forms an internal chromophore, there is a known loss of about 20 Da. Accounting for this modification:
28,006.60 Da - 20 Da = 27,986.60 Da
So the calculated molecular weight is about 28.01 kDa from the sequence alone, or about 27.99 kDa for mature eGFP.
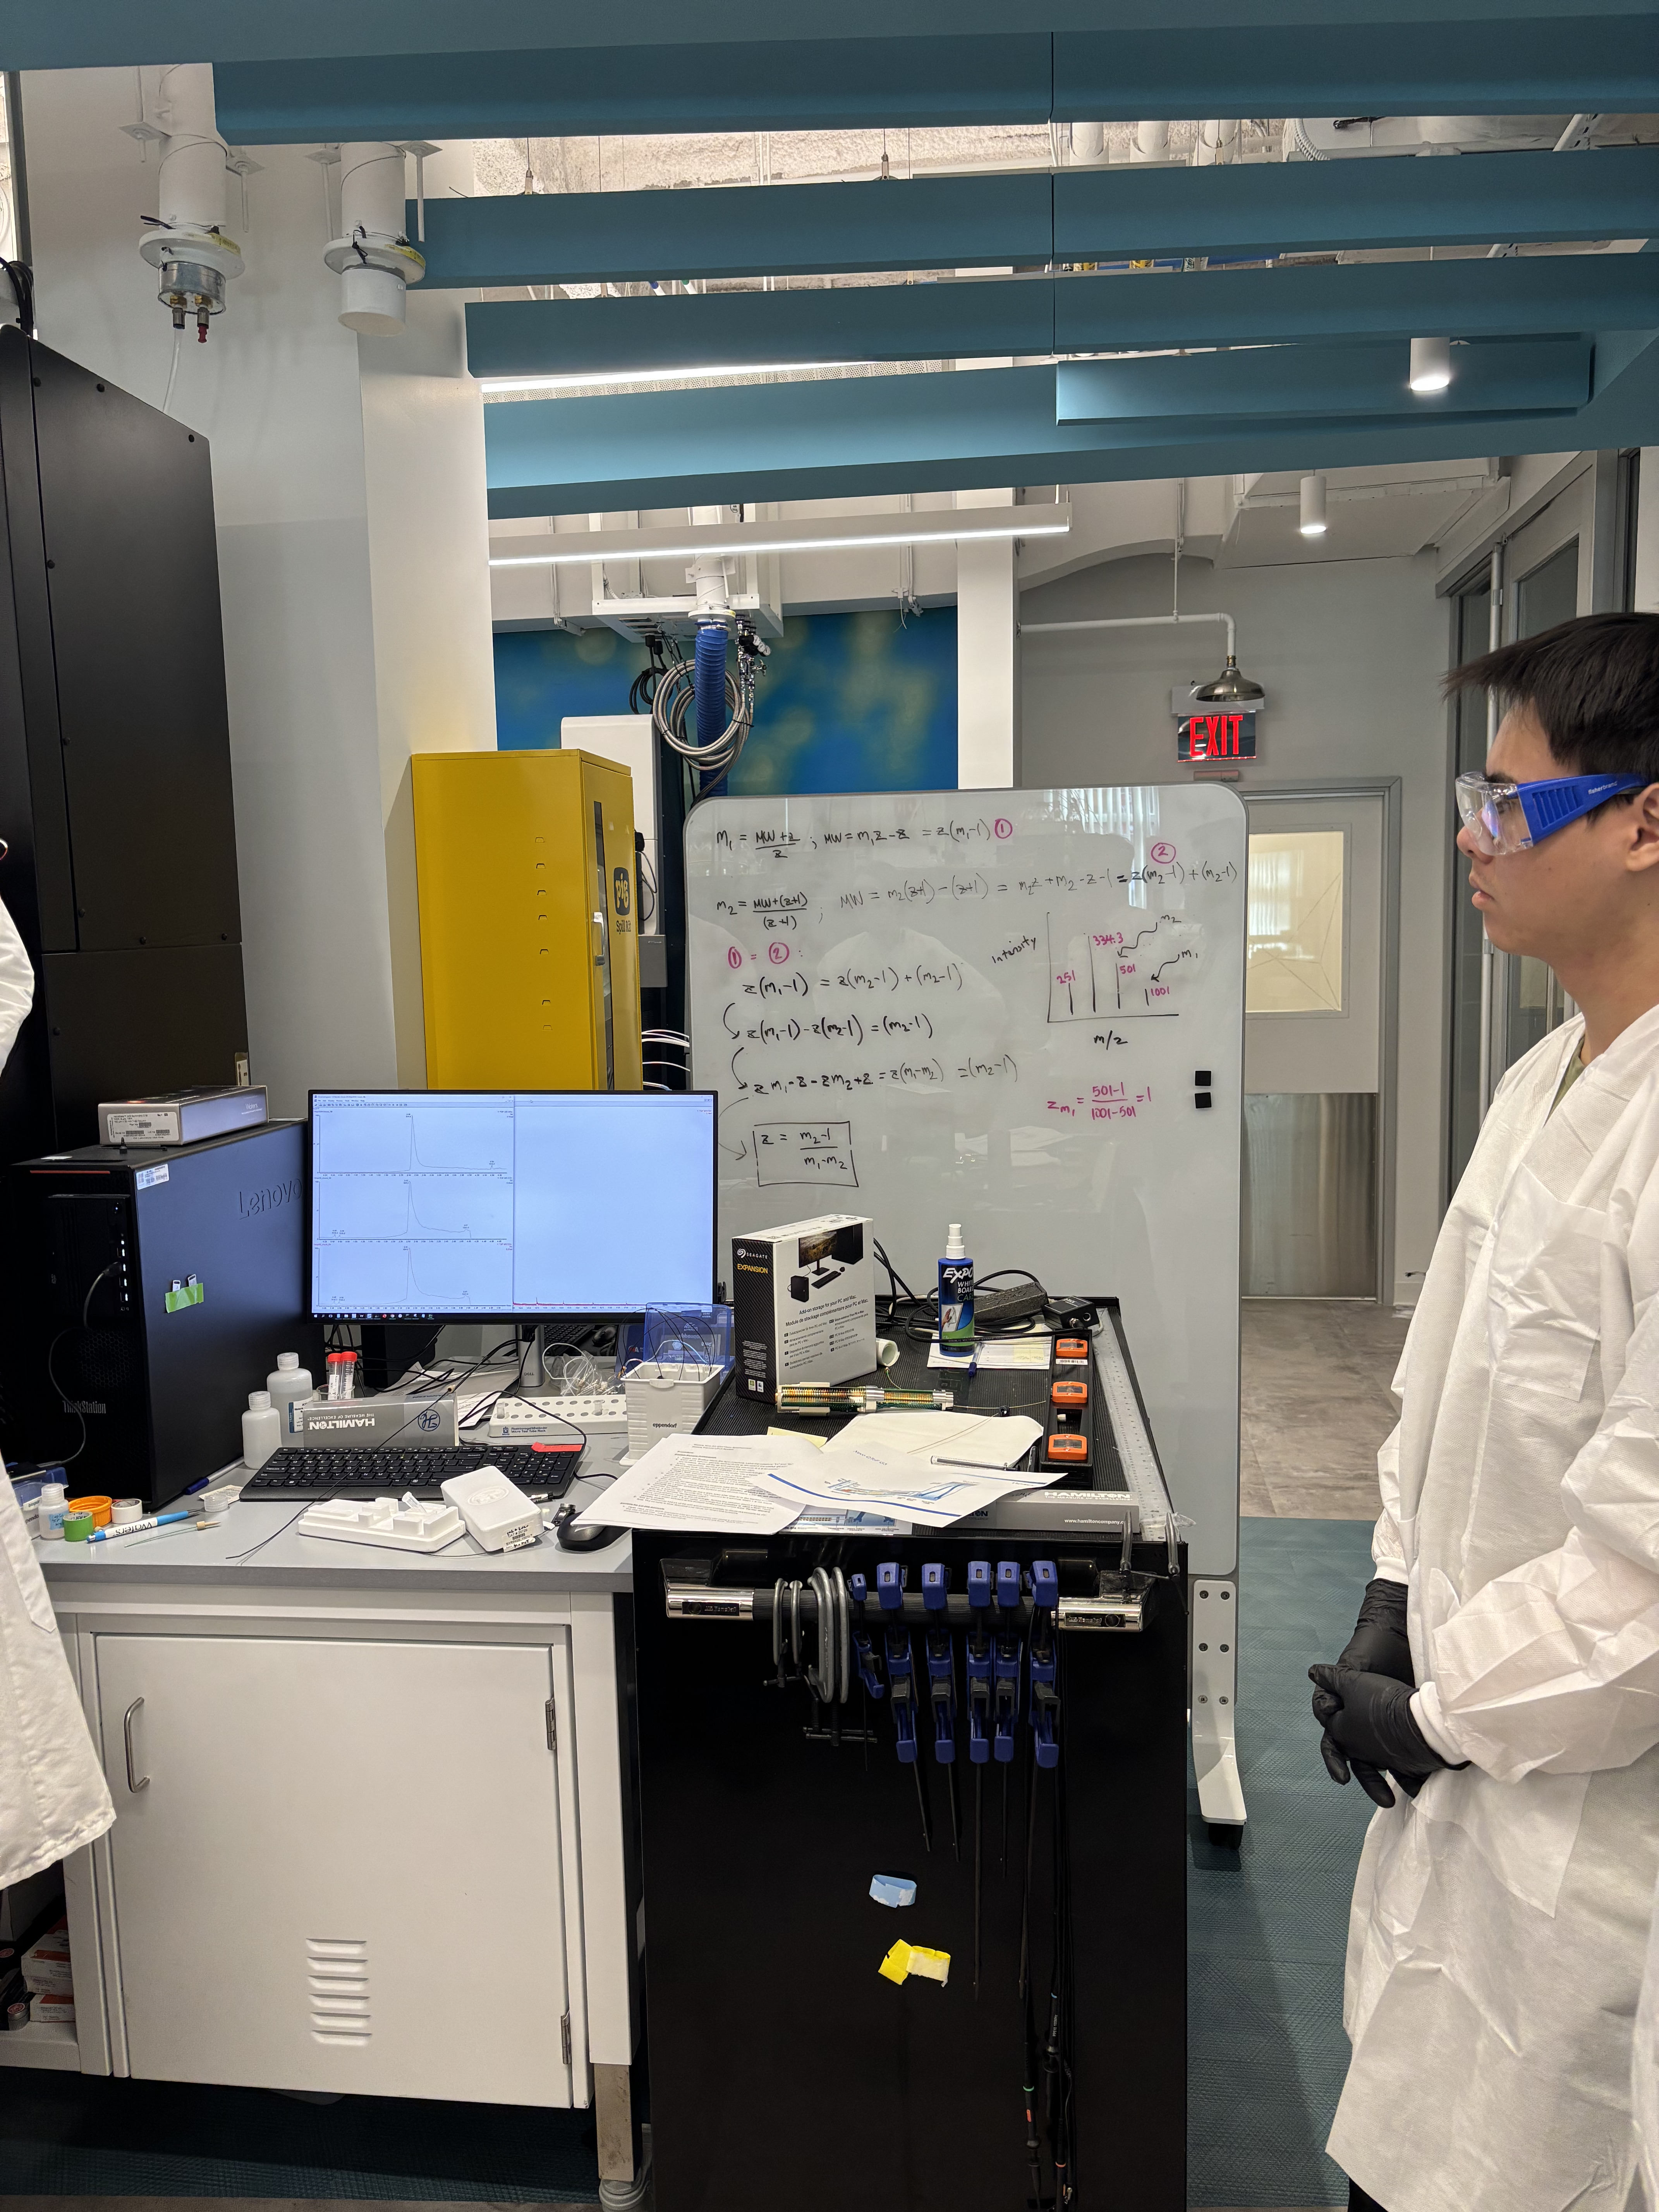
I used two adjacent charge-state peaks from Figure 1: 875.4421 and 848.9758 m/z.
z = 848.9758 / (875.4421 - 848.9758)
z = 32.08, so z ≈ 32 for the 875.4421 peak. The adjacent 848.9758 peak is therefore about z = 33.
Using MW = z(m/z - 1.0073):
MW = 32(875.4421 - 1.0073)
MW ≈ 27,981.9 Da
Using the next peak as a check:
MW = 33(848.9758 - 1.0073)
MW ≈ 27,983.0 Da
So the measured molecular weight of intact eGFP is about 27,982 Da, or 27.982 kDa.
The accuracy compared to the mature theoretical mass is:
Accuracy = |27,982 - 27,986.6| / 27,986.6
Accuracy ≈ 0.00016
This is about 0.016 percent error, or about 160 ppm.
Yes, the zoomed-in peak around 1473.7 m/z still shows a charge state. Since the intact eGFP mass is about 27,982 Da:
z ≈ 27,982 / 1473.7
z ≈ 19
So the zoomed-in peak is approximately the +19 charge state. This also makes sense from the isotope spacing, since isotope peaks for a +19 ion should be separated by about 1/19 m/z.
Homework: Waters Part II
1. Native vs. denatured protein conformations
A native protein is still folded, so many charged groups are buried or less exposed. Because of this, in native mass spectrometry the protein usually picks up fewer charges. The peaks appear at higher m/z values and there are fewer charge states.
A denatured protein is unfolded, so more charged sites are exposed and can pick up protons. This gives many more charge states, usually shifted to lower m/z values. In Figure 2, the denatured eGFP spectrum has a wider charge-state envelope with many peaks, while the native spectrum has fewer main peaks at higher m/z.
2. Charge state near 2800 m/z
I am not fully confident from the screenshot alone, but the peak near 2800 m/z looks like about the +10 charge state.
This is because eGFP is roughly 27 to 28 kDa. A protein around 28,000 Da with charge +10 would appear near:
28000 / 10 = 2800 m/z
Waters Part III
1. Lysines and arginines in eGFP
The eGFP sequence has 20 lysines (K) and 6 arginines (R).
2. Number of predicted tryptic peptides
Using trypsin with 0 missed cleavages and only showing peptides above 500 Da, PeptideMass predicts 19 peptides.
3. LC-MS peaks between 0.5 and 6 minutes
From the TIC chromatogram, I count about 20 peptide peaks between 0.5 and 6 minutes that are above 10% relative abundance. This count is approximate because a few smaller peaks are close to the cutoff.
4. Do the observed peaks match the predicted peptides?
The observed number is close to the 19 predicted tryptic peptides, but it does not match perfectly. This makes sense because LC-MS peaks do not always map one-to-one to predicted peptides. Some peaks can come from modified peptides, contaminants, missed cleavages, or peptides that ionize better than others.
5. Charge state and singly charged mass
The most abundant charge state is z = 2. I can tell because the isotope peaks are spaced by about 0.5 m/z, and isotope spacing is approximately 1/z.
Using the main peak at m/z 525.76712:
[M + H]+ = 2 * 525.76712 - 1.0073
         = 1050.5269 Da
So the singly charged mass is about 1050.527 Da.
6. Peptide identity and mass accuracy
The closest predicted peptide from the PeptideMass output is FEGDTLVNR, with predicted mass 1050.5214 Da.
Using the observed singly charged mass from the spectrum, about 1050.5235 Da:
I contributed two pixels on the bottom left of the artwork, but for some reason they did not sync or show up correctly in the final version. I still liked the idea of the project because it turned a biology class assignment into a shared artwork, where everyone’s tiny contribution could become part of a larger image.
Part B: Cell-Free Protein Synthesis
1. Roles of each component
E. coli lysate: Provides the cell machinery needed for transcription and translation, including ribosomes, enzymes, tRNAs, and factors. The BL21(DE3) Star lysate also includes T7 RNA polymerase.
Potassium glutamate: Helps set the salt conditions for the reaction. Potassium is important for translation.
HEPES-KOH pH 7.5: Buffers the reaction so the pH stays near 7.5.
Magnesium glutamate: Provides magnesium, which is needed for ribosome function and nucleic acid stability.
Potassium phosphate monobasic and dibasic: Help buffer the reaction and provide phosphate.
Ribose: Helps support nucleotide regeneration in the longer reaction.
Glucose: Provides a longer-lasting energy source through metabolism in the lysate.
AMP, CMP, GMP, and UMP: Nucleotide monophosphates that can be converted into forms needed for RNA synthesis.
Guanine: Supports guanine nucleotide salvage and helps rebuild GTP.
17 amino acid mix: Provides most of the amino acids needed to make protein.
Tyrosine and cysteine: Added separately because they are less stable or need separate handling.
Nicotinamide: Supports NAD-related metabolism in the reaction.
Nuclease-free water: Brings the reaction to the final volume without degrading DNA or RNA.
2. Difference between the 1-hour and 20-hour master mixes
The 1-hour PEP-NTP mix is a faster, more direct system because it provides ready-to-use NTPs and a high-energy phosphate source. The 20-hour NMP-ribose-glucose mix is designed to last longer by using monophosphates, ribose, glucose, and lysate metabolism to regenerate energy and nucleotides over time.
3. Bonus
Transcription can still happen if guanine is included because the lysate can convert guanine through salvage pathways into GMP, then into GDP and GTP. So GMP does not always need to be added directly.
Part C: Planning the Global Experiment
1. Fluorescent protein properties
sfGFP folds well and is usually reliable in cell-free systems, so it should give a strong green signal.
mRFP1 is a red fluorescent protein, but it can mature more slowly and may not be as bright as newer red proteins.
mKO2 is an orange fluorescent protein. Its signal depends on proper folding and chromophore maturation.
mTurquoise2 is a cyan fluorescent protein with relatively strong brightness, but it still depends on folding and oxygen for maturation.
mScarlet-I is a bright red fluorescent protein. Its final signal may depend on giving it enough time to fold and mature.
Electra2 has a different excitation and emission profile, so the readout depends on matching the plate reader settings well.
2. Hypothesis
I would focus on mScarlet-I. My hypothesis is that using the longer NMP-ribose-glucose energy system and slightly increasing magnesium glutamate would improve red fluorescence after 36 hours. The longer energy system should keep protein production going, and magnesium should help translation. The expected result is a stronger final red signal.
title: ‘DNA Gel Art’ weight: 10 Week 2 Lab: DNA Gel Art This lab was about using restriction digests and gel electrophoresis to make DNA gel art. Instead of only using a gel as a diagnostic tool, we used the positions of DNA bands as a visual medium. The basic idea was that different restriction enzymes cut Lambda DNA into different fragment sizes, and those fragments separate into bands when run through an agarose gel.
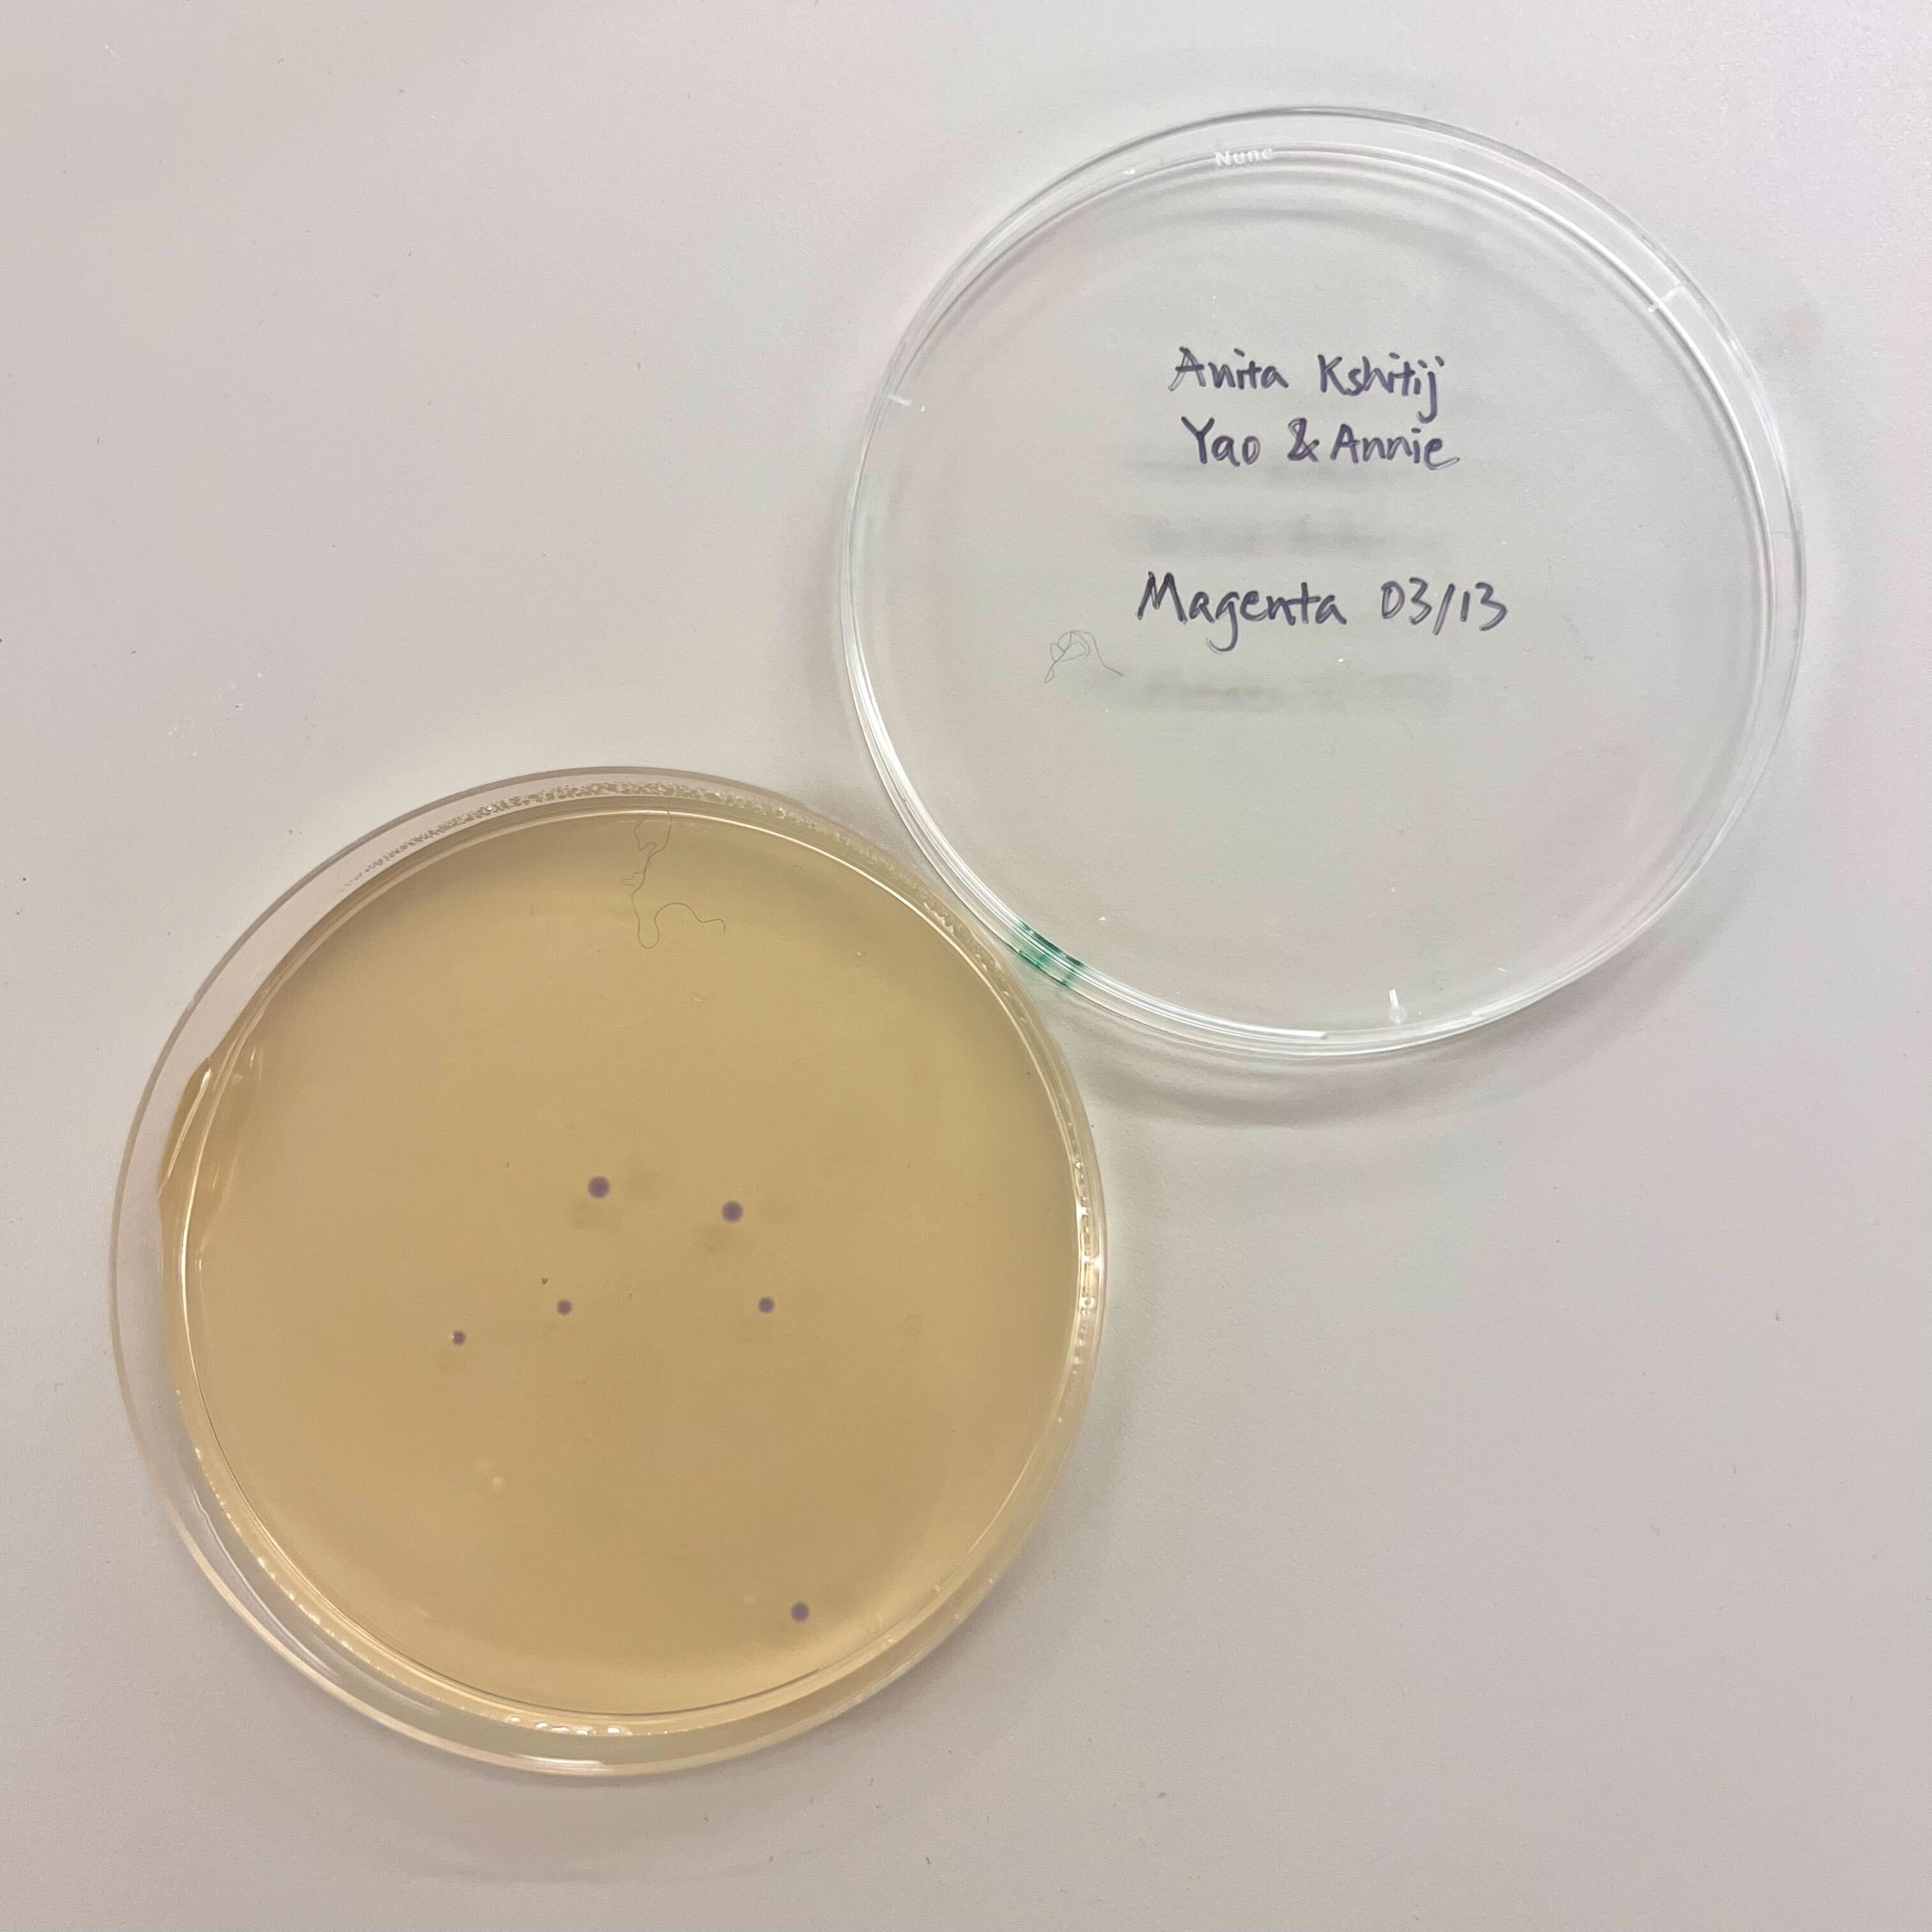
Week 6 Lab: Gibson Assembly This lab focused on using PCR, Gibson Assembly, and bacterial transformation to modify a plasmid carrying the amilCP chromoprotein gene. The goal was to introduce targeted color mutations and then transform the assembled plasmids into E. coli so that successful variants could be identified by colony color.
Our group worked on color variants intended to produce magenta and blue colonies. The experiment had several stages: PCR amplification, PCR cleanup, diagnostic gel electrophoresis, Gibson Assembly, transformation, recovery, plating, and colony observation.
I was not able to attend this lab in person because I was traveling for an interview. I informed Ronan ahead of time. A makeup session was not offered because this lab depended on time-sensitive biological materials, including mammalian cells that had already been grown or plated for the scheduled experiment.
Even though I missed the hands-on part, I reviewed the lab materials and thought through what I would have done if I had been there.
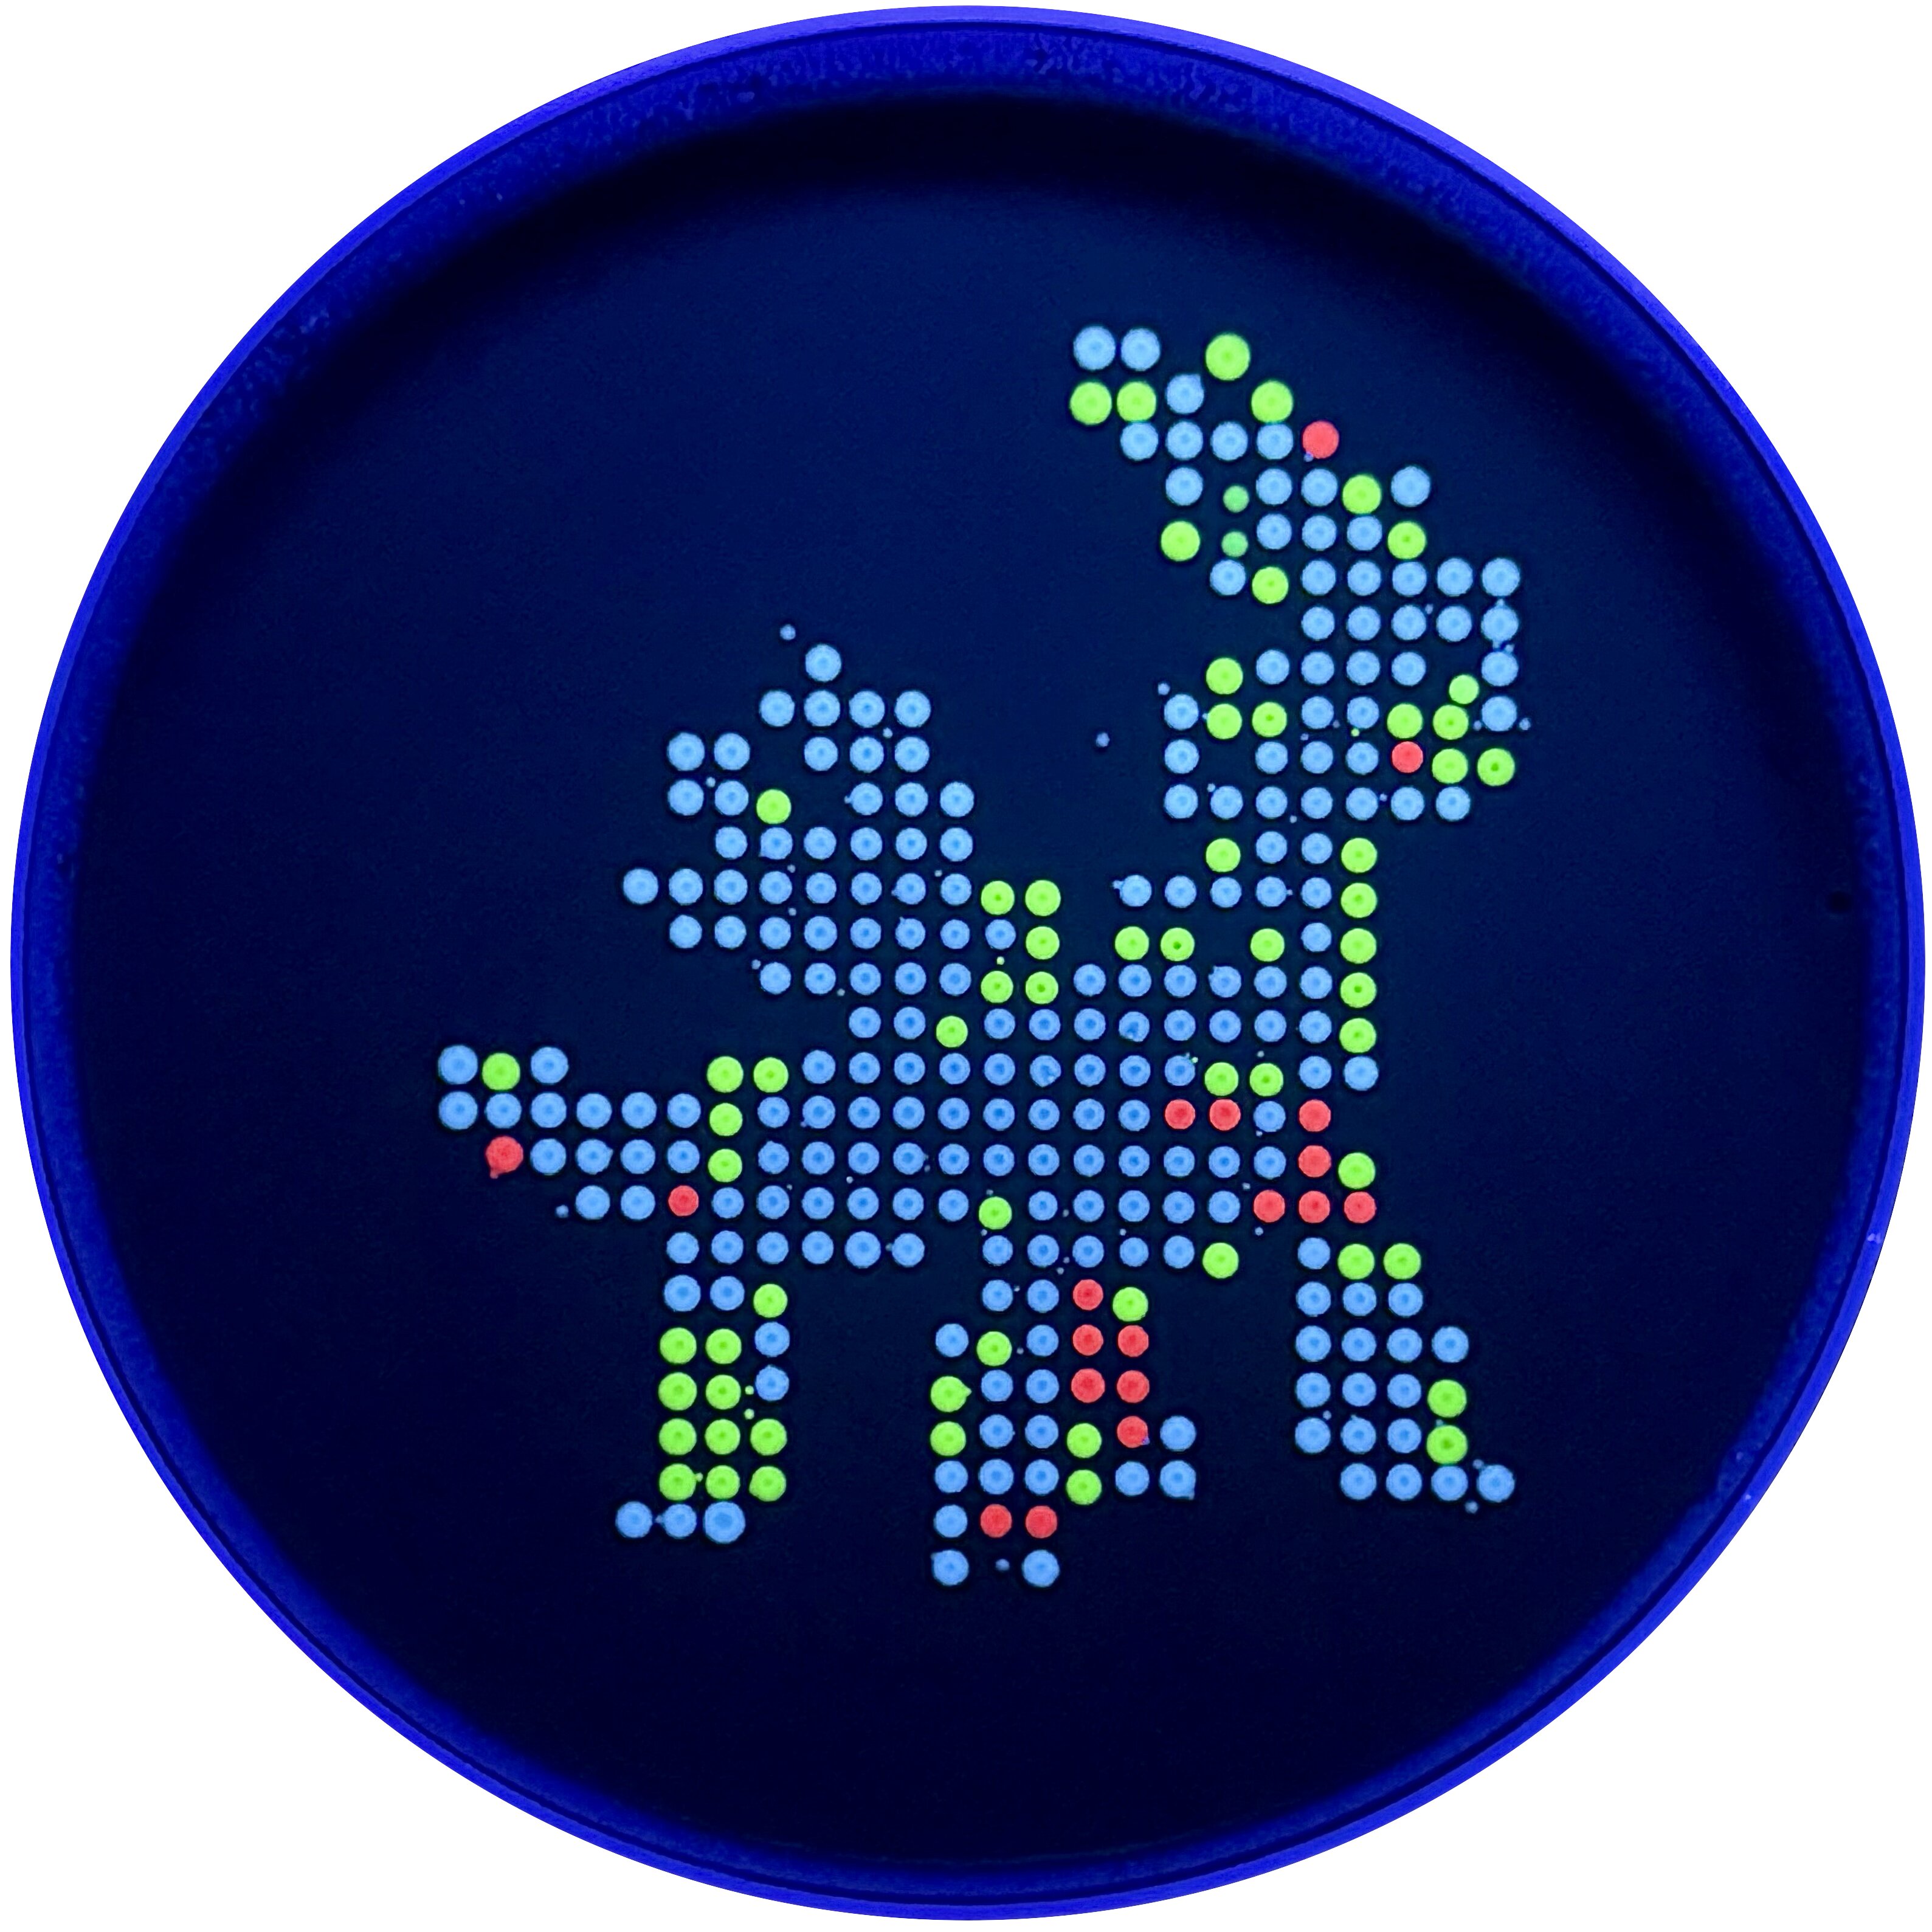
Dialga: A Legendary Pokemon from the Sinnoh region
Subsections of Labs
Cloud Lab
Week 11 Lab: Cloud Lab
DNA art
title: ‘DNA Gel Art’
weight: 10
Week 2 Lab: DNA Gel Art
This lab was about using restriction digests and gel electrophoresis to make DNA gel art. Instead of only using a gel as a diagnostic tool, we used the positions of DNA bands as a visual medium. The basic idea was that different restriction enzymes cut Lambda DNA into different fragment sizes, and those fragments separate into bands when run through an agarose gel.
I followed the lab protocol for designing the gel, preparing the restriction digests, casting the agarose gel, loading the samples, running electrophoresis, and imaging the final result.
Goal of the Lab
The goal was to create a visual pattern using DNA bands. Each lane of the gel was supposed to contain a different restriction digest. Since each enzyme cuts Lambda DNA at specific sites, each digest should produce a distinct set of DNA fragment sizes. When run on the gel, those fragments should migrate different distances and create the planned pattern.
This is the same principle used in normal molecular biology. If a DNA sequence is known, restriction digest software can predict what bands should appear. A real gel can then be compared against that prediction.
Design Process
Before the wet-lab steps, I planned the gel design digitally. The design process involved testing combinations of restriction enzymes on Lambda DNA and looking at the predicted band positions.
The enzymes available included:
EcoRI-HF
HindIII-HF
BamHI-HF
KpnI-HF
EcoRV-HF
SacI-HF
SalI-HF
The “HF” versions are high-fidelity restriction enzymes, which are designed to reduce off-target cutting. The visual design was based on choosing enzyme combinations that would create useful bands in each lane.
The important thing I learned is that gel art is not drawn directly. The image comes from fragment sizes. The design has to be translated into enzyme choices, and the enzyme choices then determine the band positions.
Preparing the Agarose Gel
I prepared a 1% agarose gel. The gel was made by mixing agarose powder with 1x TAE buffer.
Component
Amount
Agarose
0.75 g
1x TAE buffer
75 mL
SYBR Safe DNA stain
7.5 uL
The agarose and TAE were heated in the microwave in short pulses until the agarose dissolved and the solution became clear. I swirled the flask between heating steps to help dissolve the agarose evenly.
After the solution cooled slightly, SYBR Safe DNA stain was added. This stain binds to DNA and makes the bands visible under blue light after the gel is run.
The liquid gel was then poured into a casting tray with a comb in place. The comb created the wells where the DNA samples would later be loaded. After the gel solidified, the comb was removed carefully.
Restriction Digest Setup
While the gel was setting, I prepared the restriction digest reactions. Each reaction corresponded to one lane of the gel.
The general digest reaction volume was 20 uL.
Component
Amount
Lambda DNA
3 uL
10x enzyme buffer
2 uL
Restriction enzyme
1 uL per enzyme
Nuclease-free water
to 20 uL total
The Lambda DNA stock was 0.5 ug/uL, so 3 uL gave 1.5 ug DNA. The enzyme buffer was added so the final buffer concentration would be 1x. If a lane used more than one enzyme, I adjusted the water volume so the final reaction volume stayed at 20 uL.
The tubes were labeled by lane number. This mattered because if two tubes were swapped, the gel would no longer match the intended design.
Digest Incubation
After setting up the digest reactions, I incubated the tubes at 37°C for 30 minutes. This allowed the restriction enzymes to cut the Lambda DNA.
During this step, the full Lambda DNA molecule should be cut into smaller fragments. The number and size of fragments depends on the enzyme or enzyme combination in that tube.
Adding Loading Dye
After incubation, I added loading dye to the samples before loading them into the gel.
Loading dye is useful for two reasons. It makes the sample denser so it sinks into the well, and it also provides a visible dye front that helps track the progress of electrophoresis.
The target loading volume per well was 20 uL.
Component
Amount
6x loading dye
3.33 uL
DNA sample
variable
Nuclease-free water
to 20 uL total
Loading the Gel
Once the gel had solidified, I placed it in the electrophoresis box and added 1x TAE buffer until the gel was covered. The wells were placed near the negative electrode because DNA is negatively charged and migrates toward the positive electrode.
I loaded the samples into the wells according to the lane plan. This was one of the harder parts of the lab because the wells are small. The pipette tip has to be close enough to the well to release the sample cleanly, but not so deep that it punctures the gel.
If the loading step goes wrong, the sample can leak out, diffuse, or fail to enter the well properly.
Running the Gel
After loading, I connected the gel box to the power supply and ran the gel. The protocol recommended running at around 80 to 115 V for about 45 minutes.
When the current is running properly, bubbles appear in the buffer. This shows that the circuit is connected and current is passing through the system.
The DNA fragments separate by size as they move through the agarose. Smaller fragments travel farther, while larger fragments stay closer to the wells.
Imaging
After the gel run, the gel was placed on a blue light transilluminator. Since the gel contained SYBR Safe, DNA bands should fluoresce under blue light and become visible.
In my final image, the gel itself and the wells were visible, but the band pattern was extremely faint or absent. This means the final gel art did not come through clearly.
Potential Failure Modes
Since the final image was mostly blank, there are several possible failure modes.
Possible issue
Why it would matter
Too little DNA loaded
Bands would be too faint to see clearly
DNA was not loaded into the wells correctly
Sample could have floated away or leaked out
Restriction digest did not work
DNA fragments would not match the expected pattern
Enzyme mix-up
The lane pattern would not match the design
Missing or incorrect buffer
Enzymes or electrophoresis may not work properly
Gel ran for the wrong amount of time
Bands could stay near the top or migrate too far
Voltage issue
DNA may not migrate properly
Stain issue
DNA may be present but not visible
Imaging issue
Bands may be weak and not captured well by the camera
Pipetting error
Small volume mistakes can strongly affect final band brightness
Based on the final image, the most likely issues are low DNA visibility, loading problems, or an issue with digestion/loading concentration. Since the wells are visible but the bands are not, the gel itself formed correctly, but the DNA signal did not show up clearly.
Technical Understanding
The lab helped me understand why gel electrophoresis works. DNA has a negatively charged phosphate backbone, so it moves toward the positive electrode in an electric field. The agarose gel acts like a molecular sieve. Smaller DNA fragments pass through the gel more easily and move farther, while larger fragments move more slowly.
Restriction enzymes make the band pattern predictable. Each enzyme recognizes specific DNA sequences and cuts at those sites. If we know the Lambda DNA sequence, we can predict the sizes of fragments produced by each enzyme. The gel result should then show bands corresponding to those predicted fragment sizes.
In this lab, that same molecular biology logic was used creatively. Instead of asking “is this plasmid correct?”, we asked whether enzyme choices could produce a visual pattern.
Reflection
Even though my final DNA art did not work well, this lab helped me understand the full gel electrophoresis workflow. I got practice preparing an agarose gel, setting up restriction digests, adding loading dye, loading wells, running the gel, and imaging the result.
The most difficult part was the precision required. Small errors in pipetting, labeling, loading, or timing can make the final gel unclear. I also saw that a gel result depends on many steps working together. If the design is correct but the DNA is not visible, the final art still fails.
The main takeaway for me was that gel electrophoresis is both conceptually simple and experimentally delicate. The idea is straightforward: cut DNA, separate fragments, and visualize bands. But getting clean bands requires careful execution at every step.
Final Result
My final result did not really show the intended DNA art pattern. The gel image was mostly blank, with the wells visible at the top but very little clear banding across the gel.
Even though the final image did not work well, the lab was still useful because it showed how many steps have to work correctly for a gel to produce a clear image.
Gibson Assembly Lab
Week 6 Lab: Gibson Assembly
This lab focused on using PCR, Gibson Assembly, and bacterial transformation to modify a plasmid carrying the amilCP chromoprotein gene. The goal was to introduce targeted color mutations and then transform the assembled plasmids into E. coli so that successful variants could be identified by colony color.
Our group worked on color variants intended to produce magenta and blue colonies. The experiment had several stages: PCR amplification, PCR cleanup, diagnostic gel electrophoresis, Gibson Assembly, transformation, recovery, plating, and colony observation.
Photos
Here are the photos I took during the lab.
Overall Strategy
The basic idea was to split the plasmid into two PCR products and then put it back together with a designed mutation. One PCR reaction amplified the larger backbone region of the plasmid, and the other amplified the color insert region containing the mutation near the chromoprotein sequence.
After PCR, the fragments were purified and checked on a gel. If the fragments were present at the expected sizes, they could be combined using Gibson Assembly. Gibson Assembly uses overlapping ends between DNA fragments to join them into one circular plasmid. The assembled plasmid was then transformed into chemically competent E. coli cells and plated on antibiotic plates.
Part 1: PCR Setup
We ran two PCR reactions from the mUAV plasmid template.
The first reaction amplified the backbone fragment. This contained the plasmid parts needed for propagation and expression, such as the origin of replication, chloramphenicol resistance, promoter, and ribosome binding site.
The second reaction amplified the color insert fragment. This contained the region around the amilCP chromoprotein gene. The forward primer introduced the color mutation, so the PCR product was not just copying the original sequence. It was also adding the designed change.
Each 25 uL PCR reaction used:
Component
Amount
Template DNA, 38.5 ng/uL
0.8 uL
Forward primer, 5 uM
2.5 uL
Reverse primer, 5 uM
2.5 uL
Phusion HF PCR Master Mix
12.5 uL
Nuclease-free water
to 25 uL
Phusion polymerase was used because it is high-fidelity, which matters when the goal is to create a specific mutation without adding many unintended errors.
PCR Thermocycler Conditions
The backbone and color-insert reactions used different annealing and extension conditions because the fragments had different sizes and primer properties.
Backbone PCR
98°C for 30 seconds
26 cycles:
98°C for 10 seconds
57°C for 25 seconds
72°C for 1.5 minutes
72°C for 5 minutes
12°C hold
Color Insert PCR
98°C for 15 seconds
26 cycles:
98°C for 10 seconds
53°C for 20 seconds
72°C for 15 seconds
72°C for 5 minutes
12°C hold
The backbone needed a longer extension step because it was the larger fragment. The color insert was shorter, so the extension time was much shorter.
Part 1a: PCR Product Cleanup
After PCR, the products were purified using a Zymo DNA Clean & Concentrator kit. This step removed primers, salts, enzymes, and other leftover PCR components that could interfere with later assembly.
For each sample, the PCR product was mixed with DNA binding buffer and loaded onto a spin column. The DNA binds to the column under the buffer conditions. After centrifugation and washing, the DNA was eluted in a small volume of nuclease-free water.
The cleanup workflow was:
Mix 20 uL PCR product with 100 uL DNA binding buffer.
Load onto a ZymoSpin column.
Centrifuge to bind DNA to the column.
Wash twice with 200 uL DNA wash buffer.
Elute DNA in 6 uL nuclease-free water.
The small elution volume helped keep the DNA concentrated for Gibson Assembly.
Part 1b: Diagnostic Gel Electrophoresis
After purification, we ran a diagnostic gel to check whether the PCR reactions produced fragments of the expected sizes. For each sample, 2 uL of purified DNA was mixed with 18 uL water before loading. A pre-diluted DNA ladder was also loaded, and the original mUAV plasmid was used as a reference.
The gel was useful because it gave a quick quality check before assembly. If the backbone and insert bands appeared at the expected positions, that meant the PCR products were likely usable. If a reaction had no band or many nonspecific bands, Gibson Assembly would probably fail or produce the wrong construct.
In our gel image, visible bands appeared in the expected lanes. That suggested that at least some PCR product was present and that the fragments could be carried forward into assembly.
Part 2a: Gibson Assembly
The purified backbone and color-insert fragments were combined using Gibson Assembly Master Mix. Gibson Assembly works because the DNA fragments are designed to have overlapping ends. These overlaps allow the fragments to find each other and be joined into a complete circular plasmid.
The reaction was set up in 10 uL total volume and incubated at 50°C for 15 minutes. After the incubation, 100 uL nuclease-free water was added to dilute the assembly product before transformation.
Mechanistically, Gibson Assembly has four main steps:
An exonuclease chews back the 5’ ends of DNA fragments.
Complementary single-stranded overlaps anneal to each other.
A polymerase fills in missing bases.
A ligase seals the remaining nicks.
This produces a circular plasmid containing the backbone and the mutated color insert.
Part 2b: Transformation
The Gibson Assembly products were transformed into chemically competent DH5α E. coli using heat shock.
The transformation workflow was:
Thaw competent cells on ice for about 10 minutes.
Add 4 uL diluted Gibson Assembly product to 20 uL competent cells.
Incubate on ice for 30 minutes.
Heat shock at 42°C for 45 seconds.
Return cells to ice for 5 minutes.
Add 100 uL SOC media.
Recover with shaking for 60 minutes.
Plate 100 uL on selective agar plates.
Incubate plates at 37°C.
The heat shock step helps plasmid DNA enter the competent cells. The SOC recovery step gives cells time to recover and begin expressing the antibiotic resistance gene before they are placed on selective plates.
Results
The final colony count was low overall. The blue plate showed a small partial success, with a few visibly blue colonies. The magenta plates did not show clear magenta colonies. The colonies that did grow on those plates may have been untransformed, incorrectly assembled, or reverted toward the original purple amilCP color.
The result suggests that at least one assembly or transformation condition worked partially, but the efficiency was low. Possible reasons include low PCR yield, poor fragment ratio in Gibson Assembly, DNA loss during cleanup, inefficient transformation, or mutations not producing the intended visible color.
Reflection
This lab helped me understand how DNA design turns into an actual biological test. Before this, I thought of a mutation mainly as a sequence edit. In practice, the mutation had to pass through many physical steps: primer design, PCR amplification, cleanup, gel checking, Gibson Assembly, transformation, recovery, and plating.
The most useful checkpoint was the gel, because it showed whether the PCR step produced DNA fragments before we moved on to assembly. The plate result was also useful because it gave a biological readout of the whole workflow. Even if the gel looks reasonable, the construct still has to assemble correctly, enter cells, and express the intended chromoprotein.
The low colony count also showed how many things can reduce success in cloning. A weak final result does not necessarily mean one single step failed. It could come from small losses or inefficiencies across multiple steps. Overall, this lab made the full cloning pipeline much clearer to me.
Neuromorphic Circuits and Biomaterials
I was not able to attend this lab in person because I was traveling for an interview. I informed Ronan ahead of time. A makeup session was not offered because this lab depended on time-sensitive biological materials, including mammalian cells that had already been grown or plated for the scheduled experiment.
Even though I missed the hands-on part, I reviewed the lab materials and thought through what I would have done if I had been there.
Lab Goal
The lab was about building neuromorphic genetic circuits in mammalian cells. The word “neuromorphic” here does not mean that the cells are literally neurons. It means that the circuit is designed to process information in a more dynamic way than a simple on/off reporter.
Instead of just putting a fluorescent protein after a promoter, the circuit uses regulatory parts that interact with each other before producing an output. That makes the behavior depend on combinations of inputs, expression levels, and timing.
What I Would Have Tried
If I had attended the lab, I would have kept my circuit fairly simple. Since transfection itself can be noisy, I think it would be better to design something that is easy to debug rather than something too clever.
I would have tried a two-input circuit where Csy4 and CasE act as the main regulatory inputs, and mNeonGreen is the final output. I would also include separate fluorescent markers for the two input groups so that I could tell whether the cells actually received and expressed those inputs.
Group
Part
Why I would include it
X1
Csy4
First regulatory input
X1
mKO2
Marker showing X1 was expressed
X2
CasE
Second regulatory input
X2
eBFP2
Marker showing X2 was expressed
Output
Csy4_rec_CasE
Interaction module between the regulatory parts
Output
CasE_rec_mNeonGreen
Final green output
The main reason for including mKO2 and eBFP2 is that they would make the result easier to interpret. If the final green output is missing, I would want to know whether the circuit logic failed or whether one of the input groups just did not transfect well.
Proposed Circuit Design
The circuit I would propose is a two-input regulatory circuit. The rough idea is that the final green output depends on how the Csy4 and CasE-related parts interact.
I would not expect this to behave like a perfect electronic logic gate. In cells, expression is messy and continuous. Some cells might receive more DNA than others, and even cells with the same DNA can express it at different levels. So I would treat this as a biological signal-processing experiment, not as a clean digital circuit.
The three most useful readouts would be:
mKO2 for the Csy4 input group
eBFP2 for the CasE input group
mNeonGreen for the final output
That way, the final output could be compared against the input markers.
Spreadsheet Plan
The lab used a spreadsheet to specify the circuit. Each row listed the circuit name, transfection group, part name, DNA concentration, and amount of DNA wanted. The concentration was fixed at 50 ng/uL, so the important design choices were which parts to include and how much DNA to use.
I would fill it out like this:
Circuit name
Transfection group
Contents
Concentration (ng/uL)
DNA wanted (ng)
MyCircuit
X1
Csy4
50
100
MyCircuit
X1
mKO2
50
100
MyCircuit
X2
CasE
50
100
MyCircuit
X2
eBFP2
50
100
MyCircuit
Output
Csy4_rec_CasE
50
125
MyCircuit
Output
CasE_rec_mNeonGreen
50
125
Total DNA: 650 ng.
I chose 650 ng because the protocol limit was 650 ng total DNA. I gave the input components and marker components 100 ng each, then used the remaining DNA for the output-related components. This feels like a reasonable first-pass design because it keeps the inputs visible while still giving enough DNA to the output module.
OT-2 Workflow
The spreadsheet would then act as the instruction layer for the OT-2 robot. The robot would use the part names and DNA amounts to prepare the transfection mixtures.
This part of the lab is interesting because it turns the spreadsheet into something executable. The design is not just notes for a human. It becomes a recipe for the robot to pipette the correct DNA parts into the correct mixtures.
Using the OT-2 also makes sense because these experiments can involve many small-volume transfers. Doing that by hand would be easy to mess up, especially if different groups are testing different circuit designs.
Transfection into HEK293 Cells
After the DNA mixtures were prepared, they would be transfected into HEK293 cells. Transfection introduces DNA into mammalian cells, and then the cells express the circuit components from that DNA.
I think the key point is that the cells are the system actually running the circuit. The DNA is the design, but the result depends on the cell state, transfection efficiency, expression level, and time after transfection.
HEK293 cells are commonly used for mammalian expression experiments, so they are a practical choice for this kind of lab.
What I Would Look For
If I had been able to run the experiment, I would compare the three fluorescence channels rather than only looking at the final green output.
Signal
What it would tell me
mKO2
Whether the X1 group expressed well
eBFP2
Whether the X2 group expressed well
mNeonGreen
Whether the output module was active
The most useful comparison would be across different input combinations:
Condition
Why it matters
Output module only
Baseline leakiness
X1 + output
Effect of Csy4 alone
X2 + output
Effect of CasE alone
X1 + X2 + output
Combined effect of both inputs
This would help separate real circuit behavior from boring experimental failure. For example, if mNeonGreen is low but mKO2 and eBFP2 are also low, then the problem might just be poor transfection. But if both input markers are high and mNeonGreen changes, then the circuit interaction is more meaningful.
Waters
Photos
Lab Overview
This lab introduced us to mass spectrometry as a way to identify and measure molecules in a sample. The course page lists this as the Week 10 Mass Spectrometry lab, under the broader theme of advanced imaging and measurement technology.
The main idea of the lab was to understand the full measurement pipeline, not just the final spectrum. A sample has to be prepared, placed in the correct position, associated with the correct software method, run through the instrument, and then analyzed from the output data.
Protocol Understanding
The workflow started with organizing the samples and making sure each tube or vial corresponded to the correct entry in the software. This is a small but important part of the protocol because the instrument can run multiple samples automatically. If the physical sample position and the software sample list do not match, the data can be assigned to the wrong sample.
In a typical Waters LC-MS workflow, the sample is injected into a liquid chromatography system. The liquid solvent carries the sample through the column, where different molecules separate based on how they interact with the column material and solvent conditions. This means molecules do not all reach the mass spectrometer at the same time.
After separation, the sample enters the ionization source. The molecules are converted into ions so that they can be manipulated and detected by the mass spectrometer. The instrument then separates ions by mass-to-charge ratio, usually written as m/z. The detector records signals at different m/z values, producing peaks that can be viewed in the software.
What Was Done
In the lab, we observed the Waters instrument setup and how samples are prepared and loaded for analysis. The sample racks and tubes had to be organized carefully so that the correct sample was associated with the correct run. We also looked at the computer interface used to control the instrument and view the output.
The instrument method controls details such as the sample injection, run duration, solvent conditions, and detector settings. Once the run begins, the system automatically moves the sample through the measurement pipeline. The resulting data can include chromatograms, which show signal over time, and spectra, which show signal across mass-to-charge ratios.
Data Interpretation
The output of mass spectrometry is not a simple visual result like a colony plate or gel band. Instead, the result is a set of peaks. The position of a peak can help identify a molecule or fragment, while the intensity of the peak gives information about how strong that signal is.
A key thing I learned is that mass spectrometry data requires interpretation. Some peaks may correspond to the molecule of interest, while others can come from fragments, contaminants, solvent, background signal, or noise. This makes the software and analysis step a core part of the protocol.
Reflection
This lab helped me understand mass spectrometry as a bridge between wet-lab sample handling and computational analysis. The physical work involves preparing, labeling, and loading samples, but the final result depends on interpreting instrument data.
The most useful part was seeing the complete pipeline. The instrument can produce very precise measurements, but the quality of the result still depends on good sample organization, correct method setup, and careful interpretation. Even though I did not independently operate the full instrument myself, this lab made the role of mass spectrometry much clearer. It is useful when we need detailed information about what molecules are present in a sample, rather than just whether an experiment visibly worked.
Week 1 Lab: Pipetting
Week 3 Lab
Dialga: A Legendary Pokemon from the Sinnoh region
HTGAA 2026: Individual Final Project Documentation Project Title Bio-Acoustics: Lab-Grown Spider Silk Instruments
SECTION 1: ABSTRACT This project focuses on designing a recombinant spider-silk-inspired protein that could be expressed, purified, concentrated, and spun into a synthetic fiber. Spider silk is an important biomaterial because it combines strength, elasticity, toughness, and low density. These properties make it useful for many possible applications, including textiles, biodegradable fibers, medical materials, lightweight structural materials, and acoustic materials.
Subsections of Projects
Individual Final Project
HTGAA 2026: Individual Final Project Documentation
Project Title
Bio-Acoustics: Lab-Grown Spider Silk Instruments
SECTION 1: ABSTRACT
This project focuses on designing a recombinant spider-silk-inspired protein that could be expressed, purified, concentrated, and spun into a synthetic fiber. Spider silk is an important biomaterial because it combines strength, elasticity, toughness, and low density. These properties make it useful for many possible applications, including textiles, biodegradable fibers, medical materials, lightweight structural materials, and acoustic materials.
The broad objective of this project is to design a mini-spidroin DNA construct that preserves some of the core sequence logic of spider silk while remaining small enough to synthesize and analyze in a class-scale setting. I hypothesized that a short repeat-rich protein containing alanine-rich and glycine-rich domains could produce a silk-like material in which alanine-rich regions contribute strength and glycine-rich regions contribute flexibility.
The main completed outcome was a 476 bp DNA construct containing a T7 promoter, ribosome binding site, start codon, spider-silk-inspired repetitive coding region, C-terminal 6xHis purification tag, and double stop codon. Translation from the first start codon produced a continuous 146 amino acid mini-spidroin-like protein with no premature stop codons before the final termination sequence. Because some wet-lab materials were not delivered in time, this project was validated mainly through DNA design, sequence annotation, open reading frame verification, expected protein translation, molecular weight estimation, and a future experimental protocol.
The proposed future workflow includes recombinant expression in a T7-based bacterial system, His-tag purification, centrifugal ultrafiltration as an alternative to SpeedVac concentration, wet-spinning into a coagulation bath, and testing of the resulting fiber. Musical instrument strings are treated as one possible downstream application because they require a material that can hold tension while vibrating predictably. However, the central goal of the project is broader: engineering recombinant spider silk as a tunable biomaterial platform.
SECTION 2: PROJECT AIMS
Aim 1: Experimental Aim
The first aim of this project is to design and validate a recombinant DNA construct encoding a spider-silk-inspired mini-spidroin protein. This includes verifying that the sequence contains the expected expression elements, translates in frame from the first start codon, avoids premature stop codons, and ends with a C-terminal 6xHis tag for purification. This aim was completed computationally using Benchling sequence annotation and translation of the 476 bp construct.
Aim 2: Developmental Aim
The second aim is to develop a realistic protocol for producing the designed protein and converting it into a fiber. The planned workflow includes expression in a T7-based E. coli system, cell lysis, nickel affinity purification of the His-tagged protein, concentration of the purified protein, and wet-spinning into a coagulation bath.
Since the lab did not have a Savant SpeedVac DNA 130 Integrated Vacuum Concentrator System, the protocol was modified to use centrifugal ultrafiltration as the preferred alternative method for concentrating the purified protein. This keeps the workflow realistic with available lab equipment while still supporting the same downstream goal: producing a concentrated silk protein solution suitable for fiber formation.
Aim 3: Visionary Aim
The long-term aim is to develop recombinant spider silk as a tunable biomaterial platform. If the fiber can be produced reliably, its mechanical properties could be tested for several applications, including biodegradable textiles, medical materials, lightweight structural fibers, and acoustic materials.
Musical instrument strings are one motivating application because they require a fiber that can hold tension, resist breaking, and vibrate consistently. In the future, different mini-spidroin sequences could be designed to tune strength, elasticity, density, and resonance for different uses.
SECTION 3: BACKGROUND
1. Peer-Reviewed Research Citations
Xu and Lewis (1990) studied the structure of spider dragline silk and showed that spider silk proteins have a highly repetitive architecture. This is relevant to my project because my mini-spidroin DNA construct also uses repeated sequence motifs rather than a random protein sequence. Their work supports the idea that spider silk mechanics are connected to the arrangement of amino acid repeats, especially regions that contribute strength and flexibility. This helped guide my design toward a repeat-rich mini-spidroin-like protein with alanine-rich and glycine-rich regions.
Tokareva et al. (2013) reviewed recombinant DNA production of spider silk proteins and described why producing spider silk in engineered biological systems is promising but technically difficult. Full-length natural spidroins are very large and repetitive, which can make them challenging to synthesize, clone, and express. This directly supports my decision to design a shorter mini-spidroin-like construct instead of attempting to reproduce an entire natural spider silk protein. Their paper also helped frame my project as a design and expression problem, not just a material testing problem.
2. Literature and Biological Context
Spider silk is known for combining high tensile strength, extensibility, and toughness. These properties arise from the organization of repetitive protein domains. Alanine-rich regions in spider silk proteins are associated with ordered beta-sheet crystalline domains, while glycine-rich regions behave more like flexible amorphous spacers. Together, these regions help spider silk combine strength with flexibility.
A full natural spider silk protein is extremely large and repetitive, which makes it difficult to synthesize, clone, and express in a short course project. I therefore designed a mini-spidroin-like construct. This shorter design is not expected to fully reproduce natural spider silk, but it captures the key sequence logic: repeated alanine-rich regions for ordered strength-forming domains and glycine-rich regions for flexibility. This makes it a realistic first engineering cycle.
These papers also support an important limitation of the project: making a silk-like protein sequence is not the same as proving that it forms a strong fiber. Recombinant silk properties depend on both the protein sequence and the processing conditions used after expression. Wet-spinning, coagulation bath composition, protein concentration, and post-spin drawing can all affect whether the final material becomes a continuous, handleable fiber. For this reason, my current result is best described as a design-validated mini-spidroin construct and proposed experimental workflow, rather than a completed demonstration of functional spider silk.
This structure is useful for engineering fibers. A useful fiber must be strong enough to resist breaking but flexible enough to deform under stress. This is especially important for applications such as textiles, biomedical fibers, and acoustic strings. For a musical string application, the frequency of vibration depends on length, tension, and linear density:
f = (1 / 2L) * sqrt(T / μ)
In this equation, f is frequency, L is string length, T is tension, and μ is linear mass density. A good acoustic fiber therefore needs a balance between strength, elasticity, and density. Spider-silk-inspired proteins are interesting because their mechanical behavior can potentially be tuned at the DNA sequence level.
3. Novelty and Innovation
This project is novel because it designs spider silk as an engineered biomaterial from the DNA level rather than treating silk as only a naturally harvested material. The project connects DNA design, protein engineering, purification, concentration, wet-spinning, and material testing in one workflow. The sequence was built to contain expression elements, repetitive silk-like coding regions, and a purification tag that supports a realistic production pipeline.
The design is also intentionally modest. Instead of trying to reproduce a complete natural spidroin, which would be difficult to synthesize and express, this project uses a smaller repeat-rich construct that captures the basic alanine-rich and glycine-rich pattern. This makes the project feasible while still connecting the DNA sequence to a material property hypothesis.
The musical instrument string application adds an additional layer of novelty because it gives the fiber a clear functional test. Instead of only asking whether a fiber can be made, the project asks whether the fiber could eventually be useful under tension and vibration. However, the application does not define the entire project. The main innovation is the design of a recombinant spider-silk-inspired fiber platform.
4. Project Significance and Impact
This project matters because spider silk-like materials could provide sustainable alternatives to petroleum-based polymers and other conventional fibers. A biologically produced fiber could be biodegradable, tunable, and produced under milder conditions than many synthetic materials. If recombinant silk fibers can be made strong and flexible, they could be useful in textiles, biomedical materials, packaging, lightweight structures, and other material applications.
The project also matters scientifically because it shows how synthetic biology can be used to design physical materials. Instead of only engineering cells to produce chemicals or signals, this project uses DNA to specify a protein that can become a macroscopic fiber. The acoustic string idea is one concrete application, but the broader contribution is a testable framework for linking DNA sequence to material behavior.
The expected impact at this stage is not a finished commercial material. The impact is a validated design and workflow that could be used in future work. If expression, purification, and spinning are successful later, the same workflow could be used to compare different mini-spidroin sequences and test how sequence changes affect fiber formation, strength, flexibility, and possible acoustic behavior.
5. Ethical Implications
The main ethical considerations are biosafety, environmental responsibility, and responsible use of engineered materials. The proposed host organism would be a non-pathogenic laboratory strain of E. coli, and all work should follow standard course biosafety protocols. Since the project involves recombinant DNA and protein production, cells and waste should be handled using approved containment and disposal procedures.
Environmental responsibility is also important. The project is motivated by sustainability, but the wet-spinning process may involve alcohols or other chemical baths. These should not be treated as harmless just because the final material is biological. Chemical waste should be collected and disposed of properly.
Another ethical issue is that high-strength biomaterials could have applications outside the intended context. For that reason, the project should be framed around transparent, peaceful, and sustainable material development. The current construct is also a small educational mini-spidroin-like design, not a finished high-performance material, which reduces immediate dual-use concern while still making responsible framing important.
SECTION 4: EXPERIMENTAL DESIGN, TECHNIQUES, TOOLS, AND TECHNOLOGY
1. Detailed Experimental Plan
The experimental plan is centered on producing a recombinant spider-silk-inspired fiber. The musical string idea is used as a possible downstream application and testing case, but the main technical objective is to design, express, purify, concentrate, and spin a mini-spidroin protein into a physical fiber.
Part 1: DNA Construct Design and Validation
The starting point of the project was the following 476 bp DNA sequence:
Benchling annotation of the construct indicates the intended organization: a promoter region, an RBS upstream of the coding sequence, a long repetitive spider-silk-inspired gene region, a C-terminal 6xHis tag, and terminal stop codons. The promoter region includes the T7 promoter sequence:
TAATACGACTCACTATAGGG
This promoter was included so the construct could be used in a T7-based expression system. Downstream of this region, the sequence includes an RBS before the start codon. Translation begins at the first ATG.
This protein is 146 amino acids long and ends with a C-terminal 6xHis tag. The His tag was included so that the protein could be purified using nickel affinity chromatography. The final TAA TAA double stop codon was included to terminate translation.
The design works as a first-pass mini-spidroin design because it preserves some of the main structure-function logic of spider silk. The repeated alanine-rich sections are expected to encourage ordered domains that could contribute to strength and stiffness. The glycine-rich regions are expected to contribute flexibility. These features are useful for many fiber applications because a strong material still needs some ability to deform without immediately breaking. For a musical instrument string specifically, this balance is important because the material must tolerate tension while vibrating in a controlled way.
Although the construct contains a T7 promoter and RBS annotation, actual protein expression would still depend on the final plasmid context, host strain, spacing between the RBS and start codon, local RNA structure, and induction conditions. Therefore, the computational design validates the intended construct logic but does not guarantee high expression.
Part 2: Recombinant Expression Plan
The planned next step is to express the mini-spidroin protein in a T7-based E. coli expression system.
Transform the plasmid containing the mini-spidroin construct into a suitable expression strain such as E. coli BL21(DE3).
Plate transformed cells on the correct antibiotic selection plate.
Pick a single colony and grow a starter culture.
Use the starter culture to inoculate a larger expression culture.
Grow cells to the appropriate induction window.
Induce expression using the T7 system.
Harvest the cells by centrifugation.
Store the cell pellet or proceed directly to lysis.
Expected result: successful expression would produce a new protein band near the expected molecular weight of the designed mini-spidroin.
Part 3: Protein Lysis and Purification
The protein was designed with a C-terminal His tag, so the planned purification method is immobilized metal affinity chromatography.
Resuspend the harvested cell pellet in lysis buffer.
Lyse the cells using an approved lab method such as sonication or chemical lysis.
Centrifuge the lysate to remove insoluble debris.
Apply the clarified lysate to nickel affinity resin.
Wash the resin to remove weakly bound proteins.
Elute the His-tagged mini-spidroin using imidazole-containing buffer.
Analyze samples using SDS-PAGE.
The SDS-PAGE gel should include:
Uninduced control
Induced lysate
Flow-through
Wash fraction
Elution fraction
Expected result: the elution fraction should be enriched for a band near the predicted size of the mini-spidroin. This would support successful expression and purification, but it would not by itself prove that the protein can form a strong fiber.
Part 4: Concentrating the Protein Without a SpeedVac
The original plan included a Savant SpeedVac DNA 130 Integrated Vacuum Concentrator System, but this instrument was not available in the lab. The preferred alternative is centrifugal ultrafiltration.
Preferred alternative protocol:
Load the purified protein solution into a centrifugal concentrator.
Use a molecular weight cutoff smaller than the target protein, such as 3 kDa or 10 kDa.
Centrifuge according to the concentrator instructions.
Check the sample volume periodically.
Stop before the sample dries out.
Recover the concentrated protein from the top chamber.
If buffer exchange is needed, add fresh buffer and repeat the concentration step.
This method is preferable because it is gentle, does not require vacuum evaporation, and is commonly used for concentrating proteins. It also avoids heating the sample, which could increase aggregation risk.
Backup alternative: protein precipitation and resuspension could be used if centrifugal filters are unavailable, but this is less ideal because silk-like proteins may aggregate irreversibly.
Part 5: Wet-Spinning the Fiber
The purpose of wet-spinning is to convert the concentrated protein solution into a solid fiber.
Prepare concentrated mini-spidroin solution as the spinning dope.
Load the solution into a syringe or simple extrusion setup.
Extrude the solution through a narrow needle or tubing into a coagulation bath.
Allow solvent exchange to collapse the protein into a solid fiber.
Collect the forming fiber carefully.
Stretch the fiber after formation to encourage chain alignment.
Dry the fiber under controlled conditions.
Store the fiber for future testing.
The expected mechanism is that the coagulation bath removes water and promotes protein chain collapse, while drawing helps align the protein chains along the fiber axis. The alanine-rich regions are expected to form stronger ordered domains, while the glycine-rich regions preserve flexibility. However, this would need to be tested experimentally because the exact behavior depends on protein concentration, folding, solvent conditions, and spinning parameters.
Part 6: Material and Application Testing
If the fiber is successfully produced, it can be tested as a physical material first, and then optionally tested for acoustic behavior.
Measure fiber diameter using a microscope or caliper.
Check whether the fiber can be dried and handled without breaking.
Mount the fiber under mild tension.
Measure qualitative stretch, strength, and brittleness.
If the fiber survives tension, pluck or vibrate the fiber.
Record the sound using a microphone or contact pickup.
Analyze the signal using FFT to identify dominant frequency and harmonic content.
Compare the acoustic response to a nylon or commercial string control.
Expected result: a successful fiber would survive handling, hold mild tension, and show properties consistent with a usable biomaterial fiber. A successful acoustic application would also produce a measurable vibration or sound signal. These are future expectations, not results already obtained.
Decision Checkpoints
If Benchling translation shows a premature stop codon, redesign the coding sequence.
If the His tag is not in frame, redesign the 3’ end before ordering.
If SDS-PAGE shows no induced band, test different induction temperatures or expression times.
If the protein is insoluble, test lower-temperature induction or purify from the soluble fraction after lysis.
If concentration causes aggregation, reduce concentration speed, change buffer, or stop at a lower protein concentration.
If wet-spinning fails to form a continuous fiber, adjust protein concentration, needle size, coagulation bath composition, or draw speed.
Techniques Relevant to This Project
Checked techniques:
DNA Construct Design
Protein Design
Use of Benchling
Databases and sequence analysis tools
Bioproduction
Bacterial Culturing
Protein Purification
Quality Control / Analysis
Centrifugation, Lysis, DNA/Protein Purification
Wet-spinning and fiber formation
Material testing
Optional acoustic data analysis
Not checked / not used:
DNA Sequencing
Restriction Enzyme Digestion
Gel Electrophoresis
Gibson Assembly
PCR Reactions
CRISPR/Cas9
Designing Prime Editing gRNA
Lab Automation / Opentrons
Cell-Free Reactions
Freeze-Dried Cell-Free Systems
Two Techniques Expanded
Technique 1: DNA Construct Design
DNA construct design was the most important completed technique in this project. I used the desired material function as the starting point, then designed a DNA sequence that encoded relevant protein features. The sequence includes a T7 promoter, an RBS, a start codon, a repetitive silk-like coding region, a C-terminal His tag, and double stop codons.
This technique was useful because the final material properties depend on the protein sequence. The alanine-rich regions were included to support strength through ordered domains, while the glycine-rich regions were included for flexibility. By translating the DNA sequence and checking the open reading frame, I confirmed that the construct should produce the intended mini-spidroin-like protein.
Technique 2: Protein Purification
Protein purification is essential because wet-spinning requires a reasonably pure and concentrated protein solution. The construct includes a C-terminal 6xHis tag, which allows purification using nickel affinity chromatography. In this method, the His-tagged protein binds to nickel resin while many other bacterial proteins are washed away.
This technique is useful for the final project because the fiber should be made mainly from the designed protein, not from a random mixture of bacterial proteins. Purification also makes downstream concentration and spinning more controlled. If the protein is successfully expressed, SDS-PAGE can be used to check whether the elution fraction contains an enriched band near the expected size.
Relevant Companies
Relevant companies include:
Twist Bioscience, because the project depends on synthetic DNA ordering and gene construction.
Asimov / Kernel, because the project involves designing genetic parts and expression systems.
Bolt / Bolt.bio, because it has worked on bioengineered spider-silk-inspired materials.
Opentrons, because future versions of this workflow could automate liquid handling steps such as transformations, purification setup, or screening.
Thermo Fisher Scientific, because many reagents, purification tools, and lab instruments for this workflow could come from them.
Millipore Sigma, because protein purification, concentration, and molecular biology reagents are directly relevant to the planned workflow.
Waters Corporation, because future material or protein analysis could involve analytical chemistry tools for characterizing purified protein or process outputs.
SECTION 5: RESULTS AND QUANTITATIVE EXPECTATIONS
1. What Was Actually Validated
Because the final DNA construct and wet-lab materials were not available in time, this project did not reach the stage of protein expression, purification, or fiber spinning. The completed result is therefore not a physical spider silk fiber, but a validated design package for producing one in a future experiment.
The main validated output was the 476 bp mini-spidroin DNA construct. Using Benchling, I checked that the construct contains the expected functional parts: promoter, RBS, coding region, C-terminal 6xHis tag, and stop codons. I also translated the sequence from the first ATG and confirmed that it produces a continuous 146 amino acid protein with no premature stop codons before the His tag.
This matters because several common design failures would have made the construct unusable. A frameshift, early stop codon, missing His tag, or incorrect reading frame would prevent the planned protein from being produced or purified correctly. The design passed these basic checks, so it is reasonable to move forward to expression testing once the DNA is available.
2. Key Quantitative Values
Feature
Value
Why it matters
DNA construct length
476 bp
Confirms the expected construct size
Protein length
146 amino acids
Defines the size of the mini-spidroin-like protein
Expected molecular weight
approximately 11.7 kDa
Predicts where the protein should appear on SDS-PAGE
Purification tag
C-terminal 6xHis
Enables nickel affinity purification
Stop codons
TAA TAA
Terminates translation after the His tag
Expected SDS-PAGE band
near 12 kDa
Main protein-level validation target
Current validation stage
design validation
No claim of completed expression or fiber formation
The expected molecular weight is approximately 11.7 kDa because the sequence is unusually rich in glycine and alanine, which are relatively small amino acids. This means the protein is lighter than a typical 146 amino acid protein. In a future SDS-PAGE gel, the most important expected result would be an induced band near 12 kDa that becomes enriched after His-tag purification.
3. Expected Experimental Results
If the full protocol were completed successfully, the first experimental checkpoint would be protein expression. After induction in a T7-based E. coli system, the induced sample should show a stronger band near 12 kDa than the uninduced sample. This would suggest that the mini-spidroin-like protein was produced after induction.
The second checkpoint would be solubility after cell lysis. If the protein is soluble, it should appear in the clarified supernatant after centrifugation. If it appears mostly in the pellet, that would suggest aggregation or inclusion body formation, and the expression conditions would need to be changed.
The third checkpoint would be purification. Because the protein contains a C-terminal 6xHis tag, it should bind to nickel resin and become enriched in the elution fraction. A successful purification result would show a clearer band near 12 kDa in the elution lane than in the flow-through or wash lanes.
The fourth checkpoint would be concentration. The purified protein would need to be concentrated into a spinning dope using centrifugal ultrafiltration. A successful concentration step would reduce sample volume while keeping the protein soluble and avoiding visible precipitation or clogging.
The final checkpoint would be fiber formation. A successful wet-spinning result would produce a continuous, handleable filament after extrusion into a coagulation bath. This would not automatically prove the fiber is strong, but it would show that the protein solution can transition from a liquid spinning dope into a solid material.
4. Expected SDS-PAGE Layout
A future SDS-PAGE gel should include these lanes:
Lane
Sample
Expected observation
1
Protein ladder
Size reference
2
Uninduced cells
Weak or absent band near 12 kDa
3
Induced cells
New or stronger band near 12 kDa
4
Soluble lysate
Shows whether protein remains soluble
5
Insoluble pellet
Shows whether protein aggregated
6
Nickel column flow-through
Protein should be reduced if binding worked
7
Wash fraction
Removes weakly bound proteins
8
Elution fraction
Enriched band near 12 kDa if purification worked
This gel would be more informative than a single purified sample because it would show where the protein goes at each stage. It would help answer whether the problem is expression, solubility, purification, or yield.
5. Success Criteria
The future experiment would be considered successful at the protein-design level if the induced E. coli sample shows a band near 12 kDa and the nickel affinity elution fraction is enriched for that same band. This would support the claim that the designed mini-spidroin-like protein was expressed and purified.
The experiment would be considered successful at the material-formation level if the concentrated protein solution can be extruded into a coagulation bath and collected as a continuous fiber. The first fiber does not need to be high-performance to be useful. Even a weak but continuous fiber would validate the next stage of the workflow and create a starting point for optimization.
The experiment would be considered successful at the application-testing level only if the fiber can be dried, handled, mounted under mild tension, and tested mechanically or acoustically. Since this stage was not reached, the current report should not claim that the material functions as a musical string.
6. Likely Failure Modes and What They Would Mean
One possible failure mode is no visible band near 12 kDa after induction. This would suggest poor expression, incorrect induction conditions, or a problem with the expression plasmid or host strain.
Another possible failure mode is that the protein appears mainly in the insoluble pellet after lysis. This would suggest aggregation or inclusion body formation. In that case, future optimization could test lower induction temperature, shorter induction time, weaker induction, or different buffer conditions.
A third possible failure mode is that the protein expresses but does not purify well. This could happen if the His tag is inaccessible, if the protein degrades, or if binding conditions are not compatible. In that case, the purification buffer, imidazole concentration, or tag placement could be optimized.
A fourth possible failure mode is aggregation during concentration. This is important because wet-spinning requires a concentrated protein solution, but over-concentration can cause precipitation. Future work would need to test concentration limits and buffer conditions before spinning.
A fifth possible failure mode is failure to form a continuous fiber. This would not necessarily mean the DNA design failed. It could mean the spinning conditions need optimization, such as protein concentration, needle diameter, extrusion speed, coagulation bath composition, or draw ratio.
7. What This Result Means
The current result should be interpreted as a design-validated recombinant silk workflow, not a completed spider silk material. The project successfully defines what protein should be made, how it should be purified, what molecular weight should be expected, and what future experimental checkpoints should be used. This is a useful stage because it reduces uncertainty before the wet-lab work begins.
The next experimental milestone would be to obtain the DNA construct, express it in a T7-compatible E. coli strain, and run the SDS-PAGE validation workflow. If the expected 12 kDa band appears and can be purified, the project can move to protein concentration and wet-spinning. If not, the SDS-PAGE lane pattern would help identify which step needs redesign.
SECTION 6: ADDITIONAL INFORMATION
References:
Xu, M., and Lewis, R. V. (1990). Structure of a protein superfiber: spider dragline silk. Proceedings of the National Academy of Sciences, 87(18), 7120-7124. https://doi.org/10.1073/pnas.87.18.7120
Tokareva, O., Michalczechen-Lacerda, V. A., Rech, E. L., and Kaplan, D. L. (2013). Recombinant DNA production of spider silk proteins. Microbial Biotechnology, 6(6), 651-663. https://doi.org/10.1111/1751-7915.12081
Teulé, F., Cooper, A. R., Furin, W. A., Bittencourt, D., Rech, E. L., Brooks, A., and Lewis, R. V. (2009). A protocol for the production of recombinant spider silk-like proteins for artificial fiber spinning. Nature Protocols, 4, 341-355. https://doi.org/10.1038/nprot.2008.250
Rising, A., and Johansson, J. (2015). Toward spinning artificial spider silk. Nature Chemical Biology, 11, 309-315. https://doi.org/10.1038/nchembio.1789
Benchling. Sequence analysis and annotation tools. Used for DNA construct annotation, open reading frame verification, and translated protein sequence analysis. https://www.benchling.com/
HTGAA 2026 course materials and final project guidelines. Used for project structure, required sections, technique checklist, and documentation expectations.
Supply List and Budget
Item
Purpose
Estimated Cost
Synthetic DNA construct
Encodes mini-spidroin design
$80
Expression plasmid or cloning service
Holds gene in expression context
$50 to $150
E. coli BL21(DE3) or similar strain
Protein expression host
$80
LB or TB media
Cell growth
$30 to $60
Antibiotic selection reagent
Maintains plasmid
$20 to $50
IPTG or induction reagent
Induces expression
$40 to $80
Lysis buffer reagents
Protein extraction
$30 to $60
Nickel affinity resin or column
His-tag purification
$100 to $150
SDS-PAGE gel and ladder
Protein validation
$50 to $100
Centrifugal protein concentrators
Alternative to SpeedVac
$50 to $120
Syringes, needles, tubing
Wet-spinning setup
$30 to $60
Isopropanol or coagulation bath chemicals
Fiber formation
$20 to $50
Estimated total: $500 to $1000, depending on what is already available in the lab.
Figure X. More Lab Images.
FINAL SUMMARY
Overall, this project reached the design-validation stage of recombinant spider silk engineering as the DNA shipping was extremely delayed and hasn’t arrived yet. The 476 bp construct was shown to contain the intended expression architecture and to encode a continuous 146 amino acid mini-spidroin-like protein with a C-terminal 6xHis tag and an expected molecular weight of approximately 11.7 kDa. Although delayed materials prevented full wet-lab execution, the project produced a coherent DNA design, a justified protein sequence, a purification strategy, an alternative concentration protocol without SpeedVac, and a complete future workflow for spinning and testing recombinant silk fibers.
The musical string application gives one concrete direction for future testing, but the broader contribution is a tunable biomaterial platform based on engineered spider silk.