Waters
Photos
Lab Overview
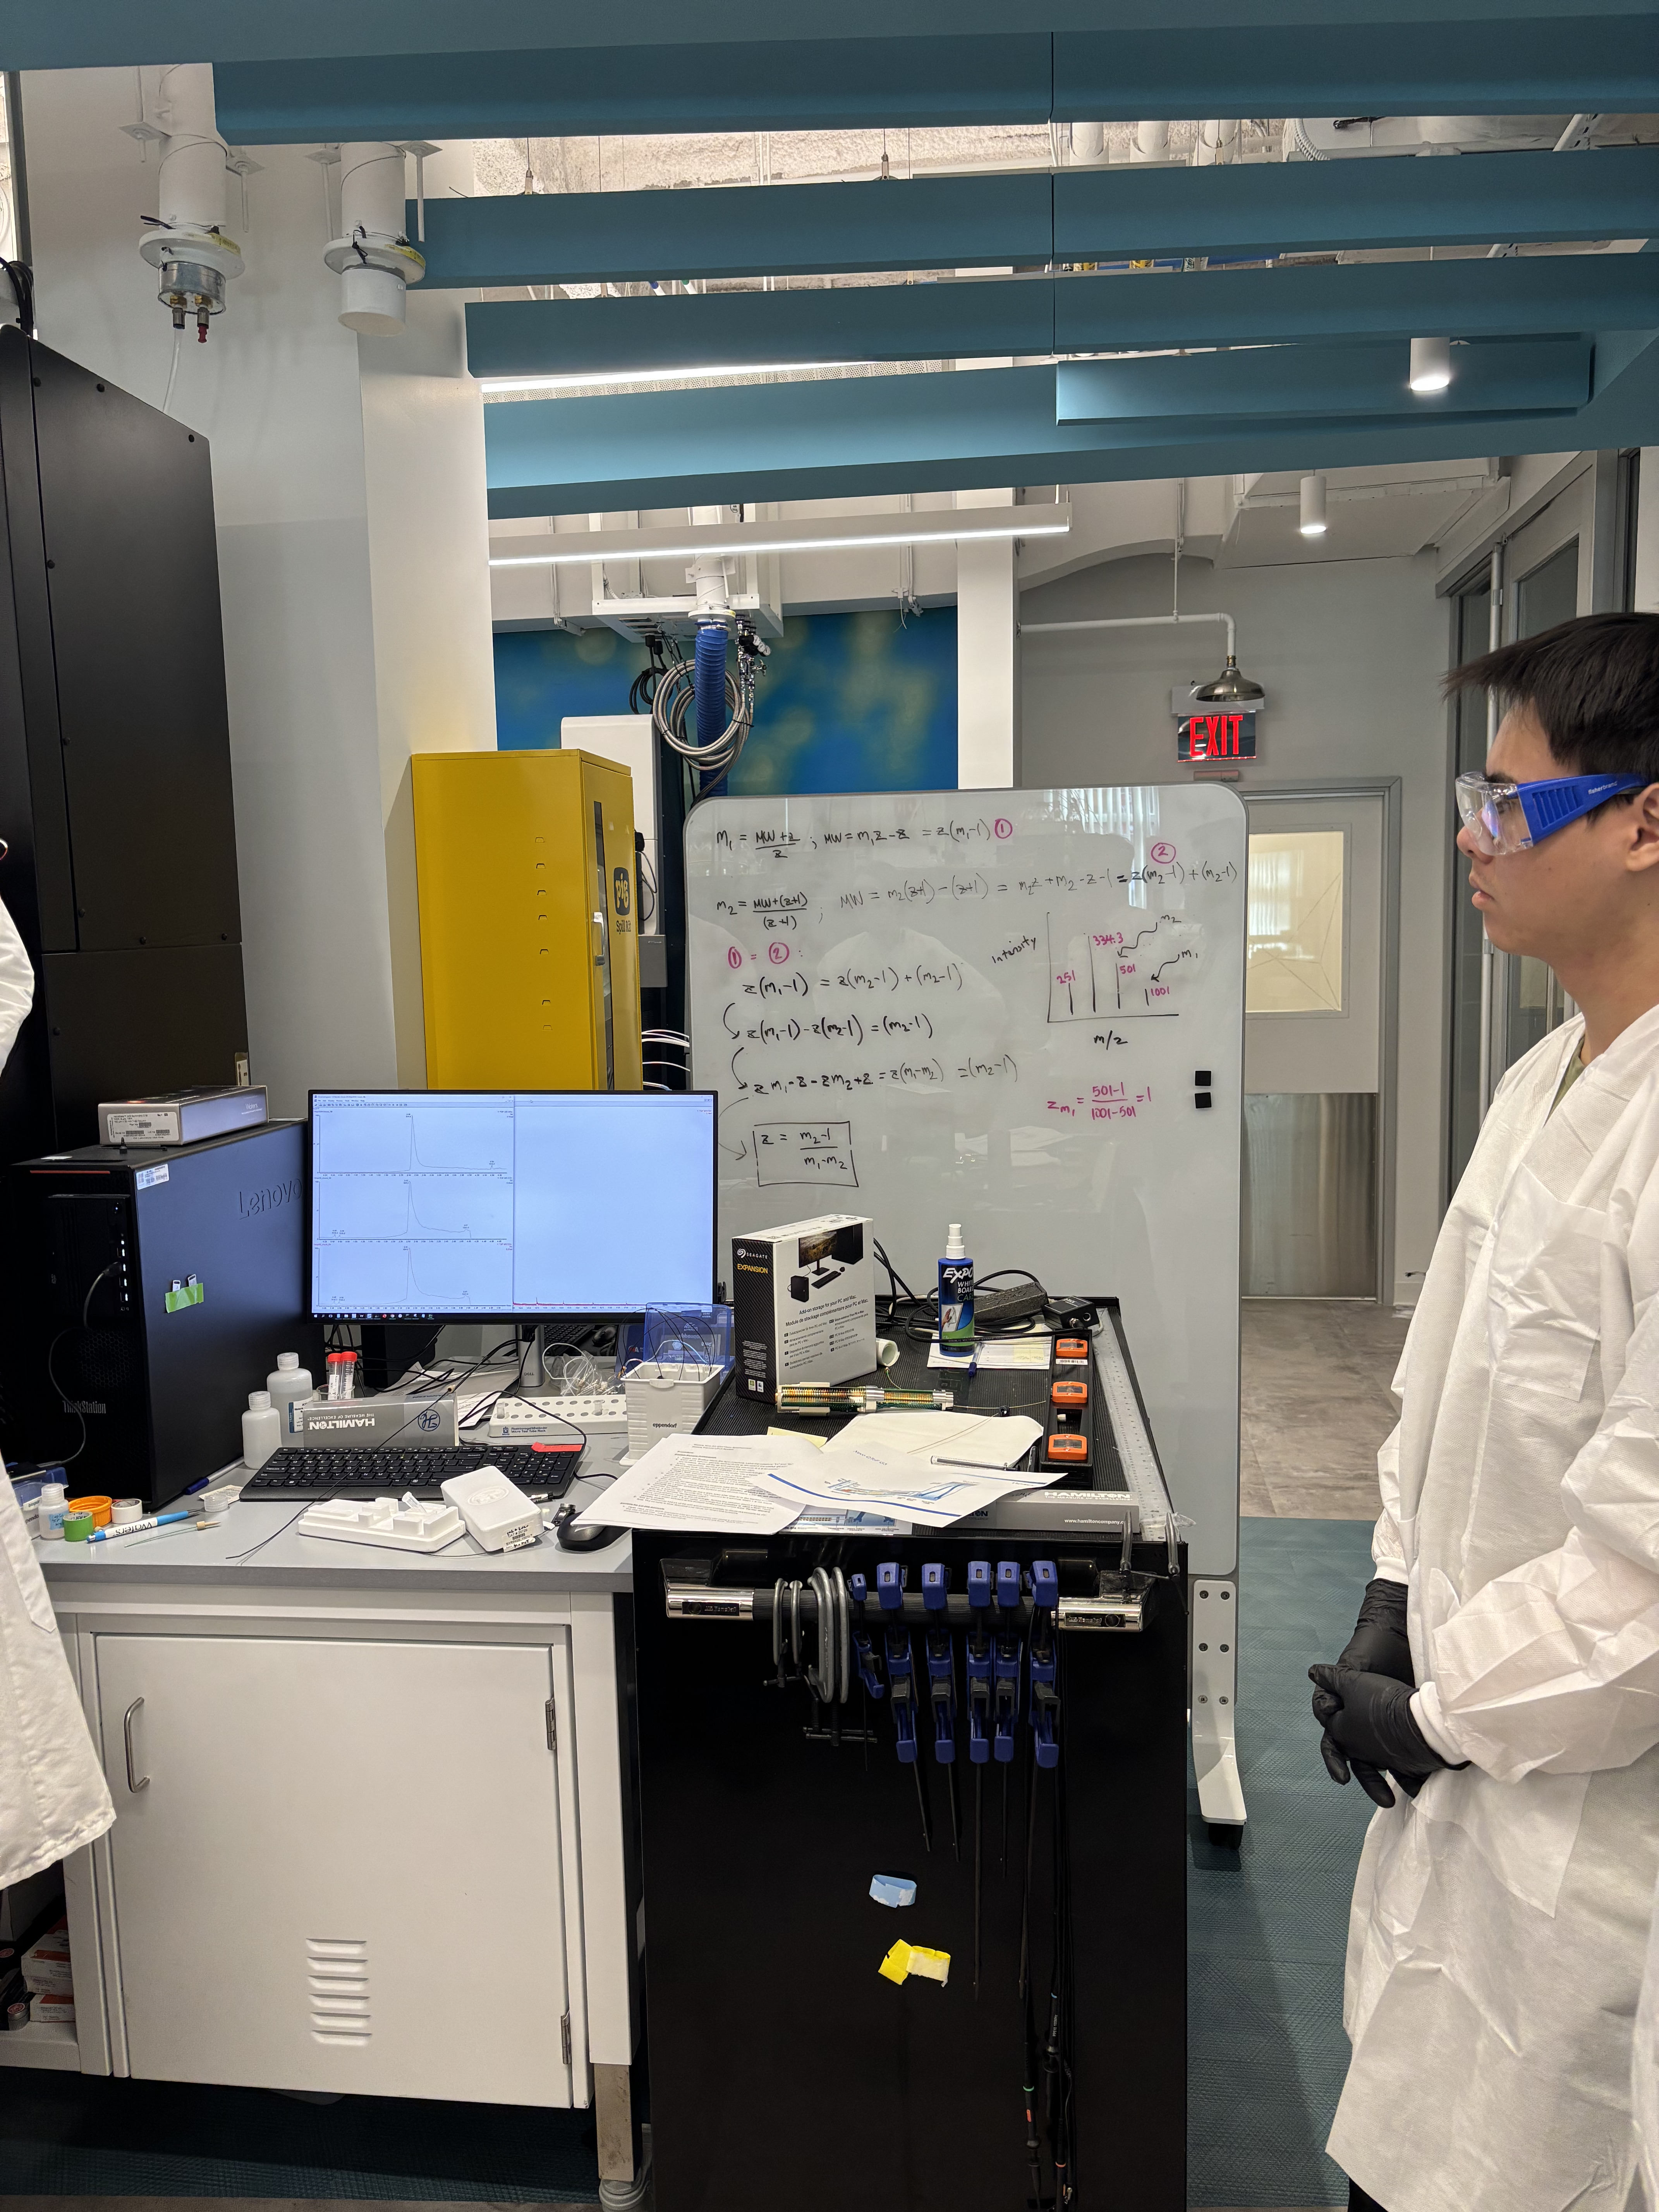
This lab introduced us to mass spectrometry as a way to identify and measure molecules in a sample. The course page lists this as the Week 10 Mass Spectrometry lab, under the broader theme of advanced imaging and measurement technology.
The main idea of the lab was to understand the full measurement pipeline, not just the final spectrum. A sample has to be prepared, placed in the correct position, associated with the correct software method, run through the instrument, and then analyzed from the output data.
Protocol Understanding
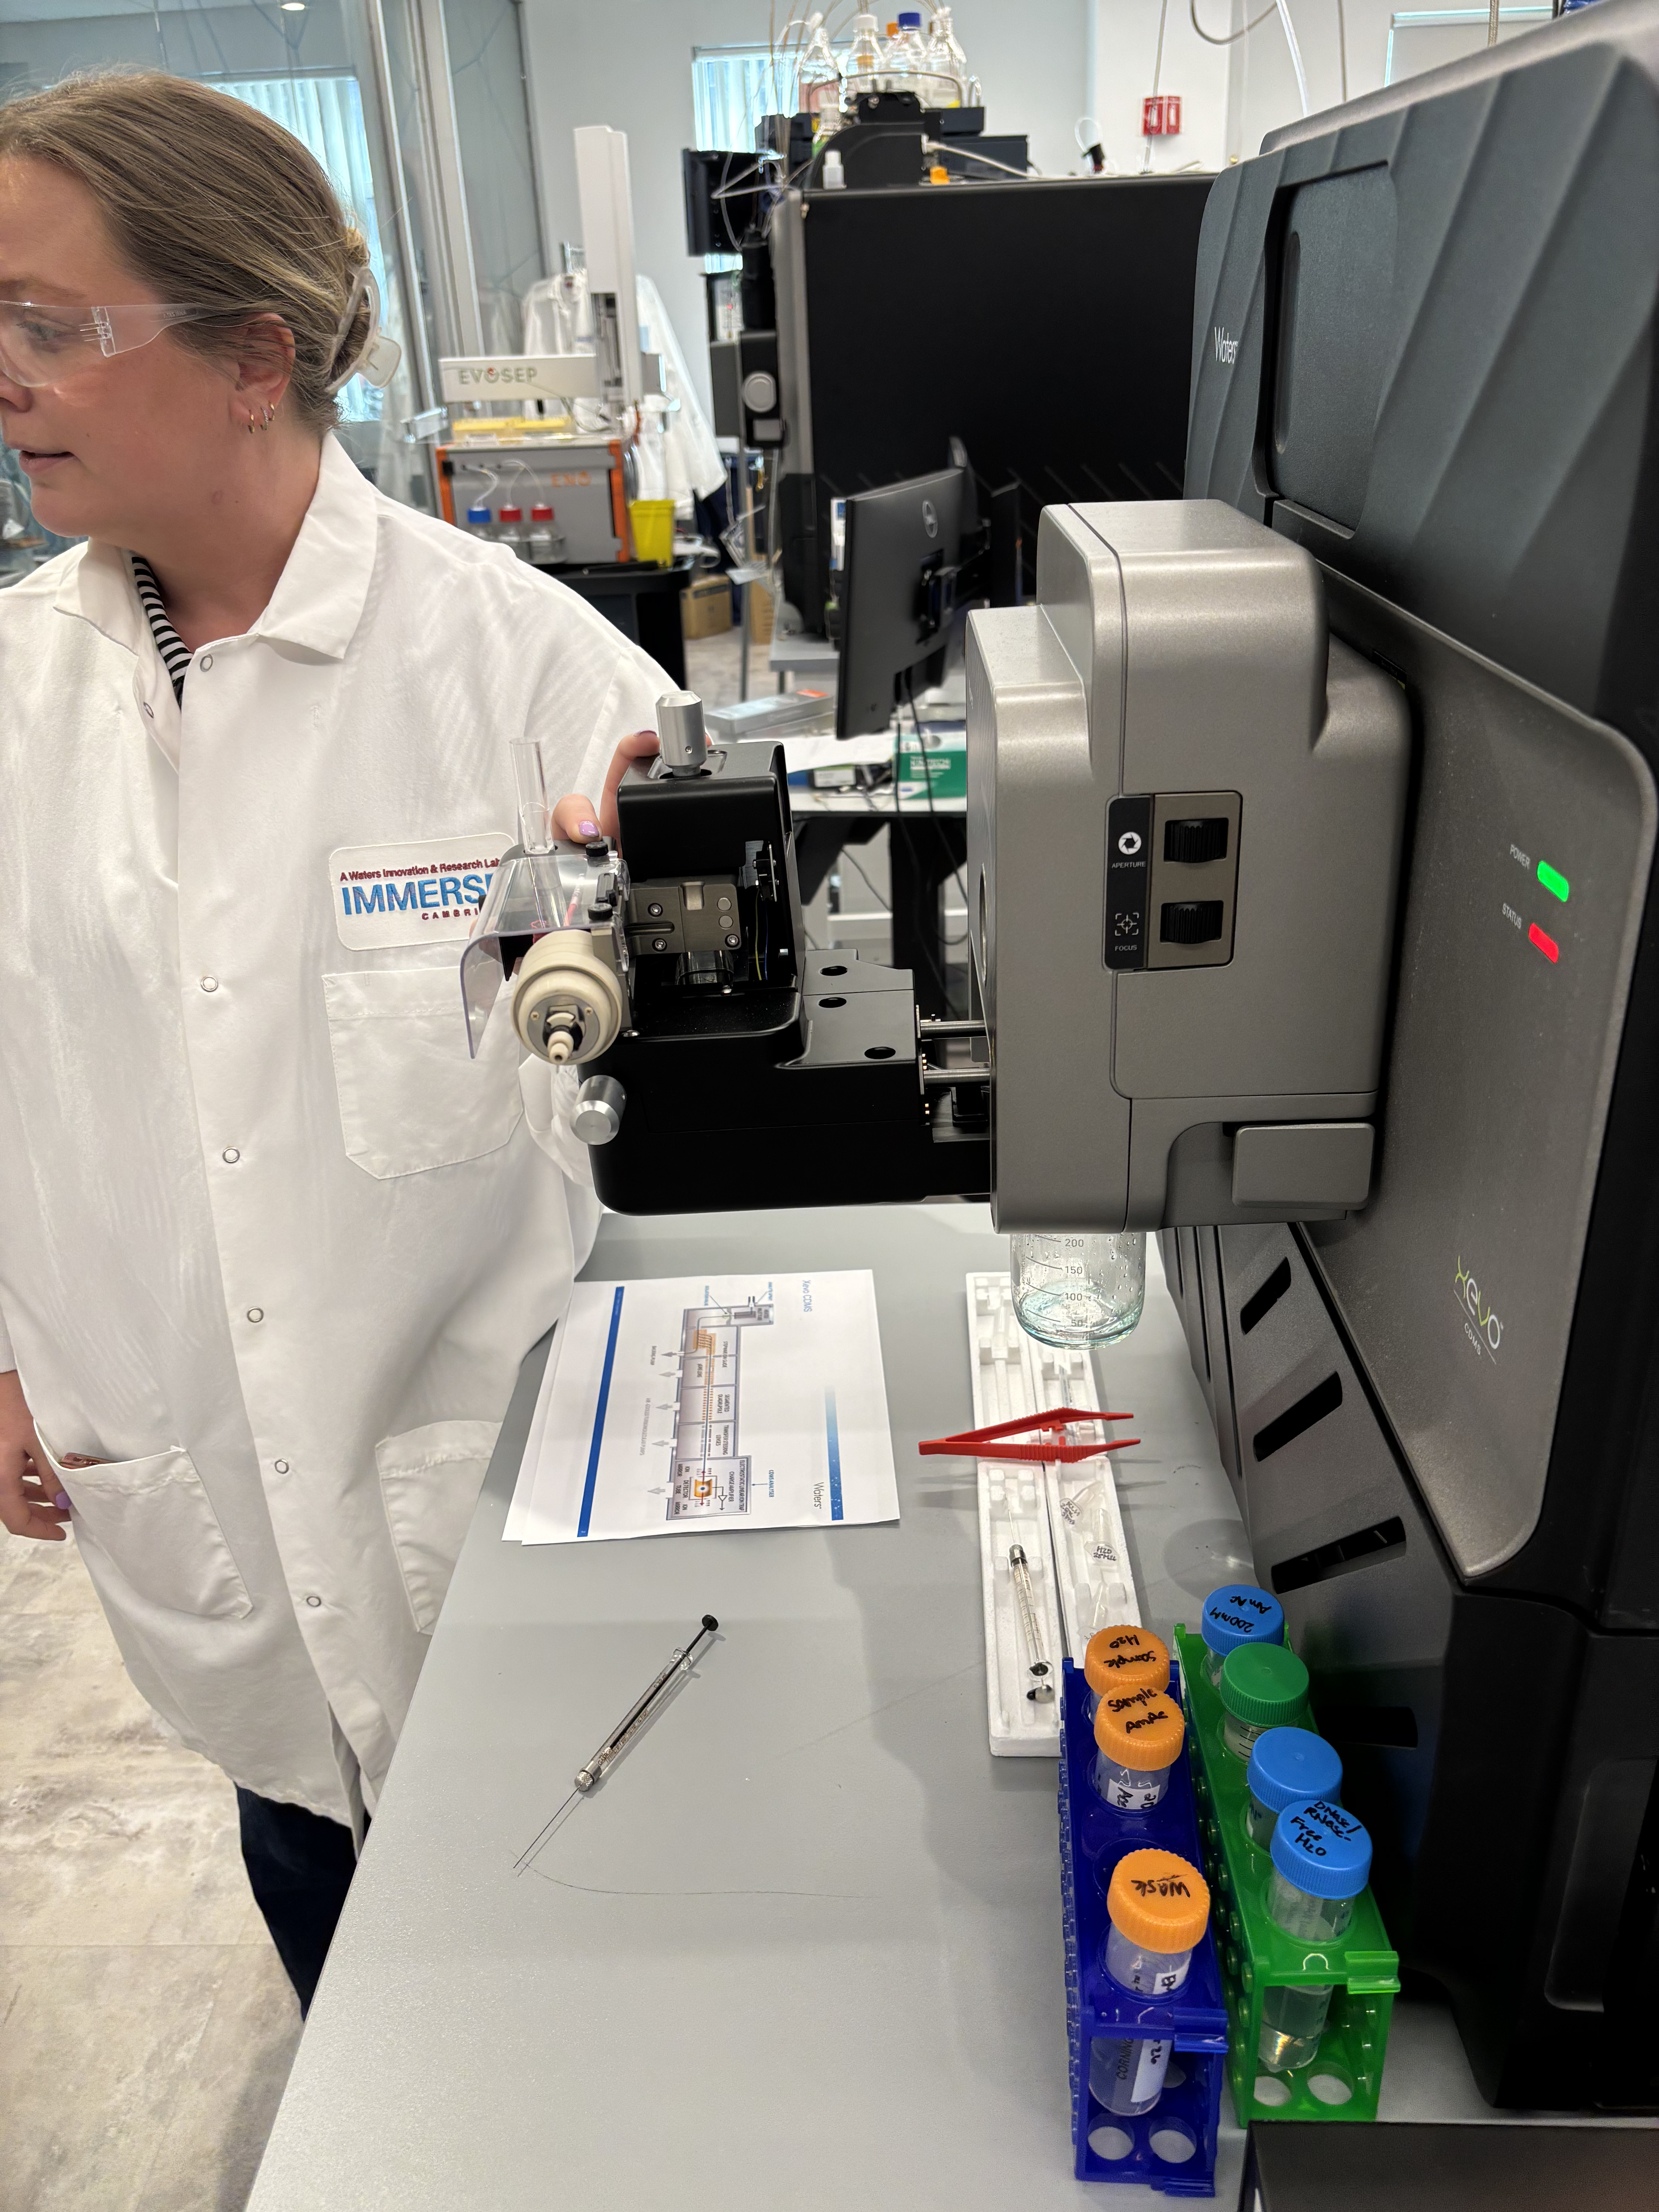
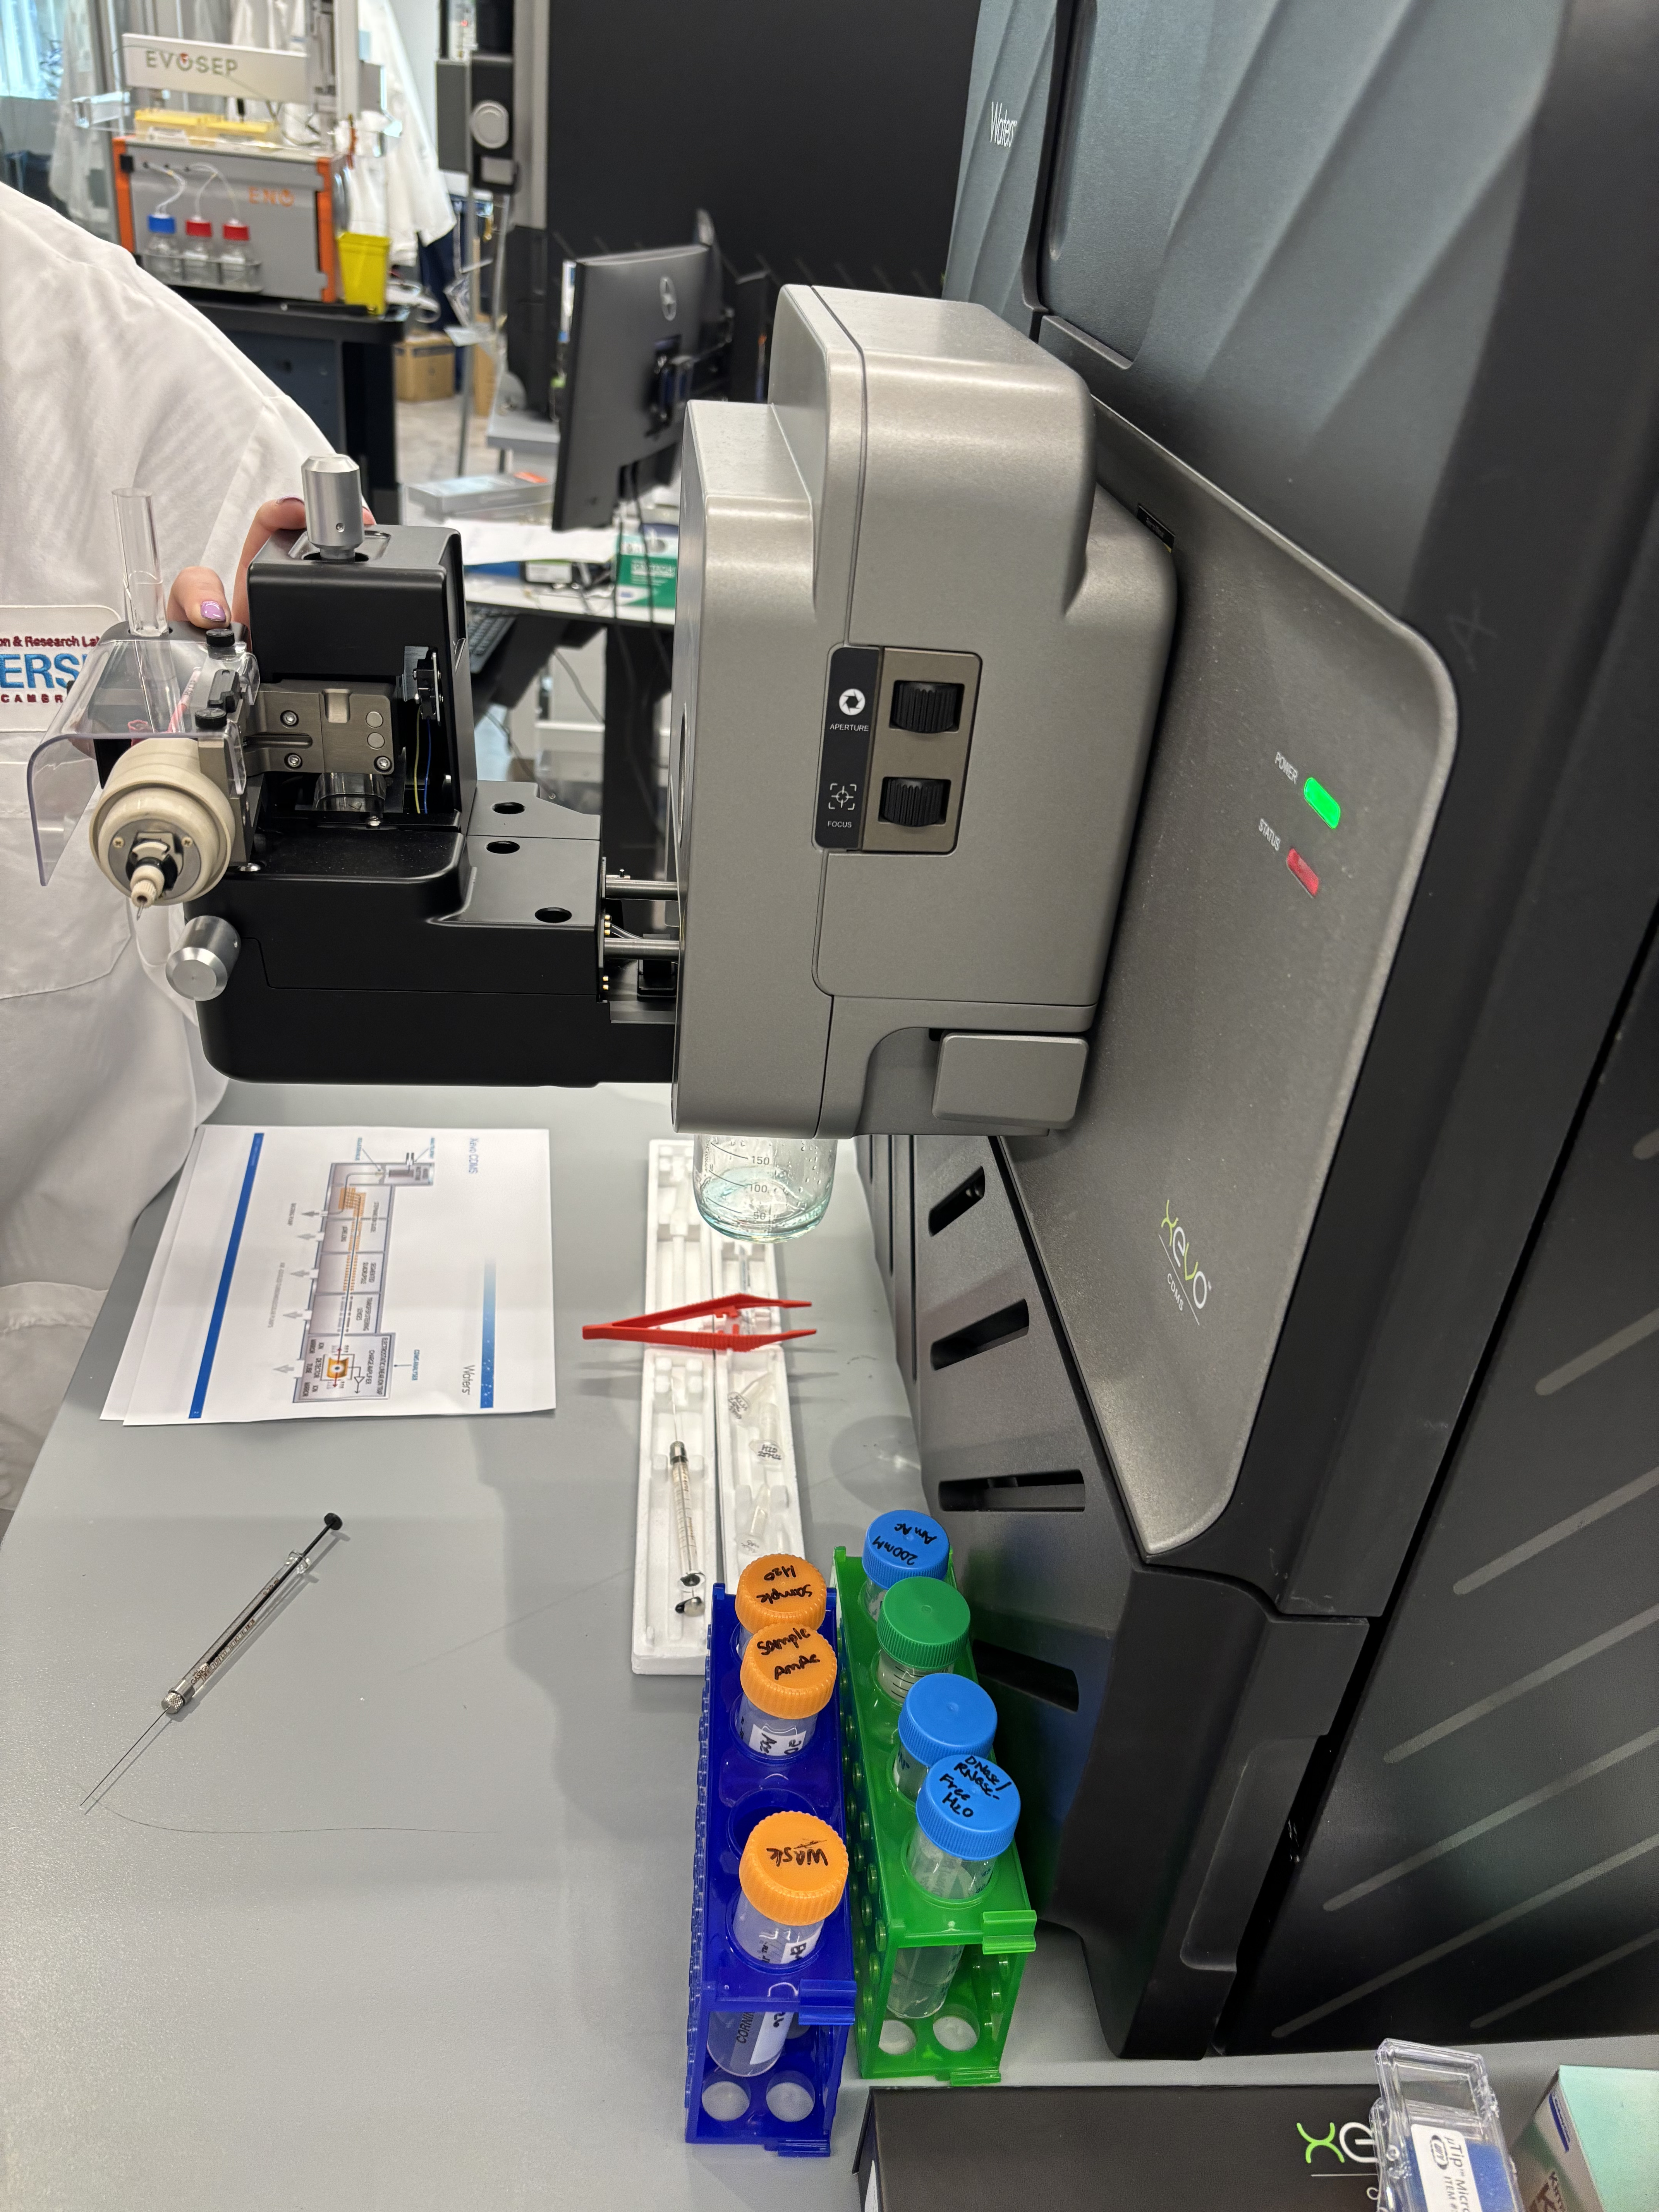
The workflow started with organizing the samples and making sure each tube or vial corresponded to the correct entry in the software. This is a small but important part of the protocol because the instrument can run multiple samples automatically. If the physical sample position and the software sample list do not match, the data can be assigned to the wrong sample.
In a typical Waters LC-MS workflow, the sample is injected into a liquid chromatography system. The liquid solvent carries the sample through the column, where different molecules separate based on how they interact with the column material and solvent conditions. This means molecules do not all reach the mass spectrometer at the same time.
After separation, the sample enters the ionization source. The molecules are converted into ions so that they can be manipulated and detected by the mass spectrometer. The instrument then separates ions by mass-to-charge ratio, usually written as m/z. The detector records signals at different m/z values, producing peaks that can be viewed in the software.
What Was Done
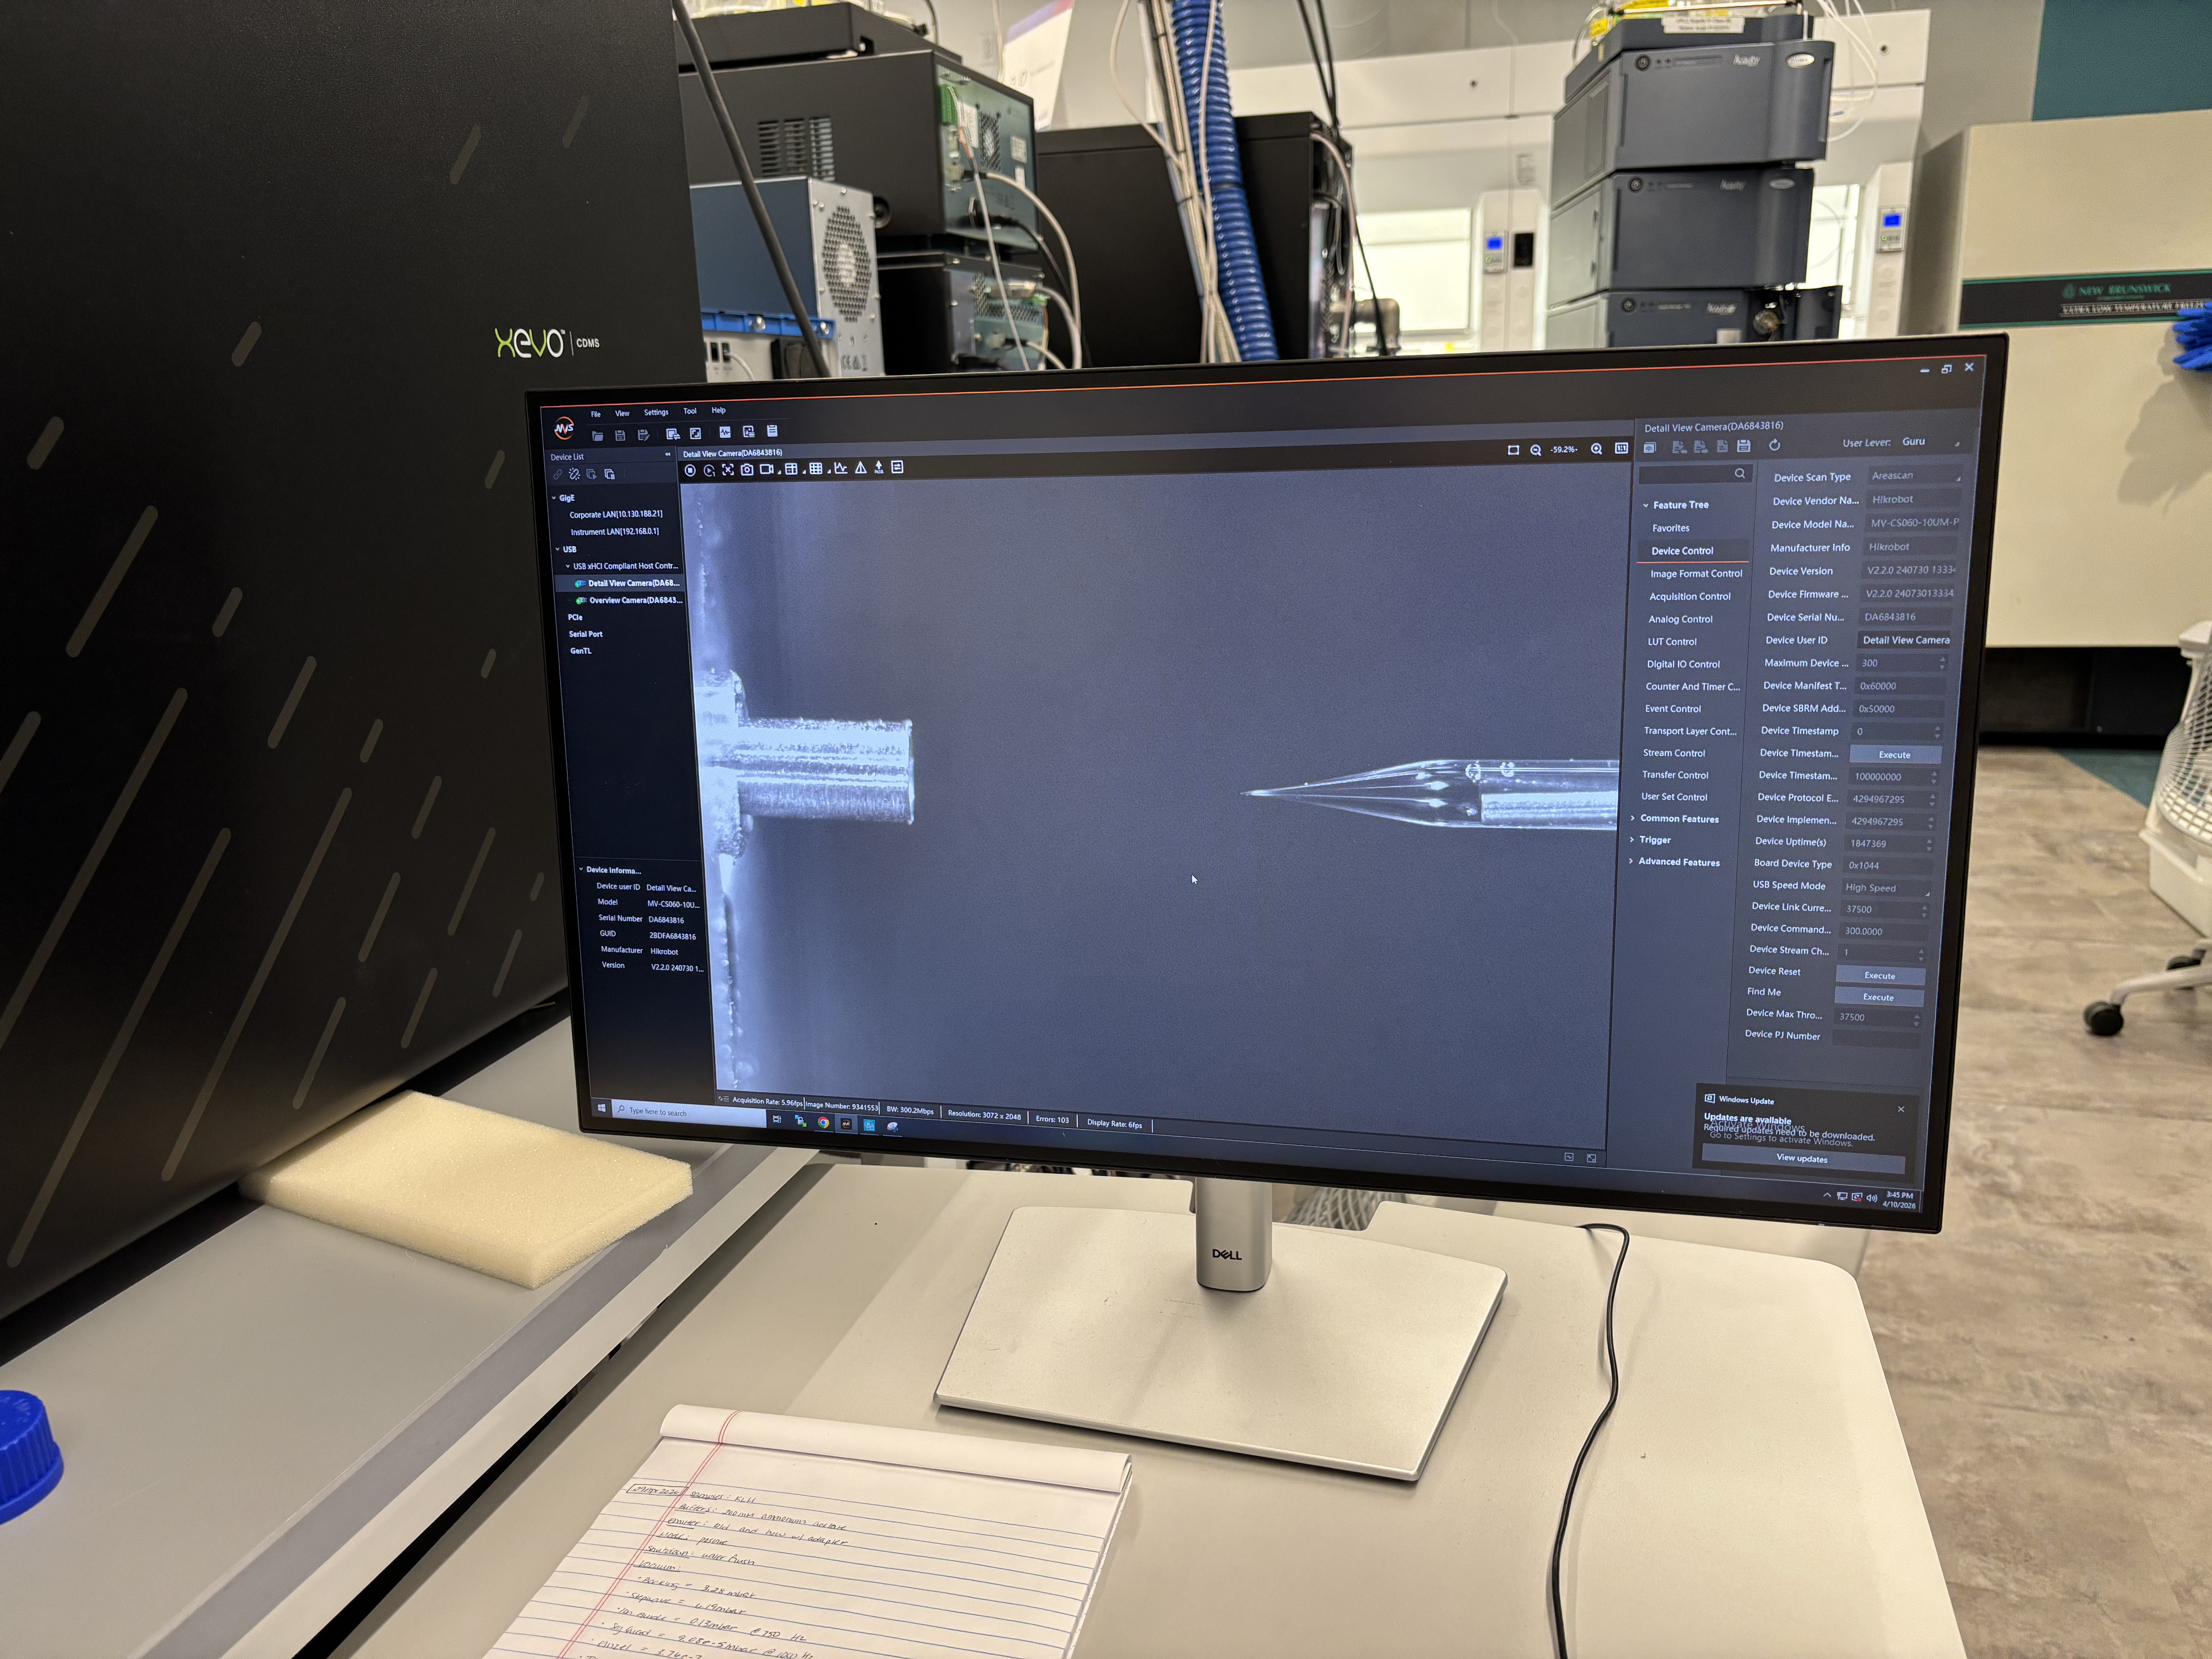
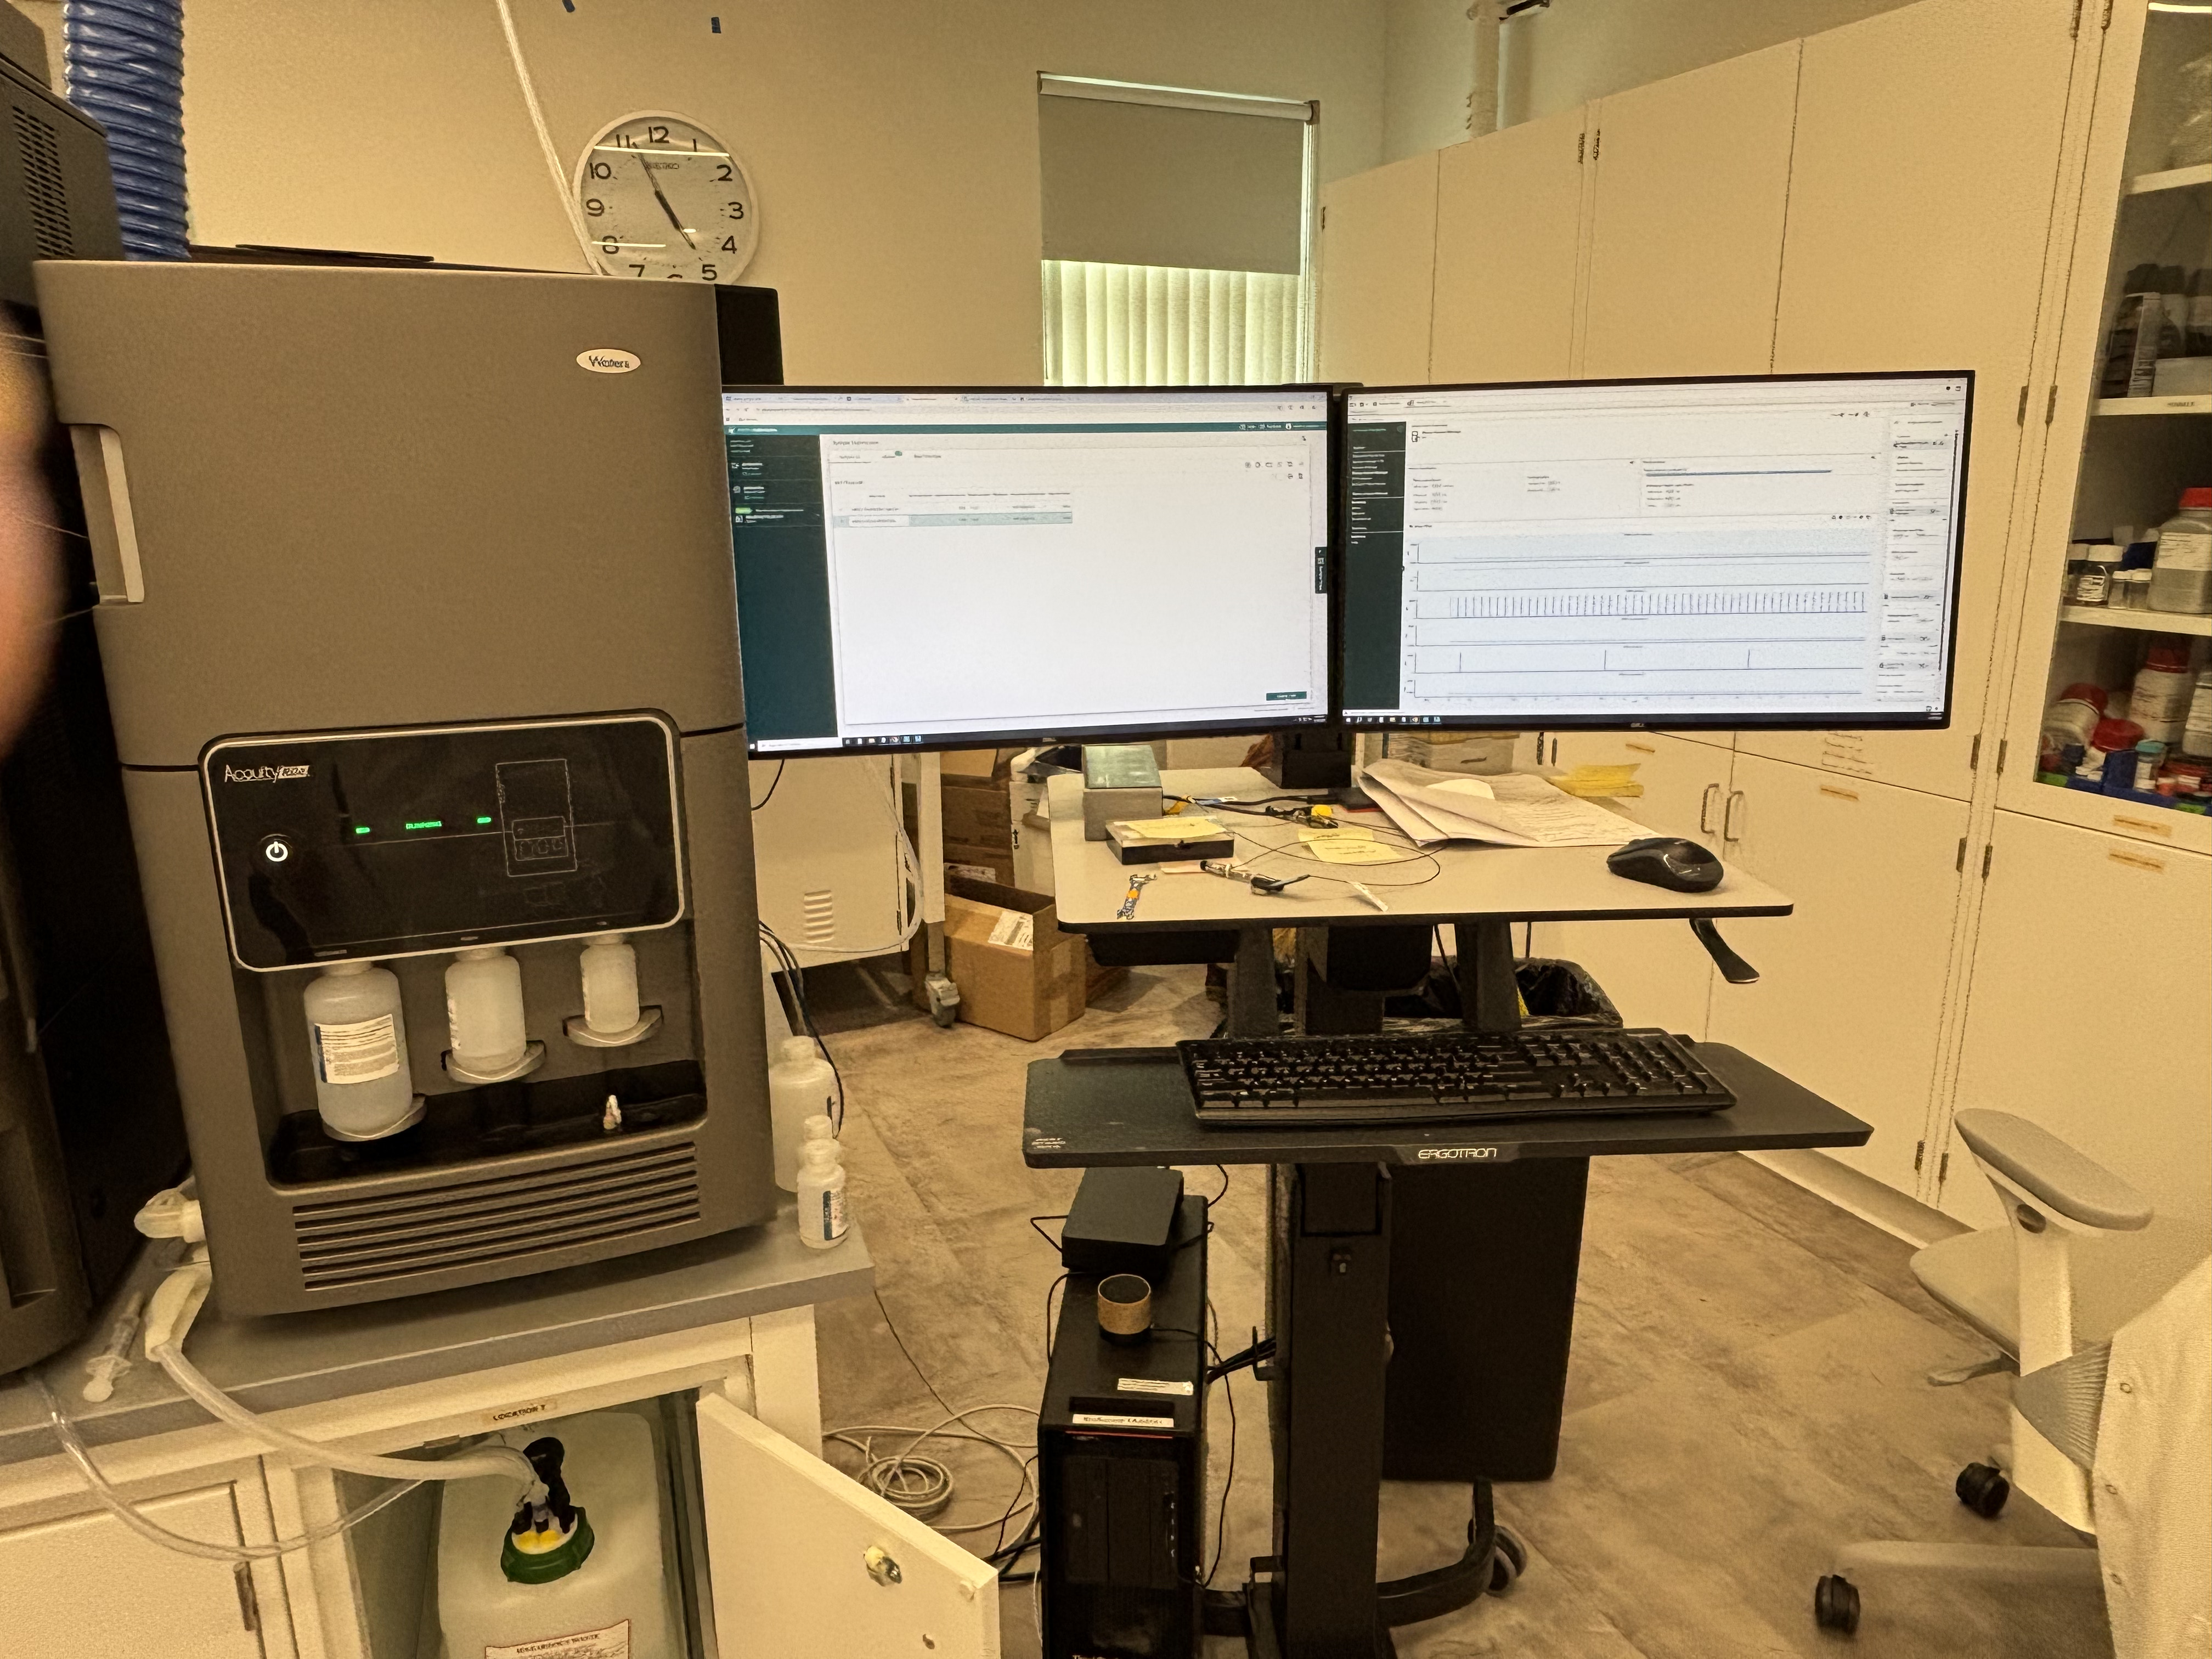
In the lab, we observed the Waters instrument setup and how samples are prepared and loaded for analysis. The sample racks and tubes had to be organized carefully so that the correct sample was associated with the correct run. We also looked at the computer interface used to control the instrument and view the output.
The instrument method controls details such as the sample injection, run duration, solvent conditions, and detector settings. Once the run begins, the system automatically moves the sample through the measurement pipeline. The resulting data can include chromatograms, which show signal over time, and spectra, which show signal across mass-to-charge ratios.
Data Interpretation
The output of mass spectrometry is not a simple visual result like a colony plate or gel band. Instead, the result is a set of peaks. The position of a peak can help identify a molecule or fragment, while the intensity of the peak gives information about how strong that signal is.
A key thing I learned is that mass spectrometry data requires interpretation. Some peaks may correspond to the molecule of interest, while others can come from fragments, contaminants, solvent, background signal, or noise. This makes the software and analysis step a core part of the protocol.
Reflection
This lab helped me understand mass spectrometry as a bridge between wet-lab sample handling and computational analysis. The physical work involves preparing, labeling, and loading samples, but the final result depends on interpreting instrument data.
The most useful part was seeing the complete pipeline. The instrument can produce very precise measurements, but the quality of the result still depends on good sample organization, correct method setup, and careful interpretation. Even though I did not independently operate the full instrument myself, this lab made the role of mass spectrometry much clearer. It is useful when we need detailed information about what molecules are present in a sample, rather than just whether an experiment visibly worked.