Week 6 HW: Genetic Circuits Part I — Assembly Technologies
Week 6 — Genetic Circuits Part I: Assembly Technologies
Assignment: DNA Assembly
1. What are some components in the Phusion High-Fidelity PCR Master Mix and what is their purpose?
In this week’s protocol, the PCR reactions are assembled using Phusion HF PCR Mix (2X) together with template plasmid, forward primer, reverse primer, and nuclease-free water. The role of the master mix is to provide the core PCR chemistry in a convenient premixed format, while the user adds the sequence-specific primers and DNA template separately.
Some key components typically found in a high-fidelity PCR master mix include:
- a high-fidelity DNA polymerase, which synthesizes new DNA strands with lower error rates than standard Taq polymerase
- dNTPs, which are the nucleotide building blocks used to extend the new DNA strands
- magnesium ions (Mg²⁺), which are required as cofactors for polymerase activity
- an optimized reaction buffer, which maintains pH, ionic strength, and enzyme performance
- stabilizing components that help preserve enzyme activity during thermocycling
The purpose of using a high-fidelity system in this lab is especially important because the PCR products are later used for Gibson Assembly, so sequence accuracy matters.
2. What are some factors that determine primer annealing temperature during PCR?
Primer annealing temperature is mainly determined by the melting temperature (Tm) of the primers. In practice, Tm depends on several sequence properties, including primer length, GC content, base composition, and whether there are mismatches or secondary structures such as hairpins or dimers.
According to the lab guidance, a good binding region is usually around 18–22 bp, with a target Tm of about 52–58 °C, and primer pairs should ideally be within 5 °C of each other. The protocol also recommends a modest GC clamp at the 3′ end, avoiding excessive G/C content in the final few bases. These features improve specific binding and reduce inefficient or nonspecific amplification.
In this specific cloning workflow, annealing temperature is also influenced by the fact that the primers contain two functional regions: a binding region to amplify the template and a 5′ overlap region used later for Gibson Assembly. The overlap helps with assembly, but the annealing behavior during PCR is mostly governed by the binding portion of the primer.
3. There are two methods from this class that create linear fragments of DNA: PCR, and restriction enzyme digests. Compare and contrast these two methods, both in terms of protocol as well as when one may be preferable to use over the other.
PCR and restriction enzyme digestion can both generate linear DNA fragments, but they do so in very different ways. PCR amplifies a defined region of DNA using primers, polymerase, nucleotides, and thermocycling. It is especially useful when you want to amplify a specific fragment, introduce mutations, add overlaps, or generate a fragment even when no convenient restriction sites are available.
In contrast, a restriction digest cuts DNA at pre-existing recognition sites using sequence-specific restriction enzymes. This is often simpler when the correct restriction sites already exist in the plasmid or insert and when you want a clean excision without introducing sequence changes. However, restriction digestion is constrained by the locations of those recognition sites and is less flexible than PCR for introducing new overlaps or mutations.
For this week’s Gibson workflow, PCR is particularly advantageous because it allows the experimenter to generate a backbone fragment and a color fragment while also incorporating sequence changes in the chromophore region through primer design. Restriction digestion is often preferable when the fragment boundaries are already defined by existing sites and no mutagenesis or custom overlap design is needed.
4. How can you ensure that the DNA sequences that you have digested and PCR-ed will be appropriate for Gibson cloning?
To be appropriate for Gibson cloning, the DNA fragments must have correctly designed overlapping ends so that adjacent fragments can anneal after exonuclease treatment. In this lab, the recommended overlap length is generally around 20–22 bp in the primer design guidance, while Gibson/HiFi assembly more broadly uses overlaps in the 20–40 bp range. The fragments must also be in the correct orientation and must cover the intended regions without missing or duplicating critical sequence.
It is also important to reduce background from the original plasmid template. The protocol therefore includes a DpnI digest after PCR, which selectively digests methylated parental plasmid DNA while leaving the newly amplified PCR products intact. After that, the fragments should be purified, quantified, and checked on a diagnostic gel to confirm the expected sizes.
Finally, Gibson reactions should be set up using an appropriate molar ratio, and this week’s lab recommends a 2:1 insert-to-vector ratio for efficient assembly. Good fragment quality, correct overlaps, proper concentration, and clean purification are all essential for successful cloning.
5. How does the plasmid DNA enter the E. coli cells during transformation?
In this lab, plasmid DNA enters E. coli through heat-shock transformation. First, chemically competent cells are thawed on ice, then mixed with the assembled DNA and kept on ice to allow the DNA to associate with the cell surface. The cells are then exposed briefly to 42 °C, which helps create a transient increase in membrane permeability, allowing plasmid DNA to enter.
After heat shock, the cells are returned to ice and then allowed to recover in SOC medium for about one hour. This recovery period helps the cells repair their membranes and begin expressing the antibiotic resistance marker carried by the plasmid. Finally, the cells are plated on selective agar, so only bacteria that received the plasmid can survive and form colonies.
6. Describe another assembly method in detail (such as Golden Gate Assembly)
A powerful alternative to Gibson Assembly is Golden Gate Assembly, which uses Type IIS restriction enzymes such as BsaI or BsmBI together with DNA ligase in a one-pot reaction. Unlike standard restriction enzymes, Type IIS enzymes cut outside of their recognition sequences, which allows the user to design custom overhangs that determine exactly how the DNA parts will assemble. During the reaction, the DNA is repeatedly digested and ligated, and correctly assembled products accumulate because the recognition sites are usually removed in the final construct. This makes Golden Gate especially useful for assembling multiple parts in a defined order with high efficiency. It is often preferred for modular cloning systems, standardized part libraries, and scar-minimized multi-fragment assembly workflows. Compared with Gibson, Golden Gate depends more strongly on careful restriction-site planning, but it can be extremely efficient for combinatorial and standardized DNA assembly workflows.
Golden Gate Assembly diagram
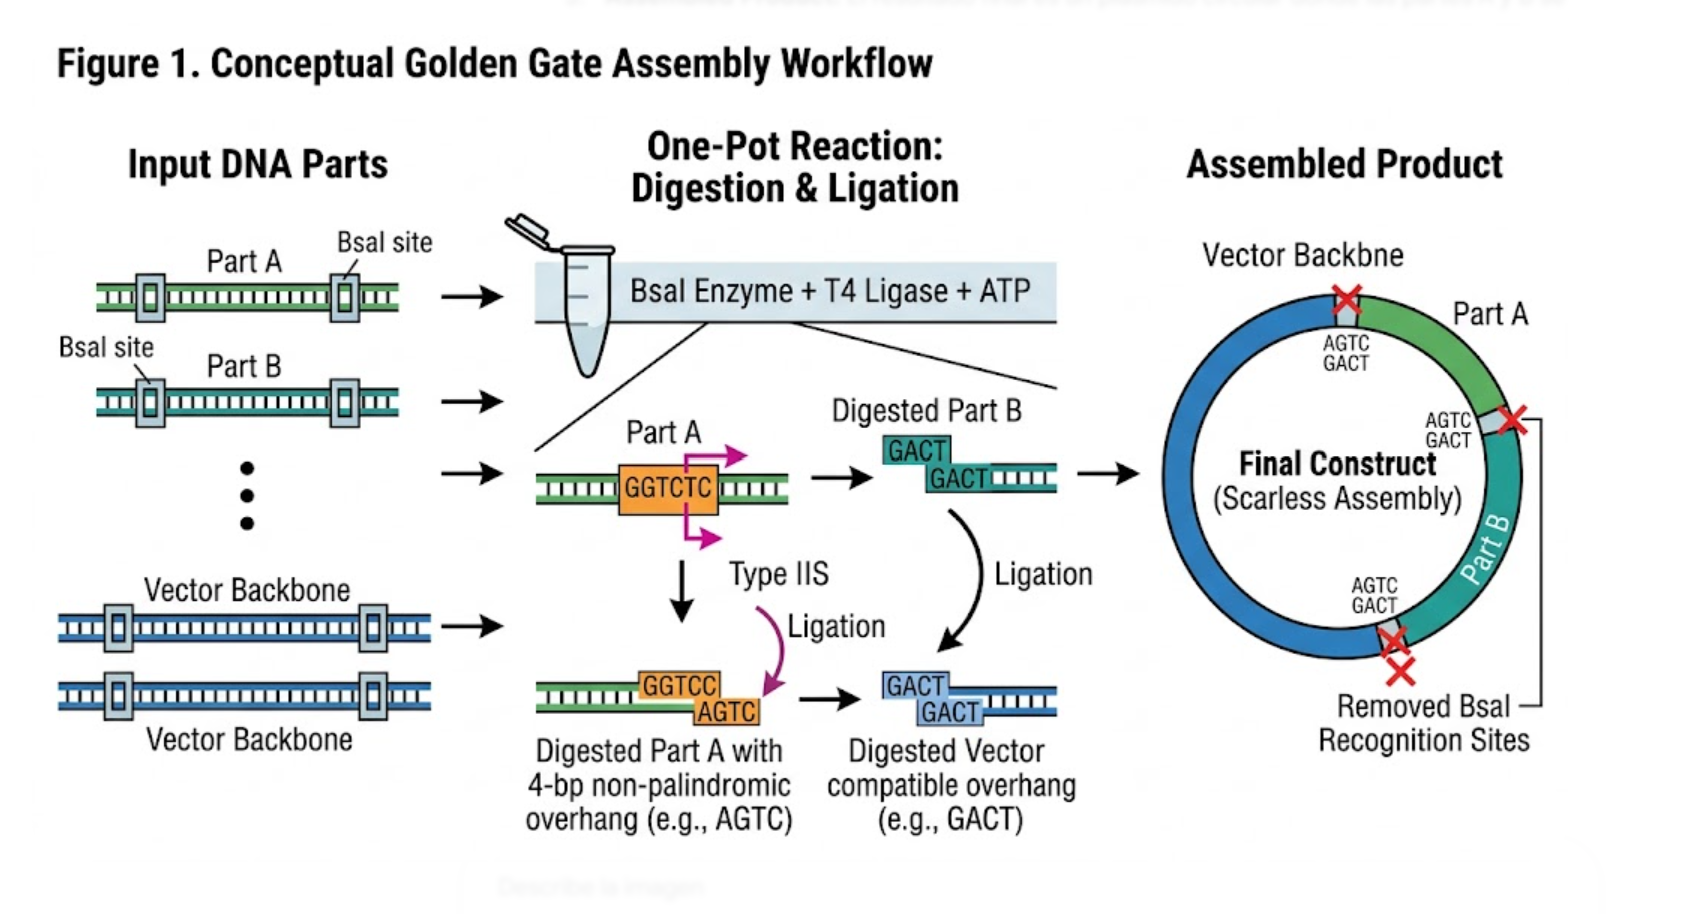
Figure 1. Conceptual Golden Gate Assembly workflow showing Type IIS digestion, custom overhang formation, and ligation into an ordered final construct.
Modeling Golden Gate Assembly in Benchling
To model Golden Gate Assembly in Benchling, I created a simple design with a plasmid backbone and two insert fragments containing Type IIS restriction sites at their boundaries. I annotated the BsaI sites, the expected cut positions, and the custom overhangs that would be exposed after digestion. I then verified that the designed overhangs were compatible only with the intended neighboring fragments, which ensures ordered ligation. This model illustrates the core Golden Gate logic: digestion outside the recognition site, programmable overhang creation, fragment annealing in a defined order, and loss of the restriction sites in the final assembled construct.
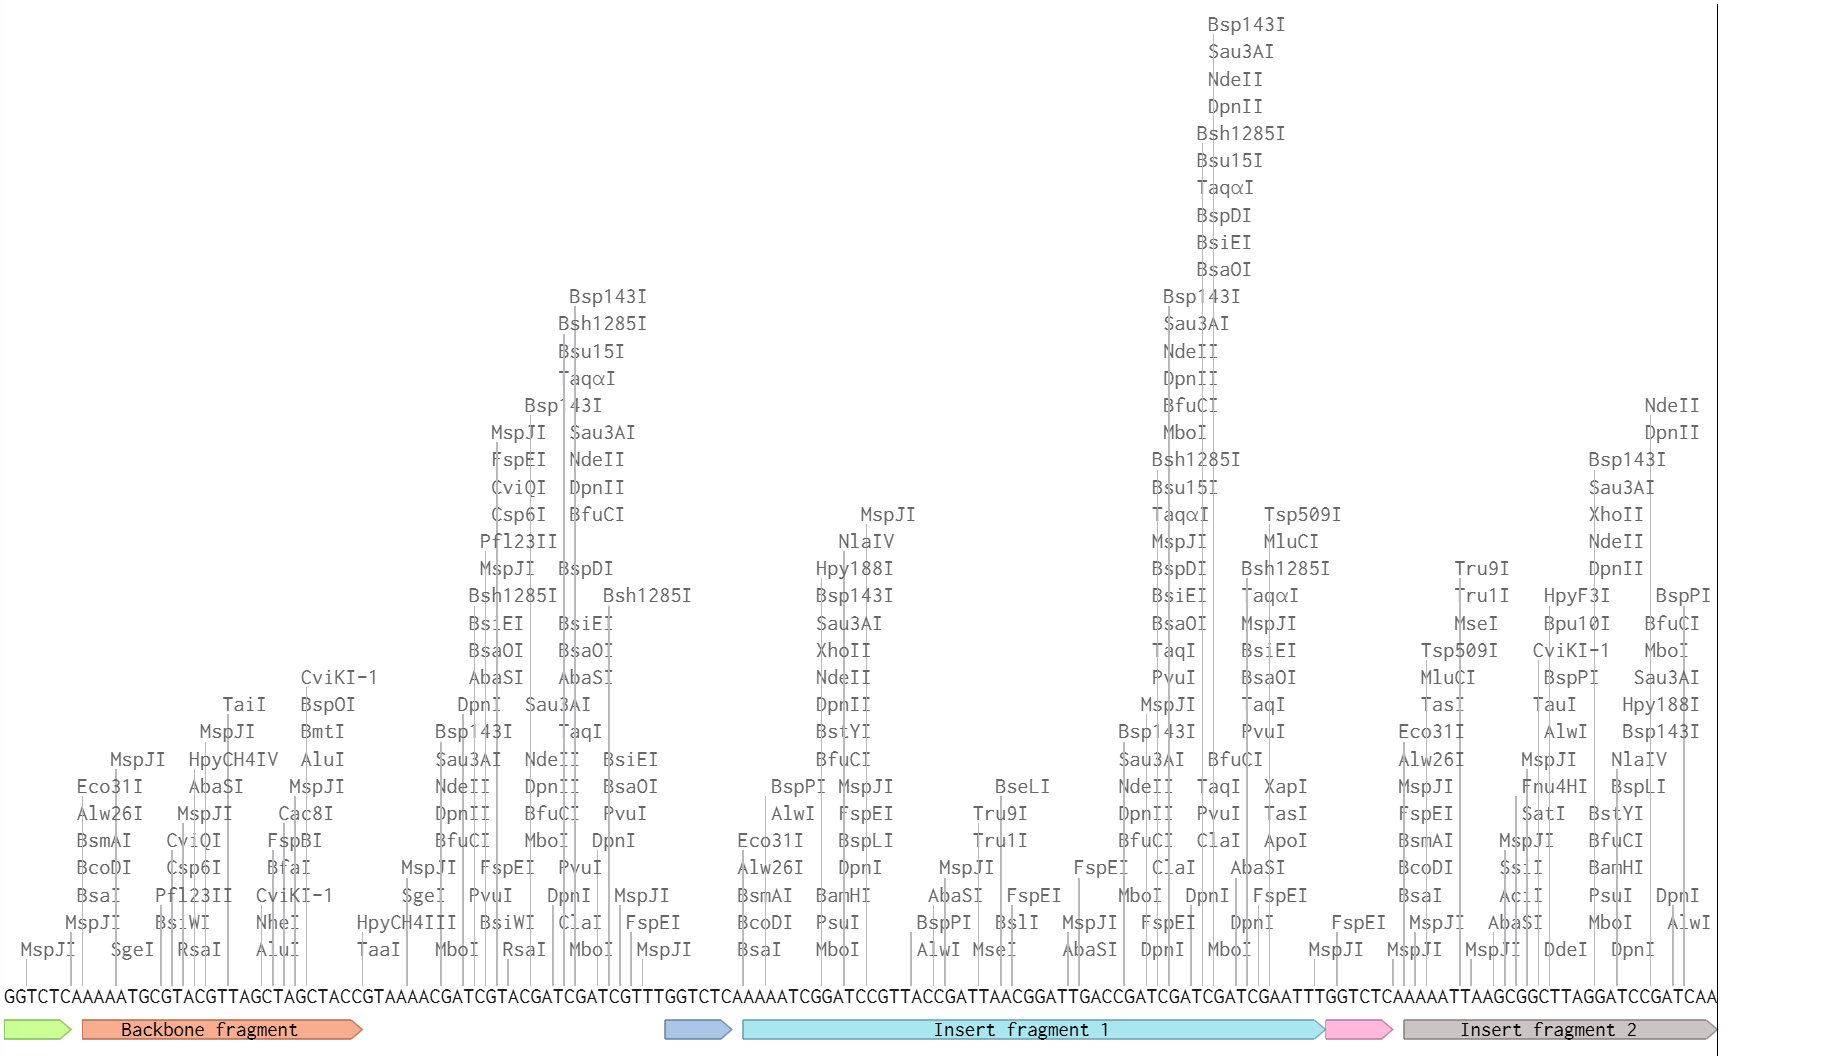
Figure 2. Benchling-based conceptual model of Golden Gate Assembly showing Type IIS sites, fragment boundaries, and directed overhang compatibility.
References
- HTGAA Spring 2026 — Week 6: Genetic Circuits Part I: Assembly Technologies.
- Updated: HTGAA 2026 Gibson Assembly Lab.
- NEB Gibson Assembly overview.
Assignment: Asimov Kernel
For the second part of Week 6, I used Asimov Kernel to explore the official Repressilator demo, recreate it in my own construct, and build three additional circuits to compare how different regulatory architectures affect simulated expression dynamics.
Repressilator demo
I opened the official Repressilator construct from the Bacterial Demos repository and ran the simulator.
Expected behavior
I expected oscillatory behavior because the circuit is based on cyclic repression among three regulators.
Observed behavior
The simulator showed a short initial transient phase followed by sustained periodic oscillations in both protein concentrations and RNA concentrations over time. The oscillations appeared stable after the first several hours, which is consistent with the expected behavior of a repressilator circuit.
Interpretation
The simulation matched my expectation. The results support the idea that a three-node cyclic repression network can generate oscillatory dynamics rather than converging to a simple steady state.
Repressilator recreation
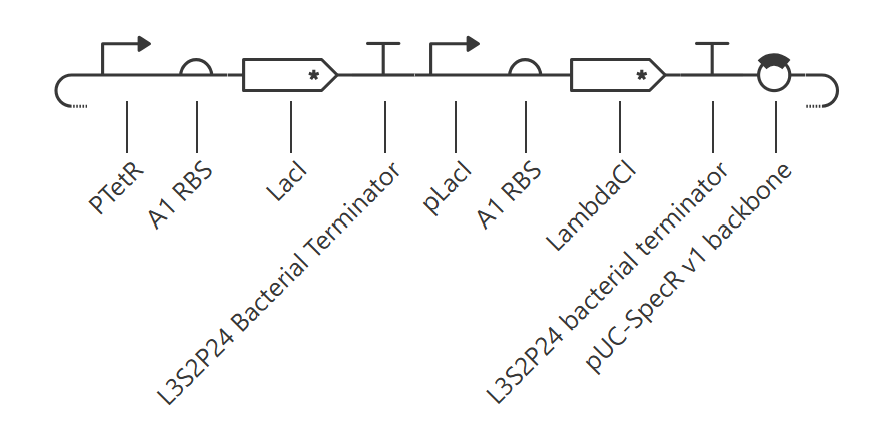
I recreated the repressilator in my own construct using the same overall cyclic repression logic as the official example.
Expected behavior
I expected oscillatory behavior again, since the recreated circuit preserves the three-node cyclic repression topology.
Observed behavior
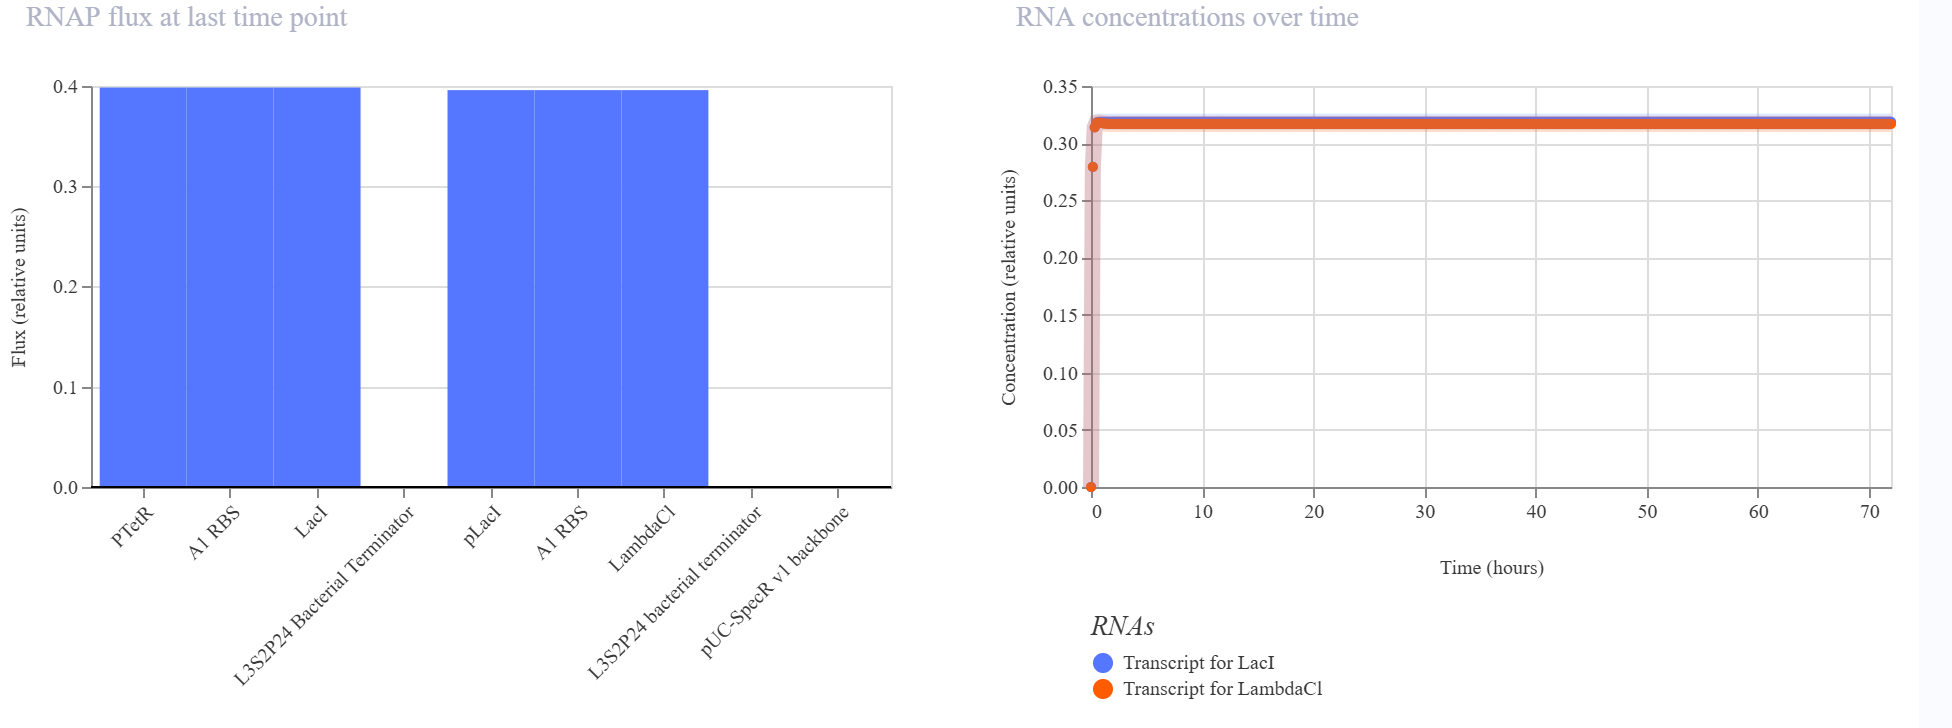
In my recreated version, the simulator did not show sustained oscillations. Instead, the system converged to a non-oscillatory steady state in which LambdaCI accumulated strongly, while LacI and TetR remained at much lower levels. The RNA plots showed the same qualitative pattern, suggesting that one branch of the circuit dominated the overall dynamics rather than producing balanced cyclic repression.
Interpretation
My recreated construct did not match the official repressilator demo. A likely explanation is that the recreated version differs from the original in one or more important details, such as promoter-repressor matching, part order, parameterization, or regulatory balance. Another possibility is that the system is highly sensitive to initial conditions or simulation assumptions, so small differences can push the network into a stable steady state instead of an oscillatory regime.
Possible explanation for the mismatch
Since the pLacI/LambdaCI branch appears to dominate the final state, one possible issue is that repression strengths or expression balance are not equivalent to the official example. This could prevent the delayed cyclic repression required for oscillations and instead stabilize one dominant node.
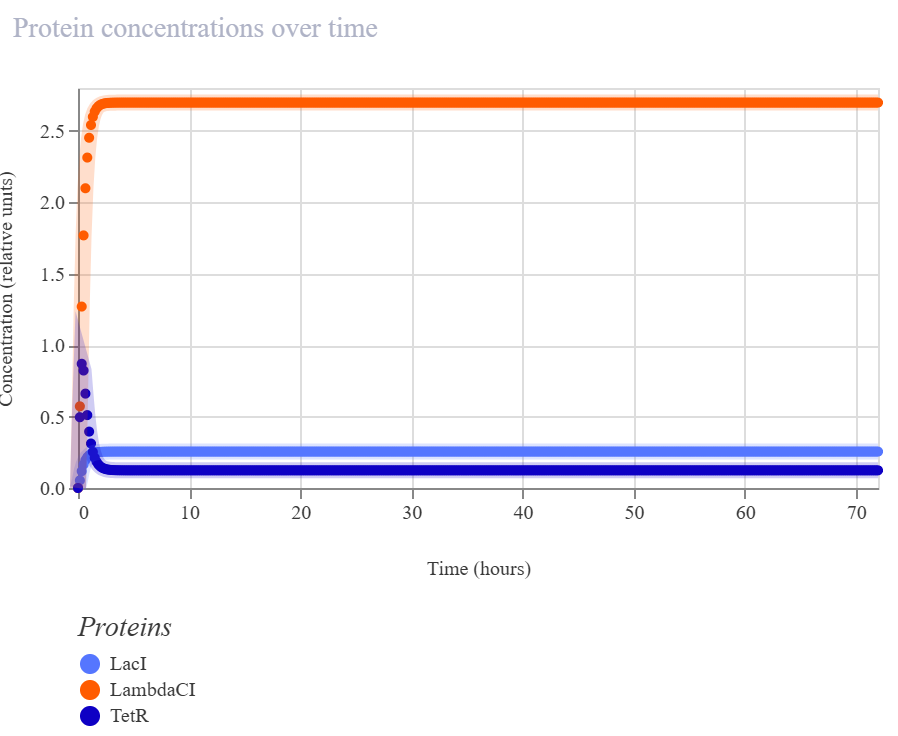
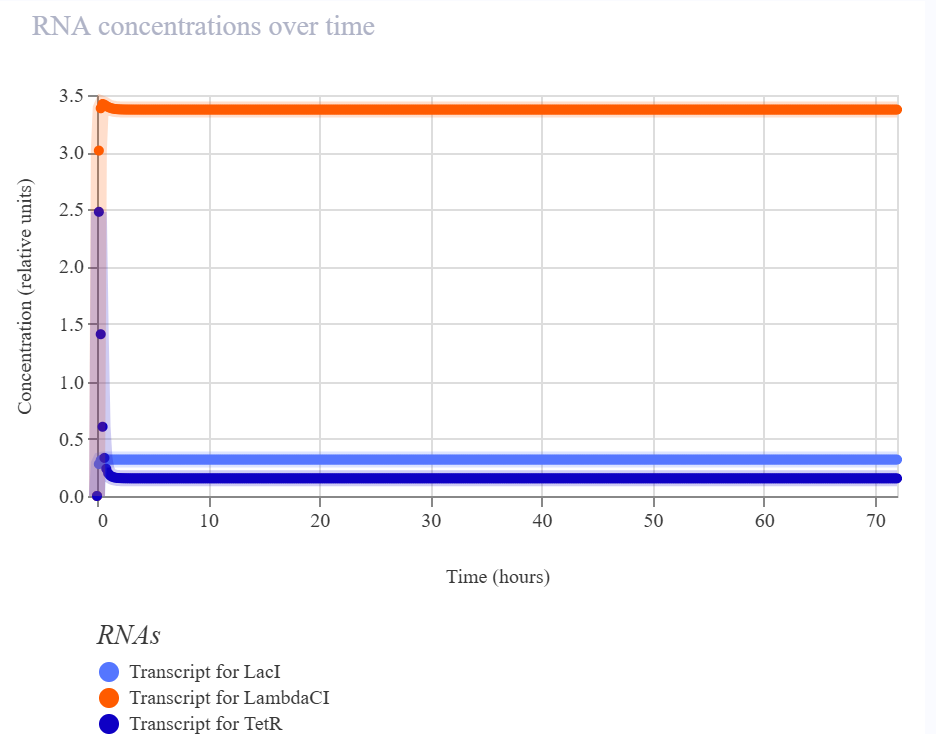
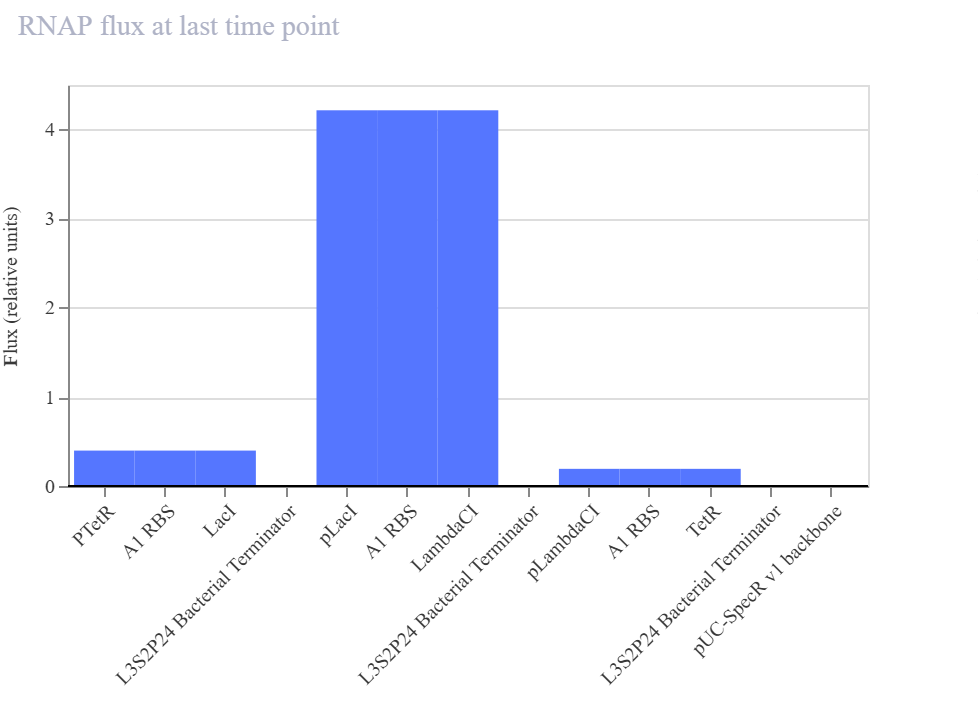
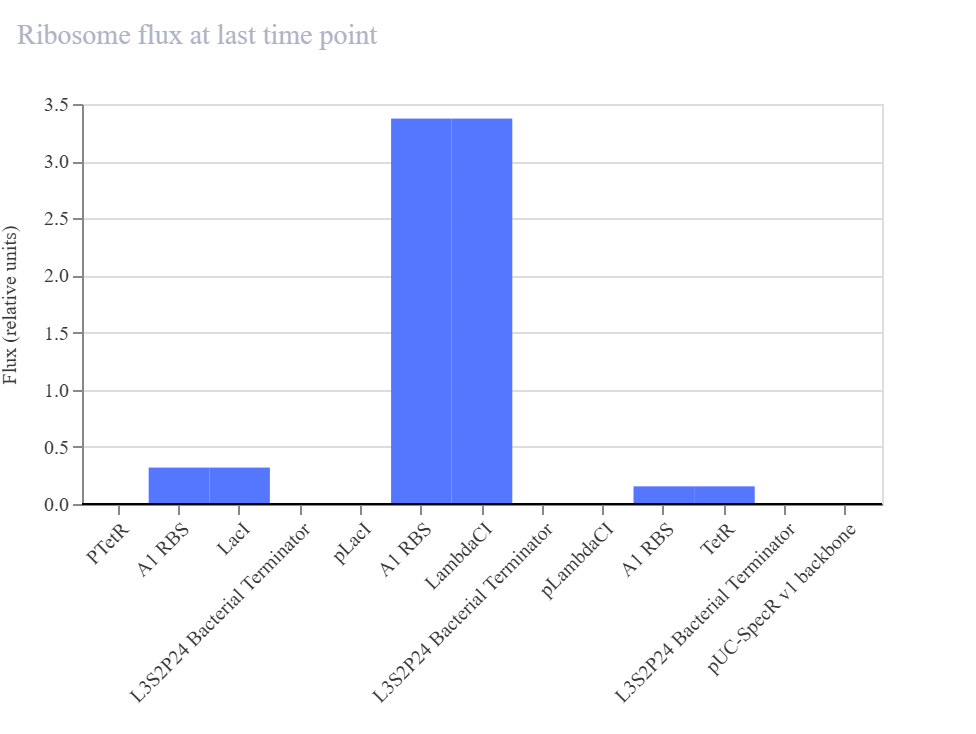
The recreated repressilator did not reproduce the oscillatory dynamics of the official example. Instead, the simulation converged to a steady state in which the LambdaCI-associated branch dominated, while the LacI and TetR branches remained low. The RNA and flux plots supported the same qualitative conclusion, indicating an imbalanced regulatory architecture rather than sustained cyclic repression.
Construct 1 — Single-gene LacI expression circuit
Design idea
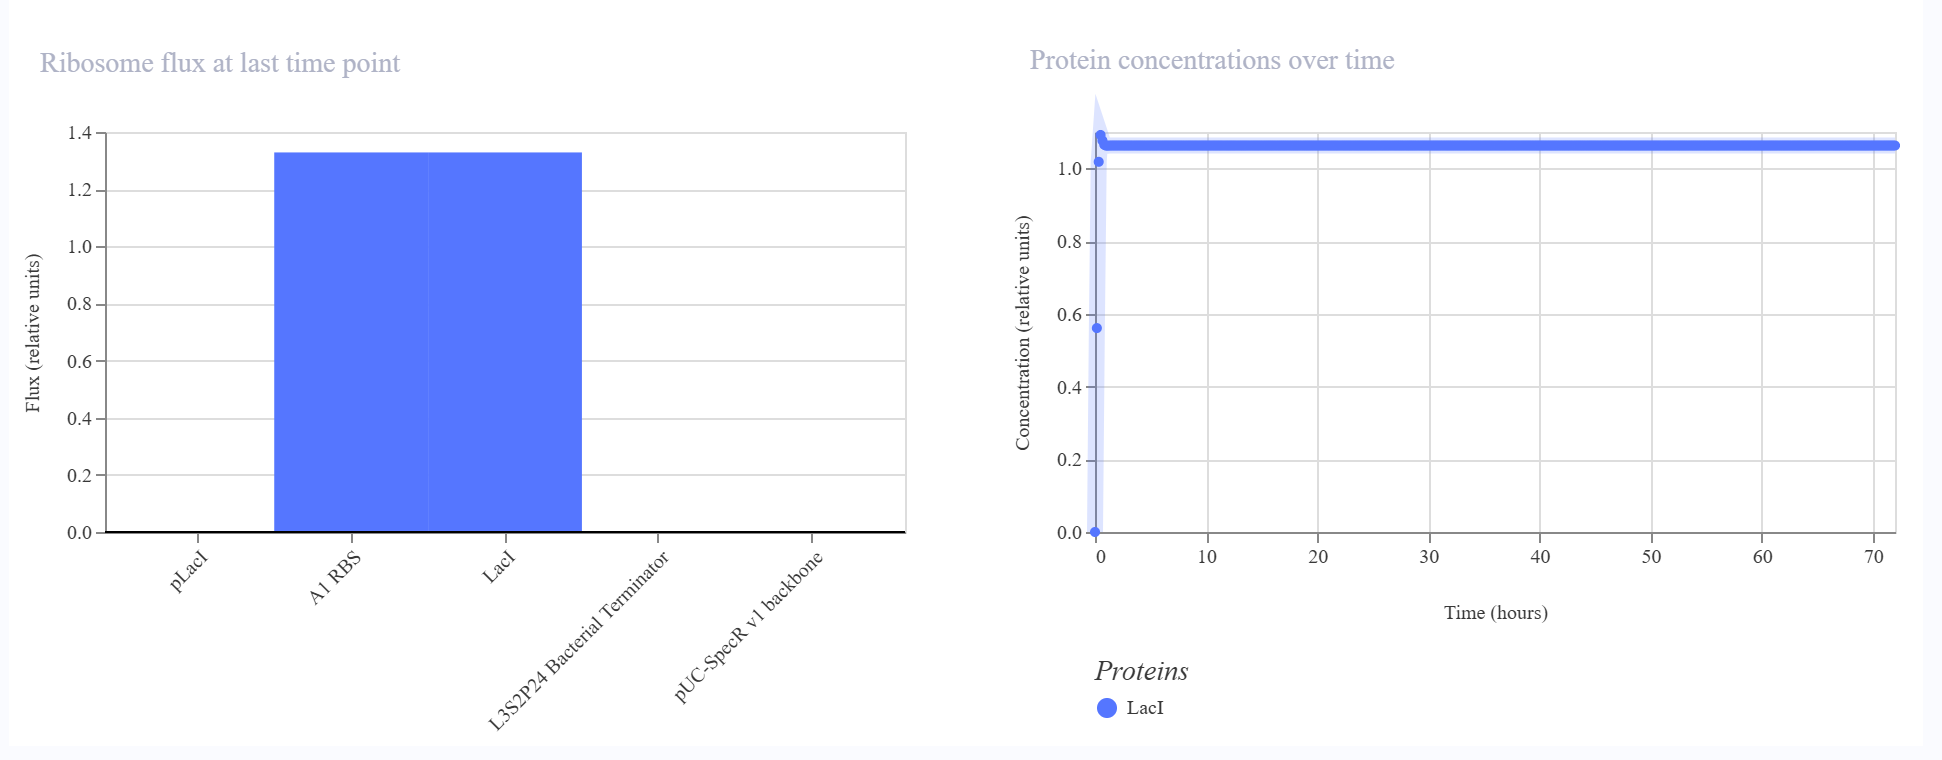
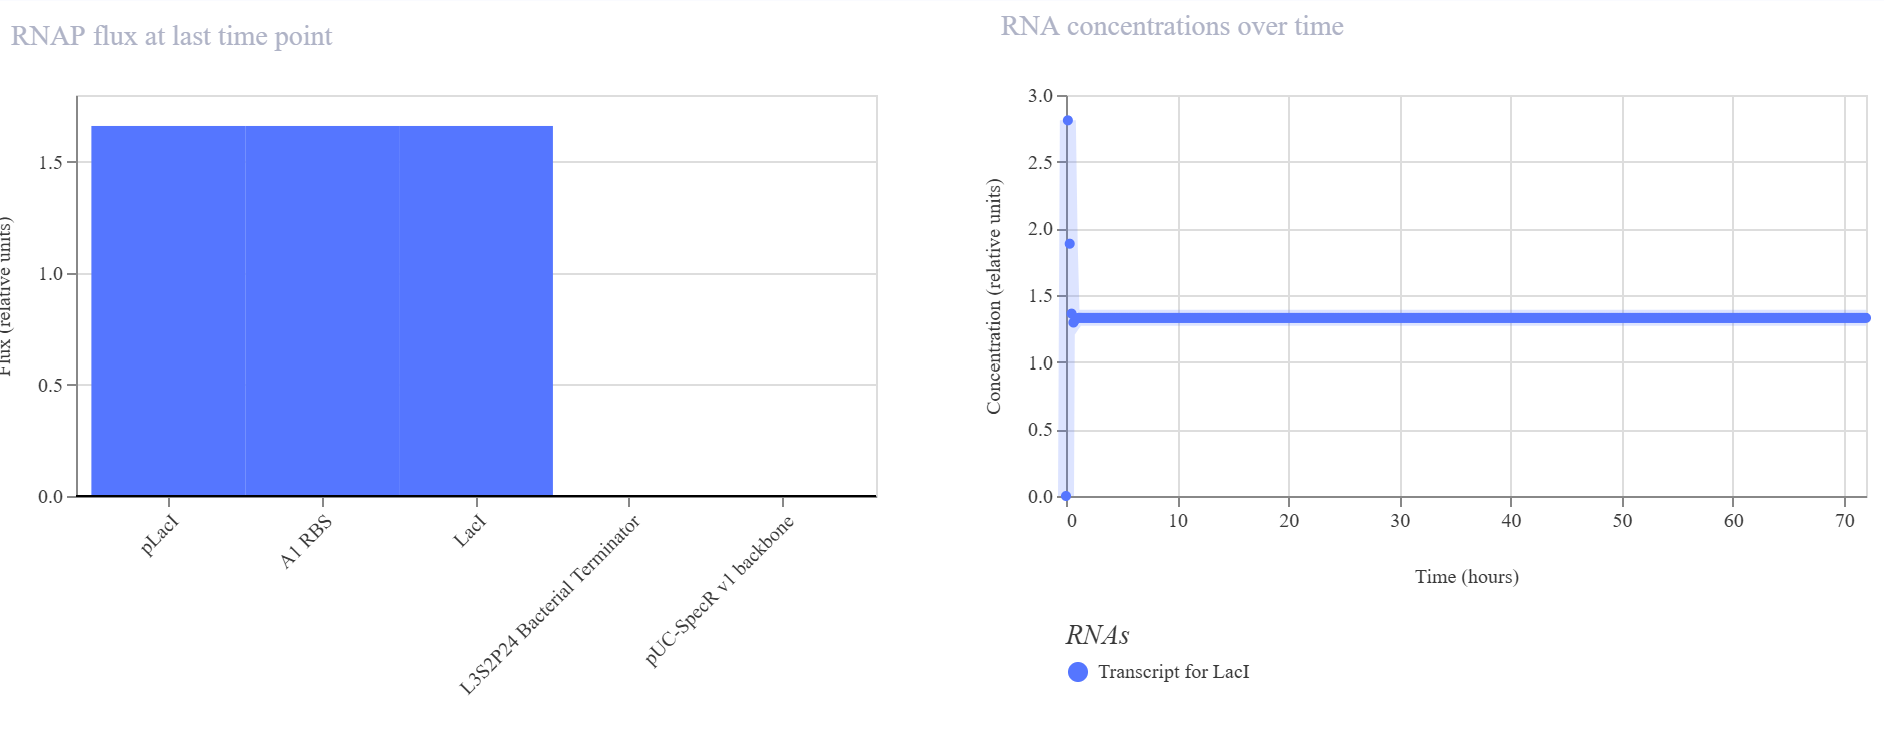
This construct contains a simple transcriptional unit composed of pLacI, A1 RBS, LacI, and a bacterial terminator on a plasmid backbone.
Expected behavior
I expected a simple non-oscillatory expression pattern in which LacI concentration rises over time and then approaches a stable steady state. Since this construct does not include a cyclic feedback loop, I did not expect oscillations.
Observed behavior
The simulator showed a rapid increase in both LacI protein and LacI RNA levels during the initial phase, followed by a stable steady state over the rest of the simulation. No oscillatory behavior was observed. The endpoint RNAP flux and ribosome flux plots were also consistent with active expression of a single transcriptional unit.
Interpretation
The result matched my expectation. This construct behaves as a simple single-gene expression circuit with stable output rather than dynamic oscillatory behavior.
Construct 2 — Cross-repression circuit
Design idea
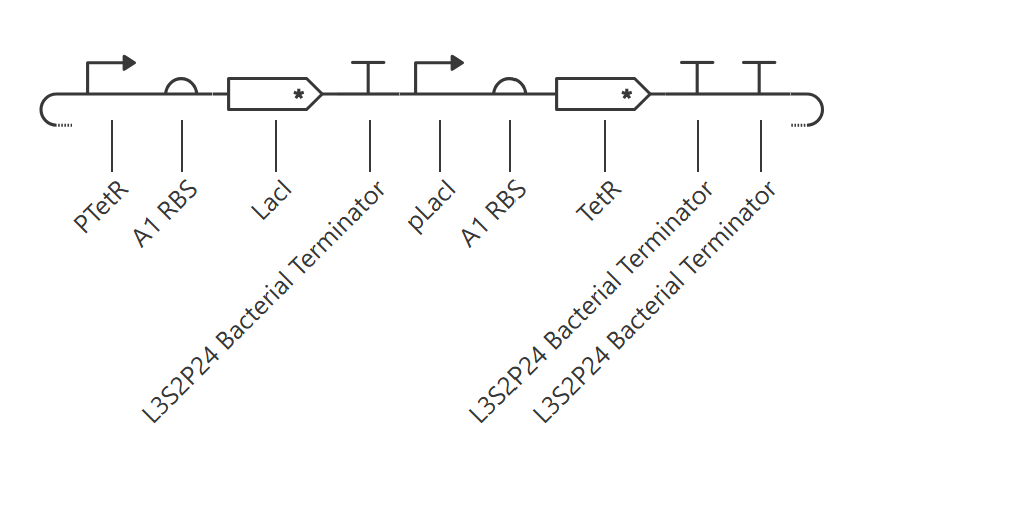
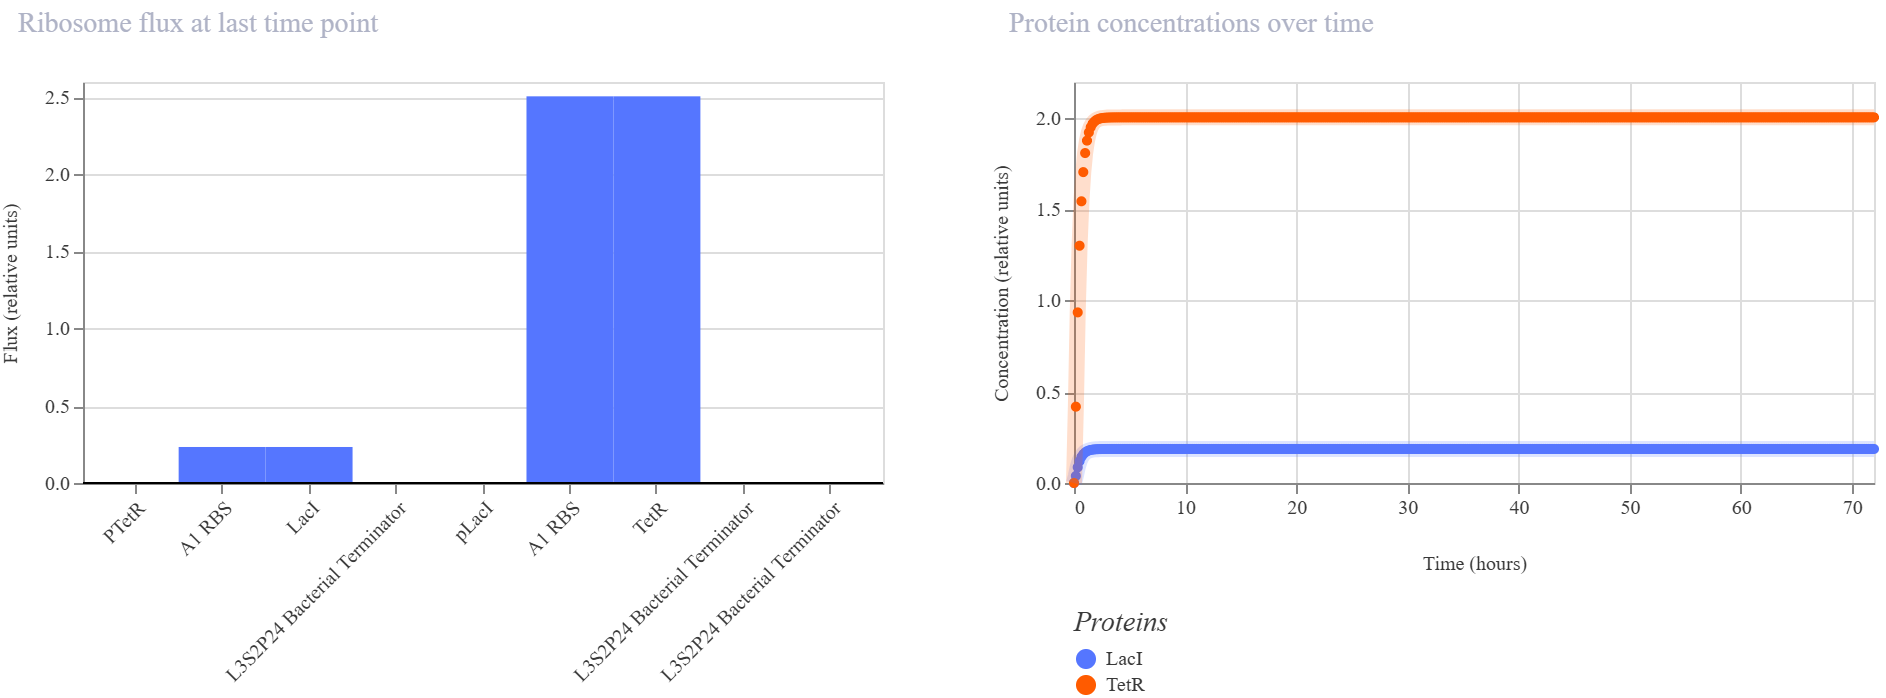
This construct contains two transcriptional units: pTetR → LacI and pLacI → TetR. The goal was to create a simple two-node cross-repression circuit.
Expected behavior
I expected a more regulated and competitive behavior than in Construct 1, since each branch can influence the other indirectly through repressor-promoter interactions. I did not necessarily expect sustained oscillations, but I expected the system to favor one dominant steady state or a strong imbalance between the two nodes.
Observed behavior
The simulator showed that the TetR branch became dominant, reaching a much higher steady-state protein and RNA level than the LacI branch. LacI remained at a low concentration throughout the simulation, while TetR accumulated quickly and stabilized at a much higher level. The endpoint RNAP and ribosome flux plots were consistent with this asymmetry, showing that the pLacI → TetR branch was much more active than the pTetR → LacI branch.
Interpretation
The result matched the expectation that this circuit would behave differently from a single-gene expression system and would not produce balanced oscillations. Instead, the network converged to a dominant-state steady state in which one regulatory branch strongly outcompeted the other.

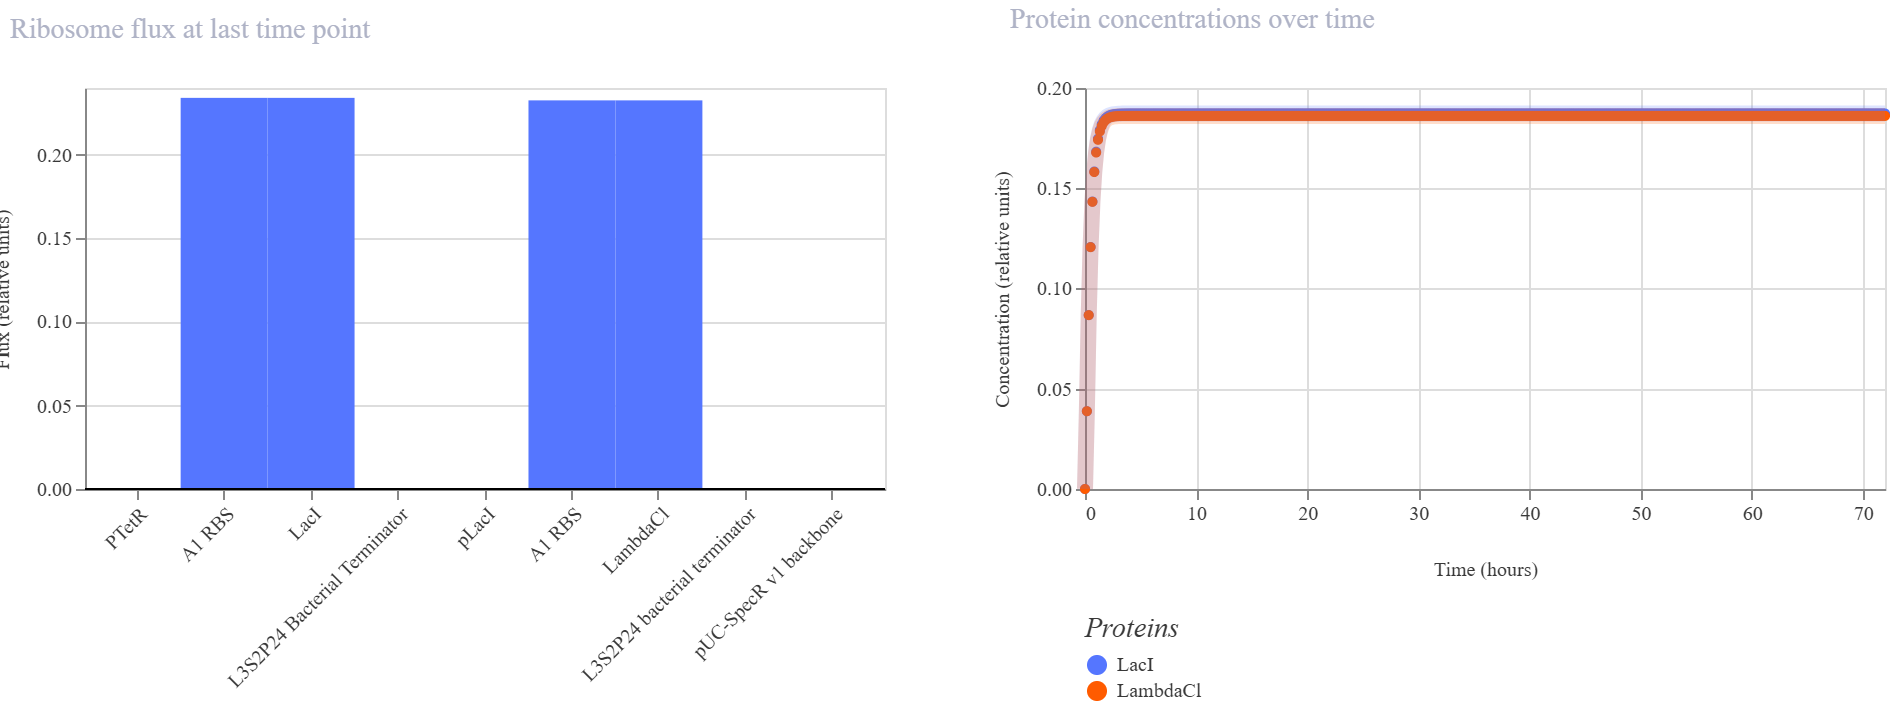
Construct 3 — One-way repression cascade
Design idea
This construct contains two transcriptional units arranged as a simple repression cascade: pTetR → LacI and pLacI → LambdaCI. The goal was to build a directional regulatory cascade rather than a symmetric cross-repression circuit.
Expected behavior
I expected the first branch to express LacI strongly, since TetR is not present in this circuit to repress pTetR. I then expected LacI to repress pLacI, leading to lower expression of LambdaCI. Therefore, I expected a non-oscillatory steady state with high LacI and low LambdaCI.
Observed behavior
The simulator showed that both LacI and LambdaCI increased rapidly and then converged to very similar steady-state levels. The RNA plots showed the same qualitative behavior, with both transcripts reaching nearly identical stable concentrations. The endpoint RNAP and ribosome flux plots were also very similar for the two branches, indicating that both transcriptional units remained comparably active.
Interpretation
The result did not match my original expectation of a strongly directional repression cascade. Instead, the circuit behaved more like two balanced expression modules operating in parallel, with no strong suppression of the LambdaCI branch by LacI.
Possible explanation
A likely explanation is that the simplified simulation setup did not generate strong enough regulatory asymmetry for LacI to effectively suppress the second branch. Another possibility is that the promoter-repressor relationships in this model are not sufficient by themselves to create a clear cascade effect under the default simulation conditions.
Final reflection
This week helped me connect molecular cloning concepts with dynamic circuit behavior in simulation. The DNA assembly section clarified how fragment design, overlaps, and transformation logic affect experimental success, while the Kernel section showed how different circuit topologies can produce stable expression, dominant steady states, or oscillatory behavior depending on regulatory architecture and balance.