Week 10 HW: Advanced Imaging & Measurement Technology
Week 10 — Advanced Imaging & Measurement Technology
Overview## Overview
In this homework, I analyzed eGFP using LC-MS and MS/MS data to evaluate its intact molecular weight, peptide map, and structural state under native versus denaturing conditions. The goal was to determine whether the measured protein is consistent with the expected eGFP standard, using intact-mass analysis, tryptic peptide mapping, and comparison of native and denatured charge state distributions.
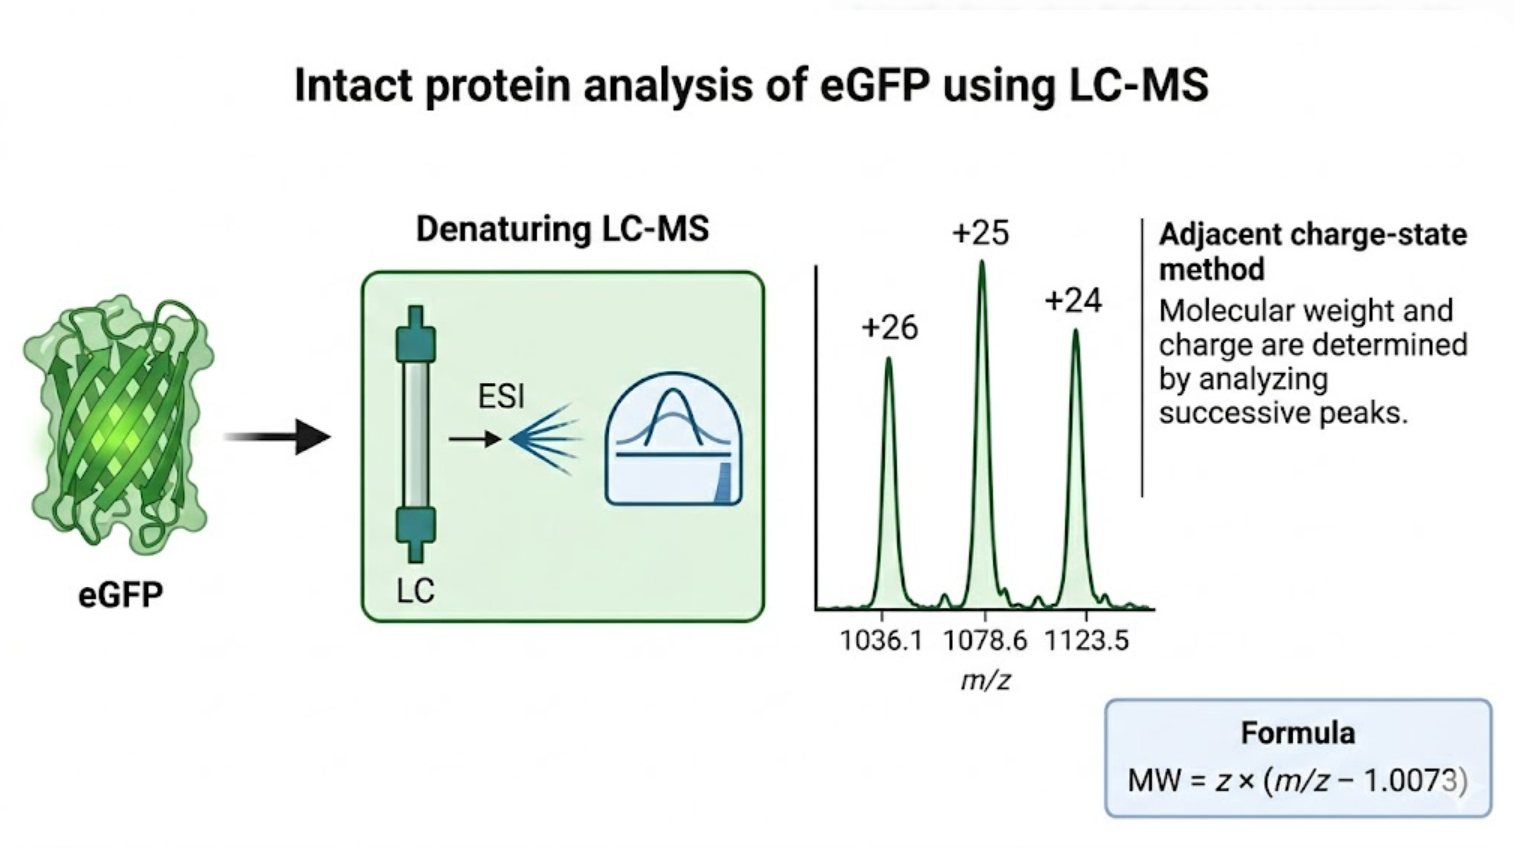
Figure 1. Schematic overview of intact eGFP molecular-weight analysis by LC-MS, highlighting denaturation, charge-state distribution, and the adjacent charge-state method used to estimate protein molecular weight.
Waters Part 1 — Molecular Weight
The eGFP sequence provided in the assignment contains a linker and a C-terminal His tag. Based on the amino acid sequence, the calculated molecular weight is approximately 27,875 Da (about 27.875 kDa).
To estimate the molecular weight experimentally from the intact protein spectrum, I used two adjacent charge states from the BioAccord spectrum:
- m/z = 1037.4927
- m/z = 1077.3950
Using the adjacent charge-state relationship, these peaks correspond to approximately +27 and +26, respectively.
Using the equation:
MW = z × (m/z − 1.0073)
I obtain:
From the +27 charge state:
MW = 27 × (1037.4927 − 1.0073) = 27,985.11 DaFrom the +26 charge state:
MW = 26 × (1077.3950 − 1.0073) = 27,986.08 Da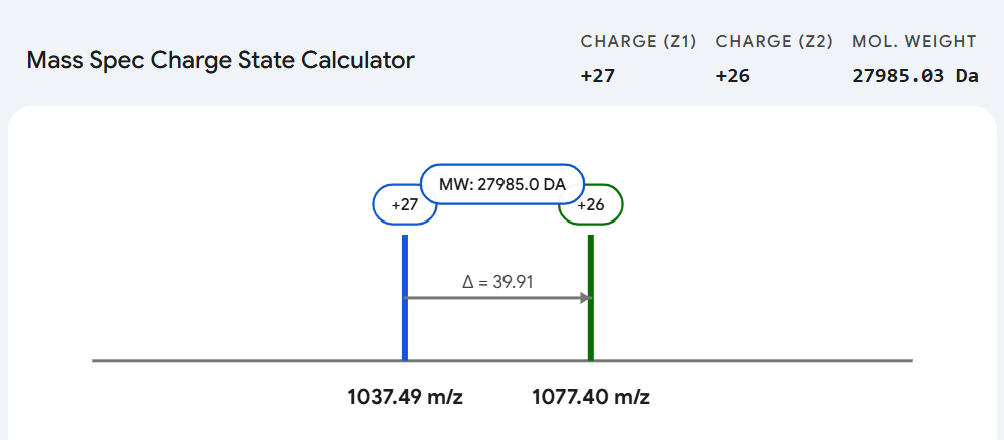
Figure 2. Illustration of the adjacent charge-state method used to assign neighboring peaks and calculate the experimental molecular weight of intact eGFP.
The average experimental molecular weight is therefore:
- 27,985.59 Da
- or 27.986 kDa
To estimate mass accuracy relative to the theoretical sequence:
Accuracy = |MWexp − MWtheo| / MWtheo
Accuracy = |27,985.59 − 27,875.00| / 27,875.00 ≈ 0.00397
So the measurement error is approximately:
- 0.397%
- or about 3967 ppm
Overall, the intact mass is very close to the expected eGFP mass range, although it appears slightly heavier than the theoretical sequence provided in the assignment. This may indicate a minor proteoform difference or a sequence/formulation-related mass contribution.
Intact mass interpretation and mass accuracy
The experimentally estimated intact mass is in the expected size range for His-tagged eGFP, but the difference from the theoretical value is not negligible for mass spectrometry.
The calculated experimental mass was:
| Measurement | Value |
|---|---|
| Theoretical eGFP mass | 27,875.00 Da |
| Experimental eGFP mass | 27,985.59 Da |
| Difference | 110.59 Da |
| Relative error | 0.397% |
| Mass error | ~3967 ppm |
This discrepancy may reflect the use of rounded peak values, an incorrect theoretical sequence assumption, unresolved adducts, incomplete deconvolution, or a proteoform/sequence difference between the provided sequence and the analyzed eGFP standard. The protocol notes that the eGFP standard contains a linker and a C-terminal His tag, so accurate theoretical mass assignment depends on using the exact sequence and construct analyzed.
Intact spectrum zoom-in charge state
In the zoomed-in intact eGFP spectrum, the charge state can be inferred from the spacing between isotope peaks when the resolution is sufficient. The assignment/protocol identifies this zoomed-in region as corresponding to the 10+ charge state.
However, for the molecular-weight calculation above, I relied on the adjacent charge-state assignment from the broader denatured charge-state envelope. This is useful because adjacent charge states allow the intact protein mass to be estimated from neighboring peaks in the electrospray spectrum.
Waters Part 2 — Peptide Map Work (Primary Structure)
FEGDTLVNR
Peptide mass accuracy
Using the peptide map report values for the peptide identified at approximately 2.78 minutes:
| Peptide | Observed mass | Expected mass | Mass error |
|---|---|---|---|
FEGDTLVNR | 1050.518 Da | 1050.521 Da | -3.60 ppm |
This ppm-level agreement strongly supports the assignment of the observed ion to the tryptic peptide FEGDTLVNR.
The peptide map also reported 88% amino acid sequence coverage, meaning that most of the eGFP sequence was confirmed by detected peptides and MS/MS fragmentation evidence. This strongly supports that the analyzed protein is consistent with the expected eGFP standard.
The eGFP sequence contains:
- 20 lysines (K)
- 6 arginines (R)
Using the PeptideMass workflow described in the assignment with Trypsin, 0 missed cleavages, and filtering peptides above 500 Da, the expected number of tryptic peptides is:
- 19 peptides
From the LC-MS chromatogram in Figure 3a, I counted the chromatographic peaks between 0.5 and 6.0 minutes and observed:
- 21 peaks
Therefore, the number of observed chromatographic peaks is slightly higher than the number of predicted tryptic peptides. This suggests that some peaks may correspond to additional peptide species such as modified peptides, partially digested species, adducts, or chromatographic separation of closely related forms.
For the peptide shown in Figure 3b, the main observed ion is:
- m/z = 525.76712
From the isotope spacing, the peak is consistent with a +2 charge state, since isotope spacing is approximately 1/z and the peak pattern is consistent with a doubly charged peptide.
To calculate the singly charged form [M+H]+:
[M+H]+ = z × (m/z) − (z − 1) × 1.0073
[M+H]+ = 2 × 525.76712 − 1.0073 = 1050.53 Da
So the peptide mass is:
- [M+H]+ ≈ 1050.53 Da
Comparing this measured value with the predicted tryptic peptide masses, the best match is:
- FEGDTLVNR
Its theoretical [M+H]+ mass is approximately:
- 1050.52 Da
Therefore, the mass error is very small, on the order of only a few ppm, indicating an excellent match between the observed peptide and the theoretical digest product.
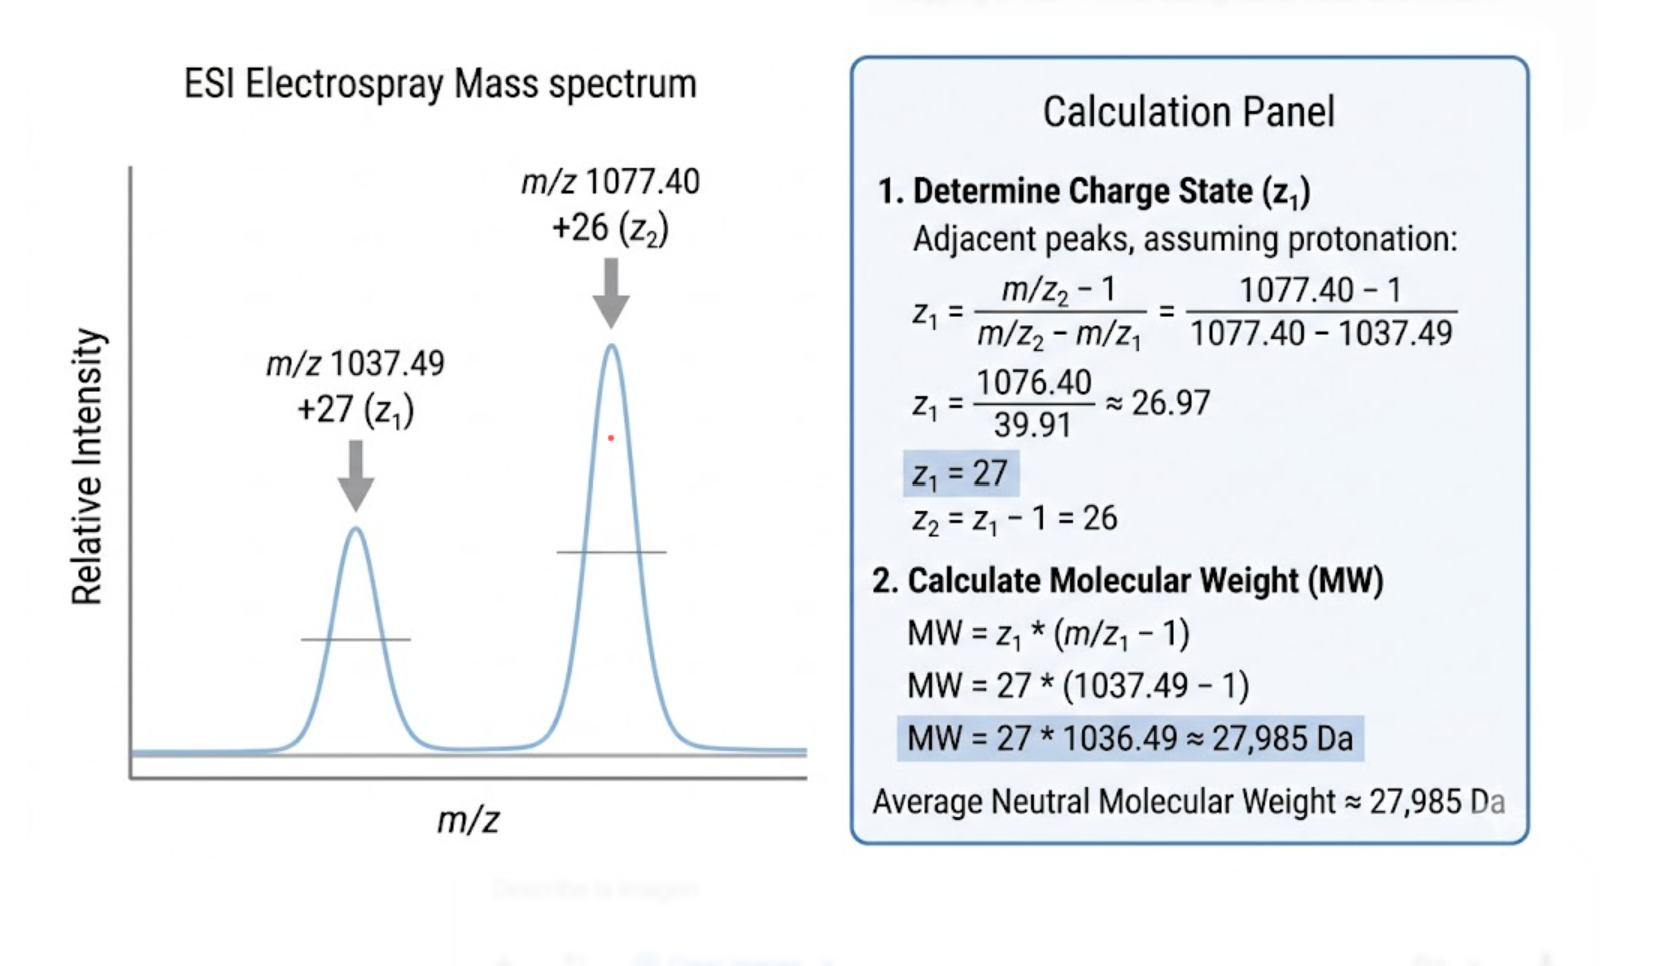
Figure 3. Workflow of tryptic digestion and LC-MS peptide mapping of eGFP, showing cleavage after lysine and arginine residues and the generation of peptide peaks used to confirm primary structure. Finally, the peptide map coverage shown in Figure 5 indicates that the identified peptides confirm:
- 88% amino acid sequence coverage
This high sequence coverage strongly supports that the analyzed sample is consistent with the expected eGFP standard.
Waters Part 3 — Secondary/Tertiary Structure
Native and denatured mass spectrometry provide information about protein conformation by revealing how many charges a protein can carry in each condition.
Under denaturing conditions, the protein unfolds because of the organic solvent and acidic environment. When the protein unfolds, more basic sites become exposed to solvent and can be protonated. As a result, the protein acquires more charges, giving a broader charge-state distribution and peaks at lower m/z values.
Under native conditions, the protein remains more compact and folded because the solvent system is milder and better preserves noncovalent interactions. Since fewer protonation sites are exposed, the protein acquires fewer charges, which produces a narrower charge-state distribution and peaks at higher m/z values.
This is exactly what is observed in the eGFP spectra. The native spectrum shows fewer charge states at higher m/z, whereas the denatured spectrum shows more charge states distributed across a wider m/z range.
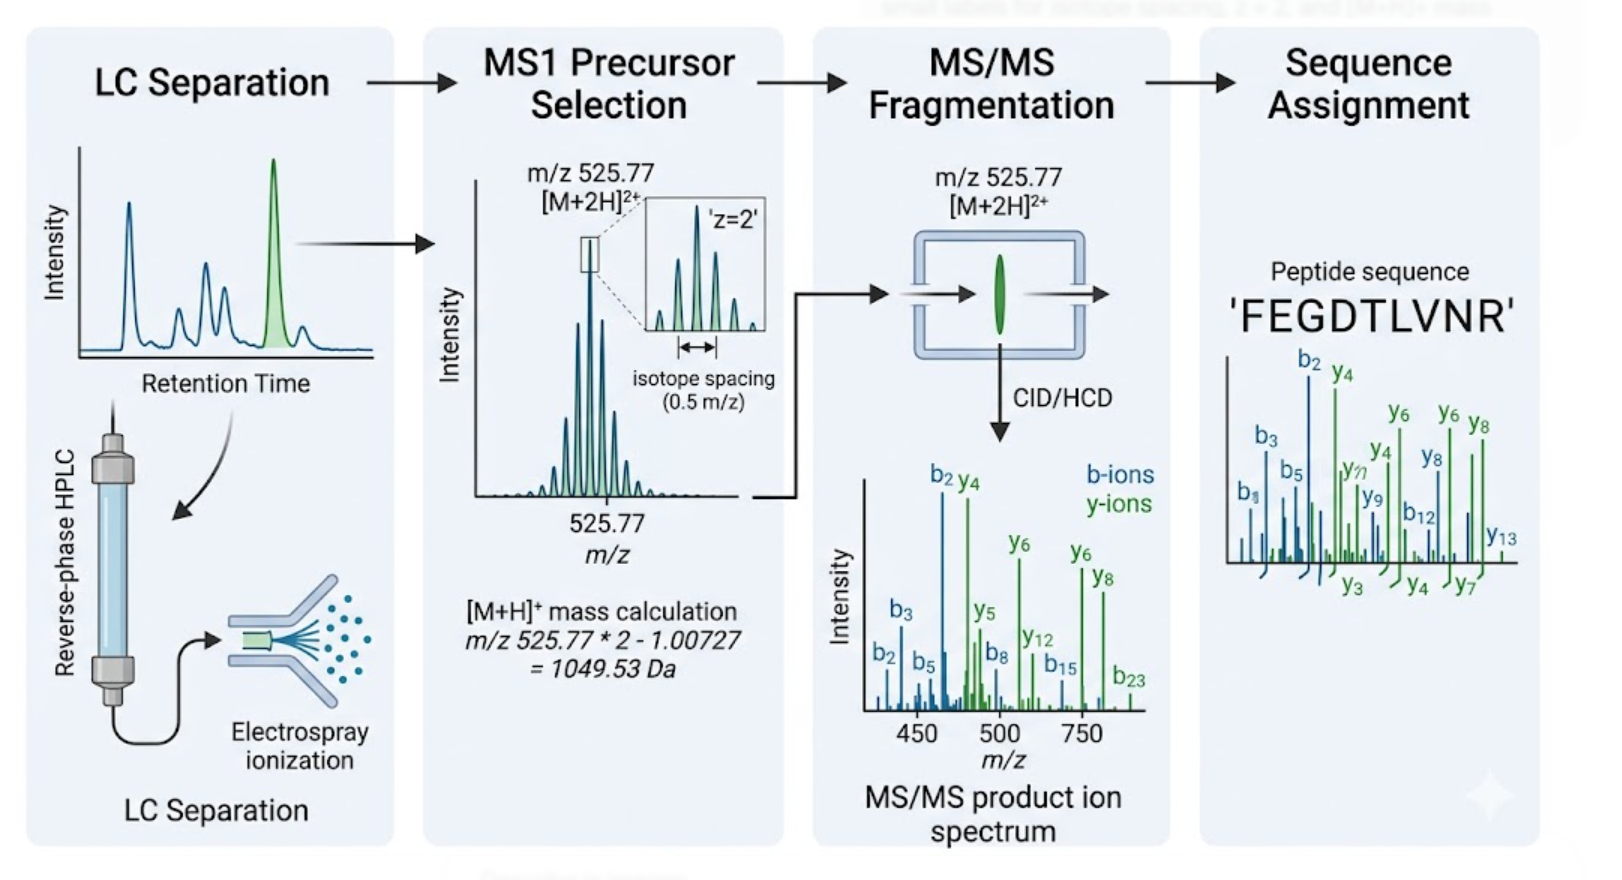
Figure 4. Example of peptide identification by LC-MS/MS, showing the measured precursor ion, charge-state assignment from isotope spacing, and sequence confirmation from fragmentation analysis. For the zoomed-in native peak around 2800 m/z in Figure 7, the charge state is approximately:
- z = +10
This can be determined from the isotope spacing. In electrospray mass spectrometry, the distance between isotope peaks is approximately equal to 1/z. Since the isotopic spacing is about 0.1 m/z, the charge state is consistent with:gfp
z = 10
Overall, the comparison between native and denatured spectra supports the expected behavior of folded versus unfolded eGFP.
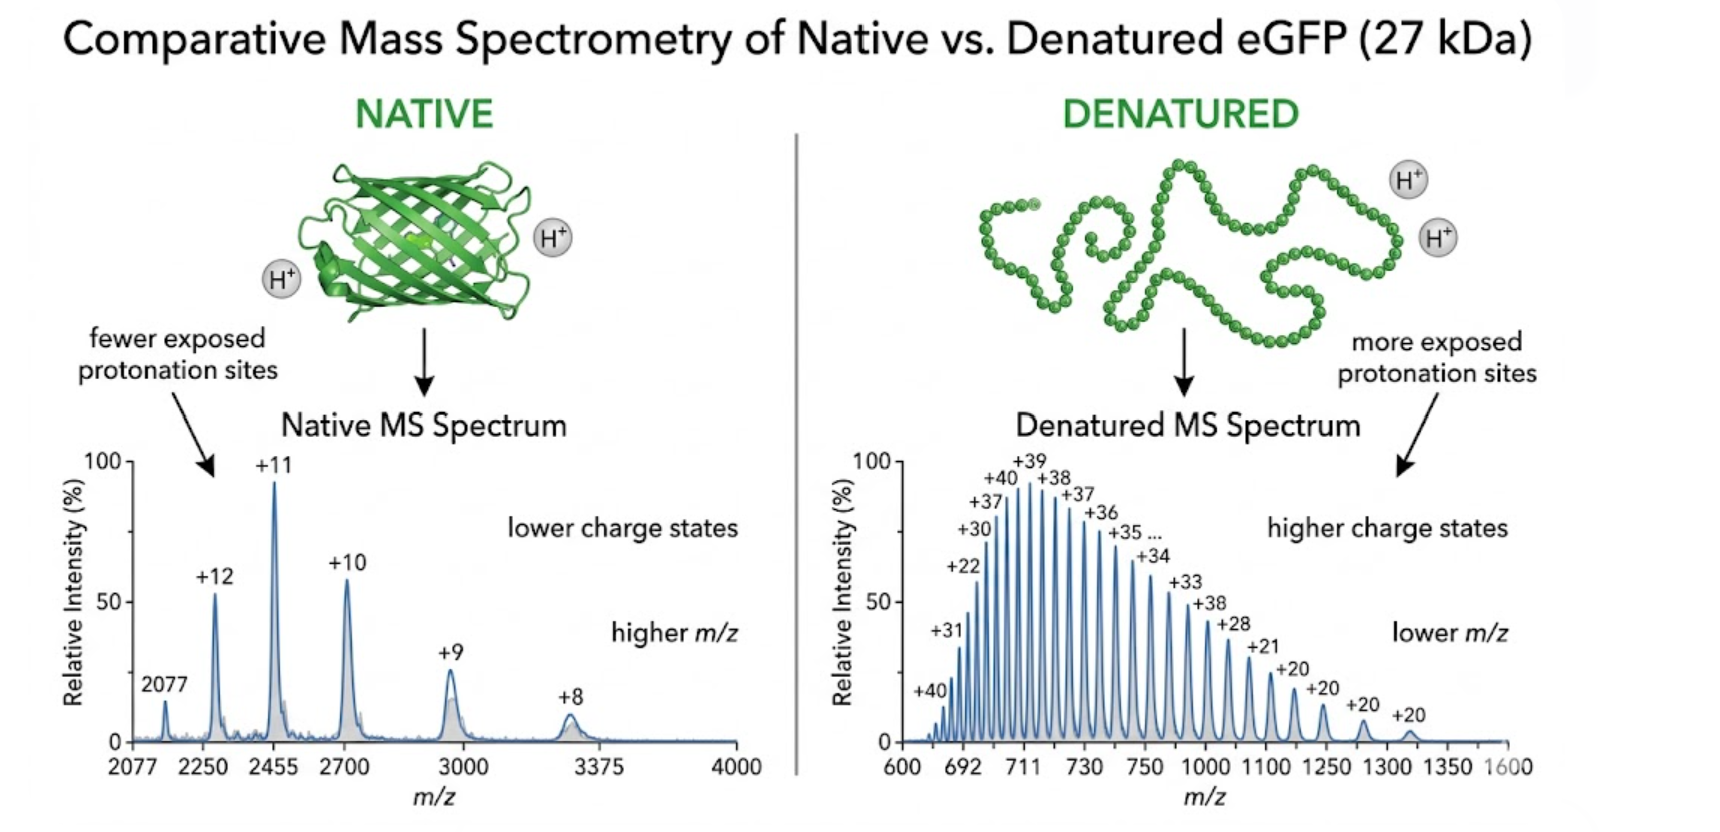
Figure 5. Conceptual comparison between native and denatured mass spectrometry of eGFP. Native protein remains compact and exhibits fewer charge states at higher m/z, whereas denatured protein unfolds and displays a broader distribution at lower m/z.
Waters Part 4 — KLH Oligomers by Charge Detection Mass Spectrometry
Charge Detection Mass Spectrometry (CDMS) allows direct mass measurement of very large heterogeneous protein complexes by measuring both the mass-to-charge ratio and the charge of individual ions. This is especially useful for megadalton-scale assemblies such as Keyhole Limpet Hemocyanin (KLH), where conventional mass spectrometry may not resolve individual charge states clearly.
According to the assignment, KLH contains polypeptide subunits with approximate masses of:
| Subunit type | Approximate mass |
|---|---|
| 7FU | 340 kDa |
| 8FU | 400 kDa |
Using these subunit masses, the expected oligomeric states are:
| Oligomeric species | Calculation | Expected mass | Observed region in CDMS spectrum |
|---|---|---|---|
| 7FU Decamer | 10 × 340 kDa | 3.4 MDa | ~3.4 MDa |
| 8FU Didecamer | 20 × 400 kDa | 8.0 MDa | ~8.3 MDa |
| 8FU 3-Decamer | 30 × 400 kDa | 12.0 MDa | ~12.7 MDa |
| 8FU 4-Decamer | 40 × 400 kDa | 16.0 MDa | expected near ~16 MDa, weak or less clearly resolved in the provided spectrum |
The CDMS spectrum shows major KLH-related mass features near 3.4 MDa, 8.3 MDa, and 12.7 MDa, which are consistent with decameric and multidecameric KLH assemblies. The 4-decamer species would be expected near 16 MDa, but it is less clearly visible in the provided spectrum.
Overall, this experiment illustrates why CDMS is useful for very large biomolecular complexes. Instead of inferring charge states from resolved isotope or charge envelopes, CDMS directly measures individual ion charge and mass, making it more suitable for heterogeneous megadalton-scale assemblies.
Waters Part 5 — Did I make GFP?
| Measurement | Theoretical | Observed/measured on the BioAccord MS | Bonus: observed/measured on the G3 Q-ToF MS |
|---|---|---|---|
| Molecular weight | 27.875 kDa | 27.986 kDa | ~27.9 kDa |
| Amino acid sequence coverage | N/A | 88% | N/A |
| Peptide identified at 2.78 min | FEGDTLVNR expected | FEGDTLVNR observed | N/A |
| Peptide mass error | N/A | -3.60 ppm | N/A |
| Native/denatured structure behavior | Folded protein expected to show lower charge states | Consistent with native vs denatured charge-state behavior | Consistent |
Yes, the results are consistent with eGFP. The intact molecular weight is in the expected range for His-tagged eGFP, the peptide map identifies peptides matching the expected tryptic digest, and the sequence coverage reaches 88%, which strongly supports the identity of the protein as the eGFP standard.
The native versus denatured spectra also behave as expected. Native eGFP remains more compact and therefore carries fewer charges, producing peaks at higher m/z. Denatured eGFP unfolds, exposes more protonation sites, and produces a broader distribution of higher charge states at lower m/z.
Final Project
For my final project, I am developing an automated DNAzyme–Cas12a amplified biosensor for Pb²⁺ detection in water. The goal of the project is to create a modular sensing platform in which a Pb²⁺-responsive DNAzyme cleaves a substrate, releases a nucleic acid trigger, and activates Cas12a collateral cleavage to generate an amplified fluorescent signal.
The main aspects I want to measure in this project are:
- Presence or absence of Pb²⁺ in water samples
- Fluorescence signal intensity generated after activation of the DNAzyme–Cas12a cascade
- ON/OFF signal separation, comparing Pb²⁺-containing samples versus no-target controls
- Background leakage, meaning unwanted signal in the absence of Pb²⁺
- Sensitivity and limit of detection, especially at low Pb²⁺ concentrations
- Selectivity, by comparing Pb²⁺ response against other ions that may interfere
- Reaction kinetics, including how quickly the signal appears and how strongly it amplifies over time
- Reproducibility across different reaction conditions and replicate experiments
To perform these measurements, I would use a combination of computational design, automated experimental optimization, and fluorescence-based readout.
First, I would use Benchling to annotate and organize all DNA constructs and sensing modules. Then I would use NUPACK to evaluate nucleic acid folding and identify sequence architectures with lower OFF-state leakage and better trigger accessibility. I would also use ODE-based kinetic modeling to simulate the sensing cascade and predict how DNAzyme cleavage, trigger release, Cas12a activation, and reporter cleavage affect the final fluorescence output.
For experimental measurements, I would use an Opentrons OT-2 liquid handler to run multidimensional optimization screens across parameters such as pH, Mg²⁺ concentration, reporter concentration, and DNAzyme/Cas12a stoichiometry. The main readout would be measured using a fluorescence plate reader or a similar fluorescence detection instrument. If needed, complementary validation could also include gel electrophoresis to verify cleavage products or nucleic acid integrity.
Overall, the key technologies in this project are:
- DNA construct design
- Nucleic acid secondary-structure analysis
- Kinetic simulation and modeling
- Automated liquid handling
- Fluorescence-based biosensing
- Potential future portable assay formats for environmental monitoring
This measurement strategy is designed to evaluate whether the sensor is modular, sensitive, selective, and suitable for future translation into a portable lead-detection platform.
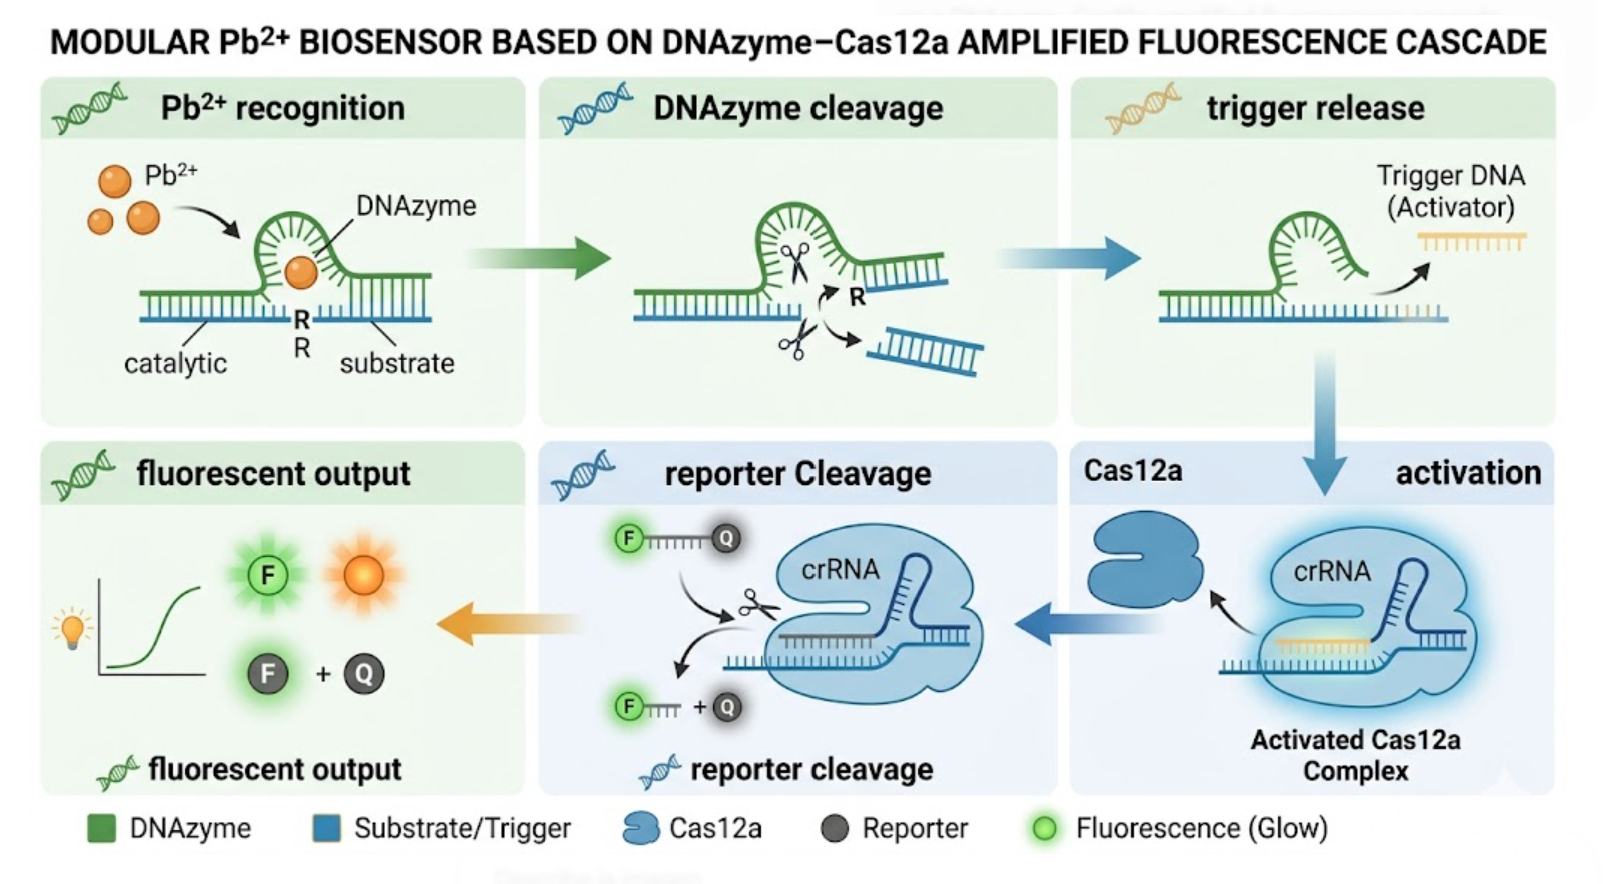
Figure 6. Proposed modular biosensor architecture for Pb2+ detection, in which a Pb2+-responsive DNAzyme releases a nucleic acid trigger that activates Cas12a collateral cleavage and generates an amplified fluorescent readout.