Week 10 HW
https://2026a.htgaa.org/2026a/course-pages/weeks/week-10/index.html
Homework: Final Project
Identify at least one aspect of your project to measure (protein mass, sequence, biomarker presence/quantity, etc.).
For this homework, let’s say my project is to produce human insulin (INS_HUMAN) via recombinant synthesis (cell-based system - E. Coli).
The aspect I want to measure is purification/presence of the insulin protein.
Describe all elements you intend to measure and the measurement procedures in detail.
- Total protein content
- Bradford essay on cell lysate
- Apparent molecular weight and purity
- SDS-PAGE on a Tricine gel system
- Band Homogeneity: A pure protein will display a single, distinct band after staining.
- SDS-PAGE on a Tricine gel system
- Identity confirmation
- Western blot with anti-human-insulin antibody
- Exact mass and sequence integrity
- LC-MS (ESI-TOF) on the purified product
- Target intact mass 5807.57 Da (oxidized form, 3 disulfides).
- Tryptic digest followed by LC-MS/MS for full sequence coverage (explained in questions below)
- LC-MS (ESI-TOF) on the purified product
- Disulfide bond verification
- Non-reducing peptide mapping by LC-MS - to confirm the three native disulfides
- Quantification and purity
- Reversed-phase HPLC against a USP insulin reference standard
- Host cell protein and endotoxin
- Anti-E. coli HCP ELISA and LAL assay for endotoxin
- it detects and quantifies residual E. coli Host Cell Proteins (HCPs)
- Anti-E. coli HCP ELISA and LAL assay for endotoxin
Specify the technologies you will use (gel electrophoresis, DNA sequencing, mass spectrometry, etc.).
- Mass spectometry
- LC-MS and LC-MS/MS
- SDS-PAGE
- Reversed-phase HPLC
Homework: Waters Part I — Molecular Weight
Calculate the predicted molecular weight of eGFP based on its amino acid sequence using tools like the ExPASy compute_pi calculator.
https://web.expasy.org/cgi-bin/compute_pi/pi_tool_bis.cgi?P42212@1-238@average
Claude thinks I have the WT avGFP, not eGFP (wild type GFP, not enhanced GFP)? Not sure how to find this on UniProt.
Calculate the molecular weight using the adjacent charge state approach:
- Select two charge states from the intact LC-MS data.
- Determine z for adjacent peaks using the provided formula.
So m1 is the [M+27H]²⁷⁺ peak, m2 is [M+28H]²⁸⁺.
Reasoning/intuition:
- Determine the protein MW using the relationship between m/z, MW, and z.
- Calculate measurement accuracy by comparing experimental vs. theoretical weight.
Can you observe the charge state for the zoomed-in peak in the intact eGFP mass spectrum? If yes, what is it? If no, explain why.
Isotypes are species of atoms, characterised by the number of neutrons.
Mass of 1 neutron : m=1.003 Da
In an isotope spacing, adjacent peaks are separated by m/z = 1.003/z Da
We can identify a cluster; the spacings are -
delta_m = 1474.1005 - 1474.0481 = 0.0524Da apartYou can calculate the charge as
z = 1.003 / delta_m.Calculating the charge, we get
z2 = 19Apply
z2to compute the MW, and you find the molecular weights from the two calculations agree to within an accepetable tolerance (100 ppm)
Working for the isotope spacing:
Small note on units: m/z effectively is in Da — mass (Da) divided by charge (just an integer count) leaves you with Da on the x-axis; some textbooks call the unit “Thomson” (Th), but numerically it’s the same as Da.
Homework: Waters Part II — Secondary/Tertiary Structure
Explain the differences between native and denatured protein conformations. What happens when a protein unfolds? How is this determined with a mass spectrometer? What changes appear in the spectra between analyses?
A protein is one or more chains of amino acids. When DNA is read, it is assembled and stored in another form in mRNA, and later assembled by RNA into an amino acid chain.
These amino acids have inherent physical properties that results in various forces which twist the shape into a certain form. This process is referred to as protein folding and is a process of energy minimisation. When the folding reaches an equilibrium the protein is referred to as folded into its native form.
The 3D form of a protein is what confers its functionality. Proteins are in a sense 3D machines composed of chemical elements. Some proteins are merely static shapes, such as signalling molecules. Whereas others have a dynamic mechanical function, such as the ATP synthase.
How is this determined with a mass spectrometer? What changes appear in the spectra between analyses?
A mass spectrometer is a device which measures the mass-to-charge ratio of gaseus ions, which can be used to identify chemical substances.
Molecules are chemical compounds of atoms (ie. CO2 - one carbon, two oxygen atoms). An atomic element is composed of protons and neutrons in its nucleus, and electrons in its orbit. Ionisation is unpairing an electron from an atom.
A mass spectrometer ionises a substance, producing a charge (a free electron). For most small molecules and atoms (like Carbon-12), ionization predictably produces a single, stable charge state (typically +1).
A mass spectrometer outputs a plot of intensity (y) and $m/z$ mass-charge quotient (x). Mass can be used to characterise a specific atom, and charge is emitted when the substance is present and ionised (thus emitting an electron).
Thus a mass spectrometer can be used to map the presence of atoms and larger structures (molecules and proteins).
From what we know:
- a denatured protein is highly charged, where each basic residue (amino acid) tends to become protonated.
- a native protein has few charges, evenly spread across the surface.
The differences between the two runs:
- Native — envelope at high m/z (~3000–4000), narrow (4–5 peaks), few charges. Compact part, few surface sites.
- Denatured — envelope at low m/z (~1000–2000), broad (15–25 peaks), many charges. Sprawl, sites everywhere.
- Mass itself — native shows the assembled mass: subunits stuck together, plus any bound ligand or metal. Denatured shows only individual subunit masses; the assembly has come apart and the cargo has fallen off.
- Peak sharpness — denatured peaks are crisp; native peaks are fuzzier because the folded part drags along bound water, salt adducts, and some conformational wobble.
To detect proteins, typically a divide-and-conquer strategy is used. Proteins are cut using an enzyme (a protease) into smaller groups of residues (peptides), and then the spectral measurement of the mass-charge profiles of all the individual peptides is used to match against a signature of existing measured peptides.
- Digestion: divide-and-conquer using enzyme.
- Separation: separate using liquid chromatography (LC), peptides pass through specrometer gradually.
- Ionisation: peptides are converted into charged, gas-phase ions.
This relies on a database of peptide fragments, whose usage is detailed below:
Peptide identification problem: given an unknown peptide — a chain of amino acids — identify which amino acids it contains and in what order, using only mass-charge measurements. One measurement of the intact peptide gives total mass but not order; many different orderings yield the same mass. Workaround: break many copies of the peptide at random points along the chain, producing sub-chains of every possible length, then measure the mass-charge of every sub-chain. The resulting set of mass-charges encodes the sequence, but noisily and incompletely — decoding the amino-acid order directly from that pattern is ill-posed because many candidate sequences fit any partial set of sub-chain masses. Reformulate as lookup against the known list of proteins in the organism, which fixes every peptide that could possibly exist (~10⁶ candidates). For each candidate, predict what its sub-chain mass-charges should be; filter the candidate set down to ~10¹ by demanding the intact-peptide mass match; score the survivors by how well their predicted sub-chain masses overlap with the observation; take the best. Bound the error rate by running the same pipeline against a catalog of fake (reversed) sequences and tuning the score threshold so fake matches stay below 1% of accepted matches — a calibrated null check standing in for ground truth.
In cases where the peptide sequence is unknown, de novo sequencing is performed.
From the native eGFP mass spectrum, discern the charge state of the peak at ~2800 m/z. What is the charge state? How can you tell?
Homework: Waters Part III — Peptide Mapping (Primary Structure)
Count the Lysines (K) and Arginines (R) in the eGFP sequence; circle or highlight them.
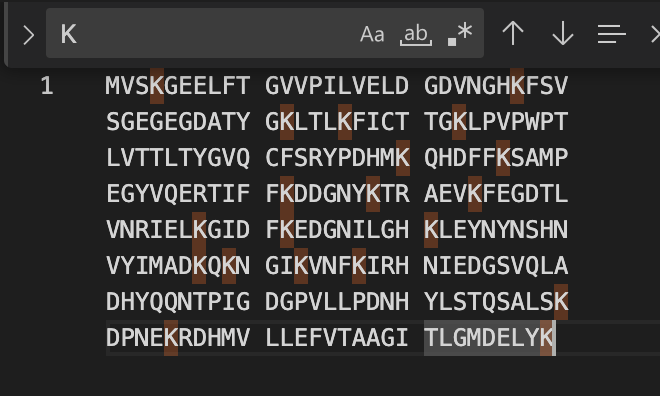
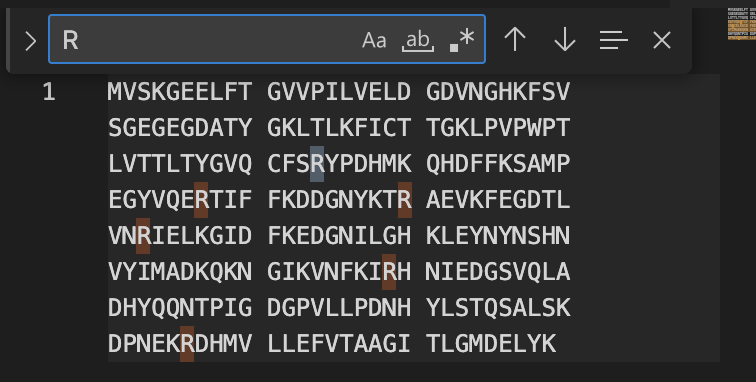
How many peptides will be generated from tryptic digestion?
Navigate to the ExPASy PeptideMass tool.
Copy/paste the eGFP sequence.
Replicate the parameters shown in Figure 4.
Report the number of peptides generated.
18
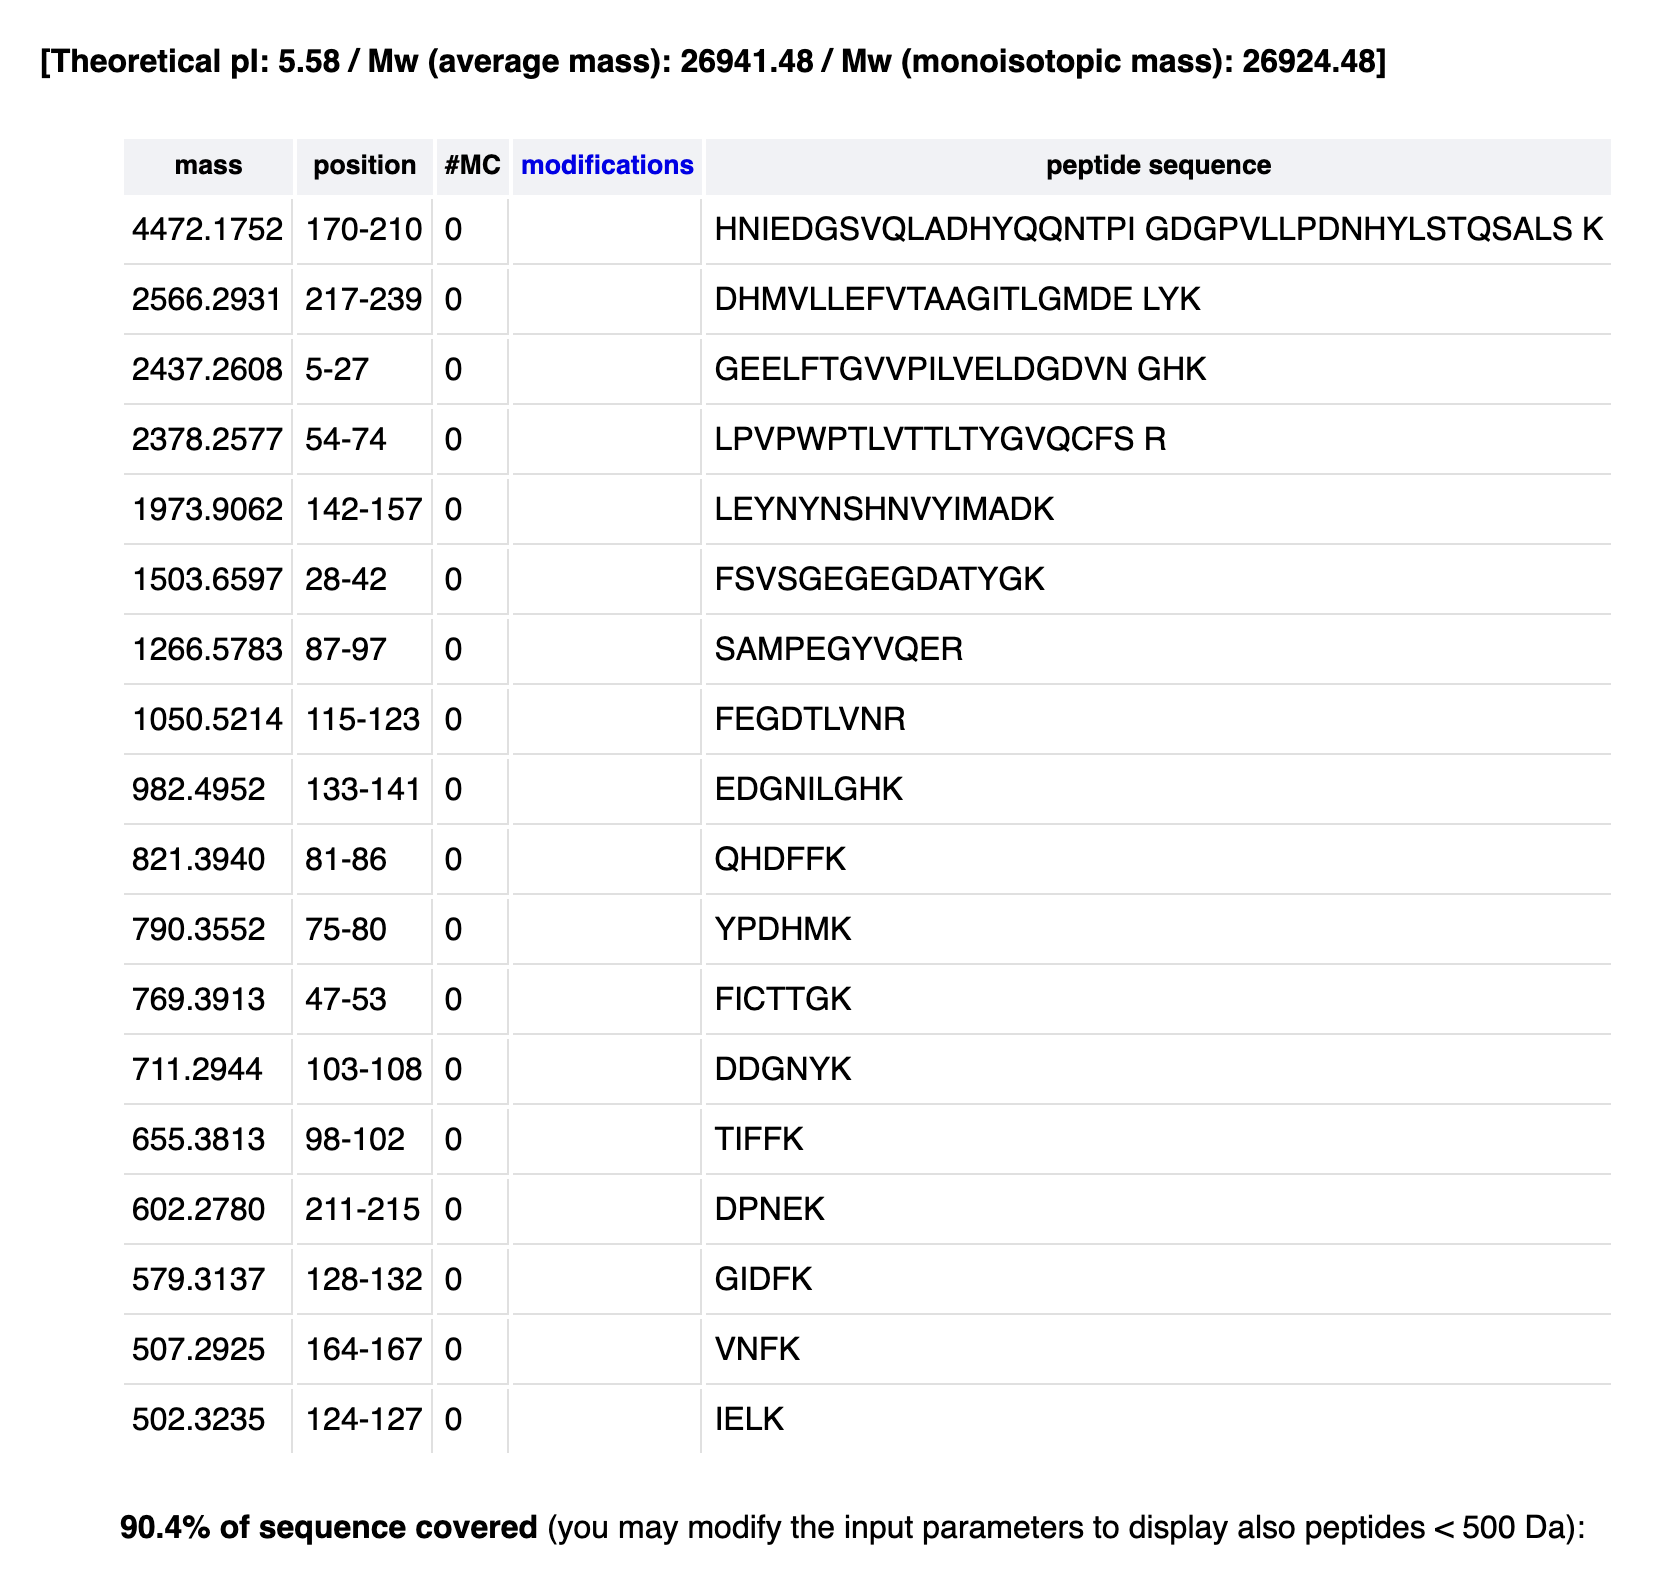
Based on the LC-MS peptide map data, count the chromatographic peaks between 0.5–6 minutes (>10% relative abundance).
23-25
Does the peak count match the predicted peptide number? Are there more or fewer peaks?
There are more peaks!
Identify the m/z of the peptide in Figure 5b. Determine the charge (z) of the most abundant charge state using isotope separation. Calculate the singly charged peptide mass [M+H]⁺.
Most abundant/intense peak: 525.76712
Note: MW is the neutral protein’s mass (nothing added); m is the mass of the ion — i.e., the protein plus the z protons it picked up to get charged.
Identify the peptide by comparing to expected masses from the PeptideMass tool. Calculate the mass accuracy in ppm.
HAHA NICE!
Peptide is the sequence FEGDTLVNR
What percentage of the sequence is confirmed by peptide mapping (see Figure 6)?
88%?
Homework: Waters Part IV — Oligomers
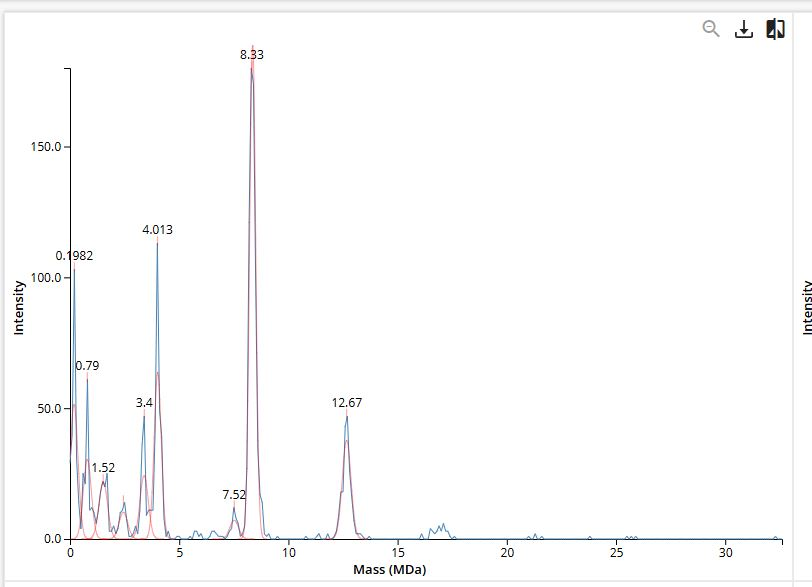
Using charge detection mass spectrometry data and known subunit masses (Table 1), identify the locations of:
“FU” = functional unit (each KLH subunit is built from ~7–8 globular FU domains of ~50 kDa each); “decamer” = 10 subunits assembled into a ring. So:
7FU Decamer = 10 KLH2 subunits (each with 7 FUs) → ~3.5 MDa
8FU Didecamer = 20 KLH1 subunits (8 FUs each) in 2 stacked rings → ~8 MDa
8FU 3-Decamer = 30 KLH1 subunits in 3 stacked rings → ~12 MDa
8FU 4-Decamer = 40 KLH1 subunits in 4 stacked rings → ~16 MDa
7FU Decamer - 3.4
8FU Didecamer - 8.33
8FU 3-Decamer - 12.67
8FU 4-Decamer - predicted 16 MDa, not labelled explicitly on chart
Homework: Waters Part V — Did I Make GFP?
Fill in the table with lab-acquired data from the Waters Immerse Lab showing theoretical vs. observed molecular weight with PPM mass error.
N/A - no not have access to node / lab.