Week 10 HW: Imaging and Measurement
Final Project
- Please identify at least one (ideally many) aspect(s) of your project that you will measure. It could be the mass or sequence of a protein, the presence, absence, or quantity of a biomarker, etc.
- Please describe all of the elements you would like to measure, and furthermore describe how you will perform these measurements.
- What are the technologies you will use (e.g., gel electrophoresis, DNA sequencing, mass spectrometry, etc.)? Describe in detail.
My final project is inherently related to measurement, as it is going to be a measurement instrument. The main aspect that I will measure for my final project is therefore its core purpose — measuring testosterone levels in sweat. To do that, I will use either cell-free systems, bacterial expression, or an aptamer-based method to create a fluorescent or electrical signal that correlates with the levels of testosterone in the sample.
Moreover, I would measure the following:
- The length of the different DNA fragments I designed for the project, using gel electrophoresis, to make sure they are consistent with my design.
- The time it takes for the sensor I create to detect the level of testosterone, or in earlier versions, the time it takes to produce a reliable signal that indicates that there is testosterone in the sample.
- The sensitivity and accuracy of the sensor - specifically, the range of testosterone concentrations it can reliably detect, its limit of detection, and how consistent the signal is across repeated measurements. This will help me evaluate how precise and usable the system is in practice.
- The specificity of the sensor - testing whether the system responds uniquely to testosterone versus similar molecules (e.g., other hormones in sweat), to ensure that the signal is not due to interference.
Additionally, this is a measurement that would be done further down the line, but is very much needed: I will measure both the levels of testosterone in sweat using my sensor, and the levels of testosterone in the blood using traditional blood tests, to create a correlation between the two (and verify that it exists). This will allow me to deduce what certain levels of testosterone in sweat, detected by my sensor, actually mean in terms of blood levels, and thereby validate the method.
Waters Part I — Molecular Weight
- Based on the predicted amino acid sequence of eGFP (see below) and any known modifications, what is the calculated molecular weight? You can use an online calculator like the one at https://web.expasy.org/compute_pi/
Answer: Using the full predicted eGFP sequence provided, including the LE linker and C-terminal His-purification tag, the calculated molecular weight is 28,006.60 Da, or approximately 28.01 kDa. The theoretical pI is 5.90.
- Calculate the molecular weight of the eGFP using the adjacent charge state approach described in the recitation.
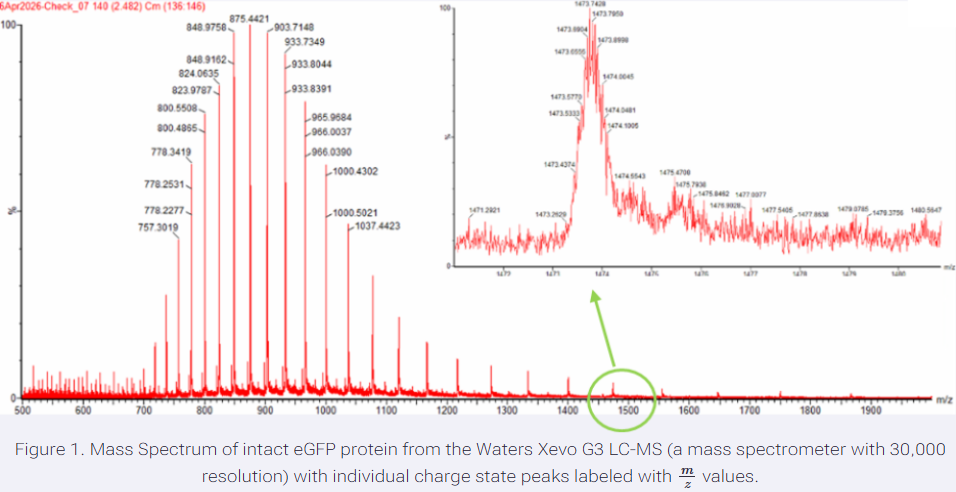
Answer: I selected two adjacent peaks from the intact LC-MS spectrum: m/z = 875.4421 and m/z = 903.7148. Using the adjacent charge state approach, these correspond approximately to charge states z = 32 and z = 31, respectively.
Using the relationship between m/z, MW, and z, the calculated molecular weight is approximately 27,982 Da, or 27.98 kDa.
Compared to the theoretical molecular weight from Question 1, 28,006.60 Da, the percent error is:
Accuracy = |27,982 - 28,006.60| / 28,006.60 = 0.00088 ≈ 0.088%
So, the experimental molecular weight is very close to the theoretical molecular weight.
- Can you observe the charge state for the zoomed-in peak in the mass spectrum for the intact eGFP? If yes, what is it? If no, why not?
Answer: No, the charge state cannot be directly observed from the zoomed-in peak alone. The zoomed-in peak shows the isotope pattern of one charge state, but the charge state is determined by comparing the spacing between adjacent charge-state peaks in the full spectrum. Therefore, the zoomed-in peak helps show isotopic resolution, but we need the full charge envelope to assign the charge state confidently.
Waters Part II — Secondary/Tertiary structure
- Based on learnings in the lab, please explain the difference between native and denatured protein conformations. For example, what happens when a protein unfolds? How is that determined with a mass spectrometer? What changes do you see in the mass spectrum between the native and denatured protein analyses (Figure 2)?
Answer: In the native state, the protein stays folded in its natural 3D structure. In the denatured state, the protein unfolds due to conditions such as solvent composition and pH. When the protein unfolds, more amino acids become exposed to the solvent, which allows the protein to pick up more charges during electrospray ionization.
This can be seen in the mass spectrum by the different charge state distributions. The denatured eGFP spectrum shows many peaks across a wider m/z range, corresponding to higher charge states. In contrast, the native eGFP spectrum has fewer peaks at higher m/z values, corresponding to lower charge states, because the folded protein has fewer exposed sites.
The molecular weight of the protein stays approximately the same, but the charge state distribution changes significantly between the native and denatured conditions.
- Zooming into the native mass spectrum of eGFP from the Waters Xevo G3 QTof MS (see Figure 3), can you discern the charge state of the peak at ~2800 m/z? What is the charge state? How can you tell?
Answer: Yes. The charge state can be determined from the spacing between the isotope peaks in the zoomed-in spectrum. For a protein ion, the spacing between isotope peaks is approximately 1/z.
For the peak around 2800 m/z, the charge state is approximately z = 10, because the molecular weight of eGFP is around 28,000 Da, and:
28,000 / 10 ≈ 2800 m/z
So the peak at ~2800 m/z corresponds to the 10+ charge state.
Waters Part III — Peptide Mapping - primary structure
- How many Lysines (K) and Arginines (R) are in eGFP? Please circle or highlight them in the eGFP sequence given in Waters Part I question 1 above.
Answer: There are 20 Lysines (K) and 6 Arginines (R) in the eGFP sequence.
MVSKGEELFTG VVPILVELDG DVNGHKFSVS GEGEGDATYG KLTLKFICTT GKLPVPWPTL VTTLTYGVQC FSRYPDHMKQ HDFFKSAMPE GYVQERTIFF KDDGNYKTRA EVKFEGDTLV NRIELKGIDF KEDGNILGHK LEYNYNSHNV YIMADKQKNG IKVNFKIRHN IEDGSVQLAD HYQQNTPIGD GPVLLPDNHY LSTQSALSKD PNEKRDHMVL LEFVTAAGIT LGMDELYKLE HHHHHH
- How many peptides will be generated from tryptic digestion of eGFP?
Answer: Using the ExPasy PeptideMass tool with trypsin selected and allowing 0 missed cleavages, the eGFP sequence is predicted to generate 27 tryptic peptides total.
Out of these, 19 peptides have masses greater than 500 Da and are therefore more likely to be detected in the LC-MS analysis under the selected settings. The remaining peptides are very small and may fall below the practical detection range.
The predicted sequence coverage for the detected peptides is 90.7%.
- Based on the LC-MS data for the Peptide Map data generated in lab (please use Figure 5a as a reference) how many chromatographic peaks do you see in the eGFP peptide map between 0.5 and 6 minutes? You may count all peaks that are >10% relative abundance.
Answer: Between 0.5 and 6 minutes, there are approximately 18 chromatographic peaks with greater than 10% relative abundance visible in the eGFP peptide map TIC chromatogram.
- Assuming all the peaks are peptides, does the number of peaks match the number of peptides predicted from question 2 above? Are there more peaks in the chromatogram or fewer?
Answer: The numbers are close, but not exactly the same. In question 2, 19 peptides were predicted to be above 500 Da, and in the chromatogram, I counted about 18 peaks above 10% relative abundance between 0.5 and 6 minutes.
This is slightly fewer than the predicted number, but it still makes sense. Some peptides may not be detected clearly, some peptides may co-elute and appear as one chromatographic peak, and some smaller or lower-abundance peptides may fall below the cutoff. Also, if counting smaller peaks below 10%, there would be more peaks in the chromatogram.
Overall, the observed number of peaks is reasonably consistent with the predicted number of detectable tryptic peptides.
- Identify the mass-to-charge (m/z) of the peptide shown in Figure 5b. What is the charge (z) of the most abundant charge state of the peptide? Calculate the mass of the singly charged form of the peptide ([M+H]+) based on its m/z and z.
Answer: The most abundant peptide peak is at m/z = 525.76712.
The isotope peaks are separated by about 0.5 m/z, which means the charge state is z = 2 because isotope spacing is approximately 1/z.
Assuming the relationship for electrospray ionization:
:contentReference[oaicite:0]{index=0}
and using z = 2, the singly charged peptide mass is::
[M+H]+ = (525.76712 × 2) - 1.0073 = 1050.53 Da
So, the singly charged mass of the peptide is approximately 1050.53 Da.
- Identify the peptide based on comparison to expected masses in the PeptideMass tool. What is mass accuracy of measurement? Please calculate the error in ppm.
Answer: Based on the PeptideMass results, the peptide with a predicted mass closest to the measured value is FEGDTLVNR, with a theoretical [M+H]+ mass of 1050.5214 Da.
From Figure 5b, the calculated experimental singly charged mass was approximately 1050.53 Da.
The mass error is:
ppm error = |1050.53 - 1050.5214| / 1050.5214 × 10⁶ ≈ 8.2 ppm
So, the peptide is most likely FEGDTLVNR, and the mass accuracy is approximately 8 ppm.
- What is the percentage of the sequence that is confirmed by peptide mapping? (see Figure 6)
Answer: Based on Figure 6, the peptide mapping analysis confirmed 88% sequence coverage of the eGFP protein.
Waters Part IV — Oligomers
- Using the known masses of the polypeptide subunits for KLH, identify where the following oligomeric species are on the spectrum shown from the CDMS: 7FU Decamer, 8FU Didecamer, 8FU 3-Decamer, and 8FU 4-Decamer.
Answer: To identify the oligomeric species, I calculated the expected mass by multiplying the mass of each subunit by the number of subunits in the oligomer, and then compared it to the peaks in the CDMS spectrum.
| Oligomeric Species | Calculation | Expected Mass | Approximate Peak in Spectrum |
|---|---|---|---|
| 7FU Decamer | 10 × 340 kDa | 3.4 MDa | ~3.4 MDa |
| 8FU Didecamer | 20 × 400 kDa | 8.0 MDa | ~8.33 MDa |
| 8FU 3-Decamer | 30 × 400 kDa | 12.0 MDa | ~12.67 MDa |
| 8FU 4-Decamer | 40 × 400 kDa | 16.0 MDa | weak peak/feature around ~16–17 MDa |
Overall, the expected masses match reasonably well with the main peaks in the CDMS spectrum, although the experimental peaks are slightly shifted from the simple calculated masses.
Waters Part V — Did I make GFP?
| Property | Theoretical | Measured from LC-MS | PPM Error |
|---|---|---|---|
| eGFP molecular weight (kDa) | 28.0066 | ~27.984 | ~880 ppm |
| Sequence coverage from peptide mapping | 90.7% | 88% | — |
| Peptide FEGDTLVNR [M+H]+ (Da) | 1050.5214 | 1050.53 | ~8 ppm |