Homework Questions from Professor Jacobson:
Nature’s machinery for copying DNA is called polymerase. What is the error rate of polymerase? How does this compare to the length of the human genome. How does biology deal with that discrepancy? Ans: DNA polymerase has an inherent error rate of approximately 1 in 10⁶ bases. Given the human genome size of about 3.2 billion base pairs, this would lead to thousands of mutations each time a cell divides if left uncorrected. To maintain genomic stability, cells use a multi-layered error-correction system. First, DNA polymerase performs immediate proofreading through its exonuclease activity. This is followed by post-replication mismatch repair (MMR) mechanisms. Together, these processes greatly enhance replication accuracy, reducing the final error rate to roughly 1 in 10⁹–10¹⁰, meaning fewer than one error typically occurs per genome duplication.
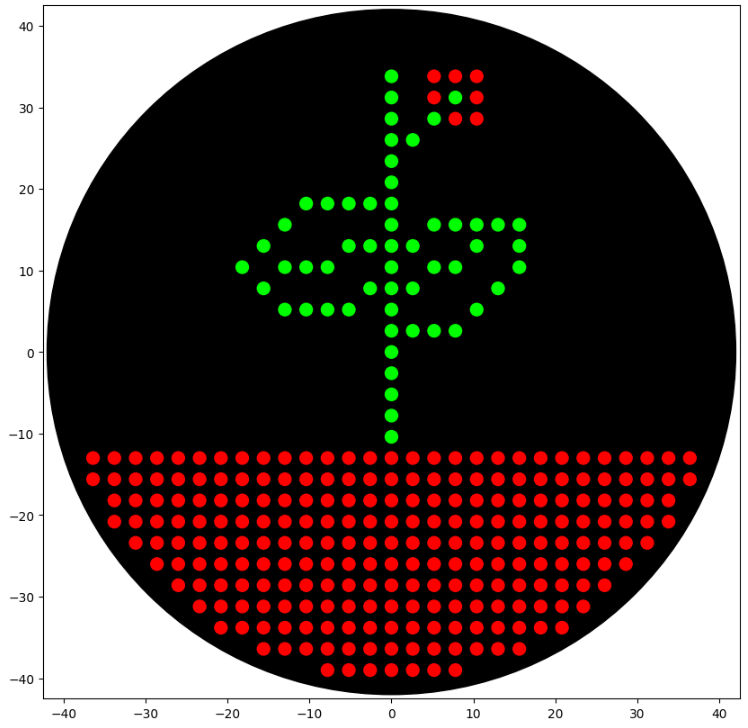
My art for Opentrons Artwork
Output of the python script.
PAPER - Semiautomated Production of Cell-Free Biosensors
Journal: ACS Synthetic Biology (2025)
PMID: 40073441
Biosensors are biological systems that detect specific chemicals for example, if a substance is present, they might change color or glow. These can be used for:
Part A. Conceptual Questions
How many amino acid molecules are in 500 g of meat? Ans: Average amino acid ≈ 100 Daltons (100 g/mol)
 500 g ÷ 100 g/mol = 5 moles

 1 mole = 6.022 × 10²³ molecules

 So,

 5 × 6.022 × 10²³ ≈ 3 × 10²⁴ amino acid molecules
Why do humans eat beef but do not become a cow, eat fish but do not become fish? Ans: When we eat beef or fish, our body breaks proteins into amino acids during digestion. Then we rebuild them into human proteins, not cow proteins.
Part A: SOD1 Binder Peptide Design (From Pranam) Superoxide dismutase 1 (SOD1) is a cytosolic antioxidant enzyme that converts superoxide radicals into hydrogen peroxide and oxygen. In its native state, it forms a stable homodimer and binds copper and zinc.
Mutations in SOD1 cause familial Amyotrophic Lateral Sclerosis (ALS). Among them, the A4V mutation (Alanine → Valine at residue 4) leads to one of the most aggressive forms of the disease. The mutation subtly destabilizes the N-terminus, perturbs folding energetics, and promotes toxic aggregation.
Assignment: DNA Assembly
Answer these questions about the protocol in this week’s lab:
What are some components in the Phusion High-Fidelity PCR Master Mix and what is their purpose? Ans:
Component Purpose Phusion High-Fidelity DNA Polymerase Synthesizes new DNA strands during PCR. It has proofreading activity, giving very low error rates and high fidelity. dNTPs (deoxynucleotide triphosphates) Building blocks (A, T, G, C) used to create new DNA strands. HF or GC Buffer Maintains the correct chemical environment (pH and salt conditions) for efficient enzyme activity. GC buffer helps amplify GC-rich templates. MgCl₂ (Magnesium chloride) Essential cofactor required for DNA polymerase activity. Helps the enzyme function properly. DMSO (in some formulations) Helps denature GC-rich DNA and reduces secondary structures, improving amplification of difficult templates. Water Used as the reaction medium to dissolve and mix all components. What are some factors that determine primer annealing temperature during PCR? Ans: Some important factors that determine the primer annealing temperature during PCR are:
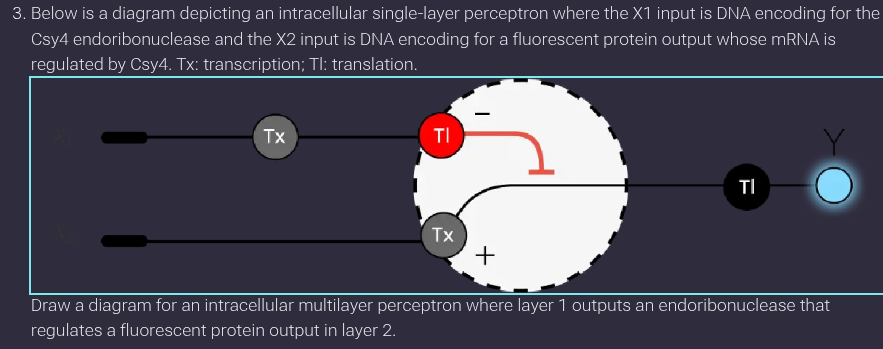
Assignment Part 1: Intracellular Artificial Neural Networks (IANNs)
What advantages do IANNs have over traditional genetic circuits, whose input/output behaviors are Boolean functions?
Traditional genetic circuits mostly behave like Boolean logic gates (ON/OFF). Intracellular Artificial Neural Networks (IANNs) are more flexible.
Advantages:
a. Analog (continuous) behavior
-> Traditional circuits: only 0 or 1 (OFF/ON)
Homework Part A: General and Lecturer-Specific Questions
Explain the main advantages of cell-free protein synthesis over traditional in vivo methods, specifically in terms of flexibility and control over experimental variables. Name at least two cases where cell-free expression is more beneficial than cell production.
Ans: Cell-free protein synthesis offers significant advantages over in vivo methods due to its open and controllable nature. It allows direct manipulation of reaction components, precise control over parameters such as pH and substrate concentration, and eliminates constraints related to cell viability. As a result, all system resources can be directed toward protein production, enabling rapid optimization and high-throughput experimentation.
Homework: Final Project
For your final project:
Please identify at least one (ideally many) aspect(s) of your project that you will measure. It could be the mass or sequence of a protein, the presence, absence, or quantity of a biomarker, etc.
Please describe all of the elements you would like to measure, and furthermore describe how you will perform these measurements.
What are the technologies you will use (e.g., gel electrophoresis, DNA sequencing, mass spectrometry, etc.)? Describe in detail.
Part A: The 1,536 Pixel Artwork Canvas | Collective Artwork
Contribute at least one pixel to this global artwork experiment before the editing ends on Sunday 4/19 at 11:59 PM EST. A personalized URL was sent to the email address associated with your Discourse account, and you can discuss the artwork on the Discourse.
If you did not have a chance to contribute, it’s okay, just make sure you become a TA this fall! 😉
Subsections of Homework
Week 1 HW: Principles and Practices
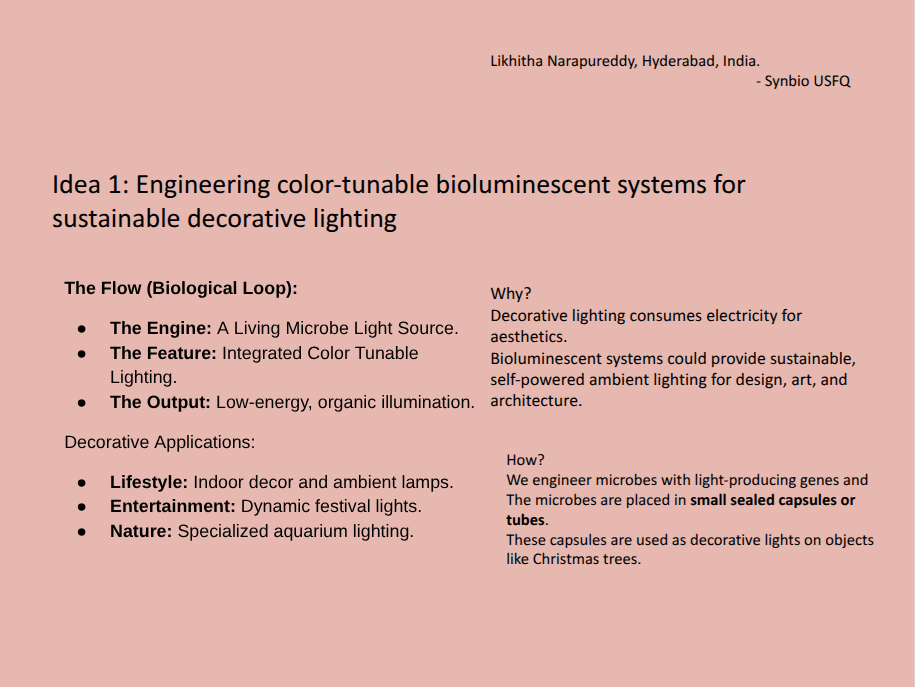
A Living Anti-Corrosion System for Ocean Infrastructure:
I propose a biologically engineered, self-healing anti-corrosion coating for offshore and ocean-energy infrastructure (tidal turbines, wave energy converters, offshore wind foundations).The system uses genetically engineered, non-pathogenic marine bacteria embedded in a sealed, porous coating. These microbes are designed to:
Detect early corrosion signals (pH drop, Fe²⁺ ion release)
Respond by precipitating protective minerals (e.g., calcium carbonate)
Neutralize corrosive microenvironments
Signal early warnings before structural failure
Governance Policy Goals
To ensure this application contributes to an ethical future and prevents harm, governance should pursue the following goals:
Ensure safety and security:
a) Prevent environmental release or misuse of engineered organisms and
b) Avoid ecological disruption or biosecurity risks
Promote constructive and beneficial use
a) Direct innovation toward public-interest infrastructure (renewable energy, climate resilience) and
b)Prevent purely extractive or environmentally harmful deployment
Action 1:
Mandatory Biological Containment & Kill-Switch Standards
Purpose:
What is done now:
Chemical anti-corrosion coatings are regulated mainly for toxicity, not biological behavior.
Proposed change:
Require all engineered microbes used in marine infrastructure to include:
Maintain transparency and public trust
Design : Needed - International biosafety certification for “contained-use marine bio-systems”
Assumptions: Kill switches will function reliably in harsh marine environments
What could be wrong:Evolutionary escape mechanisms
Action 2:
Environmental impact and Community Consent framework
Purpose
What is done now:
Environmental Impact Assessments (EIAs) often focus on physical structures, not biological agents.
Proposed change:
Require Bio-Environmental Impact Assessments (Bio-EIAs) that include:
Long-term microbial ecosystem modeling
Transparent disclosure of organism function
Consultation with coastal and fishing communities
Design: Needed- Continuous post-deployment monitoring
Assumptions: Communities can meaningfully engage with technical information
What could be wrong:Information asymmetry and monitoring fatigue over time
Action 3:
Restricted Use Licensing (Purpose-Bound Deployment)
Purpose
What is done now:
Biotechnologies often spread from research into unintended domains (e.g., CRISPR kits, dual-use chemicals).
Proposed change:
License this technology only for defined applications:
Renewable energy infrastructure
Public maritime assets
Design: Needed- Purpose-specific approval, audits of deployment sites and clear penalties for misuse
Assumptions: Clear boundaries between “civil” and “non-civil” uses exist
What could be wrong: Commercial influence to expand scope
Next, score (from 1-3 with, 1 as the best, or n/a) each of your governance actions against your rubric of policy goals. The following is one framework but feel free to make your own:
Governance Action
Safety & Security
Constructive & Beneficial Uses
Option 1: Bio-containment standards
1
2
Option 2: Voluntary guidelines
3
3
Option 3: Impact & consent reviews
2
1
Based on the scores, I would prioritize Option 1 (Bio-containment standards) together with Option 3 (Impact and community consent reviews).
Option 1 comes first because safety has to be the foundation. When we introduce engineered biological systems into the ocean, the biggest risk is that something spreads, mutates, or behaves in ways we didn’t expect. Strong bio-containment rules like built-in kill switches or limits on survival outside controlled conditions help prevent accidents before they happen. Without this layer, even well-intended projects could cause long-term environmental harm.
Option 3 is equally important because it helps make sure the technology is actually used for good. Environmental impact checks and community consent force developers to think beyond the lab and consider real ocean ecosystems and the people who depend on them. This option scored highest for promoting constructive and beneficial uses because it guides innovation toward solutions that are socially and environmentally responsible, not just technically impressive.
I would not rely on Option 2 (Voluntary guidelines) on its own. While voluntary rules can encourage early innovation, they are easy to ignore and don’t offer strong protection when risks are high. For ocean systems, where damage can be difficult or impossible to reverse, voluntary measures are not enough.
Overall, combining strong safety rules with environmental and community oversight offers the most realistic and responsible way to move forward. It protects the ocean while still allowing beneficial innovation to happen.
Assignment (Final Project) – Due as part of your Final Project presentation (not Feb 10)
I mentioned the bio-ethical concerns and strategies of my project in my Individual project documentation.
References:
Jin, H., Wang, J., Tian, L., Gao, M., Zhao, J., & Ren, L. (2022). Recent advances in emerging integrated antifouling and anticorrosion coatings. Materials & Design, 213, 110307. https://doi.org/10.1016/j.matdes.2021.110307
Li, Y., & Ning, C. (2019). Latest research progress of marine microbiological corrosion and bio-fouling, and new approaches of marine anti-corrosion and anti-fouling. Bioactive Materials, 4, 189–195. https://doi.org/10.1016/j.bioactmat.2019.04.003
Week 2 pre HW: DNA Read, Write and Edit
Homework Questions from Professor Jacobson:
Nature’s machinery for copying DNA is called polymerase. What is the error rate of polymerase? How does this compare to the length of the human genome. How does biology deal with that discrepancy?
Ans: DNA polymerase has an inherent error rate of approximately 1 in 10⁶ bases. Given the human genome size of about 3.2 billion base pairs, this would lead to thousands of mutations each time a cell divides if left uncorrected.
To maintain genomic stability, cells use a multi-layered error-correction system. First, DNA polymerase performs immediate proofreading through its exonuclease activity. This is followed by post-replication mismatch repair (MMR) mechanisms. Together, these processes greatly enhance replication accuracy, reducing the final error rate to roughly 1 in 10⁹–10¹⁰, meaning fewer than one error typically occurs per genome duplication.
How many different ways are there to code (DNA nucleotide code) for an average human protein? In practice what are some of the reasons that all of these different codes don’t work to code for the protein of interest?
Ans: An average human protein (~1036 bp) can be coded by many synonymous codons because the genetic code is redundant.In practice, many of these codes fail because they can create secondary structures that block translation, contain sequences that trigger RNA cleavage, or use “rare” codons that the host cell cannot efficiently process.
Homework Questions from Dr. LeProust:
What’s the most commonly used method for oligo synthesis currently?
Ans: The phosphoramidite method is currently the most widely used chemistry for oligonucleotide synthesis. It involves a four-step cyclic process: coupling, capping, oxidation, and deblocking—to add nucleotides one by one onto a solid support, such as Controlled Pore Glass (CPG) or silicon chips.
Why is it difficult to make oligos longer than 200nt via direct synthesis?
Ans: Oligonucleotide synthesis occurs by adding one nucleotide at a time, and each step has a small probability of error. As the length increases, these errors accumulate, reducing the yield of correct full-length oligos. In addition, longer oligos are more prone to incomplete reactions and strand loss during synthesis.
Why can’t you make a 2000bp gene via direct oligo synthesis?
Ans: Directly synthesizing a 2000 bp gene is not feasible in practice. Errors accumulate with each step, resulting in low yield and incorrect sequences. Hence, long genes are constructed by assembling shorter, accurately synthesized oligos and then applying error-correction methods.
Homework Question from George Church:
The question choosed by me
[Using Google & Prof. Church’s slide #4] What are the 10 essential amino acids in all animals and how does this affect your view of the “Lysine Contingency”?
Ans: Essential amino acids in animals (10):
Histidine, Isoleucine, Leucine, Lysine, Methionine, Phenylalanine, Threonine, Tryptophan, Valine, and Arginine . These amino acids cannot be synthesized by animals and must be obtained from the diet
Lysine contingency : Lysine contingency refers to the idea that animal life is fundamentally dependent on external sources of lysine because animals cannot synthesize it themselves. Since lysine is an essential amino acid and often scarce in plant-based foods, growth and survival become contingent on its availability. This makes lysine a key metabolic bottleneck shaping nutrition, agriculture, and evolutionary constraints.
My views
The fact that lysine is an essential amino acid for all animals reinforces the idea of the lysine contingency—that animal life is inherently dependent on external biological systems (plants, microbes, or other animals) to supply lysine.We are all metabolically fasten to the external world, relying on a constant “supply chain” of plants and microbes to build our bodies.
Even when we think about survival in extreme environments, like a colony on Mars. Instead of trying to “fix” human genetics to make us self-sufficient which is ethically messy and biologically complex it makes far more sense to master the environment around us. By engineering hardy, high-yield, lysine-producing plants or yeast, we solve the survival puzzle without ever touching a human strand of DNA. It’s a strategy that’s not only safer and more flexible but one that respects our natural biology by simply ensuring the “bio-battery” we’ve always relied on never runs dry.
At last the lysine contingency shows that human survival depends on food systems, not genetic independence. For extreme environments, engineering plants and microbes is a safer and smarter solution than changing human biology or animal biology.
Reference
Jurassic Park Wiki. (n.d.). Lysine contingency. Fandom. Retrieved from
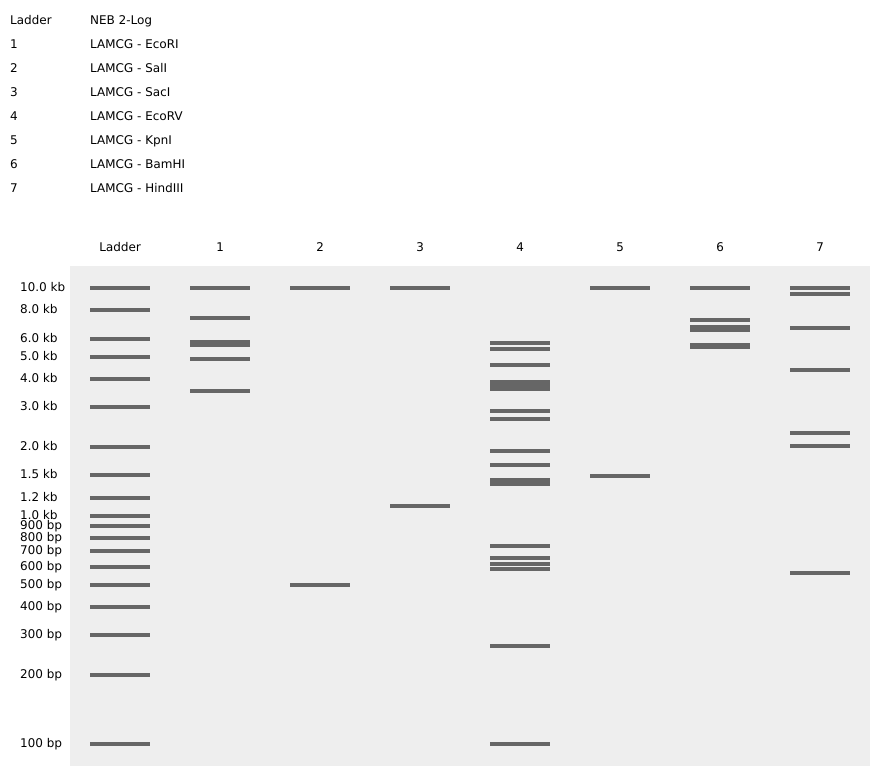
Simulating Restriction Enzyme Digestion with the following Enzymes:
.EcoRI
.HindIII
.BamHI
.KpnI
.EcoRV
.SacI
.SalI
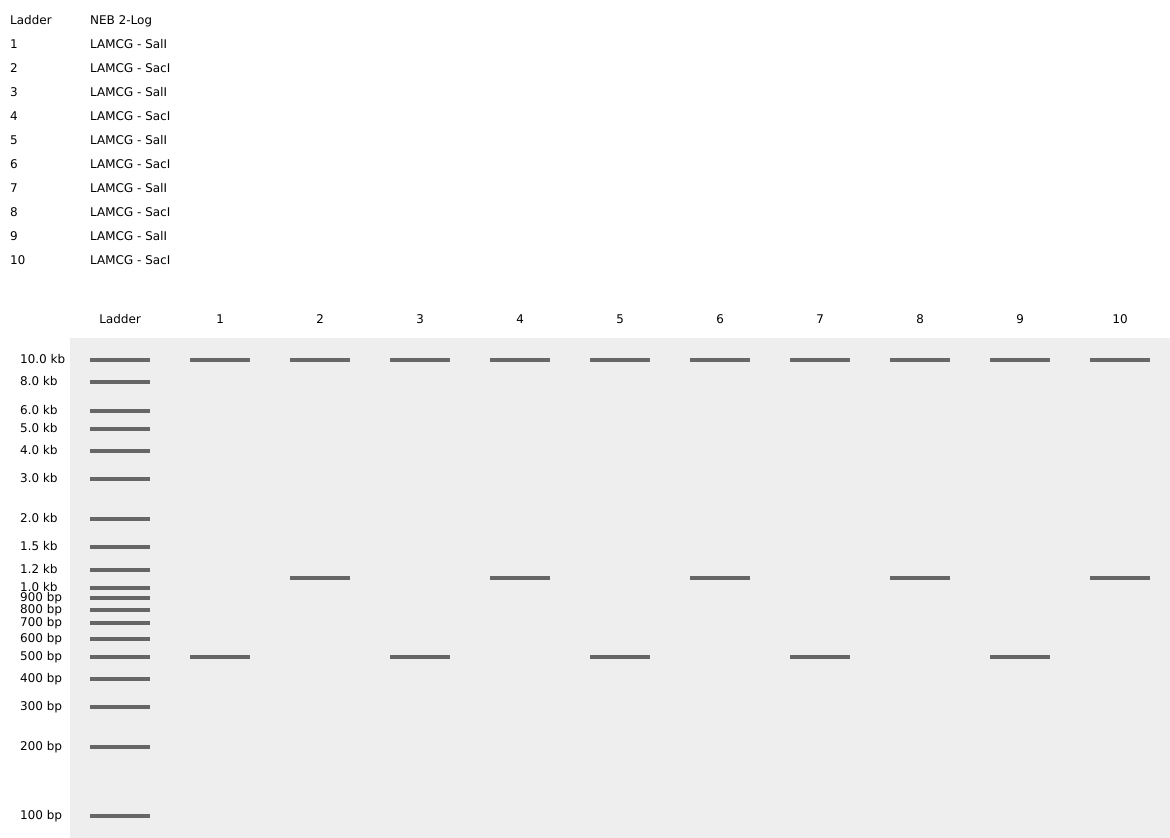
I had created a simple pattern in the style of Paul Vanouse’s Latent Figure Protocol artworks. The bands are arranged alternatively creating a horizontal alternative pattern.
Part 3: DNA Design Challenge
3.1. Choose your protein
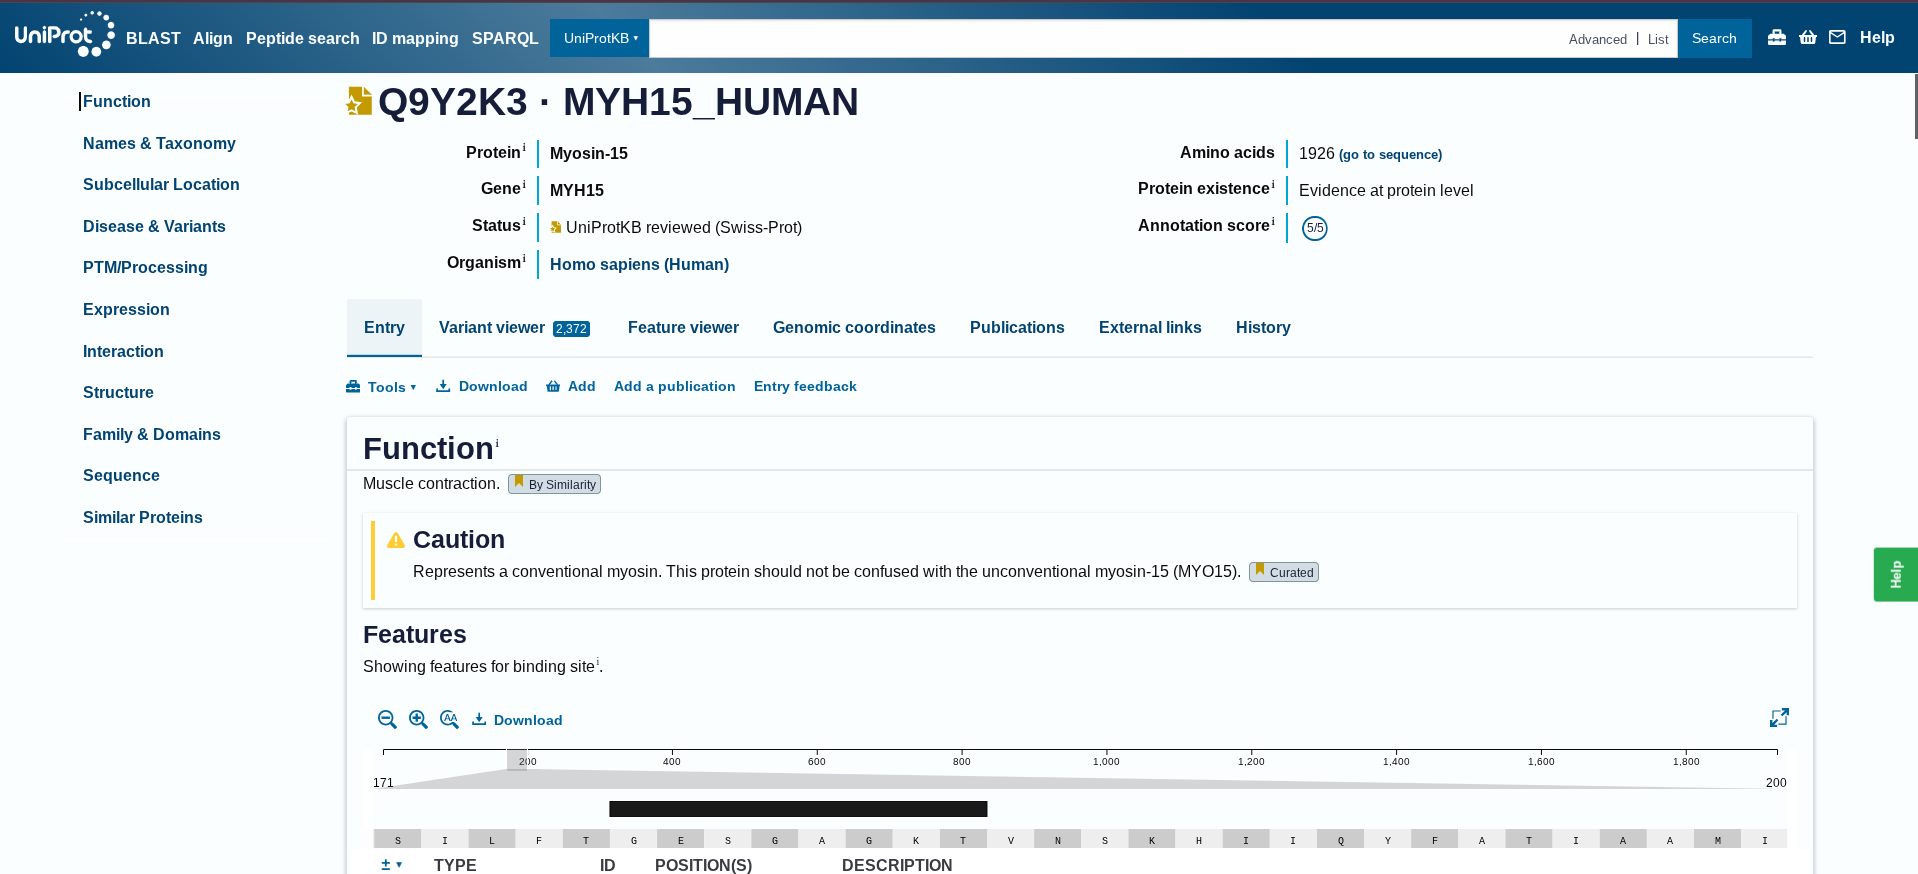
The protein I had selected is Myosin, which is a motor protein responsible for muscle contraction. It binds to the actin filaments and uses ATP to generate force. This force pulls the actin filaments inwards causes the muscle fibres to shorten and contract. I am particularly interested in understanding how myosin behaves in microgravity conditions, where mechanical loading is absent and muscle atrophy occurs rapidly.
I collected the protein from human at Uniprot- Q9Y2K3
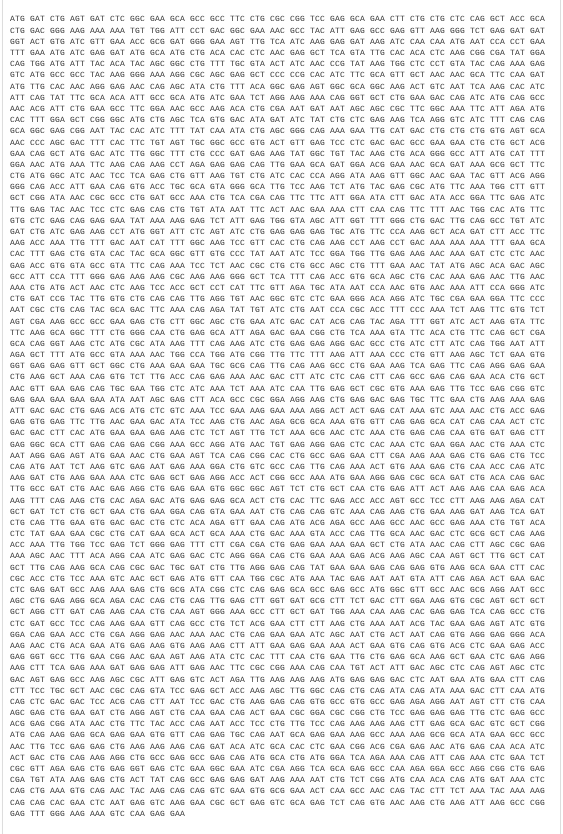
Below is the protein sequence of Myosin-15 extracted from Homo sapien
3.2. Reverse Translate: Protein (amino acid) sequence to DNA (nucleotide) sequence.
The Central Dogma gives us the framework to work backwards from a given protein sequence and infer the DNA sequence that the protein is derived from.
Reverse Translate results
Results for 1926 residue sequence “sp|Q9Y2K3|MYH15_HUMAN Myosin-15 OS=Homo sapiens OX=9606 GN=MYH15 PE=1 SV=6” starting “MDLSDLGEAA”
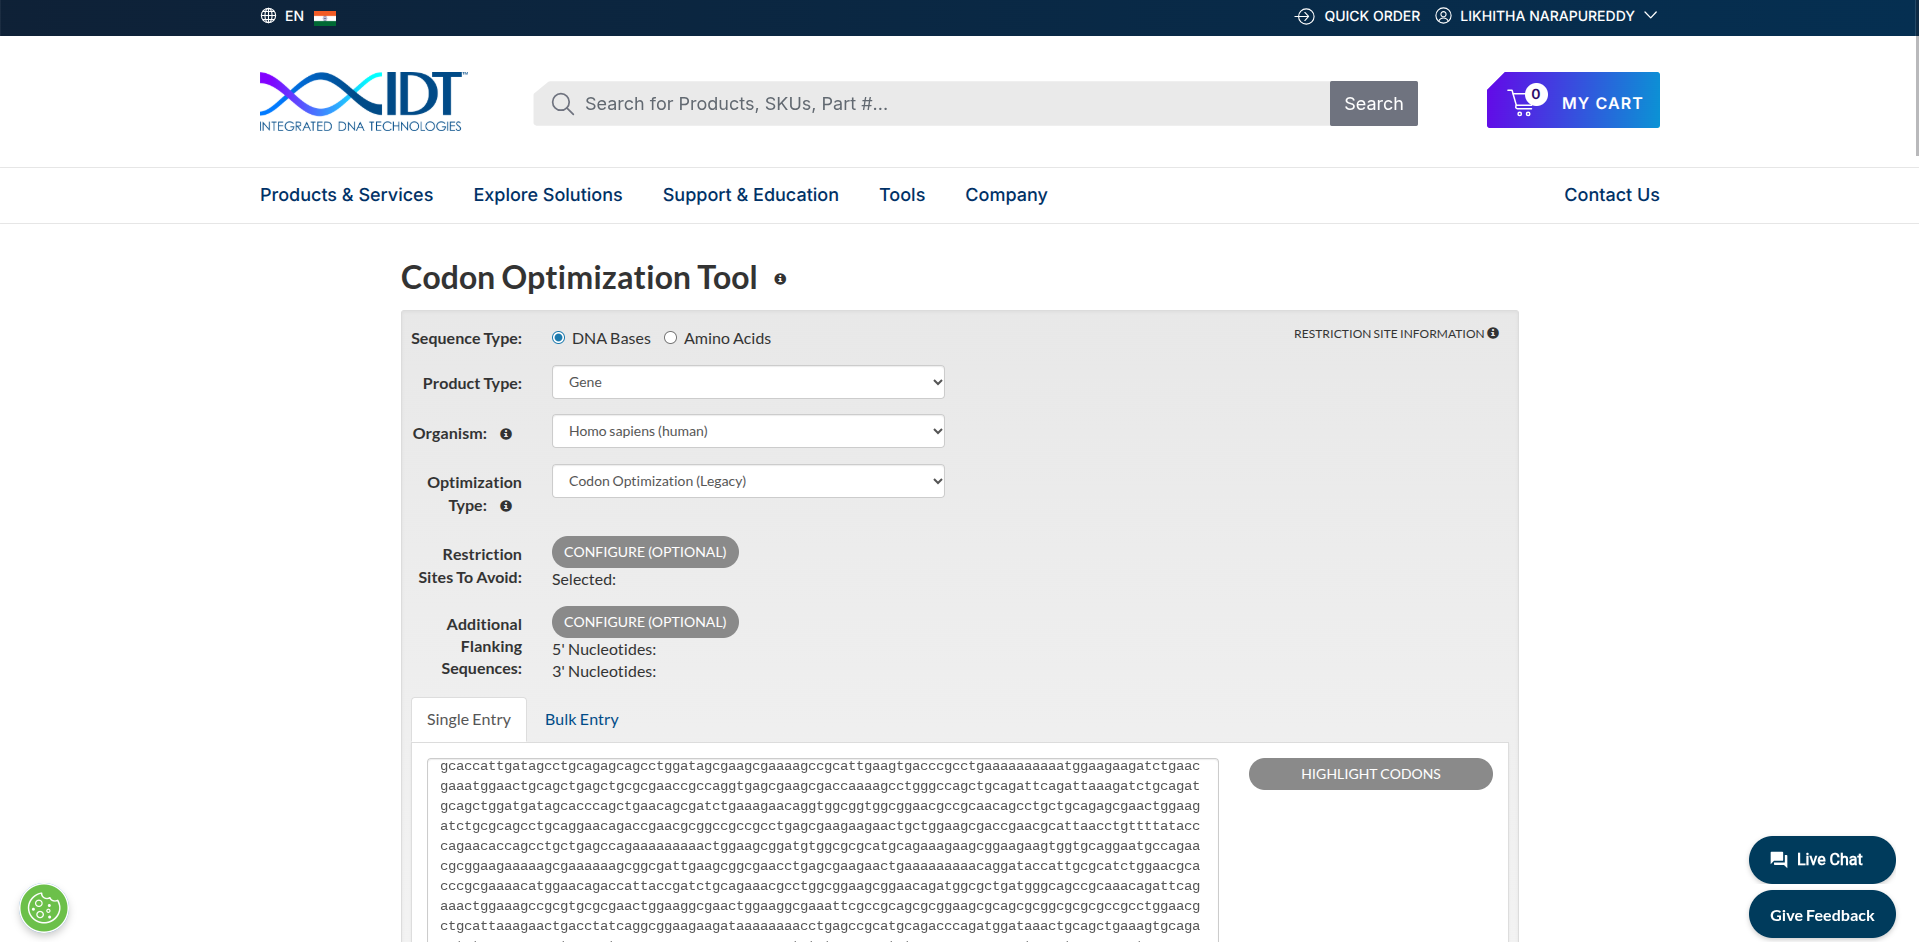
3.3. Codon optimization
Codon optimization is the process of changing the DNA sequence of a gene so that it is expressed more efficiently in a specific organism without changing the protein it produces.
I used https://www.idtdna.com/CodonOpt to do codon optimization. I used the reverse translated sequence from 3.2 step, because I was interested in that sequence. I want to continue the process and went for codon optimizaton of the reverse translated sequence.
Myosin protein DNA-seq with codon optimization
3.4. You have a sequence! Now what?
After obtaining the myosin protein sequence from UniProt and reverse translating it into a DNA coding sequence, the gene can be optimized for expression in a suitable host such as Escherichia coli or mammalian cells. The optimized gene is inserted into an expression plasmid under a strong promoter. Once introduced into the host cells, RNA polymerase transcribes the DNA into mRNA. The ribosome then translates the mRNA into the myosin polypeptide by reading codons and assembling the corresponding amino acids. After translation, the protein folds into its functional three-dimensional structure and can be purified using affinity chromatography techniques.
Part 4: Prepare a Twist DNA Synthesis Order
I successfully logged in both Twist and benchling.
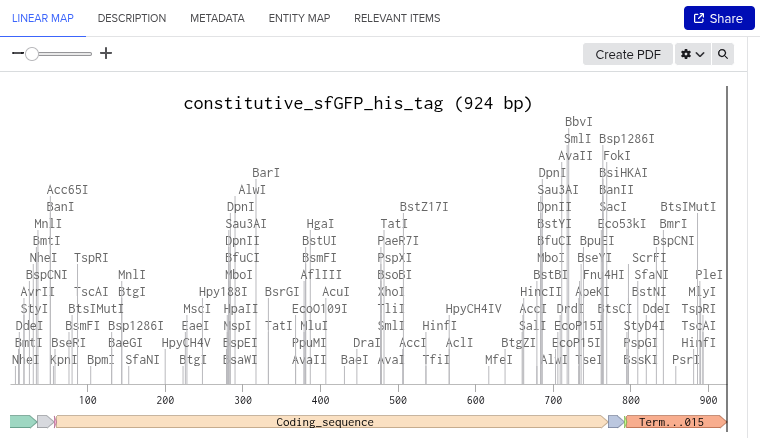
I followed the steps mentioned on the week2 homework site, mapped the sequence, and then completed the annotation(4.2)
Here are my results for the step 4.2:
The image depicts the linear map of the mapped sequence
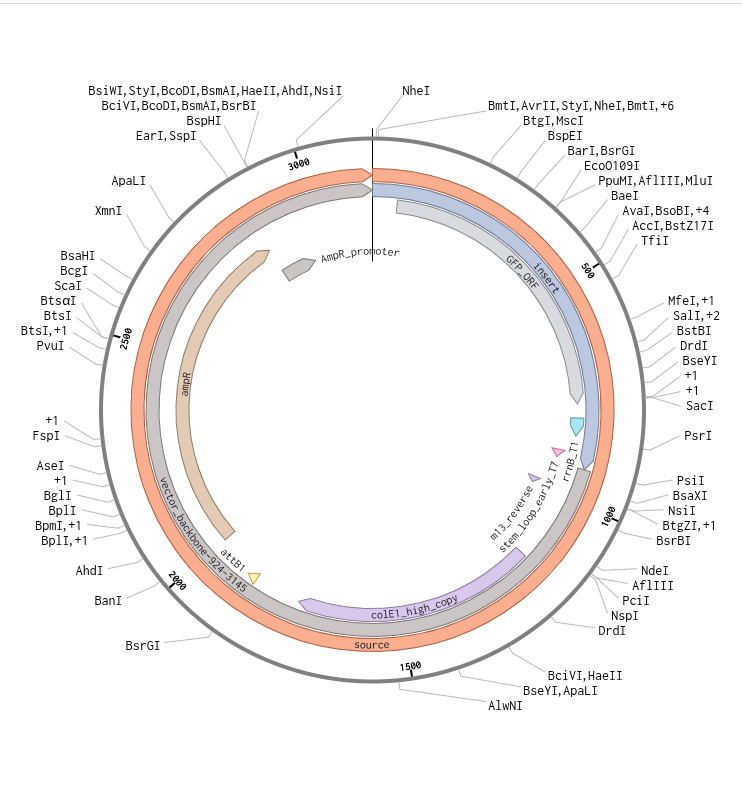
Subsequently, I uploaded the downloaded data in FASTA format to Twist. I selected the clonal genes option and uploaded the file.
I then chose the pTwist Amp High Copy vector and dowloaded the resulting sequence. Later, I uploaded the downloaded data from Twist into Benchling. Resulted in creation of a ‘beautiful’ plasmid construct
Part 5: DNA Read/Write/Edit
5.1 DNA Read
(i) What DNA would you want to sequence (e.g., read) and why?
For DNA sequencing, I would focus on microalgae and fungi that have strong potential for carbon capture and air purification. Species such as Chlorella vulgaris, Spirulina platensis, and Aspergillus niger are promising because they can absorb carbon dioxide, tolerate environmental stress, and in some cases degrade pollutants.
(ii) In lecture, a variety of sequencing technologies were mentioned. What technology or technologies would you use to perform sequencing on your DNA and why?
To perform sequencing, I would use Next-Generation Sequencing (NGS), specifically short-read sequencing developed by Illumina.
Also answer the following questions:
1.Is your method first-, second- or third-generation or other? How so?
This is a second-generation sequencing technology because it performs massively parallel sequencing of millions of DNA fragments simultaneously using sequencing-by-synthesis chemistry.
2.What is your input? How do you prepare your input (e.g. fragmentation, adapter ligation, PCR)? List the essential steps.
DNA extraction
Fragmentation
Adapter ligation
PCR amplification
Load library onto flow cell
Software converts color signals → A, T, C, G (base calling)
3.What are the essential steps of your chosen sequencing technology, how does it decode the bases of your DNA sample (base calling)?
DNA fragments bind to flow cell
Bridge amplification creates clusters
Fluorescently labeled nucleotides are added
Each base emits a specific color signal
A camera records the fluorescence
Software converts color signals → A, T, C, G (base calling)
4.What is the output of your chosen sequencing technology?
FASTQ files (raw reads with quality scores)
Millions of short reads (150–300 bp)
After assembly → full genome sequence
5.2 DNA Write
(i) What DNA would you want to synthesize (e.g., write) and why?
For DNA synthesis, I would design a synthetic gene cassette to enhance carbon capture efficiency in microalgae. The construct would include a strong promoter, ribosome binding site, an optimized RuBisCO gene, and a terminator. Additional genes for stress tolerance or pollutant degradation could also be incorporated. The goal would be to create a genetic circuit that increases CO₂ fixation and improves survival in polluted environments.
(ii) What technology or technologies would you use to perform this DNA synthesis and why?
DNA synthesis would be performed using commercial gene synthesis services such as Twist Bioscience. The process involves digital DNA design, chemical synthesis of short oligonucleotides, assembly into a full-length gene, error correction, cloning into a plasmid, and sequence verification.
Limitations include higher costs for long sequences, challenges with GC-rich regions, and potential synthesis errors. However, synthetic DNA enables precise control over gene design and optimization.
5.3 DNA Edit
(i) What DNA would you want to edit and why?
To further improve air filtration capabilities, I would edit the genomes of selected algae or fungi to enhance carbon fixation, increase pollutant tolerance, or remove metabolic bottlenecks. Genome editing could allow insertion of stronger promoters, modification of enzyme efficiency, or deletion of growth-limiting genes.
(ii) What technology or technologies would you use to perform these DNA edits and why?
The preferred editing tool would be CRISPR-Cas9. This system uses a guide RNA to direct the Cas9 enzyme to a specific DNA sequence, where it introduces a double-strand break.
Also answer the following questions:
How does your technology of choice edit DNA? What are the essential steps?
What preparation do you need to do (e.g. design steps) and what is the input (e.g. DNA template, enzymes, plasmids, primers, guides, cells) for the editing?
Inputs Required
a.Guide RNA
b.Cas9 protein or plasmid
c.Donor DNA template (for HDR)
d.Host cells
e.Transformation method
What are the limitations of your editing methods (if any) in terms of efficiency or precision?
Limitations include potential off-target mutations, variable editing efficiency, and delivery challenges in certain microalgal species. Ecological and regulatory considerations must also be addressed before environmental deployment.
Conclusion
By integrating DNA sequencing, synthesis, and genome editing, it is possible to design and engineer enhanced biological air filtration systems. Sequencing reveals the natural genetic toolkit of algae and fungi, synthetic DNA enables rational design of improved pathways, and CRISPR-based editing allows precise genome modifications. Together, these technologies provide a powerful framework for developing sustainable, living solutions to air pollution and climate change mitigation.
References
1.Kumar, P., Arora, K., Chanana, I., Kulshreshtha, S., Thakur, V., & Choi, K.-Y. (2023). Comparative study on conventional and microalgae-based air purifiers: Paving the way for sustainable green spaces. Journal of Environmental Chemical Engineering, 11(6), 111046. https://doi.org/10.1016/j.jece.2023.111046
2.Marycz, M., Brillowska-Dąbrowska, A., Muñoz, R., Gębicki, J., et al. (2021). A state of the art review on the use of fungi in biofiltration to remove volatile hydrophobic pollutants. Reviews in Environmental Science and Bio/Technology. https://doi.org/10.1007/s11157-021-09608-7
Week 3 HW: lab automation
My art for Opentrons Artwork
Output of the python script.
PAPER - Semiautomated Production of Cell-Free Biosensors
Journal: ACS Synthetic Biology (2025)
PMID: 40073441
Biosensors are biological systems that detect specific chemicals for example, if a substance is present, they might change color or glow. These can be used for:
Environmental detection (e.g., fluoride in water)
Health diagnostics
Rapid point-of-need testing
But traditionally, making lots of biosensor reactions by hand is slow and inconsistent. Different people might mix things slightly differently, which leads to variability in performance.
Instead of assembling all the biosensor reactions manually, the researchers used a robotic liquid-handling platform (like Opentrons OT-2) to semi-automate the process:
They wrote a protocol so the robot could prepare many reactions systematically
They tested this by building a full 384-well plate of biosensors that detect fluoride
They compared how well these robot-assembled reactions worked compared with manually assembled one
The robot-assembled biosensors worked as expected
The perks of the automated robot:OT-2
Using robots makes it possible to produce many biosensors quickly and reliably
This reduces human error when preparing them
It helps scale up manufacturing or testing so the sensors can be widely deployed
Idea 1: Carbon Capturing Microbial Genomics
What I would automate: High Throughput Strain Screening
I might have:
Environmental isolates
Engineered variants
Promoter strengths
Total = n number of combinations
By using automation I can :
Screen many strains simultaneously
Maintain equal CO₂ exposure conditions
Reduce pipetting variation
Generate reproducible comparative data
Idea 2: Radiation Resistant Bio-Fabric for Space Habitat Walls
What I Would Automate: Stress Testing Simulation
Automation could:
Dispense engineered strains into plates
Add oxidative stress chemicals (radiation mimic)
Add ROS indicators
Incubate
Measure fluorescence or survival
This allows parallel radiation resistance testing.
Idea 3: Living Anti-Corrosion System for Ocean Infrastructure
What I Would Automate: Corrosion Sensor Screening
Test combinations of:
-> Iron responsive promoters
-> pH sensitive promoters
-> Mineral producing enzymes
Why do humans eat beef but do not become a cow, eat fish but do not become fish?
Ans: When we eat beef or fish, our body breaks proteins into amino acids during digestion.
Then we rebuild them into human proteins, not cow proteins.
Why are there only 20 natural amino acids?
Ans: There are only 20 amino acids because-
 -> The genetic code evolved to encode these efficiently

 -> They provide enough chemical diversity (charge, size, polarity)

 -> Evolution kept what worked best.
Can you make other non-natural amino acids? Design some new amino acids.
Ans: Yes, scientists can synthesize new amino acids.
Example design:
 -> Add a fluorescent group → to track proteins.

 -> Add a metal-binding group → to create catalytic proteins.
Where did amino acids come from before enzymes that make them, and before life started?
Ans: They likely formed:
 ->In the early Earth atmosphere (like in the Miller–Urey experiment)

 ->In hydrothermal vents

 ->Delivered by meteorites
Amino acids can form naturally without life.
If you make an α-helix using D-amino acids, what handedness (right or left) would you expect?
Ams: Natural L-amino acids form right-handed helices.
D-amino acids would form a left-handed α-helix.
Why are most molecular helices right-handed?
Ans: Most molecular helices are right-handed because life uses L-amino acids, and their 3D geometry makes right-handed helices the most stable structure.
Why do β-sheets tend to aggregate?
Ans: They naturally stack into large sheets. Because:
 -> They form many hydrogen bonds

 -> Hydrophobic regions stick together
Why do many amyloid diseases form β-sheets? Can you use amyloid β-sheets as materials?
Ans: In diseases like Alzheimer’s disease and Parkinson’s disease:
 ->Normal proteins misfold.

 ->Instead of staying flexible, they rearrange into β-sheet structures.

 ->β-sheets are very stable because they form many hydrogen bonds.

 ->These sheets stack together into long fibers called amyloids.

 Yes, one can use amyloid β-sheets as materials. Although harmful in disease, amyloid β-sheets have useful properties:

-> Very strong (like silk)

-> Self-assembling

-> Chemically stable

-> Nanoscale fibers
Part B: Protein Analysis and Visualization
Briefly describe the protein you selected and why you selected it.
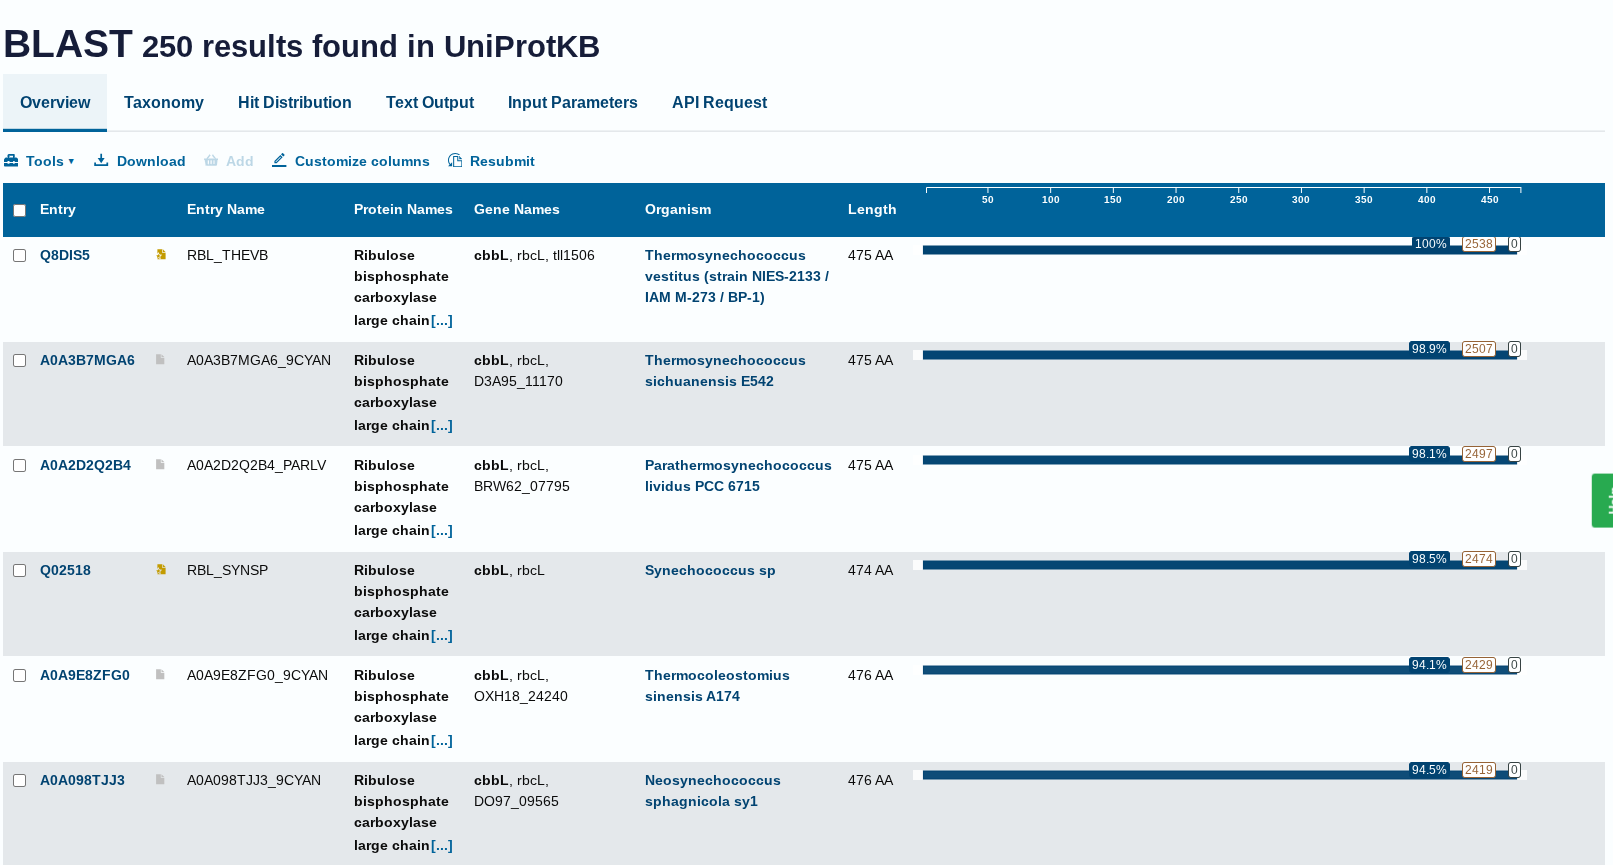
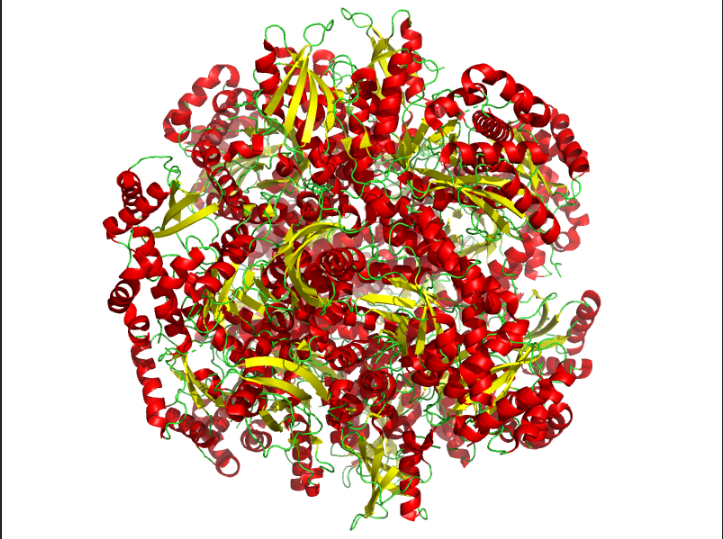
The protein I selected was RuBisCo from Thermosynechococcus vestitus . RuBisCO (Ribulose-1,5-bisphosphate carboxylase/oxygenase) is the key enzyme responsible for carbon fixation in photosynthesis.RuBisCO catalyzes the first major step of the Calvin cycle:
-> It adds carbon dioxide (CO₂) to ribulose-1,5-bisphosphate (RuBP).
-> This reaction produces two molecules of 3-phosphoglycerate (3-PGA).
This process allows plants, algae, and cyanobacteria to convert atmospheric CO₂ into organic molecules (sugars).
Identify the amino acid sequence of your protein.
How long is it? What is the most frequent amino acid? You can use this Colab notebook to count the frequency of amino acids.
Ans: The length is 475 amino acids , the most frequent amino acid is G. G occured 74 times in the sequence.
How many protein sequence homologs are there for your protein? Hint: Use Uniprot’s BLAST tool to search for homologs.
Ans: There 250 homologs to the protein- RuBISCo
Does your protein belong to any protein family?
Ans: Belongs to the RuBisCO large chain family. Type I subfamily.
Identify the structure page of your protein in RCSB
When was the structure solved? Is it a good quality structure? Good quality structure is the one with good resolution. Smaller the better (Resolution: 2.70 Å)
Ans: The structure was experimentally solved using X-ray diffraction data collected on February 4, 2007.
 So the timeline is:

 ->Data collected (structure solved): 2007-02-04

 ->Deposited to Protein Data Bank: 2011-03-10

 ->Released publicly: 2012-03-28

 Yes, it is a good quality structure, the resolution is 2.30 Å

 Are there any other molecules in the solved structure apart from protein?

 Ans: Yes, there are Cl ligand present in the solved structure. Along with the ligand water molecules and ions are present, these comes under hetero molecules.

 Does your protein belong to any structure classification family?

 Ans: Yes, my protein is structurally classified and is part of the RuBisCO small subunit structural family.
Open the structure of your protein in any 3D molecule visualization software:
PyMol Tutorial Here (hint: ChatGPT is good at PyMol commands)
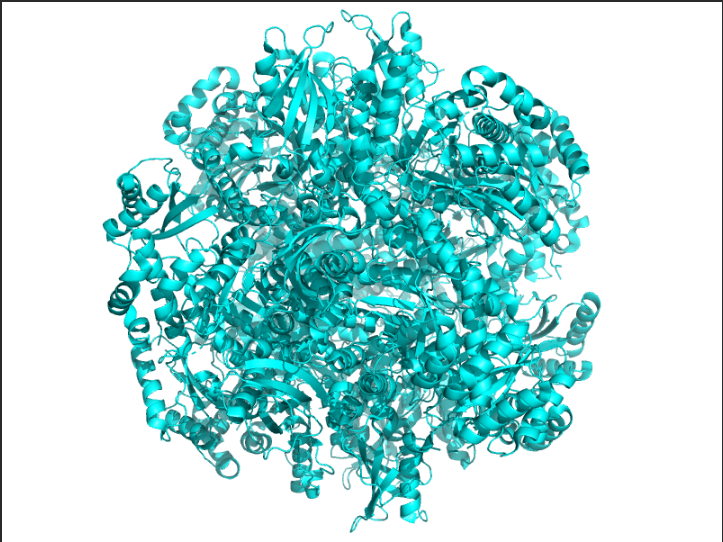
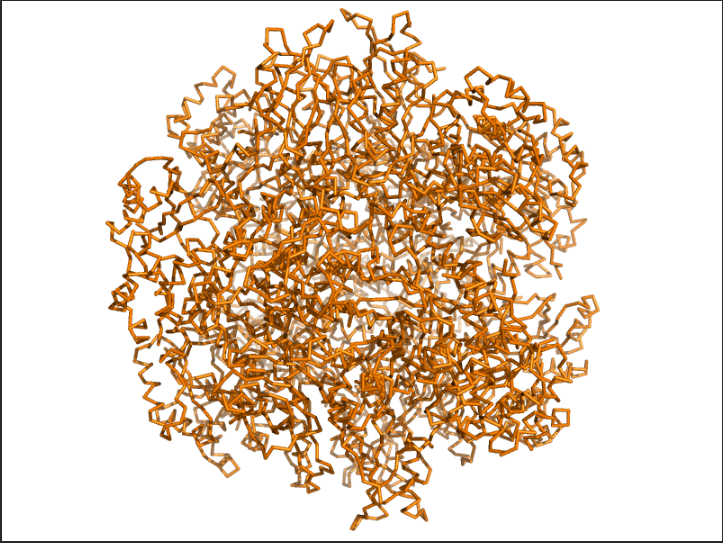
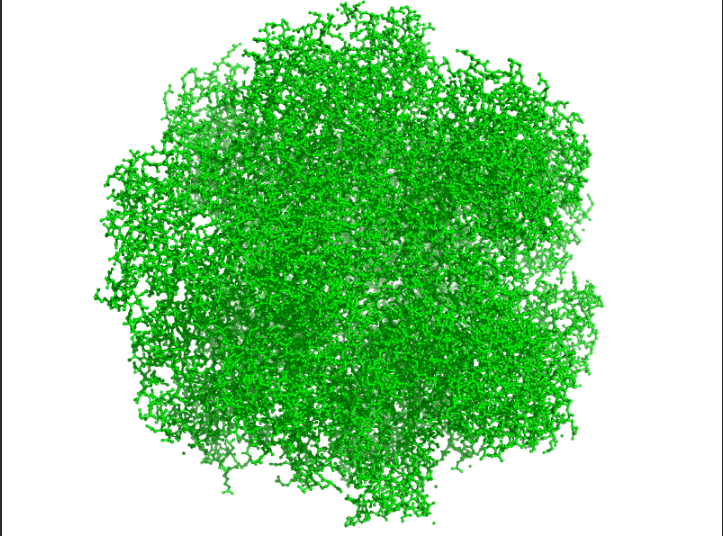
Visualize the protein as “cartoon”, “ribbon” and “ball and stick”.
Ans: The protein structure was visualized using cartoon, ribbon, and ball-and-stick representations. The cartoon and ribbon models highlight the overall fold and secondary structural elements, while the ball-and-stick model shows atomic-level details of the protein structure.
Color the protein by secondary structure. Does it have more helices or sheets?
Ans: The protein is predominantly β-sheet(yellow) rich with fewer α-helices(red).
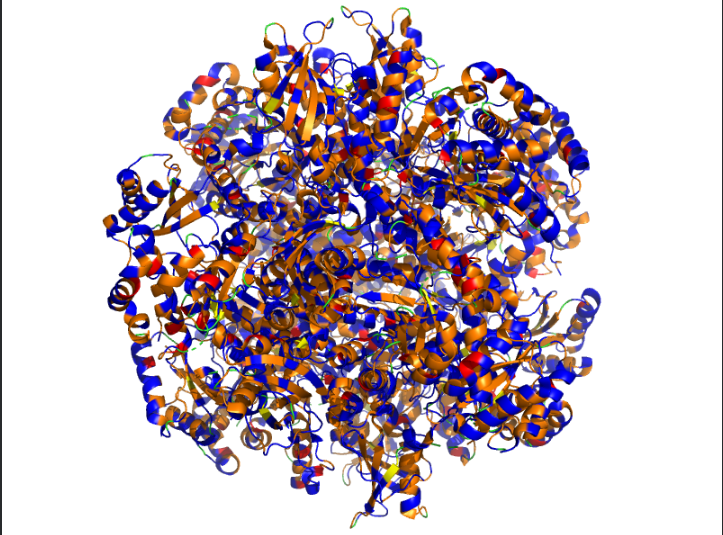
Color the protein by residue type. What can you tell about the distribution of hydrophobic vs hydrophilic residues?
Ans: Hydrophobic(orange) residues are buried in the core, while hydrophilic(yellow) residues are exposed on the surface, consistent with a soluble enzyme.
Visualize the surface of the protein. Does it have any “holes” (aka binding pockets)?
Ans: Surface representation reveals shallow binding pockets and structural clefts that likely contribute to substrate binding and subunit interaction.
Part C. Using ML-Based Protein Design Tools
C1. Protein Language Modeling
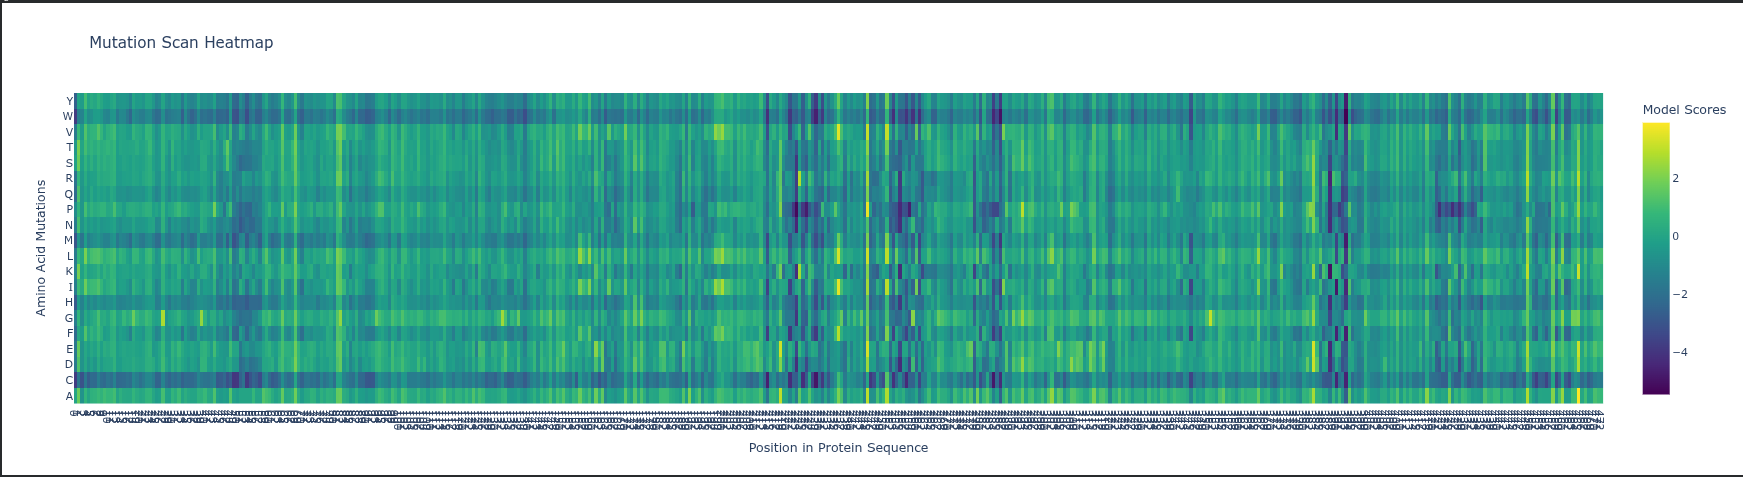
Deep Mutational Scan (DMS)
ESM2 Likelihoods: The heatmap predicts how a mutation affects protein fitness by calculating how the model is by a change; high negative values (darker colors) indicate mutations that likely disrupt the protein’s structure or function.
Specific Pattern: Look at Glycine (G) or Proline (P) residues in the sequence; mutations at these sites usually stand out as highly deleterious (darker) because these amino acids have unique structural roles (flexibility or rigid kinks) that other residues cannot easily replace.
Experimental Comparison: In RuBisCO, ESM2 predictions generally correlate strongly with experimental data in the catalytic core, but the model may “under-predict” the impact of mutations in surface loops that are functionally important for protein-protein interactions (like with RuBisCO activase) but less evolutionarily conserved.
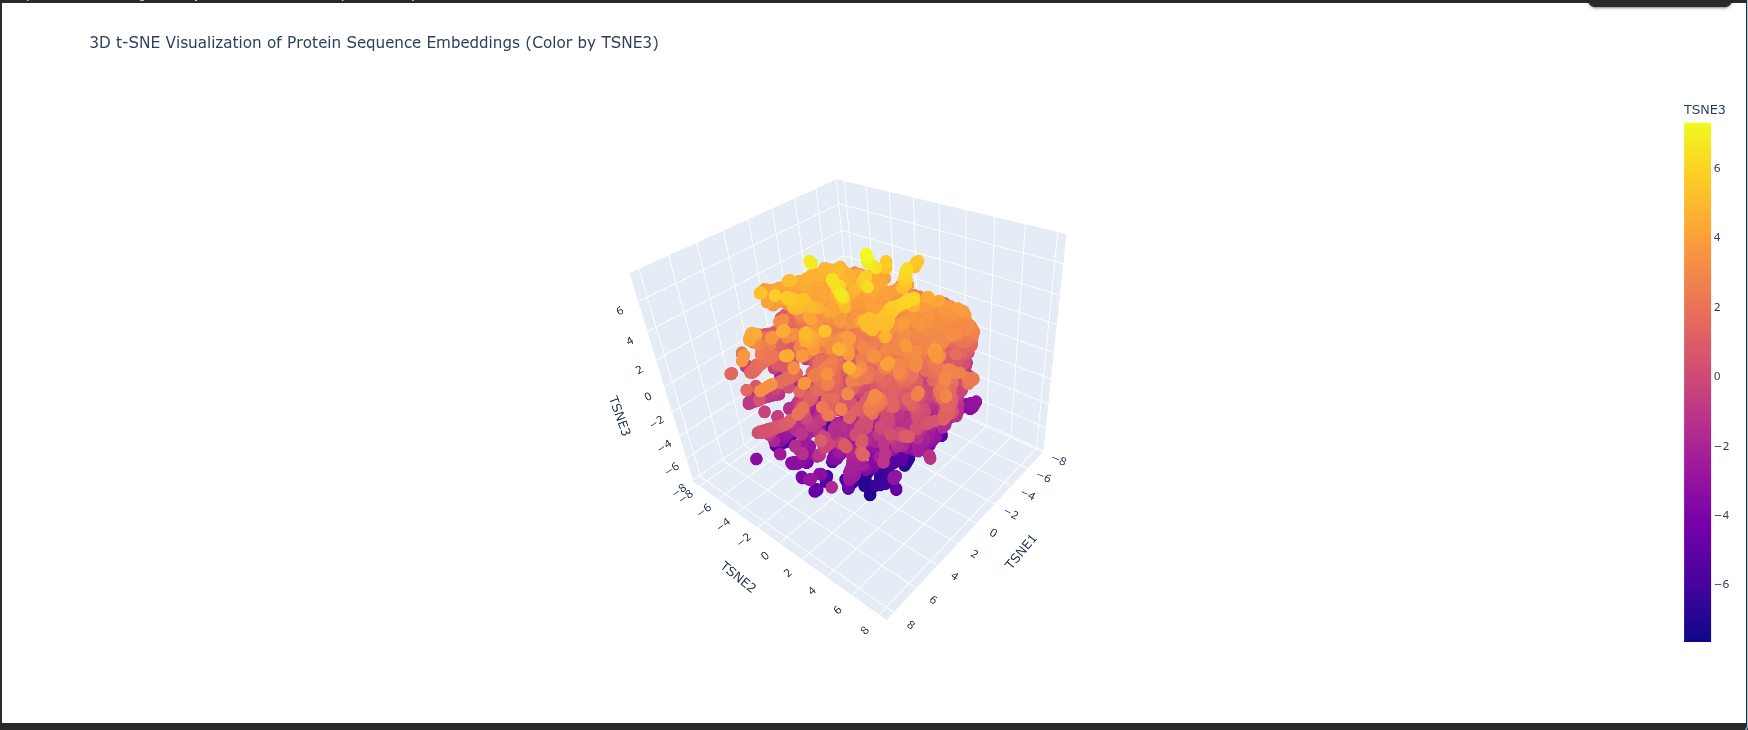
Latent Space Analysis
Neighborhoods: The clusters in t-SNE plot represent groups of proteins with similar structural folds and evolutionary origins, meaning proteins in the same neighborhood likely share the same biological pathway or enzymatic mechanism.
Protein Position: The protein is positioned based on its high-dimensional embedding; it likely sits in a dense neighborhood of Type I RuBisCO enzymes, indicating it shares a highly conserved sequence identity and 3D architecture with other photosynthetic large subunits.
Similarity: Proximity to neighbors suggests that ESM2 has successfully captured “hidden” biological rules—such as hydrophobic packing and electrostatic networks—placing the protein near those with the most similar functional constraints.
C2. Protein Folding
Protein Folding Analysis
Coordinate Matching: ESMFold predictions generally match original structures closely for well-defined domains, though disordered regions show higher variance between predicted and experimental coordinates.
Structural Resilience: The protein appears highly resilient to single mutations, as most of the heatmap is green (neutral), indicating that the language model expects the overall fold to remain stable despite small changes.
Segment Impact: Large segment deletions or radical mutations in the “dark blue” caused structural collapse, as these regions represent the core stability of the protein.
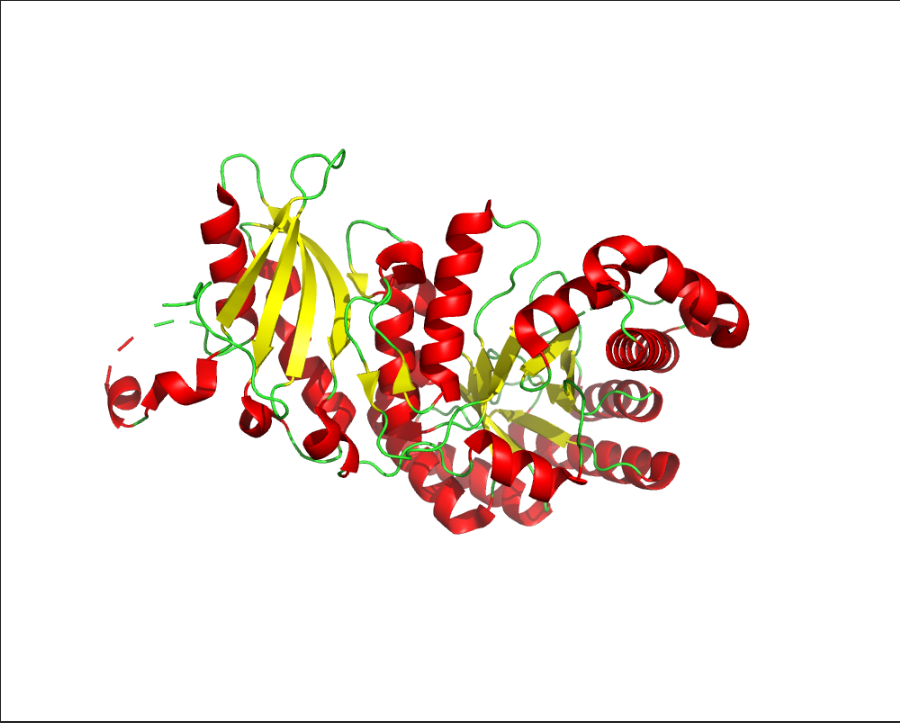
The image depicts the structure of the protein RuBISCo
C3. Protein Generation
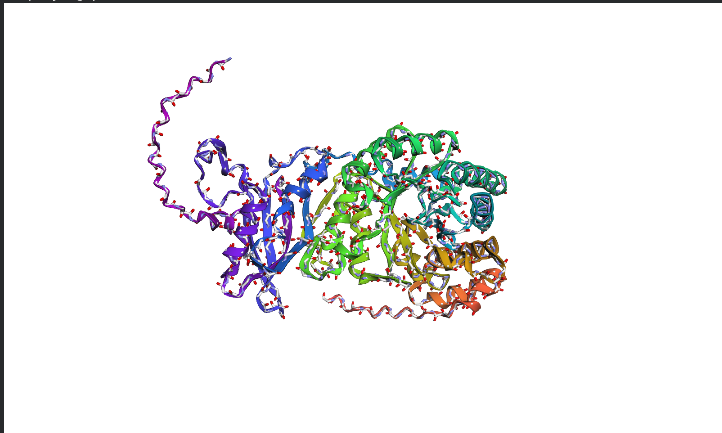
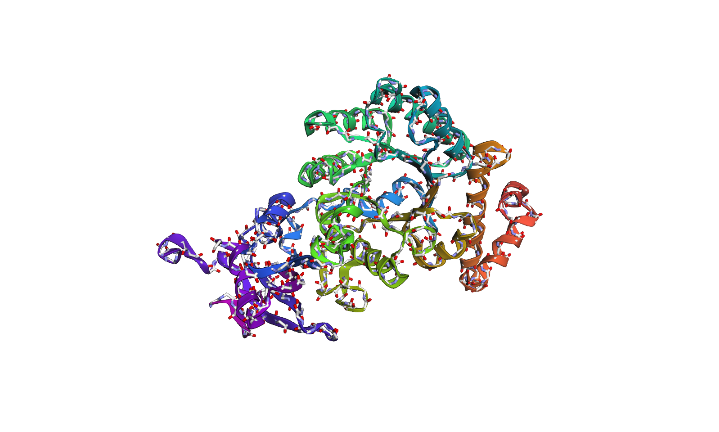
The predicted sequence has low score when compared to the original sequence. Below images show structural difference between predicted sequence and original sequence.
Image depicts the structure of original sequence
Image depicts the structure of predicted sequence.
Part D. Group Brainstorm on Bacteriophage Engineering
Find a group of ~3–4 students
Read through the Phage Reading material listed under “Reading & Resources” below.
Review the Bacteriophage Final Project Goals for engineering the L Protein:
Increased stability (easiest)
Higher titers (medium)
Higher toxicity of lysis protein (hard)
Brainstorm Session
Choose one or two main goals from the list that you think you can address computationally (e.g., “We’ll try to stabilize the lysis protein,” or “We’ll attempt to disrupt its interaction with E. coli DnaJ.”).
Write a 1-page proposal (bullet points or short paragraphs) describing:
Which tools/approaches from recitation you propose using (e.g., “Use Protein Language Models to do in silico mutagenesis, then AlphaFold-Multimer to check complexes.”).
Why do you think those tools might help solve your chosen sub-problem?
Name one or two potential pitfalls (e.g., “We lack enough training data on phage–bacteria interactions.”).
Include a schematic of your pipeline.
This resource may be useful: HTGAA Protein Engineering Tools
Each individually put your plan on your HTGAA website
Include your group’s short plan for engineering a bacteriophage
Answers
Our group proposes to computationally engineer the MS2 bacteriophage L protein with two primary goals:
Increased Stability
Redesign the N-terminal and transmembrane domains to reduce proteolytic degradation and improve protein accumulation in the host membrane.
Increased Toxicity
Optimize lytic kinetics so that the L protein bypasses or weakens the DnaJ-dependent damping mechanism, allowing faster host cell lysis.
We selected these goals because both can be explored computationally through sequence generation, mutational analysis, and structural modeling before experimental validation.
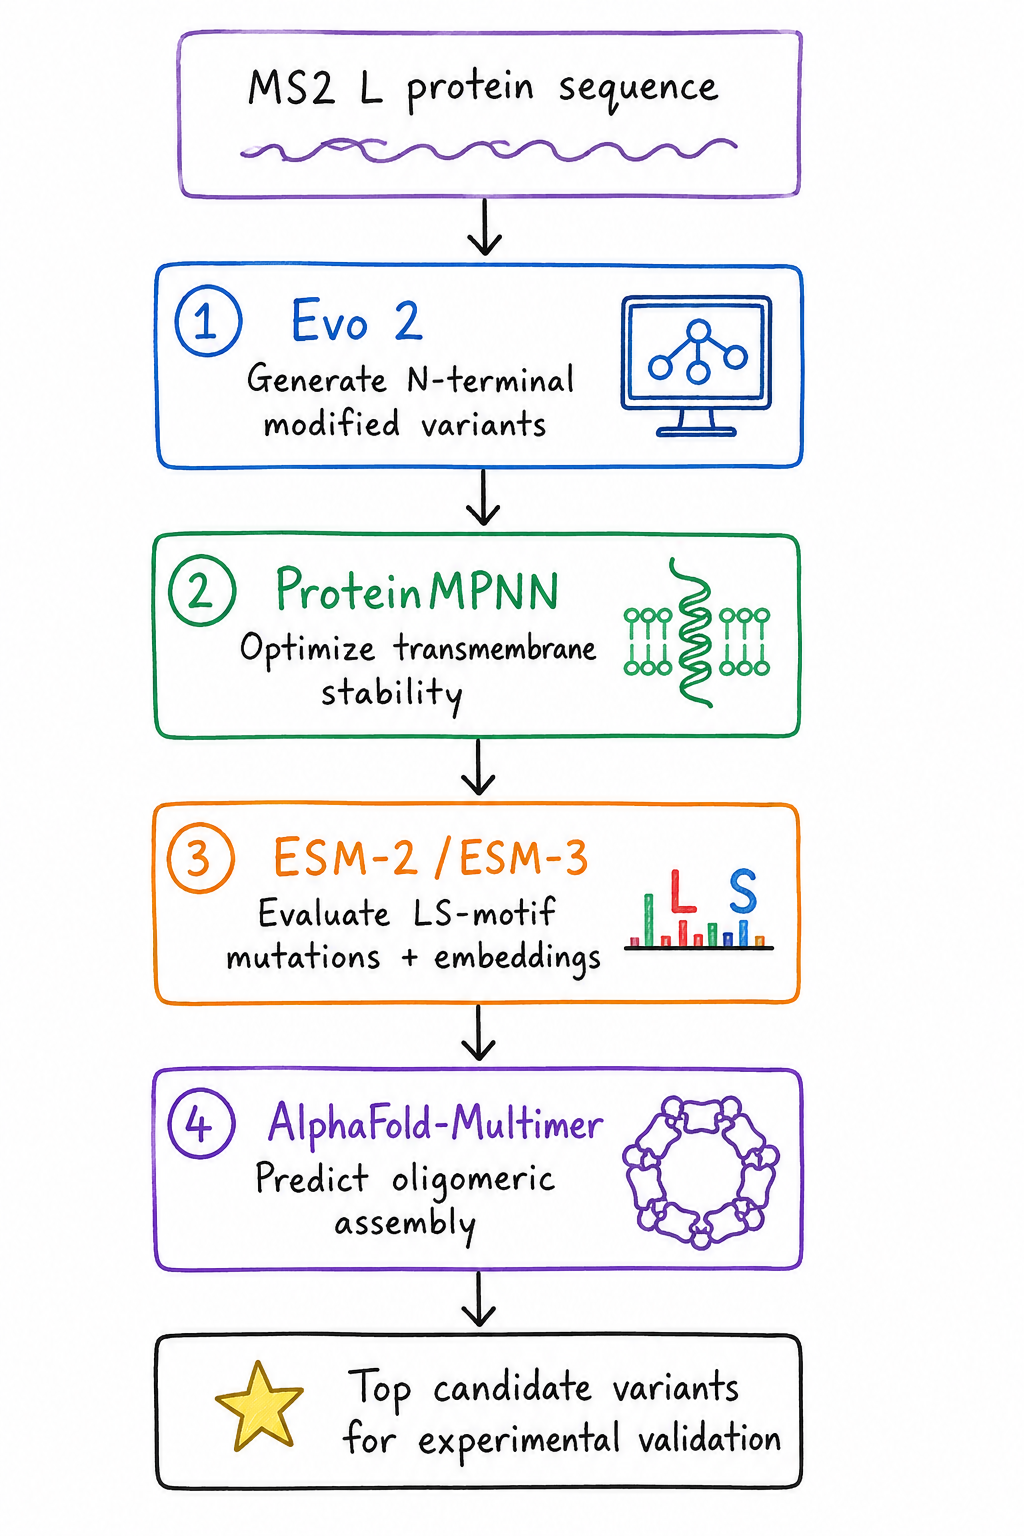
Proposed Computational Pipeline
Generative Sequence Design – Evo 2
Approach:
We will use Evo 2 to generate a library of new MS2 L protein variants.
We will focus on:
modifying or truncating the N-terminal Domain 1
generating Lodj-like variants that may reduce DnaJ interaction
Evo 2 can explore sequence space beyond known phage evolution and may suggest variants with stronger lysis activity or improved accumulation.
Sequence Stability Optimization – ProteinMPNN
Approach:
Use ProteinMPNN on the transmembrane domain (TMD) of candidate sequences.
Focus:
preserve membrane insertion geometry
improve folding stability
reduce destabilizing mutations
Why this helps:
The L protein depends on proper membrane insertion. Stable folding in the TMD should improve accumulation and make lysis more reliable.
Functional Motif Tuning – ESM-2 / ESM-3
Approach:
Use ESM-2 and ESM-3 for in silico mutagenesis around the Leu48–Ser49 (LS) motif.
Focus:
test substitutions around conserved residues
evaluate sequence embeddings
preserve functional amino acid properties while improving toxicity
Why this helps:
The LS motif is central to L protein function. Language models can estimate which mutations remain biologically plausible while potentially improving activity.
Oligomerization Verification – AlphaFold-Multimer
Approach:
Use AlphaFold-Multimer to predict oligomeric assembly.
Focus:
ability to form 10-mer or higher clusters
membrane pore geometry
mutation effects on assembly interfaces
Why this helps:
The MS2 L protein lyses cells by clustering in membranes. Structural prediction helps identify variants likely to assemble correctly.
Potential Pitfalls
Over-toxicity / premature lysis
If engineered L proteins trigger lysis too early, E. coli may burst before the phage completes replication.
Possible consequence:
faster lysis, but lower phage production
Membrane protein prediction limitations
Many protein prediction models perform better on soluble proteins than membrane proteins.
Possible issue:
predicted oligomers may differ from real membrane behavior
lipid bilayer effects may not be captured accurately
Proposed computational workflow for engineering the MS2 L protein, integrating sequence generation, stability optimization, mutational analysis, and structural prediction to identify promising variants for experimental validation.
Short Group Plan
Our group will computationally engineer the MS2 bacteriophage L protein for greater stability and stronger lytic activity.
We will combine:
generative sequence design
protein language models
inverse folding
structure prediction
To identify promising L protein variants that:
accumulate more effectively in membranes
maintain functional oligomerization
potentially bypass DnaJ damping for faster lysis
These candidates would then be prioritized for future experimental testing.
Week 5: Protein design part II
Part A: SOD1 Binder Peptide Design (From Pranam)
Superoxide dismutase 1 (SOD1) is a cytosolic antioxidant enzyme that converts superoxide radicals into hydrogen peroxide and oxygen. In its native state, it forms a stable homodimer and binds copper and zinc.
Mutations in SOD1 cause familial Amyotrophic Lateral Sclerosis (ALS). Among them, the A4V mutation (Alanine → Valine at residue 4) leads to one of the most aggressive forms of the disease. The mutation subtly destabilizes the N-terminus, perturbs folding energetics, and promotes toxic aggregation.
Your challenge:
Design short peptides that bind mutant SOD1.
Then decide which ones are worth advancing toward therapy.
You will use three models developed in our lab:
PepMLM: target sequence-conditioned peptide generation via masked language modeling
The human SOD1 sequence was retrieved from UniProt (P00441) and the A4V mutation was introduced (position 4: Ala → Val). This mutant sequence was then used to condition PepMLM (PepMLM-650M) to generate four candidate 12-mer peptide binders.
Generated Peptides and Perplexity Scores
The table below summarizes the four PepMLM-generated peptides alongside the known SOD1-binding reference peptide. Pseudo-perplexity scores indicate the model’s confidence — lower values indicate higher confidence in the generated sequence as a plausible binder.
Peptide
Sequence
Pseudo-Perplexity
Source
Peptide 1
WIYPAAGWGHKK
27.58
PepMLM-generated
Peptide 2
WWVYAVAPRVKA
14.63
PepMLM-generated
Peptide 3
WWPYWTAVVKDK
24.92
PepMLM-generated
Peptide 4
ERVTASSVKQLA
26.09
PepMLM-generated
Reference
FLYRWLPSRRGG
—
Known SOD1 binder
Note on perplexity: WWVYAVAPRVKA shows the lowest pseudo-perplexity (14.63), indicating PepMLM assigned the highest confidence to this sequence as a binder for the A4V mutant SOD1 target.
Part 2: Evaluate Binders with AlphaFold3
Navigate to the AlphaFold Server: alphafoldserver.com
For each peptide, submit the mutant SOD1 sequence followed by the peptide sequence as separate chains to model the protein-peptide complex.
Record the ipTM score and briefly describe where the peptide appears to bind. Does it localize near the N-terminus where A4V sits? Does it engage the β-barrel region or approach the dimer interface? Does it appear surface-bound or partially buried?
In a short paragraph, describe the ipTM values you observe and whether any PepMLM-generated peptide matches or exceeds the known binder.
Methodology
Each peptide was submitted to the AlphaFold Server (alphafoldserver.com) as a two-chain complex — chain A: A4V mutant SOD1 sequence; chain B: the peptide. The ipTM (interface predicted TM-score) and pTM scores were recorded, along with observations of peptide binding location.
Results
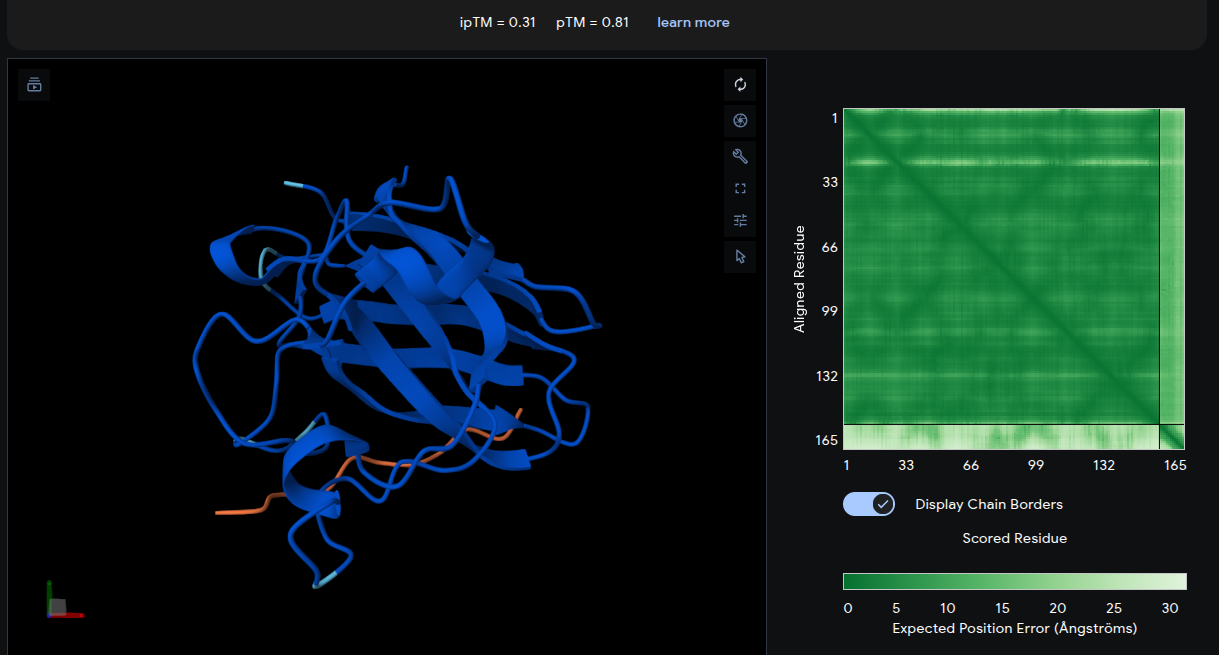
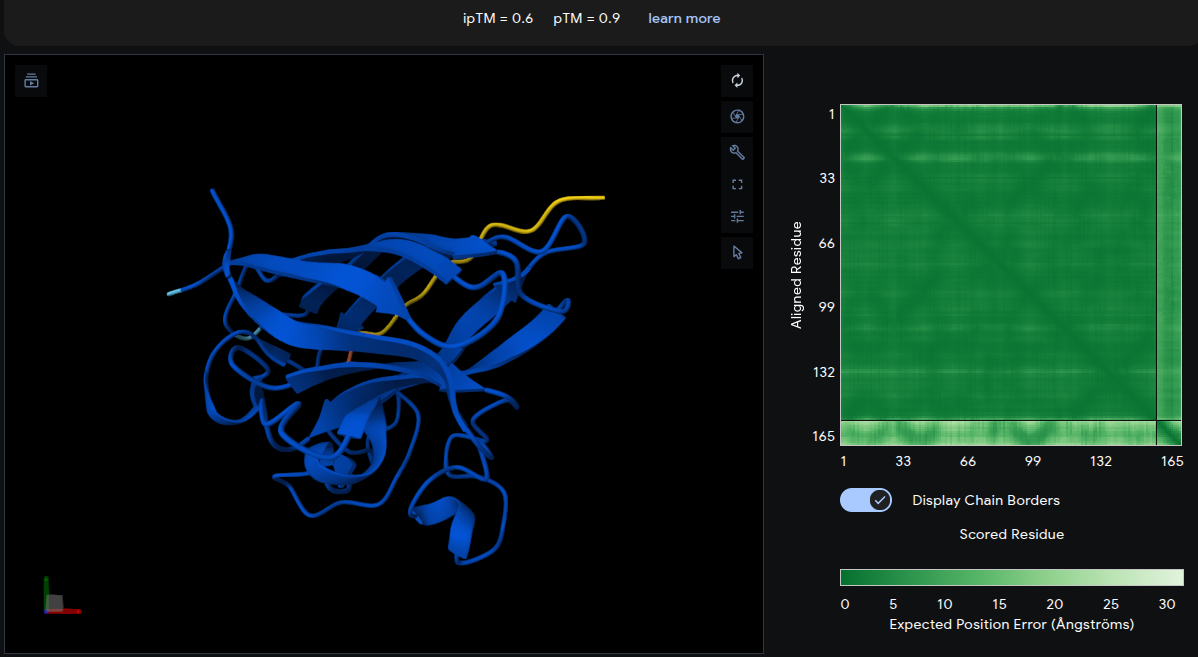
Reference Peptide: FLYRWLPSRRGG
ipTM = 0.31 | pTM = 0.81
The reference peptide (yellow) localizes near the lower β-barrel region of mutant SOD1, with an additional short segment positioned near the base of the structure. The peptide adopts a partially extended and loop-like conformation rather than becoming deeply buried within the protein surface. The Predicted Aligned Error (PAE) matrix shows relatively uniform inter-chain uncertainty, consistent with weak but non-random interface contacts. Overall, the low ipTM score indicates limited interaction confidence and serves as a structural baseline for comparison with the generated peptides.
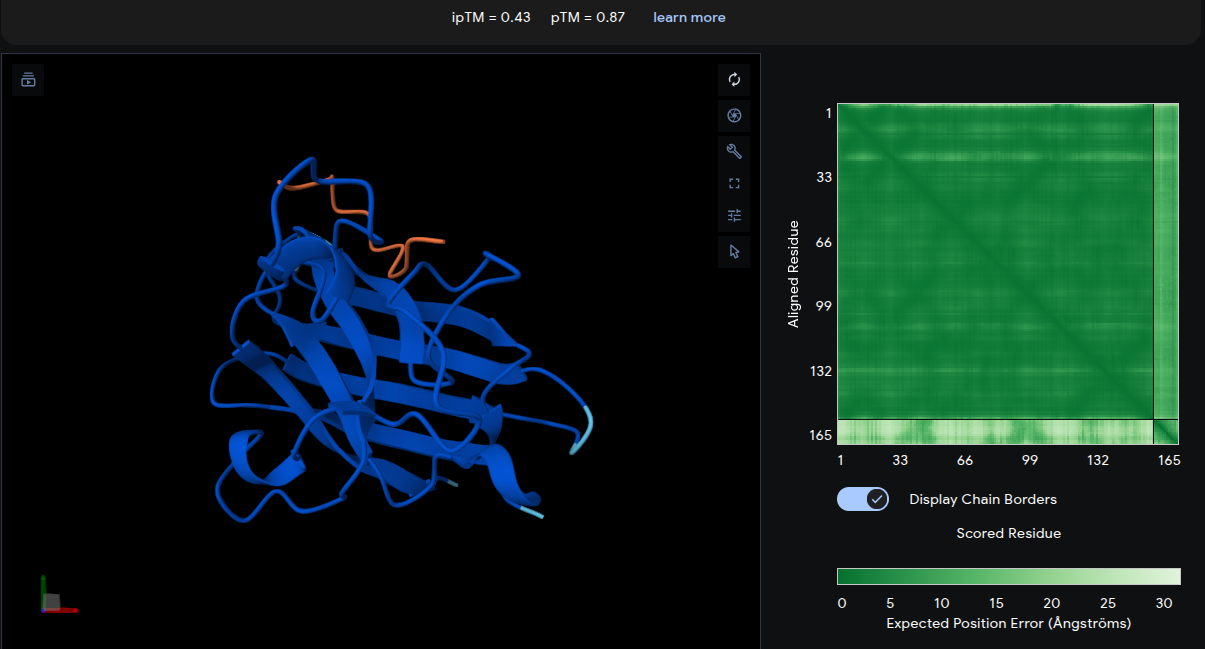
Peptide 1: WIYPAAGWGHKK
ipTM = 0.43 | pTM = 0.87
The peptide (yellow) forms a relatively compact loop structure engaging the upper region of the SOD1 β-barrel near the N-terminal area where the A4V mutation is located. The peptide appears partially buried beneath an overhanging loop region, suggesting improved geometric complementarity and surface accommodation compared with the reference peptide. The moderate ipTM score indicates a more stable and confident interface interaction than the known binder.
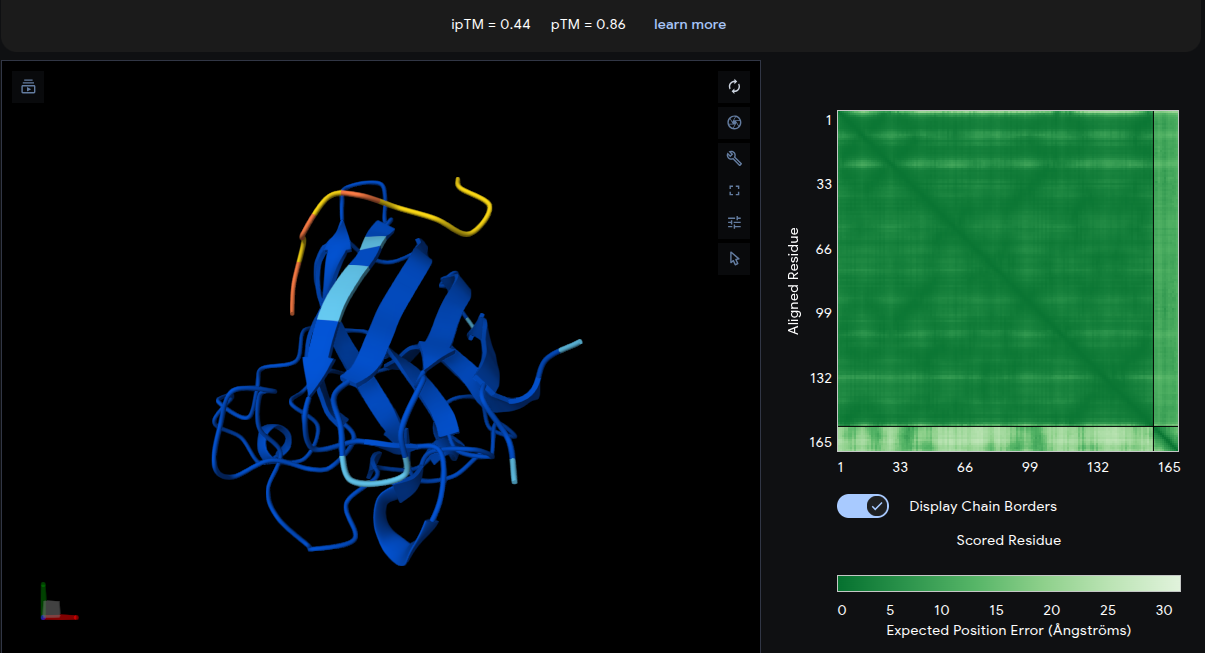
Peptide 2: WWVYAVAPRVKA
ipTM = 0.44 | pTM = 0.86
The peptide adopts a diffuse surface-associated conformation, appearing to drape across the upper loop region of the β-barrel. No strong localization near the A4V mutation site is observed. The interaction appears predominantly surface-bound with minimal burial into the protein structure. Although the interface remains relatively weak, the slightly improved ipTM compared with the reference peptide suggests modest but meaningful predicted intermolecular contacts.
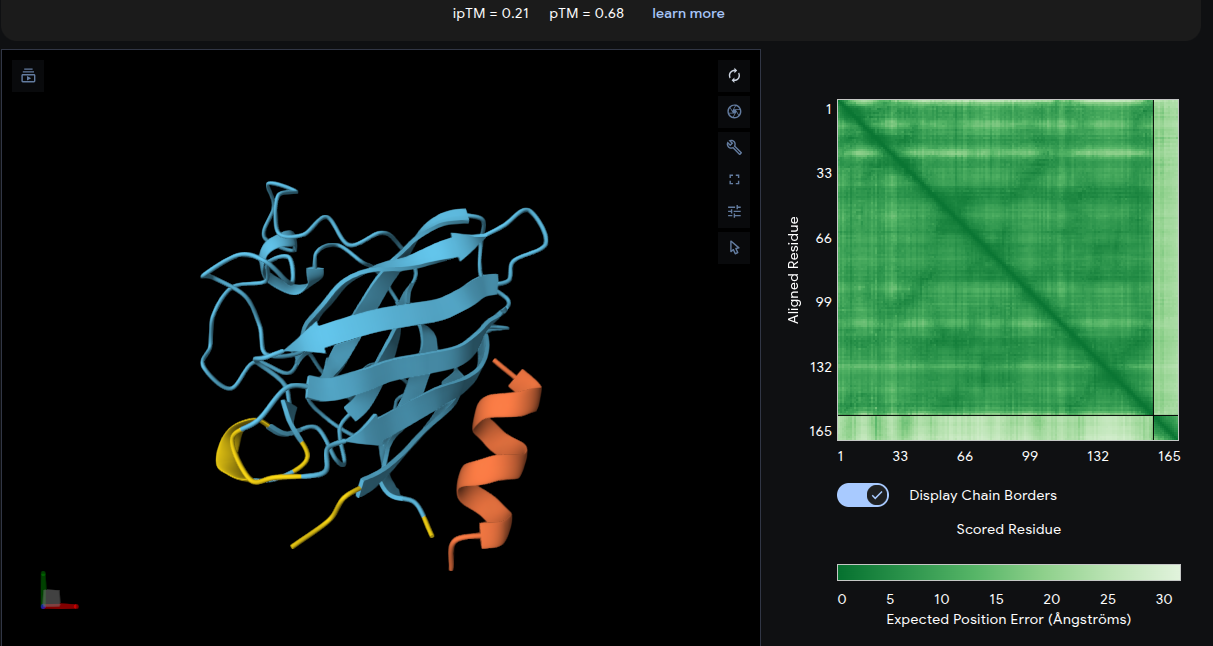
Peptide 3: WWPYWTAVVKDK
ipTM = 0.21 | pTM = 0.68
The peptide associates weakly with the upper β-barrel loop region and appears only loosely positioned at the junction between adjacent loops. The interface lacks substantial burial or extensive contact surfaces, consistent with the very low ipTM score. The lower pTM value also indicates reduced confidence in the overall complex structure relative to the other peptide–protein models. Overall, this peptide represents the weakest predicted interaction among the generated binders.
Peptide 4: ERVTASSVKQLA
ipTM = 0.60 | pTM = 0.90
Remarkably, ERVTASSVKQLA yields the highest ipTM of 0.60 across all peptides. The peptide (yellow) engages the top surface of the β-barrel at a well-defined interface, running along the outer edge of a loop region. The pTM of 0.90 reflects the highest confidence in the overall complex structure. This peptide clearly outperforms the reference structurally.
Summary of AlphaFold3 ipTM Scores
ID
Peptide
ipTM
Interpretation
P1
WIYPAAGWGHKK
0.44
weak/moderate
P2
WWVYAVAPRVKA
0.43
weak/moderate
P3
WWPYWTAVVKDK
0.21
very weak
P4
ERVTASSVKQLA
0.60
best generated binder
REF
FLYRWLPSRRGG
0.31
weak known binder
Paragraph Summary
AlphaFold3 analysis of the peptide–mutant Superoxide dismutase 1 A4V mutant complexes revealed varying levels of predicted interaction confidence among the generated binders. Among the PepMLM-generated peptides, ERVTASSVKQLA (P4) showed the highest ipTM score of 0.60, indicating the strongest and most stable predicted interaction with mutant SOD1. In contrast, WIYPAAGWGHKK (P1) and WWVYAVAPRVKA (P2) displayed moderate interaction confidence with ipTM scores of 0.44 and 0.43, respectively. WWPYWTAVVKDK (P3) showed the weakest interaction with an ipTM score of 0.21, suggesting poor binding stability. Interestingly, the known SOD1-binding reference peptide FLYRWLPSRRGG produced only a weak interaction score of 0.31, meaning that the PepMLM-generated peptide P4 outperformed the established binder in this structural prediction workflow. Overall, these results suggest that AI-generated peptides can potentially identify novel binders with improved interaction profiles compared to previously known peptide candidates.
Part 3: Evaluate Properties of Generated Peptides in PeptiVerse
Structural confidence alone is insufficient for therapeutic development. Using PeptiVerse, let’s evaluate the therapeutic properties of your peptide! For each PepMLM-generated peptide:
Paste the peptide sequence.
Paste the A4V mutant SOD1 sequence in the target field.
Check the boxes
Predicted binding affinity
Solubility
Hemolysis probability
Net charge (pH 7)
Molecular weight
Compare these predictions to what you observed structurally with AlphaFold3. In a short paragraph, describe what you see. Do peptides with higher ipTM also show stronger predicted affinity? Are any strong binders predicted to be hemolytic or poorly soluble? Which peptide best balances predicted binding and therapeutic properties?
Choose one peptide you would advance and justify your decision briefly.
Methodology
Each peptide sequence was submitted to PeptiVerse with the A4V mutant SOD1 sequence as the target. The following properties were evaluated: binding affinity (pKd/pKi), solubility, hemolysis probability, permeability, net charge (pH 7), molecular weight, isoelectric point, and hydrophobicity (GRAVY).
PeptiVerse Results
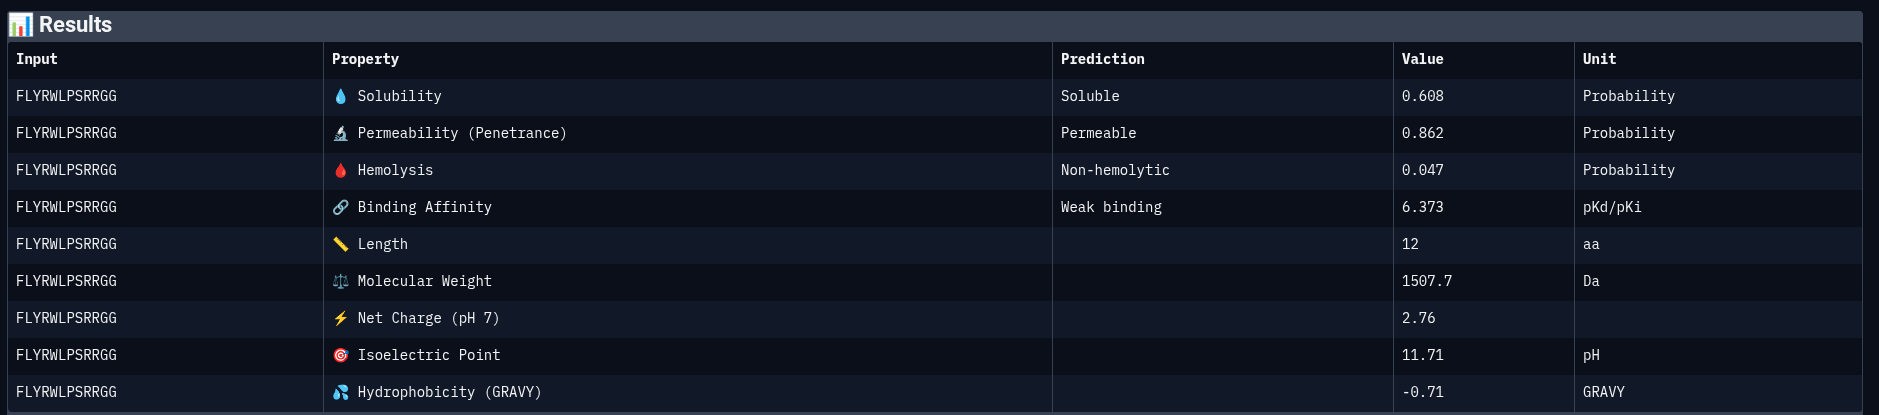
Reference Peptide: FLYRWLPSRRGG
Property
Prediction
Value
Unit
Solubility
Soluble
0.608
Probability
Permeability
Permeable
0.862
Probability
Hemolysis
Non-hemolytic
0.047
Probability
Binding Affinity
Weak binding
6.373
pKd/pKi
Molecular Weight
—
1507.7
Da
Net Charge (pH 7)
—
2.76
—
Isoelectric Point
—
11.71
pH
Hydrophobicity (GRAVY)
—
−0.71
—
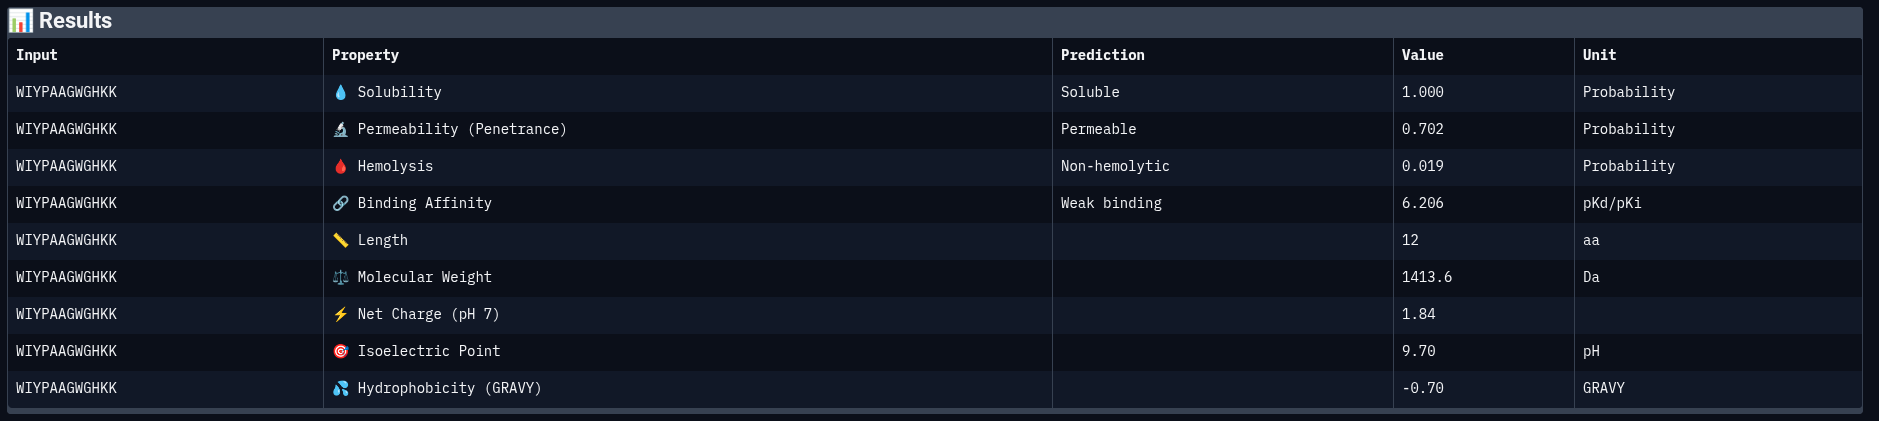
Peptide 1: WIYPAAGWGHKK
Property
Prediction
Value
Unit
Solubility
Soluble
1.000
Probability
Permeability
Permeable
0.702
Probability
Hemolysis
Non-hemolytic
0.019
Probability
Binding Affinity
Weak binding
6.206
pKd/pKi
Molecular Weight
—
1413.6
Da
Net Charge (pH 7)
—
1.84
—
Isoelectric Point
—
9.70
pH
Hydrophobicity (GRAVY)
—
−0.70
—
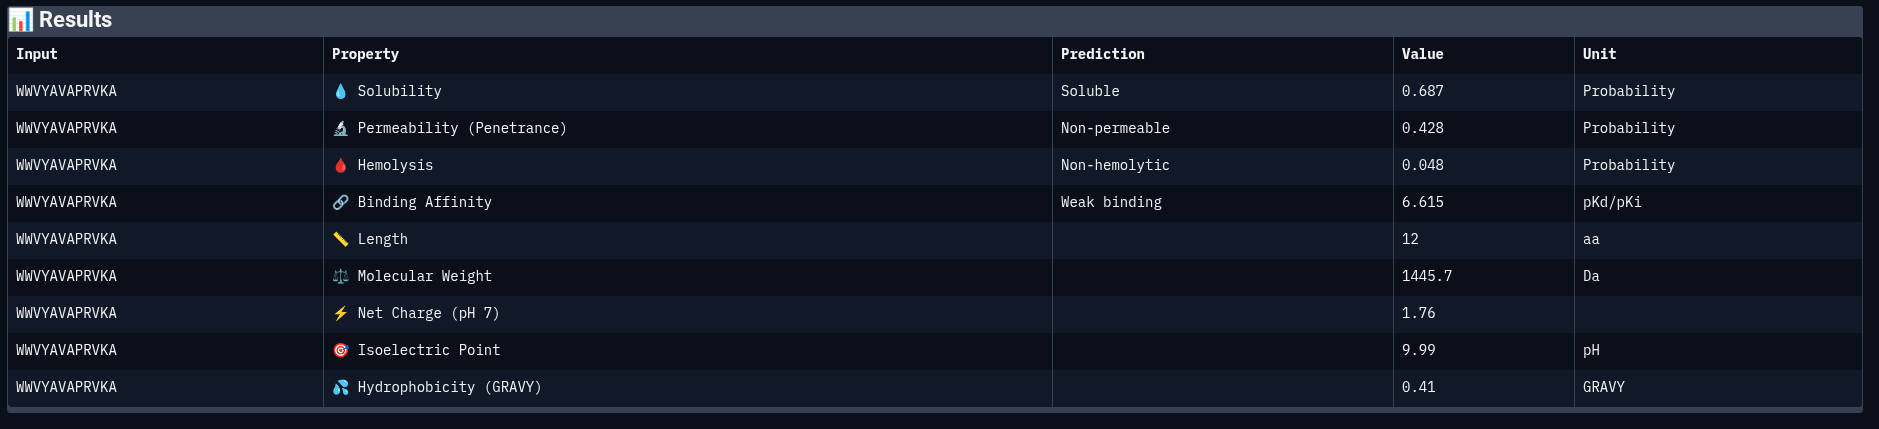
Peptide 2: WWVYAVAPRVKA
Property
Prediction
Value
Unit
Solubility
Soluble
0.687
Probability
Permeability
Non-permeable
0.428
Probability
Hemolysis
Non-hemolytic
0.048
Probability
Binding Affinity
Weak binding
6.615
pKd/pKi
Molecular Weight
—
1445.7
Da
Net Charge (pH 7)
—
1.76
—
Isoelectric Point
—
9.99
pH
Hydrophobicity (GRAVY)
—
0.41
—
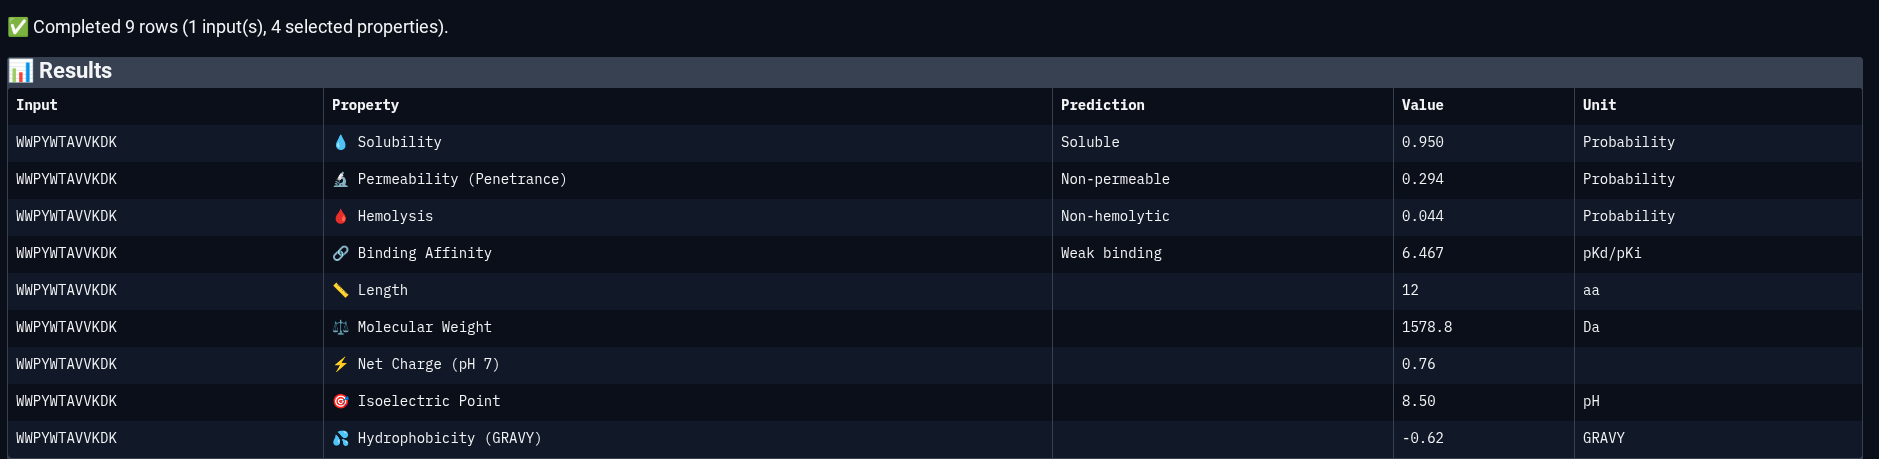
Peptide 3: WWPYWTAVVKDK
Property
Prediction
Value
Unit
Solubility
Soluble
0.950
Probability
Permeability
Non-permeable
0.294
Probability
Hemolysis
Non-hemolytic
0.044
Probability
Binding Affinity
Weak binding
6.467
pKd/pKi
Molecular Weight
—
1578.8
Da
Net Charge (pH 7)
—
0.76
—
Isoelectric Point
—
8.50
pH
Hydrophobicity (GRAVY)
—
−0.62
—
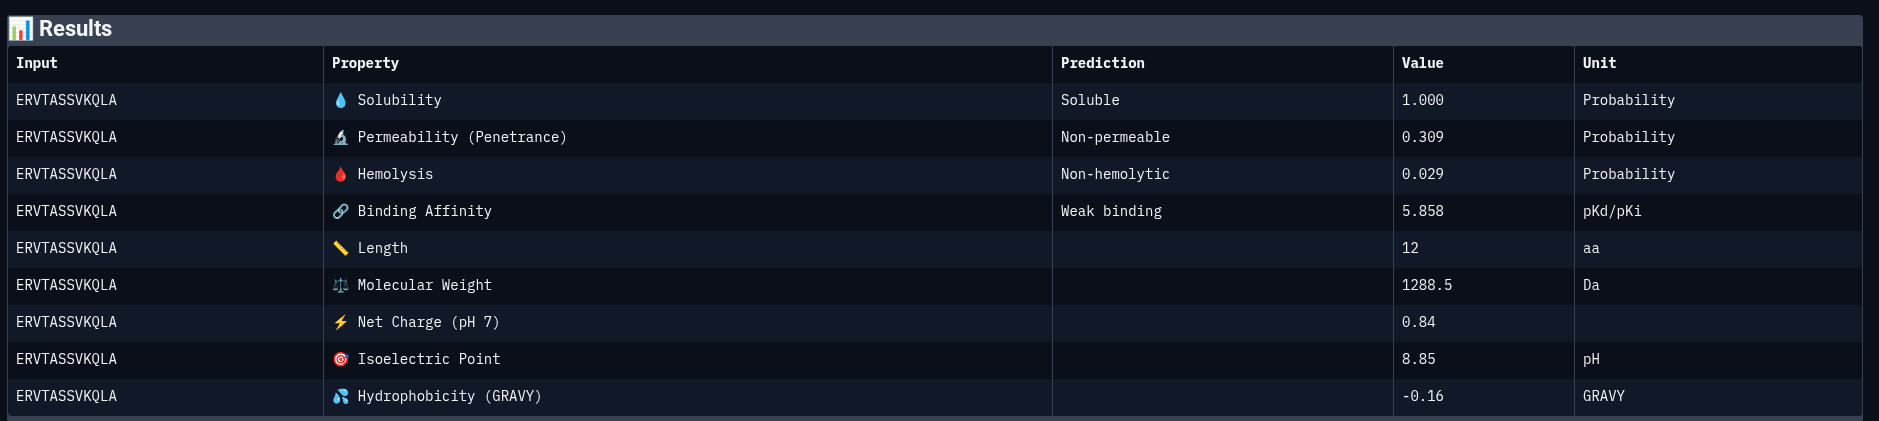
Peptide 4: ERVTASSVKQLA
Property
Prediction
Value
Unit
Solubility
Soluble
1.000
Probability
Permeability
Non-permeable
0.309
Probability
Hemolysis
Non-hemolytic
0.029
Probability
Binding Affinity
Weak binding
5.858
pKd/pKi
Molecular Weight
—
1288.5
Da
Net Charge (pH 7)
—
0.84
—
Isoelectric Point
—
8.85
pH
Hydrophobicity (GRAVY)
—
−0.16
—
Consolidated Comparison Table
Peptide
ipTM
Affinity (pKd/pKi)
Solubility
Hemolysis
Permeability
Net Charge
FLYRWLPSRRGG (ref)
0.31
6.373
0.608
0.047
Permeable
2.76
WIYPAAGWGHKK
0.44
6.206
1.000
0.019
Permeable
1.84
WWVYAVAPRVKA
0.43
6.615
0.687
0.048
Non-permeable
1.76
WWPYWTAVVKDK
0.21
6.467
0.950
0.044
Non-permeable
0.76
ERVTASSVKQLA
0.60
5.858
1.000
0.029
Non-permeable
0.84
Paragraph Analysis
Comparing structural predictions from AlphaFold3 with PeptiVerse therapeutic property predictions reveals that structural interaction confidence and predicted biochemical affinity do not perfectly correlate. ERVTASSVKQLA achieved the highest structural confidence with an ipTM score of 0.60, suggesting the most stable predicted interaction with mutant Superoxide dismutase 1 A4V mutant. However, it displayed the lowest predicted binding affinity (5.858 pKd/pKi) among the evaluated peptides. In contrast, WWVYAVAPRVKA showed the strongest predicted affinity (6.615 pKd/pKi) despite having only a moderate ipTM score of 0.43. WIYPAAGWGHKK demonstrated excellent solubility (1.000) and the lowest hemolysis probability (0.019), indicating favorable therapeutic safety characteristics. WWPYWTAVVKDK exhibited good solubility and affinity but showed the weakest structural interaction among the generated peptides (ipTM = 0.21). Importantly, all peptides displayed low predicted hemolysis probabilities (<0.05), suggesting minimal membrane toxicity risk. Permeability predictions varied, with WIYPAAGWGHKK and the reference peptide predicted to be permeable, while the remaining peptides were classified as non-permeable. Overall, these results demonstrate that peptide therapeutic evaluation requires balancing structural interaction, predicted affinity, solubility, and safety-related properties rather than relying on a single metric alone.
Advancement Decision
Peptide selected for advancement: ERVTASSVKQLA
ERVTASSVKQLA represents the strongest overall candidate because it demonstrated the highest AlphaFold3 structural interaction confidence (ipTM = 0.60), indicating the most stable predicted binding interface with mutant SOD1. In addition, it showed excellent solubility (1.000) and a very low hemolysis probability (0.029), suggesting favorable therapeutic developability and low toxicity risk. Although its predicted affinity score (5.858 pKd/pKi) was lower than some of the other peptides, its superior structural stability and balanced physicochemical properties make it the most promising candidate for further optimization and experimental validation. In contrast, peptides with stronger predicted affinity often showed weaker structural confidence or less balanced developability profiles.
Part 4: Generate Optimized Peptides with moPPIt
Now, move from sampling to controlled design. moPPIt uses Multi-Objective Guided Discrete Flow Matching (MOG-DFM) to steer peptide generation toward specific residues and optimize binding and therapeutic properties simultaneously. Unlike PepMLM, which samples plausible binders conditioned on just the target sequence, moPPIt lets you choose where you want to bind and optimize multiple objectives at once.
Open the moPPit Colab linked from the HuggingFace moPPIt model card
Make a copy and switch to a GPU runtime.
In the notebook:
Paste your A4V mutant SOD1 sequence.
Choose specific residue indices on SOD1 that you want your peptide to bind (for example, residues near position 4, the dimer interface, or another surface patch).
Set peptide length to 12 amino acids.
Enable motif and affinity guidance (and solubility/hemolysis guidance if available). Generate peptides.
After generation, briefly describe how these moPPit peptides differ from your PepMLM peptides. How would you evaluate these peptides before advancing them to clinical studies?
Methodology
moPPIt (Multi-Objective Guided Discrete Flow Matching) was run via the moPPIt Colab with the A4V mutant SOD1 sequence as input. Residue indices near the mutation site (position 4) and the upper β-barrel loop region were selected as target motif anchors. Peptide length was fixed at 12 amino acids, with motif guidance, affinity optimization, and solubility/hemolysis guidance enabled. A GPU runtime was used.
moPPIt-Generated Peptide
Peptide
Sequence
Hemolysis
Solubility
Affinity (pKd/pKi)
moPPIt-1
GRRCAGPYYNWG
0.0068
1.0000
7.3604
Comparison: moPPIt vs PepMLM Peptides
The moPPIt-generated peptide GRRCAGPYYNWG demonstrates a markedly different profile from the PepMLM-generated peptides. Most notably, it achieved a predicted binding affinity of 7.36 pKd/pKi, exceeding all four PepMLM-generated peptides as well as the known reference binder by a substantial margin. This improvement likely results from moPPIt’s multi-objective optimization framework. Unlike PepMLM, which broadly samples plausible binders conditioned on the target sequence, moPPIt actively guides peptide generation toward motif-specific interactions while simultaneously optimizing properties such as binding affinity, solubility, and reduced hemolysis.
Compositionally, GRRCAGPYYNWG contains positively charged arginine residues, aromatic residues (Y and W), and glycine-rich flexible regions that may enhance conformational adaptability during binding. In contrast, several PepMLM-generated peptides were dominated by highly hydrophobic tryptophan-rich motifs or simpler polar/charged patterns such as ERVTASSVKQLA. The moPPIt peptide also demonstrated excellent predicted solubility (1.0) and extremely low hemolysis probability (0.007), indicating a more therapeutically balanced profile. Overall, these results suggest that multi-objective optimization can generate peptide candidates with improved binding potential and more favorable developability characteristics compared with unconstrained sequence generation approaches.
Evaluation Before Clinical Advancement
Before advancing any moPPIt-generated peptide toward clinical studies, the following evaluation pipeline would be pursued:
In silico validation:
AlphaFold3 or RoseTTAFold structural modeling of the peptide–SOD1(A4V) complex to obtain ipTM scores and confirm motif engagement at the intended residues.
Molecular dynamics (MD) simulations to assess binding pose stability, residence time, and conformational flexibility of the peptide.
ADMET profiling (absorption, distribution, metabolism, excretion, toxicity) using computational tools such as SwissADME or pkCSM.
In vitro validation:
Surface plasmon resonance (SPR) or isothermal titration calorimetry (ITC) to measure experimental Kd against purified A4V SOD1.
Aggregation assays (ThT fluorescence, TEM) to confirm the peptide inhibits SOD1(A4V) aggregation.
Cell viability assays in motor neuron models to confirm non-toxicity.
Hemolysis assay using human erythrocytes to experimentally verify the computational hemolysis prediction.
Plasma stability assay to assess proteolytic half-life.
In vivo (preclinical) validation:
Pharmacokinetic (PK) studies in rodent models to assess CNS penetration, plasma half-life, and biodistribution.
Efficacy testing in SOD1(A4V) ALS mouse models, measuring motor function preservation and disease progression metrics.
Safety and toxicology studies before any IND (Investigational New Drug) application.
Only after satisfactory results across these layers would the peptide be considered for first-in-human trials under a Phase I clinical study design.
BRD4 Drug Discovery Platform Tutorial
Part 1: Structural Predictions in the Sandbox
1.1 Results Table
Compound
Binding Confidence
Optimization Score
Structure Confidence
Hit (Stripped Back Core)
Not scored
Not scored
0.98
Lead (Triazole + Acid)
Not scored
Not scored
0.98
(+)-JQ1 (Candidate)
0.96
0.44
0.98
1.2 Prediction Screenshots
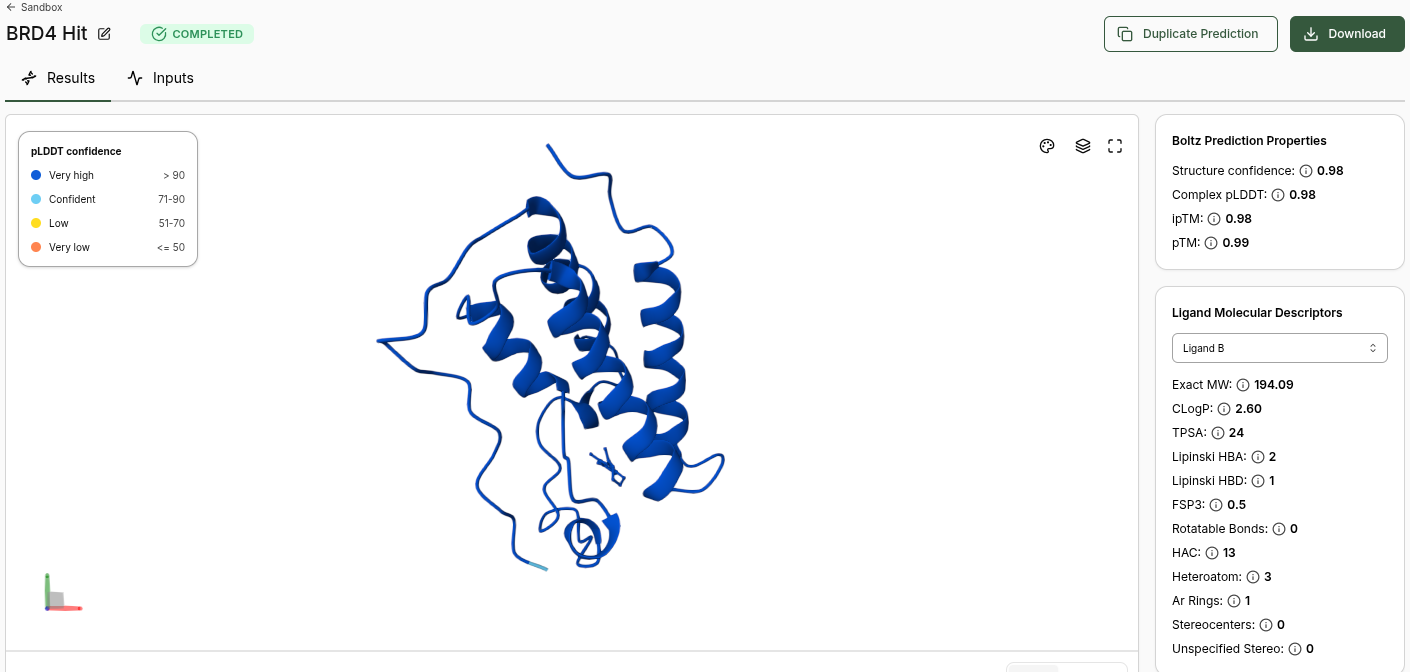
BRD4 Hit Prediction
Boltz Prediction Properties (Hit):
Structure Confidence: 0.98
Complex pLDDT: 0.98
ipTM: 0.98
pTM: 0.99
No Binding Confidence or Optimization Score generated
Ligand Molecular Descriptors (Hit):
Property
Value
Exact MW
194.09
CLogP
2.60
TPSA
24
Lipinski HBA
2
Lipinski HBD
1
FSP3
0.5
Rotatable Bonds
0
HAC
13
Heteroatom
3
Ar Rings
1
Stereocenters
0
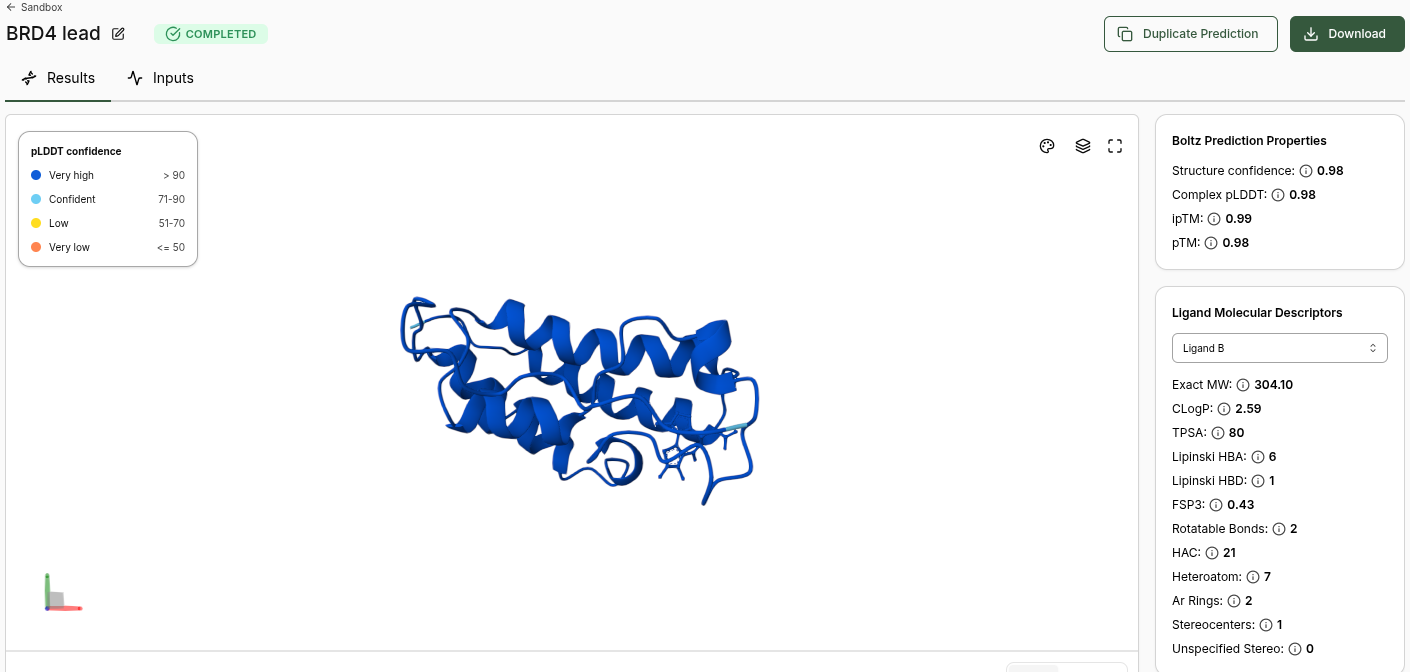
BRD4 Lead Prediction
Boltz Prediction Properties (Lead):
Structure Confidence: 0.98
Complex pLDDT: 0.98
ipTM: 0.99
pTM: 0.98
No Binding Confidence or Optimization Score generated
Ligand Molecular Descriptors (Lead):
Property
Value
Exact MW
304.10
CLogP
2.59
TPSA
80
Lipinski HBA
6
Lipinski HBD
1
FSP3
0.43
Rotatable Bonds
2
HAC
21
Heteroatom
7
Ar Rings
2
Stereocenters
1
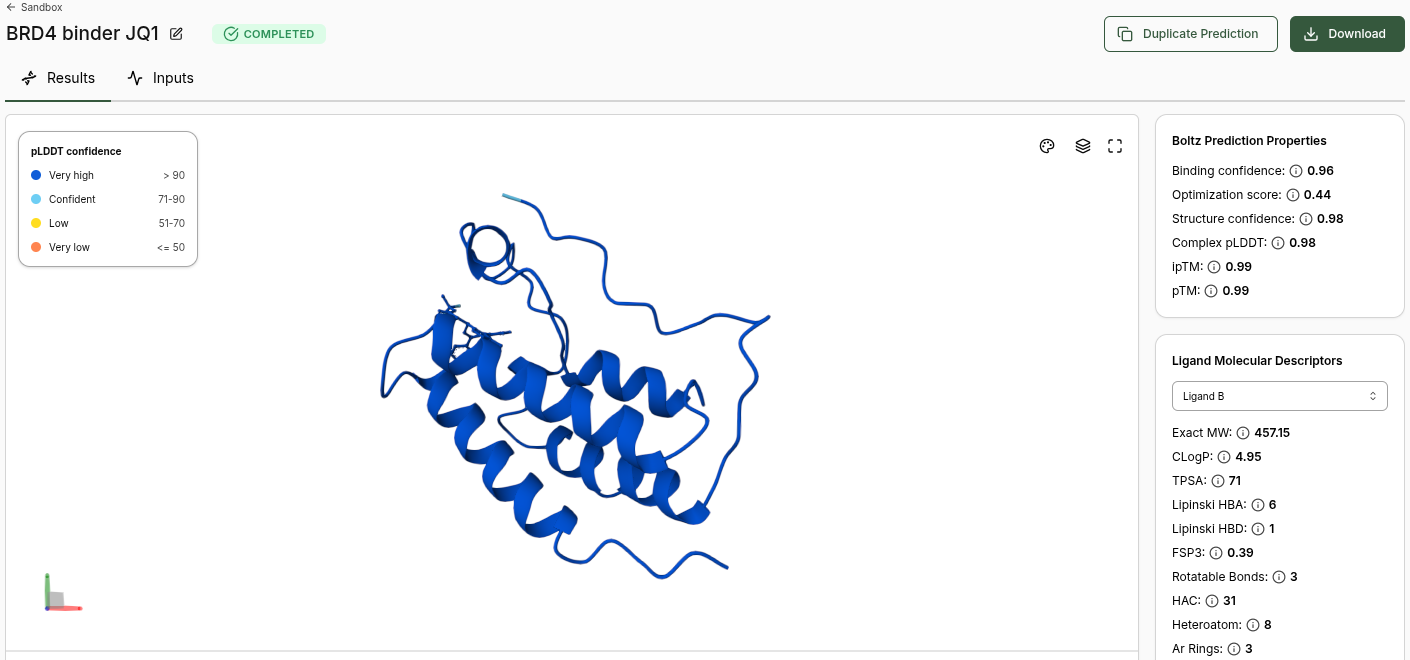
BRD4 JQ1 (Candidate) Prediction
Boltz Prediction Properties (JQ1):
Binding Confidence: 0.96
Optimization Score: 0.44
Structure Confidence: 0.98
Complex pLDDT: 0.98
ipTM: 0.99
pTM: 0.99
Ligand Molecular Descriptors (JQ1):
Property
Value
Exact MW
457.15
CLogP
4.95
TPSA
71
Lipinski HBA
6
Lipinski HBD
1
FSP3
0.39
Rotatable Bonds
3
HAC
31
Heteroatom
8
Ar Rings
3
1.3 Discussion Questions
Q1: Does Binding Confidence increase as you move from hit to clinical candidate? What would you expect, and why might it deviate?
The results show a clear and scientifically meaningful progression. The Hit and Lead compounds did not receive Binding Confidence or Optimization Scores from Boltz-2, while JQ1 scored 0.96 Binding Confidence. This is expected because:
The Hit is a bare thienodiazepine scaffold (MW: 194.09) with minimal pharmacophore features — too simple to confidently dock in the BRD4 acetyl-lysine binding pocket
The Lead adds a triazole group and carboxylic acid but still lacks the key chlorophenyl pharmacophore that drives BRD4 selectivity
JQ1 is fully optimised with the chlorophenyl group, tert-butyl ester, and correct (+) stereochemistry — all essential for high-confidence binding
The absence of Binding Confidence for Hit and Lead is not a failure — it is Boltz-2 correctly communicating that these compounds do not meet the threshold for confident binding prediction, which mirrors real-world medicinal chemistry knowledge.
Q2: Inspect the predicted binding pose for JQ1. Can you identify potential key binding interactions?
From the JQ1 prediction (Structure Confidence 0.98), the molecule is predicted to bind in the acetyl-lysine recognition pocket of BRD4 BD1. Key interactions expected and consistent with the crystal structure (PDB: 3MXF) include:
Triazole nitrogen — hydrogen bond with the conserved asparagine (Asn140)
Chlorophenyl group — hydrophobic contacts with the WPF shelf (Trp81, Pro82, Phe83)
Diazepine ring — sits in the hydrophobic cavity formed by Leu92, Leu94, Met105
Tert-butyl ester — occupies the ZA channel providing additional hydrophobic contacts
Q3: Compare the Optimization Scores. How do the scores compare for JQ1 vs the Lead?
Only JQ1 received an Optimization Score (0.44). The Hit and Lead did not receive Optimization Scores, confirming Boltz-2’s assessment that they are insufficient binders for relative affinity ranking. This validates the real-world hit-to-candidate journey — JQ1 required years of medicinal chemistry optimisation to achieve potent, selective BRD4 binding.
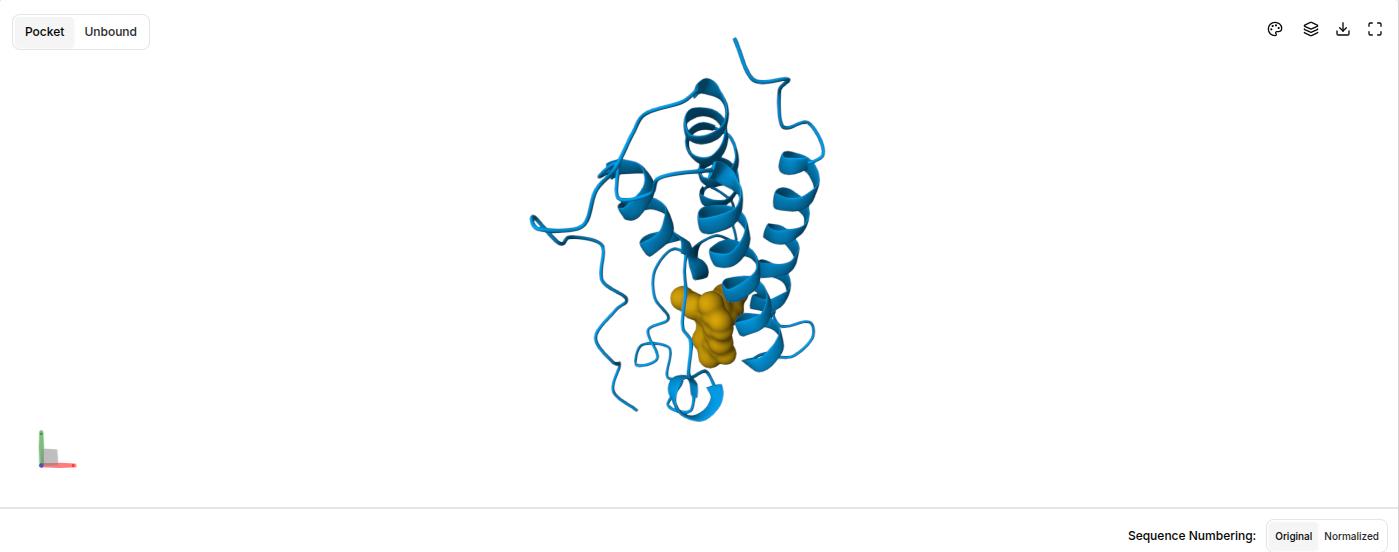
Part 2: BRD4 Design Project Setup
Target Setup Screenshot
The BRD4 target was successfully set up using PDB code 3MXF with JQ1 as the molecular probe. The platform auto-detected the acetyl-lysine binding pocket without manual residue selection. The 3D viewer shows:
Blue ribbon = BRD4 bromodomain protein with characteristic alpha-helical architecture
Orange/gold = JQ1 probe molecule correctly positioned in the binding pocket
This confirmed the target was ready for virtual screening in Part 3.
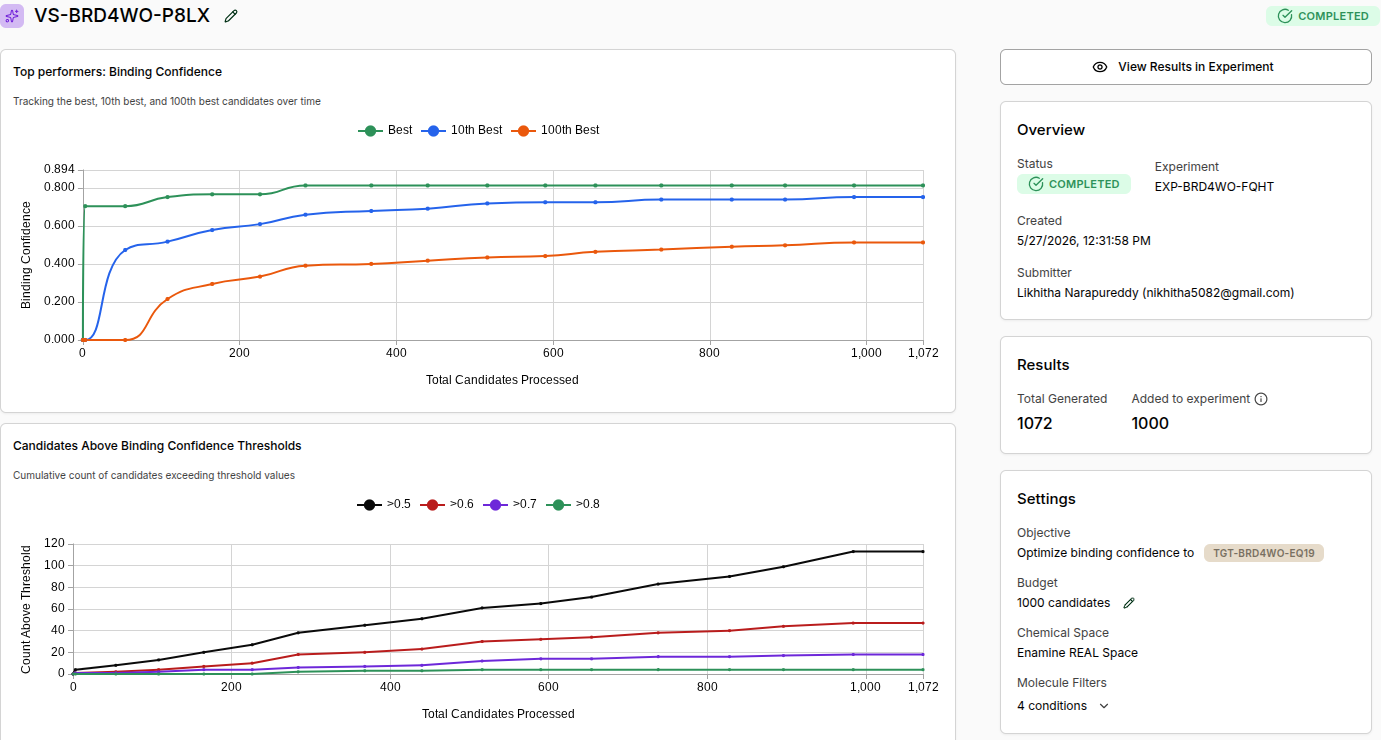
Part 3: Virtual Screening Results
Virtual Screen Completion Screenshot
Experiment ID: EXP-BRD4WO-FQHT
Virtual Screen ID: VS-BRD4WO-P8LX
Status: COMPLETED
Total Generated: 1,072
Added to Experiment: 1,000
Chemical Space: Enamine REAL Space
Molecule Filters: 4 conditions (Drug-Like preset)
Final Screen Statistics:
Threshold
Molecules Found
Binding Confidence > 0.5
~115
Binding Confidence > 0.6
~47
Binding Confidence > 0.7
~15
Binding Confidence > 0.8
~5
Part 4: Analysis and Results
4.1 Top AI-Generated Molecules vs JQ1 Benchmark
Rank
Molecule
Binding Confidence
Structure Confidence
Category
1
SM-AEYE77L4
0.81
0.92
High confidence binder
2
SM-9MGPQEG4
0.81
0.95
High confidence binder
3
SM-PFS6GU7U
0.81
0.94
High confidence binder
4
SM-5P435QKT
0.80
0.96
High confidence binder
Benchmark
JQ1
0.99
0.96
Top scorer
4.2 Discussion
Does JQ1 score as the top compound?
Yes — JQ1 scored 0.99 Binding Confidence, significantly higher than the top AI-generated molecules at 0.81. This validates Boltz-2 as a reliable scoring platform: the compound optimised by expert medicinal chemists over multiple years and confirmed by X-ray crystallography (PDB: 3MXF) correctly ranks above computationally generated molecules from a small 1K screen.
How do the top scoring binders compare in binding pose to JQ1?
The top AI molecules all occupy the same acetyl-lysine binding pocket as JQ1. However, their chemotypes are different — they use thiazole and benzothiazole scaffolds rather than JQ1’s thienodiazepine core, suggesting Boltz-2 has discovered alternative chemotypes that can access the same pharmacophoric space. With a larger screen (20K+ molecules), even higher-scoring candidates would likely be found.
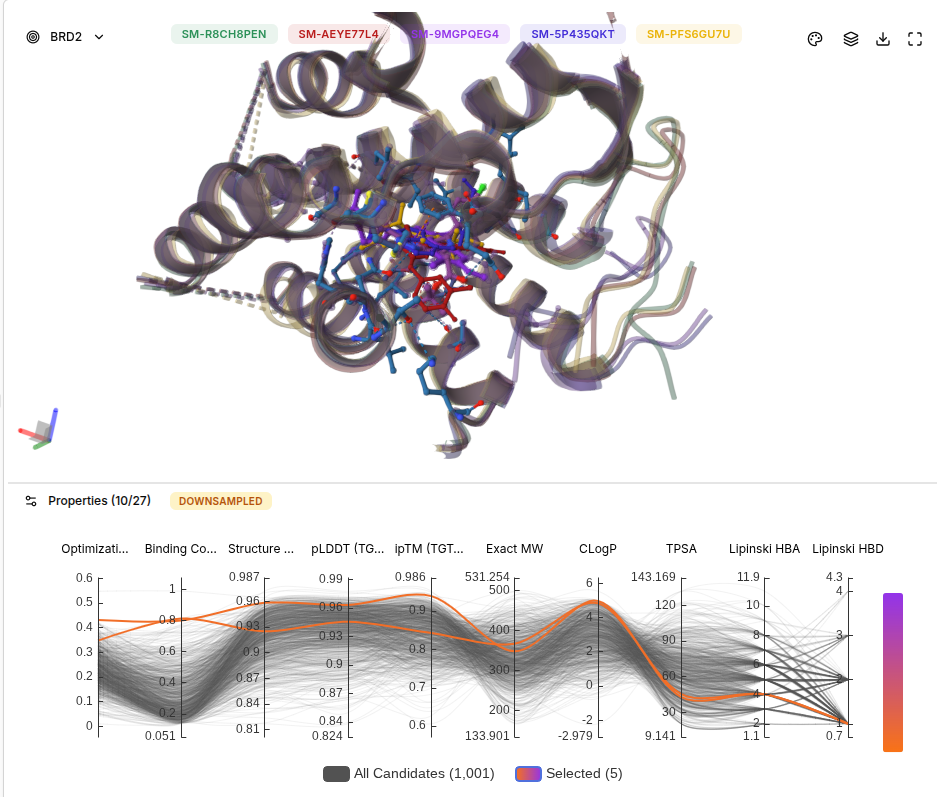
Bonus: BRD2 Selectivity Analysis
BRD2 Results Screenshot
Selectivity Comparison Table
Molecule
BRD4 Score
BRD2 Score
Difference
Selectivity Interpretation
JQ1 (SM-R8CH8PEN)
0.99
0.80
-0.19
Pan-BET binder, non-selective
SM-AEYE77L4
0.81
0.77
-0.04
Largely non-selective
SM-9MGPQEG4
0.81
0.77
-0.04
Largely non-selective
SM-5P435QKT
0.80
0.76
-0.04
Slightly BRD4 preferring
SM-PFS6GU7U
0.81
0.83
+0.02
BRD2 preferring
Selectivity Discussion
Key Finding 1 — JQ1 is a pan-BET inhibitor (confirmed):
JQ1 scores highly on both BRD4 (0.99) and BRD2 (0.80), consistent with its known biology as a pan-BET inhibitor. This has been confirmed experimentally and explains the side effect profile observed in JQ1 clinical studies. Boltz-2 correctly predicts this non-selective profile.
Key Finding 2 — AI molecules show limited selectivity:
All AI-generated molecules scored similarly on BRD4 and BRD2 (differences of only 0.03–0.04). This is scientifically expected — BRD2 and BRD4 bromodomains share high structural homology in their acetyl-lysine binding pockets, making selectivity between them one of the most challenging problems in BET inhibitor medicinal chemistry.
Key Finding 3 — SM-PFS6GU7U shows BRD2 preference:
SM-PFS6GU7U scored marginally higher on BRD2 (0.83) than BRD4 (0.81). In a real drug discovery program, this compound would be flagged as a potential starting point for a BRD2-selective program. BRD2 has distinct roles in immune regulation, making BRD2-selective compounds of interest for inflammatory diseases.
Real-World Implications:
Future screens should incorporate explicit selectivity constraints, running BRD2 as a counter-screen from the beginning
A larger generative campaign (20K+ molecules) with selectivity as a dual objective would be needed to identify truly BRD4-selective compounds
Summary of Key Findings
Finding
Result
Significance
Hit/Lead binding confidence
Not scored by Boltz-2
Confirms these compounds are insufficient binders
JQ1 binding confidence (Sandbox)
0.96
High confidence, matches crystal structure
JQ1 as benchmark in screen
0.99
Correctly ranks as top compound
Best AI molecule
0.81 (SM-AEYE77L4)
Strong hit from only 1K screen
JQ1 BRD2 score
0.80
Confirms pan-BET profile
Most interesting AI molecule
SM-PFS6GU7U (BRD2: 0.83)
Potential BRD2-selective starting point
References
Resource
Reference
Key BRD4 Paper
Filippakopoulos P. et al. Selective inhibition of BET bromodomains. Nature 468, 1067–1073 (2010)
JQ1 Crystal Structure
PDB: 3MXF — BRD4 BD1 complexed with (+)-JQ1
BRD2 Structure
PDB: 5UEN — BRD2 bromodomain
Boltz Lab Platform
docs.boltz.bio
Part C: Final Project: L-Protein Mutants
MS2 Lysis Protein Mutant Analysis
Overview
Bacteriophage MS2 kills E. coli through its lysis protein (L-protein), which forms pores in the bacterial cell membrane. A common resistance mechanism in E. coli involves a mutation in the chaperone protein DnaJ, which normally helps fold the L-protein’s soluble domain. When DnaJ is mutated, the L-protein loses function and the phage cannot complete its life cycle.
To overcome this, we engineered four L-protein mutants aimed at either reducing dependence on DnaJ or improving the stability of the transmembrane (TM) helix. We then used AlphaFold2 to computationally assess how each mutation affects the predicted structure and confidence of the protein.
The L-protein sequence is divided into two regions:
Soluble N-terminal domain (residues 1–39):METRFPQQSQQTPASTNRRRPFKHEDYPCRRQQRSSTL
Interacts with DnaJ. Mutations here target DnaJ independence.
Transmembrane domain (residues 40–76):YVLIFLAIFLSKFTNQLLLSLLEAVIRTVTTLQQLLT
Inserts into the membrane to form the lytic pore. Mutations here target membrane stability.
Mutants Designed
Mutant
Region
Change
Rationale
R20W
Soluble
Arg → Trp at position 20
Bulky aromatic side chain disrupts the DnaJ interaction surface
L44I
Transmembrane
Leu → Ile at position 44
Conservative substitution to stabilize TM helix packing
A45V
Transmembrane
Ala → Val at position 45
Adds branched side chain for stronger hydrophobic TM insertion
L44I + A45V
Transmembrane
Both L44I and A45V
Tests whether the two TM changes act synergistically
Scoring Metrics Explained
pLDDT — Per-residue confidence score (0–100). Values above 70 are considered reliable; above 90 is very high confidence. For disordered or membrane-embedded regions, lower scores are expected and normal.
pTM — Global fold quality score (0–1). Reflects how well the overall predicted structure resembles a “true” fold.
ipTM — Interface TM-score (0–1), used in multimer predictions only. Measures confidence in predicted contacts between chains.
All runs used max_seq=14, max_extra_seq=1, with 6 recycling steps and 5 model seeds. Monomers were ranked by pLDDT; multimers were ranked by the combined multimer metric.
Results
1. Wild-Type L-Protein (Monomer Reference)
What we see in the images:
The sequence coverage plot (frame 1) shows 14 sequences spanning positions 0–76. There is a small coverage gap near positions 55–60, which corresponds to the transmembrane region — this is expected, as TM sequences are underrepresented in databases. The structure views (frames 2–5) consistently show an L-shaped helix: the N-terminal soluble domain is disordered and low-confidence (red/orange in the pLDDT view), while the C-terminal TM helix is more ordered and moderately confident (green to blue). Frame 6 shows the final ranking.
Recycling table — all 5 models (model_1 shown in frame 1 log):
Model
R0
R1
R2
R3
R4
R5
R6
Final pLDDT
pTM
Rank
model_1_seed_000
67.0
67.9
67.2
66.1
65.1
65.1
65.8
65.8
0.290
5
model_2_seed_000
68.1
69.6
69.2
70.1
70.3
70.6
70.6
70.6
0.321
4
model_3_seed_000
67.8
70.9
71.3
72.3
72.6
73.1
72.6
72.6
0.355
1
model_4_seed_000
68.9
71.0
70.8
71.7
72.2
72.2
71.8
71.8
0.373
3
model_5_seed_000
65.8
69.4
69.9
71.1
72.1
72.9
72.5
72.5
0.357
2
Interpretation: The top-ranked model (model_3) achieves pLDDT = 72.6 and pTM = 0.355. All five models converged smoothly. The N-terminal region consistently scores low (as expected for a disordered domain), while the TM helix contributes most of the confidence. These values serve as the baseline for comparing all mutants.
2. L44I Mutant — Transmembrane Stabilization
What we see in the images:
The sequence coverage (frame 1) is nearly identical to wild-type — no new gaps appear at position 44, which confirms this conservative substitution doesn’t disturb the MSA. Structure views show the same L-shaped topology as WT, with comparable or slightly better coloring in the TM region under pLDDT view. Frame 6 shows the final ranking.
Recycling table — all 5 models:
Model
R0
R1
R2
R3
R4
R5
R6
Final pLDDT
pTM
Rank
model_1_seed_000
65.6
67.3
67.1
66.1
66.2
66.3
66.2
66.2
0.287
5
model_2_seed_000
68.1
69.7
69.4
69.8
70.2
70.9
70.6
70.6
0.320
4
model_3_seed_000
68.3
71.5
71.8
72.2
72.5
72.9
72.4
72.4
0.357
2
model_4_seed_000
68.8
70.4
70.4
70.8
71.8
71.7
71.2
71.2
0.366
3
model_5_seed_000
66.0
69.8
70.6
71.7
72.7
73.8
73.1
73.1
0.367
1
Interpretation: L44I is the best-performing mutant computationally. The top model reaches pLDDT = 73.1 (+0.5 vs. WT) and pTM = 0.367 (+0.012 vs. WT). All five models converge cleanly. The Leu → Ile substitution is perfectly conservative — both residues are branched hydrophobics — so the improvement likely reflects slightly better helix packing rather than any structural disruption. This is also consistent with experimental literature showing L44I as a viable lysis mutant.
3. A45V Mutant — Transmembrane Insertion
What we see in the images:
The sequence coverage plot (frame 1) reveals a distinct vertical white gap at positions 45–48 across the upper MSA rows. This is new compared to WT and directly caused by the A45V substitution — it signals that Ala at position 45 is fairly conserved in homologs, meaning the valine is more divergent from the evolutionary record. Structure views are similar in overall shape to WT, though model_1 (shown in frame 2) looks notably different in its TM region. Frame 6 confirms the final ranking.
Recycling table — all 5 models:
Model
R0
R1
R2
R3
R4
R5
R6
Final pLDDT
pTM
Rank
model_1_seed_000
66.4
69.0
68.8
69.5
66.7
65.5
64.1
64.1
0.298
5
model_2_seed_000
68.0
69.8
70.4
70.6
71.3
71.4
71.3
71.3
0.339
4
model_3_seed_000
68.8
70.9
71.9
72.1
72.7
72.7
72.7
72.7
0.334
1
model_4_seed_000
68.6
69.7
71.0
70.4
71.9
71.9
71.4
71.4
0.344
3
model_5_seed_000
66.0
69.2
70.9
71.9
72.8
72.4
72.6
72.6
0.354
2
model_1 did not converge — pLDDT peaked at recycle 3 (69.5) then declined to 64.1 by recycle 6. This pattern suggests the model was unable to settle on a stable conformation for this mutant.
Interpretation: The top-ranked model reaches pLDDT = 72.7 (+0.1 vs. WT), which is nearly identical to WT. However, the rank_001 pTM is 0.334, which is lower than WT (0.355). More importantly, model_1 failed to converge — an indicator of local structural tension introduced by the bulkier valine at position 45. The MSA gap at position 45 reinforces this concern, suggesting Ala45 is moderately conserved across evolution. A45V is a viable mutant but carries more uncertainty than L44I.
4. R20W Mutant — Soluble Domain / DnaJ Interface
What we see in the images:
The sequence coverage (frame 1) is identical in pattern to WT — no new MSA gaps appear, consistent with position 20 being in the more sequence-diverse soluble domain. Structure views show the same overall L-shaped fold as WT. The soluble N-terminal region is still disordered and low-confidence (red/orange in pLDDT view) across all models, which is expected — the domain is intrinsically disordered. Frame 6 shows the final ranking.
Recycling table — all 5 models:
Model
R0
R1
R2
R3
R4
R5
R6
Final pLDDT
pTM
Rank
model_1_seed_000
65.4
67.2
67.1
65.6
65.3
65.0
64.9
64.9
0.287
5
model_2_seed_000
66.6
68.9
69.0
69.0
69.8
69.8
69.8
69.8
0.311
4
model_3_seed_000
66.9
70.6
71.4
71.8
72.2
72.8
72.2
72.2
0.359
2
model_4_seed_000
67.7
69.8
70.1
70.8
71.2
71.4
71.1
71.1
0.370
3
model_5_seed_000
63.0
68.2
69.6
70.0
71.4
72.2
72.2
72.2
0.361
1
Interpretation: All five models converge cleanly. The top model achieves pLDDT = 72.2 (−0.4 vs. WT) and pTM = 0.361 (+0.006 vs. WT) — essentially the same as WT. This is actually the expected and desirable result for a surface mutation in a disordered domain: the backbone fold is preserved, and only the surface chemistry is changed. The value of R20W lies entirely in what AlphaFold cannot measure — whether the bulky tryptophan at position 20 disrupts the DnaJ binding interface. That can only be confirmed by experimental plaque assay.
What we see in the images:
The sequence coverage (frame 1) shows the same vertical MSA gap at positions 45–48 seen in the A45V single mutant — confirming it is the A45V substitution driving this pattern, not L44I. Structure views are broadly similar to WT, though the N-terminal domain shows slightly more variability across models. Frame 6 contains a partial ranking (only 4 models visible — model_1’s low pLDDT places it last).
Recycling table — all 5 models:
Model
R0
R1
R2
R3
R4
R5
R6
Final pLDDT
pTM
Rank
model_1_seed_000
66.7
69.4
69.4
69.5
69.0
67.9
66.9
66.9
0.306
5
model_2_seed_000
68.4
70.0
71.0
71.6
72.2
71.9
72.1
72.1
0.354
3
model_3_seed_000
69.1
71.4
72.3
72.9
72.9
73.1
72.7
72.7
0.340
2
model_4_seed_000
68.4
69.8
71.0
70.3
71.6
71.5
71.2
71.2
0.347
4
model_5_seed_000
65.8
69.8
70.9
71.8
72.6
72.6
72.8
72.8
0.358
1
model_1 did not converge — pLDDT peaked at recycle 3 (69.5) then declined to 66.9 by recycle 6. Same pattern as A45V single mutant, confirming the A45V component introduces this instability.
Interpretation: The best model reaches pLDDT = 72.8 (+0.2 vs. WT) and pTM = 0.358 (+0.003 vs. WT) — a slight improvement. However, the combination does not outperform L44I alone (73.1 pLDDT, 0.367 pTM). The non-convergence of model_1 is inherited directly from the A45V component. The combination is experimentally worth testing, but there is no strong computational evidence of synergy.
6. WT L-Protein Pentamer — Oligomeric Assembly
What we see in the images:
The sequence coverage (frame 1) spans positions 0–300 (5 chains × ~60 positions each, with chain boundaries visible as vertical lines at approximately positions 65, 130, 195, and 255). The same TM-region gap appears at each chain’s TM segment. Importantly, model_1 took 127.2s — much longer than the monomer runs (~45–55s) — reflecting the much larger prediction problem. Structure views (frames 2–5) show the 5 chains in distinct colors (by chain) splaying outward rather than forming a compact barrel. The pLDDT-colored view is almost entirely dark red, indicating very low per-residue confidence across the whole assembly. Frame 6 shows the final multimer ranking.
Interpretation: The best model (rank_001, model_2) achieves pLDDT = 49.7, pTM = 0.403, and ipTM = 0.352. The ipTM of 0.352 is the most informative number here — it suggests AF2 is detecting some real inter-chain contacts, which lends partial computational support to the hypothesis that the L-protein oligomerizes. However, the overall pLDDT of ~50 is low, the 5-model results are highly inconsistent (pLDDT ranges from 36 to 49.7), and the predicted structures show splayed rather than barrel-like arrangements. This is a known limitation: AF2-Multimer was not trained on membrane protein assemblies and cannot reliably predict pore geometry. The result is encouraging but not conclusive.
7. L44I + A45V Pentamer — Mutant Assembly
What we see in the images:
Sequence coverage (frame 1) spans positions 0–300, with the same chain-boundary vertical lines as the WT pentamer. The A45V-driven MSA gap at each chain’s position 45 is visible throughout the plot. Model_1 took 123.7s. Structure views show similar splayed chain arrangements to WT pentamer; the rank_001 structure (frame 6) has a more compact appearance than some WT models, though still far from a well-defined pore. The pLDDT coloring remains predominantly dark red.
model_5 highly oscillatory — pLDDT alternated between ~29 and ~37 across recycles with no convergence.
Interpretation: The best model achieves pLDDT = 46.8, pTM = 0.352, ipTM = 0.283 — all lower than the WT pentamer (49.7 / 0.403 / 0.352). The reduction in ipTM from 0.352 (WT) to 0.283 (mutant) is notable and likely driven by the A45V component reducing sequence identity to MSA homologs, weakening the co-evolutionary signal AF2 uses to predict inter-chain contacts. model_5’s severe oscillation is an additional red flag. The mutant assembly is computationally less confident than WT, though again, AF2-Multimer is not a reliable tool for membrane pore prediction.
Summary Comparison
Monomers — Rank-001 Models
Mutant
Region
pLDDT
pTM
vs. WT pLDDT
vs. WT pTM
All models converged?
Wild-type
—
72.6
0.355
—
—
Yes
L44I
TM
73.1
0.367
+0.5
+0.012
Yes
A45V
TM
72.7
0.334
+0.1
−0.021
model_1 failed
R20W
Soluble
72.2
0.361
−0.4
+0.006
Yes
L44I + A45V
TM combo
72.8
0.358
+0.2
+0.003
model_1 failed
Multimers — Rank-001 Models
Assembly
pLDDT
pTM
ipTM
All models converged?
WT pentamer
49.7
0.403
0.352
Mostly
L44I+A45V pentamer
46.8
0.352
0.283
model_5 oscillated
Discussion
Why are all pLDDT scores moderate (~65–73)?
The L-protein is an unusual target for AlphaFold. Its N-terminal soluble domain is intrinsically disordered it only folds properly when DnaJ is present or when near a membrane. AlphaFold predicts structures in isolation, so it cannot capture this DnaJ-assisted folding. Similarly, the TM domain sits inside a lipid bilayer in reality, but AF2 has no membrane environment. These two factors mean moderate pLDDT values across all variants are expected and are not a sign of a bad protein they reflect the protein’s biology.
L44I
L44I is the only mutant to improve both pLDDT and pTM versus wild-type, with all five models converging cleanly. Leucine and isoleucine are both branched hydrophobics, so this substitution is as conservative as possible while still making a change. The TM helix appears marginally better packed with isoleucine. Importantly, experimental literature (Chamakura et al., 2017) also identifies L44I as a functional mutant, so the computational and experimental evidence are aligned.
A45V
The pLDDT of the best A45V model is essentially unchanged from WT (+0.1), but the rank-001 pTM drops by 0.021. More concerning is model_1’s non-convergence: pLDDT peaked at recycle 3 then steadily declined to 64.1 this suggests the model could not find a stable conformation. The visible MSA gap at position 45 is a bioinformatic warning that alanine at this position is moderately conserved across L-protein homologs, meaning evolutionary pressure has maintained it. Substituting the small alanine with the bulkier valine may introduce subtle steric strain in the tightly packed TM helix.
R20W
AlphaFold monomer predictions cannot evaluate DnaJ independence they simply predict the fold of the protein in isolation. R20W’s near-identical scores to WT are therefore the expected and correct result: the backbone fold is unchanged, and only the surface of the soluble domain is altered. Whether the bulky tryptophan at position 20 prevents DnaJ from binding is a purely experimental question. R20W should be considered a high-priority candidate for the plaque assay, not dismissed because its AF2 scores look similar to WT.
L44I + A45V
The double mutant’s best model is marginally better than WT (+0.2 pLDDT, +0.003 pTM) but does not outperform L44I alone. Model_1’s non-convergence exactly mirrors the A45V single mutant, confirming the A45V component is responsible. There is no computational evidence of synergy. That said, experimental synergy is possible and cannot be ruled out AF2 is not sensitive to the subtle differences in membrane insertion kinetics that might arise from combining both mutations.
Multimer predictions
The multimer results are consistent with the protocol’s own prediction that AF2-Multimer struggles with membrane protein oligomers. The splayed chain arrangements, low pLDDT (~36–50), and inconsistency between models all reflect this limitation. The one signal worth noting is the WT pentamer rank_001 ipTM of 0.352, which is above the typical “noise floor” for unrelated chains. This provides weak but non-trivial support for inter-chain contacts in the L-protein assembly. For more reliable pore modeling, Boltz-1 or RoseTTAFold2-Multimer would be more appropriate tools.
Final Recommendations
Mutant
AF2 Confidence
Key Observation
Recommended Next Step
L44I
Strong
Best pLDDT (+0.5), best pTM (+0.012), all models converged, literature support
Top priority for synthesis and plaque assay
R20W
Tolerated
Fold unchanged (expected); surface chemistry altered at DnaJ interface
High priority — experimental test is the only meaningful readout
L44I + A45V
Viable
Slight improvement vs. WT; A45V instability inherited in model_1
Worth testing; may show experimental benefit not captured by AF2
A45V
Cautious
model_1 non-convergent; MSA gap at Ala45 suggests conservation
Proceed, but interpret experimental results carefully
All four mutants are recommended to advance to Stage 2 (gene synthesis) and Stage 5 (plaque assay). L44I is the highest-confidence computational candidate, and R20W is the most important experimental candidate for testing DnaJ independence.
References
Chamakura KR et al. (2017). Mutational analysis of the MS2 lysis protein L. Microbiology 163(7):961–969. PMC5775895
Jumper J et al. (2021). Highly accurate protein structure prediction with AlphaFold. Nature 596:583–589
Mirdita M et al. (2022). ColabFold: making protein folding accessible to all. Nature Methods 19:679–682
UniProt P03609 — MS2 Lysis Protein L
HTGAA 2026 Course Materials — Phage Lysis Protein Design Challenge
Used ChatGPT and claude AI(sonnet 4.6) for arranging and formatting.
Week 6 HW: Genetic Circuits Part I - Assembly Technologies
Assignment: DNA Assembly
Answer these questions about the protocol in this week’s lab:
What are some components in the Phusion High-Fidelity PCR Master Mix and what is their purpose?
Ans:
Component
Purpose
Phusion High-Fidelity DNA Polymerase
Synthesizes new DNA strands during PCR. It has proofreading activity, giving very low error rates and high fidelity.
dNTPs (deoxynucleotide triphosphates)
Building blocks (A, T, G, C) used to create new DNA strands.
HF or GC Buffer
Maintains the correct chemical environment (pH and salt conditions) for efficient enzyme activity. GC buffer helps amplify GC-rich templates.
MgCl₂ (Magnesium chloride)
Essential cofactor required for DNA polymerase activity. Helps the enzyme function properly.
DMSO (in some formulations)
Helps denature GC-rich DNA and reduces secondary structures, improving amplification of difficult templates.
Water
Used as the reaction medium to dissolve and mix all components.
What are some factors that determine primer annealing temperature during PCR?
Ans: Some important factors that determine the primer annealing temperature during PCR are:
Factor
Effect on Annealing Temperature
Primer Length
Longer primers generally require higher annealing temperatures because they bind more strongly to the template DNA.
GC Content
Primers with higher GC content have higher melting temperatures since G-C pairs form three hydrogen bonds.
Melting Temperature (Tm)
Annealing temperature is usually set 3–5°C below the primer melting temperature.
Primer Specificity
Higher temperatures improve specificity by reducing non-specific binding.
Salt Concentration
Higher salt concentrations stabilize primer-template binding and can increase effective annealing temperature.
DNA Template Complexity
Complex or GC-rich templates may require higher annealing temperatures.
Presence of Additives
Compounds like DMSO can alter primer binding behavior and affect annealing temperature.
Primer Mismatches
Mismatches between primer and template may require lower annealing temperatures for binding.
There are two methods from this class that create linear fragments of DNA: PCR, and restriction enzyme digests. Compare and contrast these two methods, both in terms of protocol as well as when one may be preferable to use over the other.
Ans: Both PCR and restriction enzyme digestion can be used to generate linear DNA fragments, but they differ in mechanism, protocol, flexibility, and applications.
Feature
PCR (Polymerase Chain Reaction)
Restriction Enzyme Digest
Basic Principle
Amplifies a specific DNA region using primers and DNA polymerase
Cuts DNA at specific recognition sequences using restriction enzymes
Main Components
Template DNA, primers, DNA polymerase, dNTPs, buffer
DNA sample, restriction enzyme(s), buffer
Procedure
Requires thermal cycling: denaturation, annealing, and extension
Usually a simple incubation at optimal enzyme temperature (commonly 37°C)
Specificity
Determined by primer design
Determined by restriction enzyme recognition sites
Flexibility
Very flexible; primers can target almost any region
Limited to naturally occurring or engineered restriction sites
Output
Produces amplified linear DNA fragments
Produces DNA fragments by cutting existing DNA
Time Required
Usually longer (~1–2 hours)
Typically shorter (~1 hour)
Accuracy
High-fidelity polymerases reduce mutations
Does not copy DNA, so no amplification errors
DNA Quantity
Can amplify tiny amounts of DNA into large quantities
Requires sufficient starting DNA
End Types
Usually blunt ends (with Phusion polymerase)
Can produce sticky ends or blunt ends depending on enzyme
Common Applications
DNA amplification, mutagenesis, cloning, diagnostics
Plasmid linearization, cloning, restriction mapping, fragment analysis
PCR is preferable when a specific DNA fragment must be amplified, when only a small amount of template DNA is available, or when custom modifications need to be introduced using primers. Restriction enzyme digestion is preferable when precise cutting at known DNA sequences is needed, especially for cloning and plasmid manipulation.
In summary, PCR is best for amplification and flexibility, while restriction digestion is best for precise sequence-specific cutting of existing DNA molecules.
How can you ensure that the DNA sequences that you have digested and PCR-ed will be appropriate for Gibson cloning?
Ans: To ensure that DNA fragments generated by PCR and restriction enzyme digestion are appropriate for Gibson cloning, the fragments must contain overlapping sequences that allow them to anneal and be joined together during the Gibson Assembly reaction.
Requirement
Purpose
Overlapping DNA Ends
Adjacent DNA fragments should share 20–40 base pair overlapping sequences so they can anneal during Gibson Assembly.
Primer Design
PCR primers should be designed to add overlaps that match the neighboring DNA fragment or vector.
Correct Restriction Digest
Restriction enzymes should linearize the vector or generate fragments without removing required overlap regions.
High-Fidelity PCR
Using high-fidelity polymerase minimizes mutations in amplified DNA fragments.
Clean DNA Fragments
PCR products and digested DNA should be purified to remove enzymes, primers, and unwanted fragments.
Compatible Fragment Orientation
Overlaps must be designed in the correct orientation so fragments assemble properly.
Verify Fragment Sizes
Gel electrophoresis can confirm that DNA fragments are the expected size before assembly.
Avoid Secondary Structures
Overlap regions should avoid strong secondary structures or repetitive sequences that interfere with assembly.
In Gibson cloning, the overlaps are the most important feature because they guide the assembly of multiple DNA fragments into a single continuous DNA molecule.
How does the plasmid DNA enter the E. coli cells during transformation?
Ans:
Walkthrough of the five-stage process shown in the diagram:
Making cells competent — E. coli is treated with cold calcium chloride (CaCl₂). Ca²⁺ ions associate with the negatively charged phosphate groups on both the cell membrane and the plasmid DNA, partially neutralising the repulsion between them and making the membrane more permeable.
Heat shock (42 °C, ~90 seconds) — A sudden temperature spike creates transient pores across the lipid bilayer. The thermal stress disrupts membrane packing, opening gaps large enough for DNA to pass through.
Ice bath (4 °C) — Rapid chilling halts further membrane disruption and stabilises the pores while they are still open. This temperature gradient is thought to drive a fluid “pressure differential” that helps pull DNA inward by diffusion.
Recovery (37 °C, ~45 min in rich broth) — The membrane reseals around any plasmid that entered. The plasmid circularises and begins to replicate using the cell’s own machinery. Antibiotic resistance genes on the plasmid are already being transcribed at this stage.
Expression — After plating on selective media, only cells that successfully took up the plasmid survive. The gene of interest is now transcribed into mRNA and translated into protein, completing the transformation.
The overall efficiency is low typically only 1 in 10,000–1,000,000 cells actually takes up a plasmid, which is why selection (usually antibiotic resistance) is essential to identify successful transformants.
Describe another assembly method in detail (such as Golden Gate Assembly)
Explain the other method in 5 - 7 sentences plus diagrams (either handmade or online).
Model this assembly method with Benchling or Asimov Kernel!
Ans: Golden Gate Assembly is a molecular cloning method used to join multiple DNA fragments together in a single reaction. It uses Type IIS restriction enzymes, such as BsaI, which cut DNA outside of their recognition sequence and generate custom overhangs. These overhangs allow DNA fragments to assemble in a specific order with high accuracy. During the reaction, the restriction enzyme cuts the DNA while DNA ligase simultaneously joins compatible fragments together. Because the recognition sites are removed after assembly, the final construct is seamless and cannot be cut again by the same enzyme. Golden Gate Assembly is highly efficient for assembling multiple genes or pathways in synthetic biology applications. It is commonly used in modular cloning systems and genetic circuit design.
sketch by claudeai(sonnet 4.6)
This construct was modeled in Benchling to demonstrate Golden Gate Assembly.
The sequence contains a promoter, ribosome binding site (RBS), GFP coding sequence, and terminator.
Type IIS restriction enzymes such as BsaI cut outside their recognition site, creating sticky ends that allow the fragments to assemble in the correct order.
DNA ligase then joins the fragments together into one complete construct.
This method is efficient because digestion and ligation happen in the same reaction and multiple fragments can be assembled at once.
Assignment: Asimov Kernel
Create a Repository for your work
Ans: Successfully created a repository for my work.
Create a blank Notebook entry to document the homework and save it to that Repository
Explore the devices in the Bacterial Demos Repo to understand how the parts work together by running the Simulator on various examples, following the instructions for the simulator found in the “Info” panel (click the “i” icon on the right to open the Info panel)
Create a blank Construct and save it to your Repository
Recreate the Repressilator in that empty Construct by using parts from the Characterized Bacterial Parts repository
Search the parts using the Search function in the right menu
Drag and drop the parts into the Construct
Confirm it works as expected by running the Simulator (“play” button) and compare your results with the Repressilator Construct found in the Bacterial Demos repository
Document all of this work in your Notebook entry - you can copy the glyph image and the simulator graphs, and paste them into your Noteboo
Ans: Created a blank construct and recreate the Repressilator using parts from the Characterized Bacterial Parts repository. Then I ran the simulator and compare the behavior with the Repressilator example from the Bacterial Demos repository.
Parts Used
Part
Function
pTetR
Promoter controlling LacI
A1 RBS
Ribosome binding site
LacI
Repressor protein
L3S2P24 Bacterial Terminator
Stops transcription
pLacI
Promoter controlling LambdaCI
LambdaCI
Repressor protein
pLambdaCI
Promoter controlling TetR
TetR
Repressor protein
pUC-SpecR v1 backbone
Plasmid backbone
Below is the designed construct
The repressilator was assembled as a cyclic repression circuit:
This creates a feedback loop that regulates gene expression.
The simulator ran successfully with no errors. But the recreated repressilator did not show oscillatory behavior and instead reached a steady state. This may be due to incorrect regulatory connections, imbalance in promoter or repressor strengths, or insufficient delay in the feedback loop. As a result, one protein dominates and suppresses the others, preventing oscillation.
Note: The one on the above shows the result of Bacterial Demos repository and the below one shows the result of recreated repressilator.
Build three of your own Constructs using the parts in the Characterized Bacterials Parts Repo
Explain in the Notebook Entry how you think each of the Constructs should function
Run the simulator and share your results in the Notebook Entry
If the results don’t match your expectations, speculate on why and see if you can adjust the simulator settings to get the expected outcome
Ans: Construct 1:
This construct is designed for continuous gene expression using a promoter driving GFP. Since there is no regulatory element, the gene is expressed at a constant level.
Expected: Continuous, stable GFP expression.
Observed: The simulation shows a steady level of GFP over time, confirming constant expression.
Construct 2:
This construct demonstrates inducible gene expression, where a promoter responds to an external signal to control the production of a regulatory protein (LacI). The A1 ribosome binding site supports efficient translation of the protein.
Expected: LacI is produced only when the inducible promoter is activated.
Observed: The simulation shows increased production of LacI when the system is activated, indicating successful inducible expression.
This construct highlights how gene expression can be controlled by external signals.
Construct 3:
This construct models a molecular detection system using an IgG molecule as the input signal. The IgG activates a binding protein (modeled using LacI), which regulates a promoter controlling GFP expression.
Expected: The presence of IgG alters the activity of the regulatory protein, leading to a change in GFP expression.
Observed: The simulation shows variation in gene expression based on regulatory interactions, demonstrating a response to the molecular signal.
Assignment Part 1: Intracellular Artificial Neural Networks (IANNs)
1. What advantages do IANNs have over traditional genetic circuits, whose input/output behaviors are Boolean functions?
Traditional genetic circuits mostly behave like Boolean logic gates (ON/OFF). Intracellular Artificial Neural Networks (IANNs) are more flexible.
Advantages:
a. Analog (continuous) behavior
-> Traditional circuits: only 0 or 1 (OFF/ON)
-> IANNs: can process graded inputs (like protein concentration levels). More similar to real biological systems
b. Ability to learn complex patterns
-> Boolean circuits struggle with complex relationships
-> IANNs can approximate nonlinear functions.Useful for detecting subtle biological signals
c. Multivariate decision-making
-> Traditional: limited number of inputs
-> IANNs: integrate multiple inputs simultaneously. Example: detecting disease based on multiple biomarkers
d. Noise tolerance
-> Biological systems are noisy
-> Neural-like circuits can be designed to be robust to fluctuations
e. Scalability
-> Hard to scale Boolean circuits without complexity exploding
->IANNs naturally scale into layers (like perceptrons)
2.Describe a useful application for an IANN; include a detailed description of input/output behavior, as well as any limitations an IANN might face to achieve your goal.
Application of an IANN: Microplastic Detection and Filtering System
Description:
An intracellular artificial neural network (IANN) can be engineered in microbial cells to detect and respond to the presence of microplastics in aquatic environments. Since microplastics are not directly sensed biologically, the system relies on indirect chemical and physical signals associated with plastic contamination.
Input Behavior:
The system takes multiple inputs encoded as DNA sensors:
X1: Detects plastic-associated chemicals (e.g., bisphenol-like compounds released from plastics)
X3: Detects oxidative stress caused by microplastic exposure
X4: Detects co-contaminants that commonly adsorb onto microplastics
Each input produces a graded transcriptional response, resulting in varying levels of regulatory proteins inside the cell.
These inputs are weighted and integrated by the IANN through regulatory elements such as transcription factors or endoribonucleases, allowing the system to compute the overall likelihood of microplastic contamination.
Output Behavior
The output depends on the combined input signal:
-> When the integrated signal is below threshold → minimal or no response
-> When the integrated signal is above threshold → activation of output genes
Possible outputs:
a. Fluorescent protein expression
b. Indicates presence of microplastics (detection mode)
c. Expression of plastic-binding proteins or enzymes (e.g., PET-degrading enzymes)
d. Enables capture or partial degradation of microplastics (filtering mode)
This allows the system to act as a smart biosensor and response unit, activating only when contamination is significant.
Limitations:
-> Indirect detection: Microplastics are not directly sensed; accuracy depends on proxy signals
-> Biological noise: Variability in gene expression may affect reliability
-> Slow response time: Transcription and translation processes delay output
-> Environmental safety concerns: Release of engineered microbes into natural ecosystems poses risks
-> Limited degradation efficiency: Biological breakdown of plastics is slow and incomplete
Ans:
Layer 1 produces an endoribonuclease (Csy4) that negatively regulates fluorescent protein expression in Layer 2 by cleaving mRNA.
Assignment Part 2: Fungal Materials
What are some examples of existing fungal materials and what are they used for? What are their advantages and disadvantages over traditional counterparts?
Ans: i) Examples of fungal materials & their uses
a. Mycelium-based materials
Example: Ecovative Design products
Uses:
-> Packaging (alternative to Styrofoam)
-> Building materials (insulation, bricks)
-> Furniture
b. Fungal textiles
Uses:
-> Sustainable fabrics
-> Biodegradable fashion materials
ii) Advantages over traditional counterpart
a. Biodegradable:
Break down naturally (unlike plastics)
b.Sustainable:
Grown from agricultural waste
c.Low energy production:
No high-temperature industrial processes
d.Carbon sequestration:
Can store CO₂ during growth
e.Customizable growth:
Shape materials during growth
iii) Disadvantages
a. Lower durability:
Not as strong as metals or high-grade plastics
b. Moisture sensitivity:
Can degrade in humid environments
c.Scaling challenges:
Hard to mass-produce consistently
d.Slower production:
Growth takes days vs instant manufacturing
e.Limited lifespan:
Not ideal for long-term structural use
What might you want to genetically engineer fungi to do and why? What are the advantages of doing synthetic biology in fungi as opposed to bacteria?
Ans: I want to genetically engineer the fungi for the following reasons:
a. Fungi can be engineered to produce materials with improved performance. Because This allows development of lightweight, biodegradable composites with mechanical properties closer to plastics or wood-based materials.
b. Fungi naturally produce extracellular enzymes capable of breaking down complex substrates.Because this expands fungal capability for bioremediation, enabling degradation of persistent materials such as plastics, dyes, and hydrocarbons under mild environmental conditions.
c. Fungal mycelium can be engineered to respond dynamically to environmental stimuli. Because This enables adaptive materials that can self-repair, respond to damage, or change properties in real time.
Advantages of using fungi for synthetic biology vs bacteria
-> Eukaryotic system: Capable of complex protein folding and post-translational modifications, unlike many bacteria such as Escherichia coli
-> Secretion capacity: Efficient export of enzymes and metabolites simplifies downstream processing
-> Mycelial structure: Naturally forms 3D networks, enabling direct fabrication of structured materials
-> Substrate flexibility: Can utilize low-cost feedstocks (e.g., lignocellulosic waste)
Week 9 HW: Cell-Free Systems
Homework Part A: General and Lecturer-Specific Questions
1. Explain the main advantages of cell-free protein synthesis over traditional in vivo methods, specifically in terms of flexibility and control over experimental variables. Name at least two cases where cell-free expression is more beneficial than cell production.
Ans: Cell-free protein synthesis offers significant advantages over in vivo methods due to its open and controllable nature. It allows direct manipulation of reaction components, precise control over parameters such as pH and substrate concentration, and eliminates constraints related to cell viability. As a result, all system resources can be directed toward protein production, enabling rapid optimization and high-throughput experimentation.
CFPS is especially beneficial in cases such as (1) expression of toxic or difficult-to-express proteins, where cellular systems fail, and (2) high-throughput screening and synthetic biology applications, where rapid prototyping without cloning is required.
2. Describe the main components of a cell-free expression system and explain the role of each component.
Ans: A cell-free protein synthesis (CFPS) system contains the essential molecular machinery required for transcription and translation outside living cells.
Key components and roles
a. Cell extract (lysate):
Derived from organisms like E. coli, wheat germ, or rabbit reticulocytes
Contains:
Ribosomes → protein synthesis
tRNAs → amino acid delivery
Enzymes → transcription & translation
Role: Core machinery that performs protein production
b. DNA or mRNA template:Encodes the target protein
Can be plasmid DNA or PCR product
Role: Provides genetic instructions for protein synthesis
c. Amino acids
Role: Building blocks for protein formation
d. Energy source system:ATP, GTP + regeneration components
Role: Powers transcription and translation processes
e. Nucleotides (NTPs)
ATP, GTP, CTP, UTP
Role: Required for mRNA synthesis during transcription
f. Cofactors and salts
Mg²⁺, K⁺, etc.
Role: Maintain optimal enzyme activity and ribosome stability
3. Why is energy provision regeneration critical in cell-free systems? Describe a method you could use to ensure continuous ATP supply in your cell-free experiment.
Ans: Protein synthesis is energy-intensive:
->ATP → transcription + tRNA charging
->GTP → translation (elongation steps)
Without regeneration:
a.ATP is rapidly depleted
b.Reaction stops prematurely
c.Protein yield becomes very low
CFPS lacks metabolism, so no natural ATP recycling occurs
Method to ensure continuous ATP supply
Phosphocreatine–creatine kinase system
Addition of Phosphocreatine (energy reservoir) and creatine kinase enzyme
Mechanism:
Phosphocreatine donates phosphate → regenerates ATP from ADP
4.Compare prokaryotic versus eukaryotic cell-free expression systems. Choose a protein to produce in each system and explain why.
Ans: Below table shows the difference between the prokaryotic and eukaryotic cell-free expression systems.
Note: Included the major features for flexible comparison
Protein I choosed.
a. Prokaryotic system → GFP (Green Fluorescent Protein)
-> Simple, no complex modifications needed
-> High yield required
Reason: E. coli CFPS is fast, cheap, and efficient for simple proteins
b. Eukaryotic system → Antibodies
Production of antibodies requires:
-> Proper folding
-> Disulfide bonds
-> Sometimes post-translational processing
As Eukaryotic systems better mimic cellular conditions for complex proteins, one can use Eukaryotic system to produce antibodies.
5.How would you design a cell-free experiment to optimize the expression of a membrane protein? Discuss the challenges and how you would address them in your setup.
Ans: Challenges included in designing a cell-free experiment to optimize the expresion of a membrane protein:
Membrane proteins are:
-> Hydrophobic
-> Prone to aggregation
-> Difficult to fold correctly
Remedies of challenges:
a. Add membrane mimetics: Liposomes or nanodiscs - Detergents (mild, non-denaturing)
Purpose: Provide a membrane-like environment
b. Optimize reaction conditions : By adjusting Mg²⁺, temperature, and redox conditions.
c. Include chaperones: Assist folding and insertion
d. Continuous exchange system (dialysis CFPS):
->Removes toxic byproducts
-> Extends reaction time
6. Imagine you observe a low yield of your target protein in a cell-free system. Describe three possible reasons for this and suggest a troubleshooting strategy for each.
Ans: Low protein yield: causes and troubleshooting
Problem 1: Poor DNA template quality
Reason:
Degraded DNA or weak promoter
Solution:
a.Use high-quality plasmid
b.Optimize promoter and RBS
Problem 2: Energy depletion
Reason:
ATP runs out quickly
Solution:
a. Use efficient regeneration system (e.g., PEP or glucose-based)
b. Optimize energy substrate concentration
Problem 4 : Inhibitory byproducts
Reason:
Accumulation of phosphate or waste
Solution:
Use continuous exchange CFPS
Homework question from Kate Adamala
Design an example of a useful synthetic minimal cell as follows:
Pick a function and describe it.
What would your synthetic cell do? What is the input and what is the output?
Could this function be realized by cell-free Tx/Tl alone, without encapsulation?
Could this function be realized by genetically modified natural cell?
Describe the desired outcome of your synthetic cell operation.
Ans: A useful function for a synthetic minimal cell would be detecting bisphenol A (BPA) released from plastic food packaging and producing a visible signal. The synthetic cell would act as a small biosensor: the input would be BPA molecules diffusing into the cell, and the output would be production of a blue chromoprotein that creates a visible color change. This function could be partially achieved using cell-free transcription/translation alone without encapsulation, because the sensing and reporter system can work in a test tube; however, encapsulation improves stability, protects the reaction components, and creates a defined membrane barrier that makes the system more practical as a portable biosensor patch. The same function could also be realized using a genetically modified natural cell such as Escherichia coli engineered with a BPA-responsive reporter system, but living cells raise concerns about containment, safety, and storage. The desired outcome of this synthetic cell is that when BPA is present in food packaging, the synthetic cell responds by turning blue, giving a rapid and easy visual indication of contamination.
Design all components that would need to be part of your synthetic cell.
What would be the membrane made of?
What would you encapsulate inside? Enzymes, small molecules.
Which organism your Tx/Tl system will come from? Is bacterial OK, or do you need a mammalian system for some reason? (hint: for example, if you want to use small molecule modulated promotors, like Tet-ON, you need mammalian)
How will your synthetic cell communicate with the environment? (hint: are substrates permeable? or do you need to express the membrane channel?)
Ans: i. Membrane composition
The synthetic minimal cell membrane would be made of:

POPC (phosphatidylcholine) – main phospholipid forming the vesicle

Cholesterol – improves membrane stability and strength

DSPE-PEG2000 (optional) – helps protect the vesicle and increases shelf life
These lipids form a liposome-like membrane around the internal components.
ii. What would you encapsulate inside?
Inside the synthetic cell:
Cell-free transcription/translation (Tx/Tl) system
-> Ribosomes
-> RNA polymerase
-> tRNAs
-> Amino acids
-> ATP/GTP/UTP/CTP
-> Magnesium and potassium salts
DNA construct
-> BPA-responsive promoter
-> Ribosome binding site
-> amilCP blue chromoprotein reporter gene
-> Terminator sequence
Small molecules
-> Energy source (phosphoenolpyruvate/PEP)
-> Buffer solution
-> Cofactors needed for protein synthesis
iii. Which organism will the Tx/Tl system come from?
A bacterial system is sufficient.
Recommended source:
Escherichia coli cell extract
Reason:
-> low cost
-> fast protein production
-> compatible with bacterial promoters and reporter genes
A mammalian system is not required because BPA sensing and chromoprotein expression can be controlled using bacterial genetic parts.
iv. How will the synthetic cell communicate with the environment?
Input communication
-> BPA is a small hydrophobic molecule
-> It can diffuse through the lipid membrane naturally
-> No membrane transporter needed
Output communication
-> Blue chromoprotein stays inside the vesicle
-> Color becomes visible from outside
Result:
-> No BPA → vesicle remains colorless
-> BPA present → vesicle turns blue
This allows the synthetic cell to detect contamination and show a clear visible response.
Experimental details
List all lipids and genes. (bonus: find the specific genes; for example, instead of just saying “small molecule membrane channel” pick the actual gene.)*
How will you measure the function of your system?
Ans: Experimental details
Lipids used for the synthetic cell membrane
-> POPC (1-palmitoyl-2-oleoyl-sn-glycero-3-phosphocholine): Main phospholipid forming the vesicle membrane
-> Cholesterol : Stabilizes membrane structure and reduces leakage
-> DSPE-PEG2000 (optional): Improves vesicle durability and increases shelf life
Freeze-dried cell-free systems can be incorporated into all kinds of materials as biological sensors or as inducible enzymes to modify the material itself or the surrounding environment. Choose one application field — Architecture, Textiles/Fashion, or Robotics — and propose an application using cell-free systems that are functionally integrated into the material. Answer each of these key questions for your proposal pitch:
Write a one-sentence summary pitch sentence describing your concept.
Ans: A mosquito repellent bio-paint containing freeze-dried cell-free systems that senses mosquito activity near walls and releases repellent molecules only when mosquitoes are present.
How will the idea work, in more detail? Write 3-4 sentences or more.
Ans: The bio-paint would contain microcapsules filled with freeze-dried cell-free transcription/translation systems integrated into wall paint. These biosensors are designed to detect mosquito wing vibrations or mosquito-associated chemical cues when mosquitoes approach painted surfaces. Once activated by environmental moisture or humidity, the cell-free system begins producing mosquito-repellent compounds such as citronella-derived volatile molecules. The repellent is released only when mosquitoes are detected, creating targeted protection around windows, walls, and entry points instead of continuous chemical release.
This makes the paint responsive and reduces unnecessary use of repellents.
What societal challenge or market need will this address?
Ans: Mosquito-borne diseases such as dengue, malaria, and chikungunya remain major public health concerns, especially in warm and humid regions. Conventional mosquito repellents require repeated application or constant spraying, which may be expensive and inconvenient.
This bio-paint could help by:
Reducing mosquito entry into homes
Providing continuous passive protection
Lowering chemical exposure compared with constant spraying
Supporting disease prevention in residential and public spaces
Potential applications:
homes
schools
hospitals
outdoor waiting areas
How do you envision addressing the limitation of cell-free reactions (e.g., activation with water, stability, one-time use)?
Ans: Activation with water
Use environmental humidity or occasional light spraying with water
Paint remains inactive while dry and activates only when moisture is present
Stability
Freeze-dry the cell-free system inside protective hydrogel/polymer microcapsules
Add stabilizers such as trehalose to improve shelf life
One-time use
Design paint with many distributed microcapsules
Only activated capsules release repellent, while unused capsules remain available
Controlled release
Repellent produced only when mosquito activity is detected
Prevents continuous release and increases efficiency
This makes the system practical for long-term architectural use while reducing waste and improving targeted mosquito control.
Homework question from Ally Huang
Freeze-dried cell-free reactions have great potential in space, where resources are constrained. As described in my talk, the Genes in Space competition challenges students to consider how biotechnology, including cell-free reactions, can be used to solve biological problems encountered in space. While the competition is limited to only high school students, your assignment will be to develop your own mock Genes in Space proposal to practice thinking about biotech applications in space!
For this particular assignment, your proposal is required to incorporate the BioBits® cell-free protein expression system, but you may also use the other tools in the Genes in Space toolkit (the miniPCR® thermal cycler and the P51 Molecular Fluorescence Viewer). For more inspiration, check out https://www.genesinspace.org/ .
Provide background information that describes the space biology question or challenge you propose to address. Explain why this topic is significant for humanity, relevant for space exploration, and scientifically interesting. (Maximum 100 words)
A major challenge during long-duration space missions is maintaining astronaut health when medical resources are limited. In microgravity, wounds may heal more slowly, and carrying large amounts of medicine is impractical because spacecraft have strict mass and storage limits. Astronauts need lightweight systems that can produce useful biomolecules only when needed. Freeze-dried cell-free systems like BioBits® are ideal because they are portable, stable, and activated on demand. This project explores using BioBits® to produce antimicrobial proteins in space as an emergency response to infections or contaminated surfaces.
Name the molecular or genetic target that you propose to study. Examples of molecular targets include individual genes and proteins, DNA and RNA sequences, or broader -omics approaches. (Maximum 30 words)
DNA encoding the antimicrobial protein lysostaphin and GFP as a fluorescent reporter produced using the BioBits® cell-free protein expression system.
Describe how your molecular or genetic target relates to the space biology question or challenge your proposal addresses. (Maximum 100 words)
Lysostaphin is an antimicrobial protein that breaks down bacterial cell walls, especially harmful bacteria like Staphylococcus. Producing this protein in space could help astronauts respond quickly to infection or contamination without relying only on stored antibiotics. BioBits® can express lysostaphin directly from DNA, while GFP confirms successful protein production through fluorescence. This connects the molecular target to a practical medical need: creating treatment molecules on demand during missions. The system’s freeze-dried format also makes it suitable for storage and transport in spacecraft.
Clearly state your hypothesis or research goal and explain the reasoning behind it. (Maximum 150 words)
My hypothesis is that the BioBits® cell-free protein expression system can successfully produce antimicrobial proteins from freeze-dried DNA templates in a space environment, creating a rapid and lightweight emergency treatment option. If BioBits® can express lysostaphin after activation, astronauts could generate useful proteins only when needed instead of carrying large medical inventories. This is important because resupply is limited during long missions, and infections could become serious if treatment is delayed. GFP fluorescence would confirm that protein expression occurred. If successful, this experiment would show that cell-free systems can serve as an on-demand biological manufacturing platform in space, supporting astronaut health and reducing dependence on stored pharmaceuticals.
Outline your experimental plan - identify the sample(s) you will test in your experiment, including any necessary controls, the type of data or measurements that will be collected, etc. (Maximum 100 words)
Prepare BioBits® reactions with DNA encoding lysostaphin and GFP. Activate reactions with water and incubate them in the miniPCR® thermal cycler. Include three groups: lysostaphin DNA + GFP (experimental), GFP-only DNA (positive control), and no DNA (negative control). Use the P51 Molecular Fluorescence Viewer to measure GFP fluorescence and confirm protein expression. Compare fluorescence intensity across groups. The main data collected will be fluorescence levels and whether antimicrobial protein can be reliably produced after freeze-dried storage, demonstrating on-demand protein manufacturing for space missions.
Please identify at least one (ideally many) aspect(s) of your project that you will measure. It could be the mass or sequence of a protein, the presence, absence, or quantity of a biomarker, etc.
Please describe all of the elements you would like to measure, and furthermore describe how you will perform these measurements.
What are the technologies you will use (e.g., gel electrophoresis, DNA sequencing, mass spectrometry, etc.)? Describe in detail.
Ans:The primary aspect measured in this project is the biosensor response, observed as a visible color change resulting from the activation of a reporter gene in the presence of plastic associated chemical signals. Additionally, the level of gene expression will be evaluated to understand the strength of the response under different signal conditions. These measurements will be performed using in silico simulation tools, where the behavior of the genetic circuit is modeled to predict activation and output. DNA construct design and validation will be carried out using Benchling, ensuring proper sequence structure and functionality. The simulation of circuit behavior will be conducted using Asimov Kernel.
In a practical setting, these measurements could be further validated using cell-free expression assays and techniques such as spectrophotometry or fluorescence analysis to quantify the output signal.The output of the biosensor is a visible color change, which can be measured quantitatively using spectrophotometry. This technique measures the absorbance of light at specific wavelengths corresponding to the produced color. The intensity of absorbance is directly proportional to the amount of reporter protein expressed.Fluorescence intensity can be measured using a fluorometer. The emitted light intensity corresponds to the level of gene expression. This method provides high sensitivity and allows precise quantification of the biosensor response, especially at low signal concentrations.
Homework: Waters Part I — Molecular Weight
We will analyze an eGFP standard on a Waters Xevo G3 QTof MS system to determine the molecular weight of intact eGFP and observe its charge state distribution in the native and denatured (unfolded) states. The conditions for LC-MS analysis of intact protein cause it to unfold and be detected in its denatured form (due to the solvents and pH used for analysis).
Based on the predicted amino acid sequence of eGFP (see below) and any known modifications, what is the calculated molecular weight? You can use an online calculator like the one at https://web.expasy.org/compute_pi/
eGFP Sequence:
MVSKGEELFTG VVPILVELDG DVNGHKFSVS GEGEGDATYG KLTLKFICTT GKLPVPWPTL VTTLTYGVQC FSRYPDHMKQ HDFFKSAMPE GYVQERTIFF KDDGNYKTRA EVKFEGDTLV NRIELKGIDF KEDGNILGHK LEYNYNSHNV YIMADKQKNG IKVNFKIRHN IEDGSVQLAD HYQQNTPIGD GPVLLPDNHY LSTQSALSKD PNEKRDHMVL LEFVTAAGIT LGMDELYKLE HHHHHH
Note: This contains a His-purification tag (HHHHHH) and a linker (the LE before it).
Two adjacent peaks were selected at approximately 933 and 903 m/z. Using the given formula:
Z = 903/933−903
≈
30
Thus, the charge state is z ≈ +30.
b. Molecular weight calculation:
Using the relationship:
𝑀𝑊 = 𝑧(𝑚/𝑧)−𝑧
MW = 30×933−30=27,960 Da
Thus, the molecular weight of eGFP is approximately 27.96 kDa.
c.From earlier:
𝑀𝑊𝑒𝑥𝑝 = 27,960 Da
𝑀𝑊𝑡ℎ𝑒𝑜𝑟𝑦 = 28,006.60 Da
Accuracy calculation:
Accuracy =∣27960−28006.60∣/ 28006.60 ≈ 0.00166
Error ≈ 0.166%
Charge state of zoomed-in peak:
No, the charge state cannot be directly determined from the zoomed-in peak because isotopic spacing is not resolved, which is necessary to assign charge states.
Homework: Waters Part III — Peptide Mapping - primary structure
How many Lysines (K) and Arginines (R) are in eGFP? Please circle or highlight them in the eGFP sequence given in Waters Part I question 1 above. (Note: adding the sequence to Benchling as an amino acid file and clicking biochemical properties tab will show you a count for each amino acid).
Ans: Number of Lysines (K) present are 20 and number of Arginines (R) present = 6
Copy/paste the sequence above into the input box in the PeptideMass tool to generate expected list of peptides.
Use Figure 4 below as a guide for the relevant parameters to predict peptides from eGFP.
Click “Perform the Cleavage” button in the PeptideMass tool and report the number of peptides generated when using trypsin to perform the digest.
Ans: Using the PeptideMass tool with default settings shows 19 peptides because small peptides (<500 Da) are excluded.
Based on the LC-MS data for the Peptide Map data generated in lab (please use Figure 5a as a reference) how many chromatographic peaks do you see in the eGFP peptide map between 0.5 and 6 minutes? You may count all peaks that are >10% relative abundance.
Ans: The number of peptide peaks observed in the chromatogram between 0.5 and 6 minutes, considering only peaks above 10% relative abundance, is approximately 12–14 peaks.
Assuming all the peaks are peptides, does the number of peaks match the number of peptides predicted from question 2 above? Are there more peaks in the chromatogram or fewer?
Ans: The predicted number of peptides from tryptic digestion is 19 peptides (based on PeptideMass with filtering). The observed number of chromatographic peaks is similar but slightly lower or comparable.
This difference arises because:
Some peptides may not ionize efficiently
Very small or hydrophilic peptides may not be detected
Some peptides may co-elute
Ans: Charge state and peptide mass
The isotopic peak spacing for the peptide at 2.78 minutes is approximately 0.5 m/z, giving:
𝑧=1/0.5 = 2
Thus, the charge state is +2.
Using:
MW=z(m/z)−z
MW=2×526.27−2.0146 = 1050.525 Da
Therefore, the peptide has:
Charge state (z) = +2
Molecular weight ≈ 1050.5 Da
Identify the peptide based on comparison to expected masses in the PeptideMass tool. What is mass accuracy of measurement? Please calculate the error in ppm. (Recall that Accuracy from part I)
Ans: Peptide Identification
The peptide is FEGDTLVNR with theoretical mass 1050.5214 Da.
What is the percentage of the sequence that is confirmed by peptide mapping? (see Figure 6)
Ans: Peptide mapping confirms 88% of the eGFP sequence, as indicated in Figure 6. This value represents the proportion of the protein sequence that is covered by experimentally identified peptides in the LC-MS analysis. The highlighted regions correspond to detected peptides, while the unhighlighted regions indicate portions of the sequence that were not observed, likely due to limitations such as poor ionization or peptide size. This high coverage suggests successful and reliable protein identification.
Bonus Peptide Map Questions
Can you determine the peptide sequence for the peptide fragmentation spectrum shown in Figure 5c? (HINT: Use your results from Question 2 above to match the peptide molecular weight that is closest to that shown in Figure 5b. Copy and paste its sequence into this tool online to predict the fragmentation pattern based on its amino acid sequence: http://db.systemsbiology.net/proteomicsToolkit/FragIonServlet.html. What is the sequence of the eGFP peptide that best matches the fragmentation spectrum in Figure 5c?
Ans: The peptide sequence that best matches the fragmentation spectrum in Figure 5c is FEGDTLVNR.This identification is based on matching the experimentally determined molecular weight (~1050.5 Da) with the theoretical peptide masses from the PeptideMass tool. The peptide FEGDTLVNR (1050.5214 Da) shows the closest agreement.
Does the peptide map data make sense, i.e. do the results indicate the protein is the eGFP standard? Why or why not? Consult with Figure 6, which depicts the % amino acid coverage of peptides positively identified using their calculated mass and fragmentation pattern.
Ans: Yes, the peptide map data is consistent with the protein being the eGFP standard. Figure 6 shows approximately 88% amino acid sequence coverage, indicating that a large majority of the protein sequence has been experimentally confirmed through peptide identification. Additionally, multiple peptides across different regions of the sequence were identified and validated using both mass measurements and fragmentation patterns, providing strong evidence for correct protein identification. The remaining 12% of the sequence not covered is likely due to typical limitations such as poor ionization or peptide detectability and does not significantly affect the confidence of identification. Therefore, the results strongly support that the protein analyzed is eGFP.
Homework: Waters Part IV — Oligomers
We will determine Keyhole Limpet Hemocyanin (KLH)’s oligomeric states using charge detection mass spectrometry (CDMS). CDMS single-particle measurements of KLH allow us to make direct mass measurements to determine what oligomeric states (that is, how many protein subunits combine) are present in solution. Using the known masses of the polypeptide subunits (Table 1) for KLH, identify where the following oligomeric species are on the spectrum shown below from the CDMS (Figure 7):
Ans: To identify the oligomeric species of Keyhole Limpet Hemocyanin (KLH) on the provided CDMS spectrum, we calculate the expected mass of each assembly and correlate it with the experimental peaks shown in Figure 7.Theoretical Mass CalculationsSince the x-axis of the spectrum is in Megadaltons (MDa) and the subunit masses are in kilodaltons (kDa), we use the conversion 1,000 kDa = 1 MDa
Oligomeric Species
Composition
Calculation
Theoretical Mass
7FU Decamer
10 × 7FU subunits
10 × 340 kDa
3.40 MDa
8FU Didecamer
20 × 8FU subunits
20 × 400 kDa
8.00 MDa
8FU 3-Decamer
30 × 8FU subunits
30 × 400 kDa
12.00 MDa
8FU 4-Decamer
40 × 8FU subunits
40 × 400 kDa
16.00 MDa
Species Identification on Spectrum (Figure 7)
Based on the calculations above, the oligomeric species correspond to the following peaks labeled in the mass spectrum:
7FU Decamer: Assigned to the peak at 3.4 MDa. This matches the theoretical calculation exactly.
8FU Didecamer: Assigned to the highest intensity peak at 8.33 MDa. The slight shift from 8.00 MDa to 8.33 MDa is attributed to native glycosylation and adducts common in large KLH proteins.
8FU 3-Decamer: Assigned to the peak at 12.67 MDa. This represents the assembly of 30 8FU subunits
8FU 4-Decamer: Assigned to the low-intensity cluster of peaks between 16.00 and 17.00 MDa. This corresponds to the 40-subunit assembly.
Homework: Waters Part V — Did I make GFP?
Please fill out this table with the data you acquired from the lab work done at the Waters Immerse Lab in Cambridge, or else the data screenshots in this document if you were unable to have lab work done at Waters.
Theoretical (kDa)
Observed /Measured on Intact LC-MS (kDa)
PPM Mass Error
28.0066
27.960
-1664 ppm
The relatively high ppm error is due to approximate peak selection and lack of deconvolution in intact protein analysis.
Calculations:
Theoretical MW (from sequence )
28,006.60 Da = 28.0066 kDa
Observed MW (from LC-MS intact protein)
From your earlier intact MS calculation:
≈ 27,960 Da = 27.960 kDa
PPM error calculation
Formula:
PPM = 𝑀𝑊𝑜𝑏𝑠 − 𝑀𝑊𝑡ℎ𝑒𝑜𝑟𝑦 / 𝑀𝑊𝑡ℎ𝑒𝑜𝑟𝑦 × 10 ^ 6
PPM = 27960 −28006.60 / 28006.60 × 10^6
≈−1664ppm
Week 11 HW: Bioproduction and Cloud Labs
Part A: The 1,536 Pixel Artwork Canvas | Collective Artwork
Contribute at least one pixel to this global artwork experiment before the editing ends on Sunday 4/19 at 11:59 PM EST.
A personalized URL was sent to the email address associated with your Discourse account, and you can discuss the artwork on the Discourse.
If you did not have a chance to contribute, it’s okay, just make sure you become a TA this fall! 😉
Make a note on your HTGAA webpages including:
what you contributed to the community bioart project (e.g., “I made part of the DNA on the bottom right plate”)
what you liked about the project, and
what about this collaborative art experiment could be made better for next year.
Ans: I made a character red from the game Among Us at the right corner of Q1. This project gave freedom to everyone to create any form of art and I liked it.
Part B: Cell-Free Protein Synthesis | Cell-Free Reagents
Referencing the cell-free protein synthesis reaction composition (the middle box outlined in yellow on the image above, also listed below), provide a 1-2 sentence description of what each component’s role is in the cell-free reaction.
Ans: Components & Their Roles
E. coli Lysate
BL21 (DE3) Star Lysate (includes T7 RNA Polymerase)
Provides the core cellular machinery—ribosomes, tRNAs, enzymes for transcription and translation; the built-in T7 RNA polymerase drives high-level transcription from T7 promoters.
Salts / Buffer
Potassium Glutamate
Mimics intracellular ionic conditions and stabilizes ribosomes and enzymes for efficient protein synthesis.
HEPES-KOH pH 7.5
Maintains a stable physiological pH, which is critical for enzyme activity during transcription and translation.
Magnesium Glutamate
Essential cofactor for ribosomes and polymerases; directly impacts translation efficiency and RNA stability.
Potassium Phosphate (Monobasic & Dibasic)
Provides buffering capacity and phosphate ions, helping maintain pH balance and supporting energy metabolism.
Energy / Nucleotide System
Ribose
Serves as a carbon source for nucleotide regeneration through metabolic pathways.
Glucose
Fuels ATP regeneration via glycolytic enzymes present in the lysate, enabling longer reaction lifetimes.
AMP, CMP, GMP, UMP
Nucleotide monophosphates that are enzymatically converted into triphosphates (ATP, GTP, etc.) required for transcription and translation.
Guanine
A nucleobase precursor that can be salvaged into GMP, contributing to nucleotide pool replenishment.
Translation Mix (Amino Acids)
17 Amino Acid Mix
Supplies most of the building blocks required for protein synthesis.
Tyrosine & Cysteine
Added separately because they are less stable or more reactive, ensuring sufficient availability during translation.
Additives
Nicotinamide
Supports redox balance and metabolic reactions (via NAD⁺/NADH systems), improving energy regeneration and reaction longevity.
Backfill
Nuclease-Free Water
Adjusts the final reaction volume while preventing degradation of nucleic acids.
Describe the main differences between the 1-hour optimized PEP-NTP master mix and the 20-hour NMP-Ribose-Glucose master mix shown in the Google Slide above. (2-3 sentences)
Ans: The PEP-NTP (1-hour) system uses high-energy molecules like phosphoenolpyruvate and directly supplied nucleotide triphosphates, enabling rapid and high protein production but with short reaction lifetimes.
The NMP-Ribose-Glucose (20-hour) system relies on slower metabolic regeneration of energy and nucleotides from simpler precursors, resulting in longer-lasting but lower-rate protein synthesis.
Bonus question: How can transcription occur if GMP is not included but Guanine is?
Ans: Transcription can still occur because guanine can be salvaged into GMP via enzymatic pathways present in the lysate (nucleotide salvage pathways). Once converted to GMP, it can then be phosphorylated to GTP, which is the actual substrate used by RNA polymerase.
Part C: Planning the Global Experiment | Cell-Free Master Mix Design
Given the 6 fluorescent proteins we used for our collaborative painting, identify and explain at least one biophysical or functional property of each protein that affects expression or readout in cell-free systems. (Hint: options include maturation time, acid sensitivity, folding, oxygen dependence, etc) (1-2 sentences each)
sfGFP
mRFP1
mKO2
mTurquoise2
mScarlet_I
Electra2
Ans: sfGFP
Key property: Robust folding efficiency
sfGFP is engineered to fold efficiently even under suboptimal conditions, making it highly reliable in cell-free systems where chaperones may be limited.
mRFP1
Key property: Slow maturation time
mRFP1 takes longer to form its fluorescent chromophore, so signal appears delayed even if protein expression is occurring.
mTurquoise2
Key property: High quantum yield (brightness)
This cyan protein is extremely bright and efficient at emitting light, allowing sensitive detection even at low expression levels.
mScarlet-I
Key property: Rapid maturation and high brightness
mScarlet-I combines fast chromophore formation with strong fluorescence, making it one of the best-performing red proteins in cell-free systems.
Like most fluorescent proteins, Electra2 requires oxygen for chromophore maturation, so limited oxygen in cell-free reactions can reduce or delay fluorescence.
Create a hypothesis for how adjusting one or more reagents in the cell-free mastermix could improve a specific biophysical or functional property you identified above, in order to maximize fluorescence over a 36-hour incubation. Clearly state the protein, the reagent(s), and the expected effect.
Ans: Hypothesis for Electra2 (maximize fluorescence over 36 hours)
Reducing the glucose concentration in the cell-free mastermix will decrease metabolic oxygen consumption, thereby increasing dissolved oxygen availability for Electra2 chromophore maturation and improving fluorescence over a 36-hour incubation.
Reagent to adjust:
Glucose (energy source in the mastermix)
Expected effect:
Lower glucose levels will slow ATP-generating metabolism, reducing oxygen depletion in the reaction. This preserves oxygen needed for Electra2’s oxygen-dependent chromophore formation, leading to a higher fraction of properly matured fluorescent protein and increased overall fluorescence signal after 36 hours.
The second phase of this lab will be to define the precise reagent concentrations for your cell-free experiment. You will be assigned artwork wells with specific fluorescent proteins and receive an email with instructions this week (by April 24). You can begin composing master mix compositions here.
Ans: For the Electra2 fluorescent protein, I designed four reaction conditions to test the effects of magnesium glutamate and glucose on fluorescence output over extended incubation.
Well 1: Increased magnesium glutamate + increased glucose
Well 2: Increased magnesium glutamate only
Well 3: Control (default mastermix composition)
Well 4: Increased glucose only
The final phase of this lab will be analyzing the fluorescence data we collect to determine whether we can draw any conclusions about favorable reagent compositions for our fluorescent proteins. This will be due a week after the data is returned (date TBD!). The reaction composition for each well will be as follows:
6 μL of Lysate
10 μL of 2X Optimized Master Mix from above
2 μL of assigned fluorescent protein DNA template
2 μL of your custom reagent supplements
Total: 20 μL reaction
Ans: The goal of these conditions is to evaluate how increased magnesium glutamate and glucose concentrations affect Electra2 fluorescence over a 36-hour incubation. Magnesium glutamate is expected to improve translation efficiency, while glucose supports ATP regeneration but may also influence oxygen availability required for chromophore maturation.
Part D: Build-A-Cloud-Lab | (optional) Bonus Assignment