Week 5: Protein design part II
Part A: SOD1 Binder Peptide Design (From Pranam)
Superoxide dismutase 1 (SOD1) is a cytosolic antioxidant enzyme that converts superoxide radicals into hydrogen peroxide and oxygen. In its native state, it forms a stable homodimer and binds copper and zinc.
Mutations in SOD1 cause familial Amyotrophic Lateral Sclerosis (ALS). Among them, the A4V mutation (Alanine → Valine at residue 4) leads to one of the most aggressive forms of the disease. The mutation subtly destabilizes the N-terminus, perturbs folding energetics, and promotes toxic aggregation.
Your challenge:
Design short peptides that bind mutant SOD1.
Then decide which ones are worth advancing toward therapy.
You will use three models developed in our lab:
- PepMLM: target sequence-conditioned peptide generation via masked language modeling
- PeptiVerse: therapeutic property prediction
- moPPIt: motif-specific multi-objective peptide design using Multi-Objective Guided Discrete Flow Matching (MOG-DFM)
Part 1: Generate Binders with PepMLM
Methodology
The human SOD1 sequence was retrieved from UniProt (P00441) and the A4V mutation was introduced (position 4: Ala → Val). This mutant sequence was then used to condition PepMLM (PepMLM-650M) to generate four candidate 12-mer peptide binders.
Generated Peptides and Perplexity Scores
The table below summarizes the four PepMLM-generated peptides alongside the known SOD1-binding reference peptide. Pseudo-perplexity scores indicate the model’s confidence — lower values indicate higher confidence in the generated sequence as a plausible binder.
| Peptide | Sequence | Pseudo-Perplexity | Source |
|---|---|---|---|
| Peptide 1 | WIYPAAGWGHKK | 27.58 | PepMLM-generated |
| Peptide 2 | WWVYAVAPRVKA | 14.63 | PepMLM-generated |
| Peptide 3 | WWPYWTAVVKDK | 24.92 | PepMLM-generated |
| Peptide 4 | ERVTASSVKQLA | 26.09 | PepMLM-generated |
| Reference | FLYRWLPSRRGG | — | Known SOD1 binder |
Note on perplexity: WWVYAVAPRVKA shows the lowest pseudo-perplexity (14.63), indicating PepMLM assigned the highest confidence to this sequence as a binder for the A4V mutant SOD1 target.
Part 2: Evaluate Binders with AlphaFold3
Navigate to the AlphaFold Server: alphafoldserver.com For each peptide, submit the mutant SOD1 sequence followed by the peptide sequence as separate chains to model the protein-peptide complex. Record the ipTM score and briefly describe where the peptide appears to bind. Does it localize near the N-terminus where A4V sits? Does it engage the β-barrel region or approach the dimer interface? Does it appear surface-bound or partially buried? In a short paragraph, describe the ipTM values you observe and whether any PepMLM-generated peptide matches or exceeds the known binder.
Methodology
Each peptide was submitted to the AlphaFold Server (alphafoldserver.com) as a two-chain complex — chain A: A4V mutant SOD1 sequence; chain B: the peptide. The ipTM (interface predicted TM-score) and pTM scores were recorded, along with observations of peptide binding location.
Results
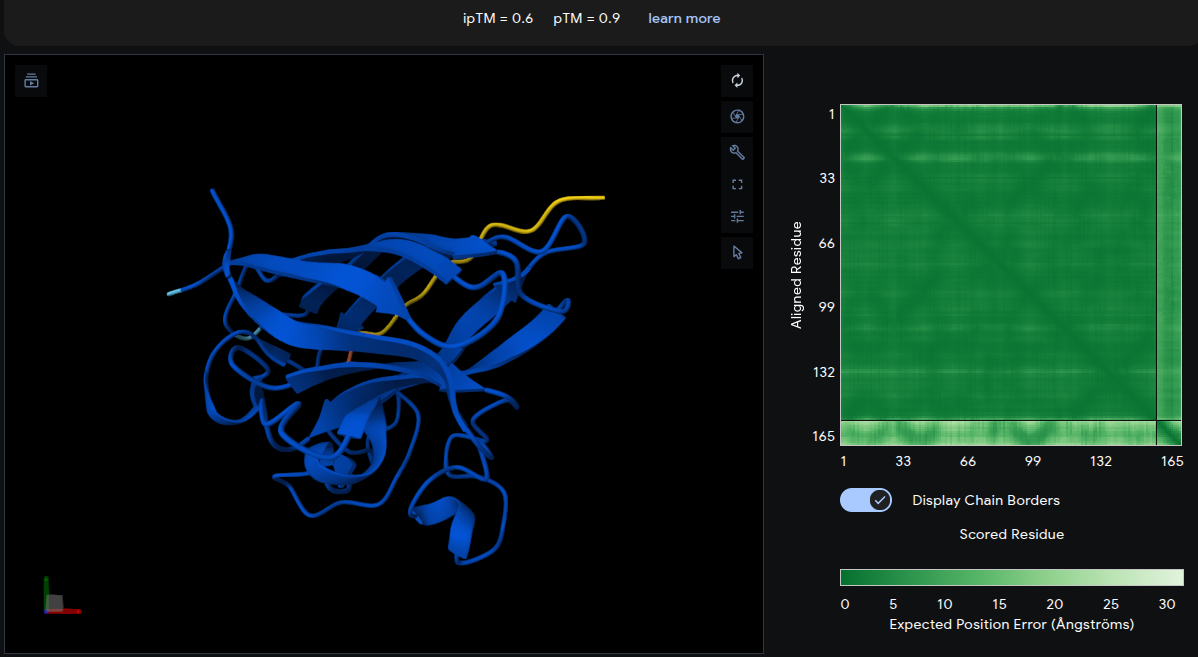
Reference Peptide: FLYRWLPSRRGG
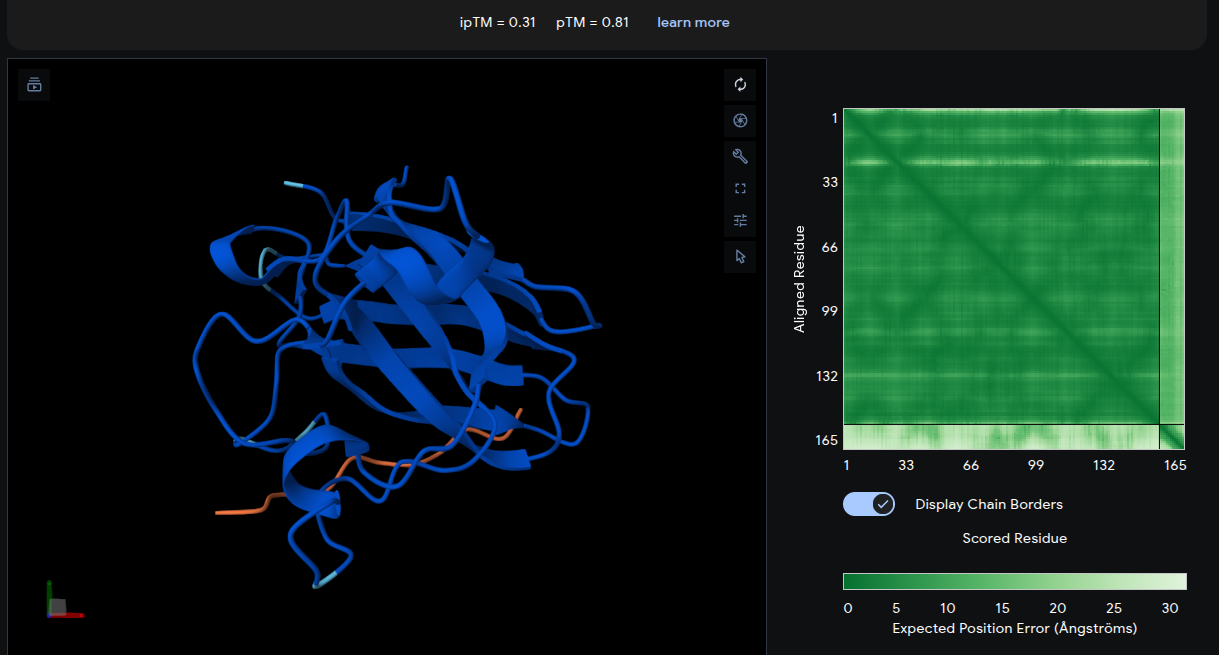
- ipTM = 0.31 | pTM = 0.81
- The reference peptide (yellow) localizes near the lower β-barrel region of mutant SOD1, with an additional short segment positioned near the base of the structure. The peptide adopts a partially extended and loop-like conformation rather than becoming deeply buried within the protein surface. The Predicted Aligned Error (PAE) matrix shows relatively uniform inter-chain uncertainty, consistent with weak but non-random interface contacts. Overall, the low ipTM score indicates limited interaction confidence and serves as a structural baseline for comparison with the generated peptides.
Peptide 1: WIYPAAGWGHKK
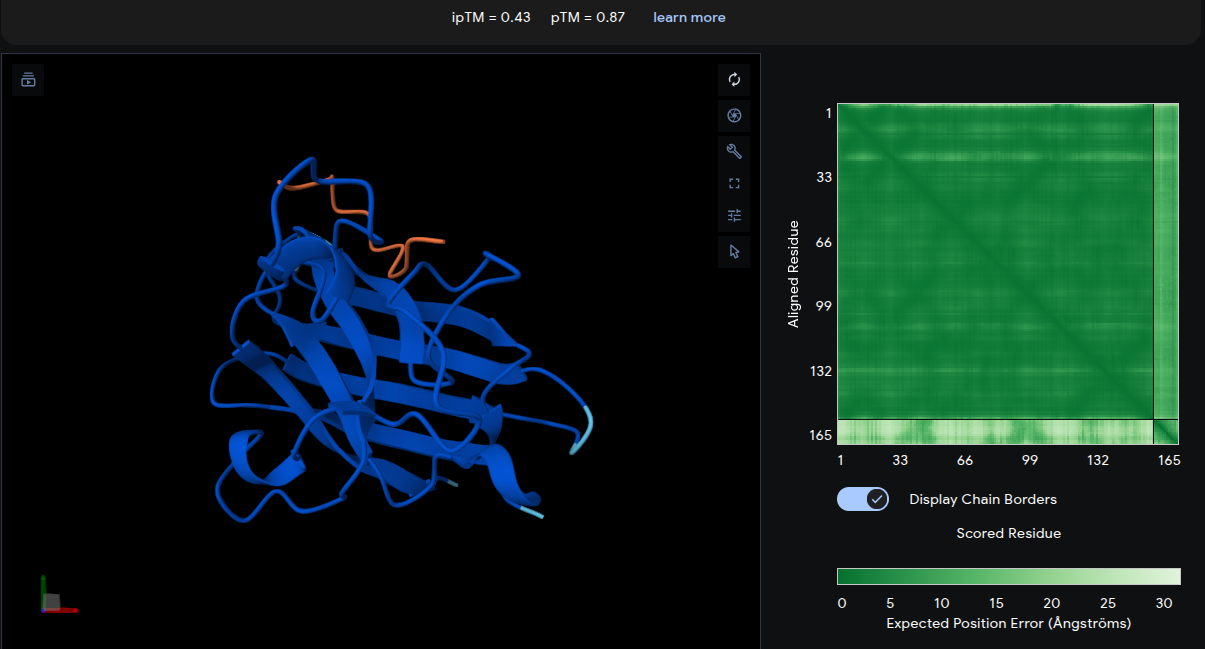
- ipTM = 0.43 | pTM = 0.87
- The peptide (yellow) forms a relatively compact loop structure engaging the upper region of the SOD1 β-barrel near the N-terminal area where the A4V mutation is located. The peptide appears partially buried beneath an overhanging loop region, suggesting improved geometric complementarity and surface accommodation compared with the reference peptide. The moderate ipTM score indicates a more stable and confident interface interaction than the known binder.
Peptide 2: WWVYAVAPRVKA
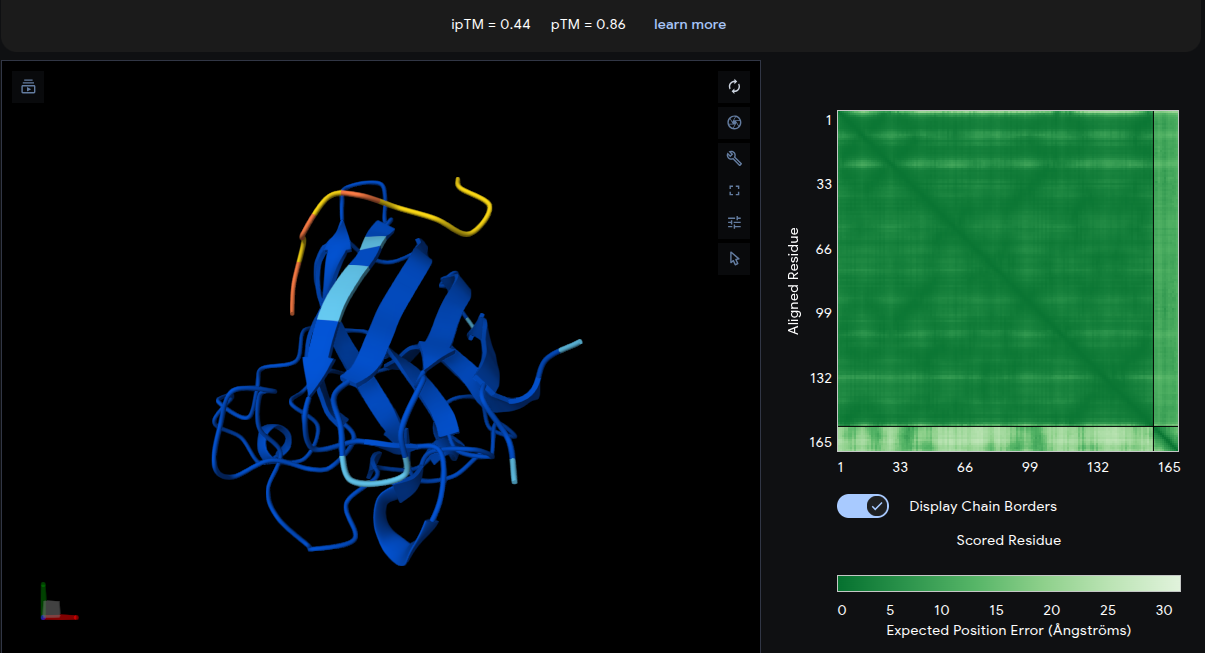
- ipTM = 0.44 | pTM = 0.86
- The peptide adopts a diffuse surface-associated conformation, appearing to drape across the upper loop region of the β-barrel. No strong localization near the A4V mutation site is observed. The interaction appears predominantly surface-bound with minimal burial into the protein structure. Although the interface remains relatively weak, the slightly improved ipTM compared with the reference peptide suggests modest but meaningful predicted intermolecular contacts.
Peptide 3: WWPYWTAVVKDK
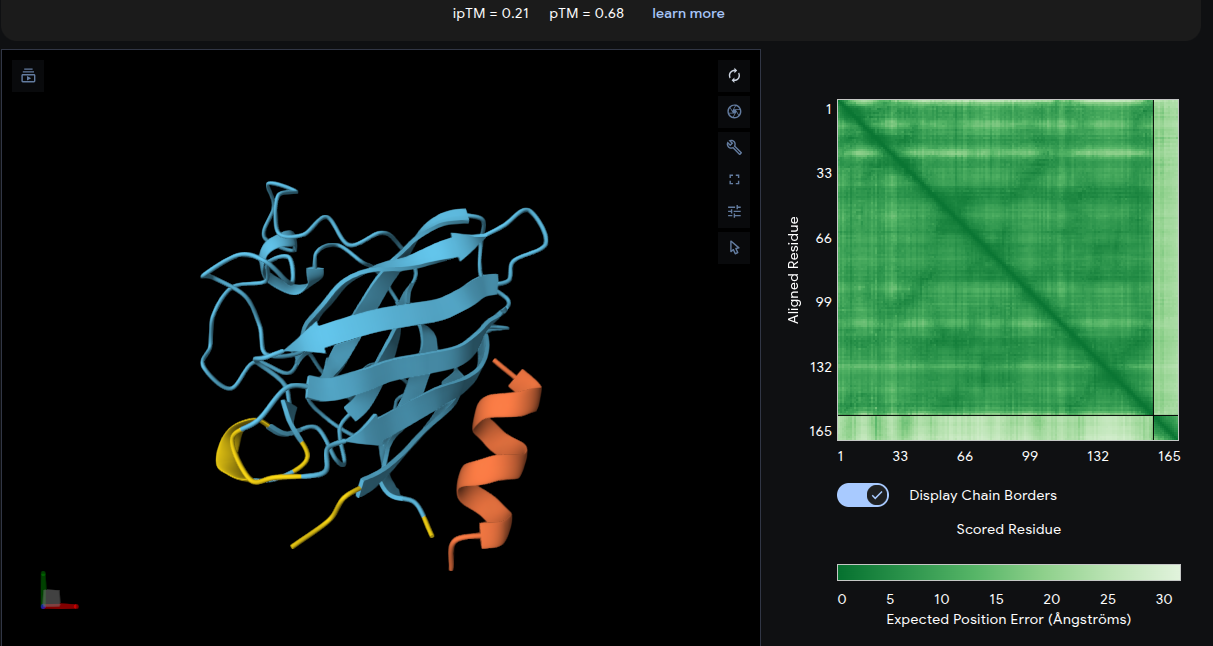
- ipTM = 0.21 | pTM = 0.68
- The peptide associates weakly with the upper β-barrel loop region and appears only loosely positioned at the junction between adjacent loops. The interface lacks substantial burial or extensive contact surfaces, consistent with the very low ipTM score. The lower pTM value also indicates reduced confidence in the overall complex structure relative to the other peptide–protein models. Overall, this peptide represents the weakest predicted interaction among the generated binders.
Peptide 4: ERVTASSVKQLA
- ipTM = 0.60 | pTM = 0.90
- Remarkably, ERVTASSVKQLA yields the highest ipTM of 0.60 across all peptides. The peptide (yellow) engages the top surface of the β-barrel at a well-defined interface, running along the outer edge of a loop region. The pTM of 0.90 reflects the highest confidence in the overall complex structure. This peptide clearly outperforms the reference structurally.
Summary of AlphaFold3 ipTM Scores
| ID | Peptide | ipTM | Interpretation |
|---|---|---|---|
| P1 | WIYPAAGWGHKK | 0.44 | weak/moderate |
| P2 | WWVYAVAPRVKA | 0.43 | weak/moderate |
| P3 | WWPYWTAVVKDK | 0.21 | very weak |
| P4 | ERVTASSVKQLA | 0.60 | best generated binder |
| REF | FLYRWLPSRRGG | 0.31 | weak known binder |
Paragraph Summary
AlphaFold3 analysis of the peptide–mutant Superoxide dismutase 1 A4V mutant complexes revealed varying levels of predicted interaction confidence among the generated binders. Among the PepMLM-generated peptides, ERVTASSVKQLA (P4) showed the highest ipTM score of 0.60, indicating the strongest and most stable predicted interaction with mutant SOD1. In contrast, WIYPAAGWGHKK (P1) and WWVYAVAPRVKA (P2) displayed moderate interaction confidence with ipTM scores of 0.44 and 0.43, respectively. WWPYWTAVVKDK (P3) showed the weakest interaction with an ipTM score of 0.21, suggesting poor binding stability. Interestingly, the known SOD1-binding reference peptide FLYRWLPSRRGG produced only a weak interaction score of 0.31, meaning that the PepMLM-generated peptide P4 outperformed the established binder in this structural prediction workflow. Overall, these results suggest that AI-generated peptides can potentially identify novel binders with improved interaction profiles compared to previously known peptide candidates.
Part 3: Evaluate Properties of Generated Peptides in PeptiVerse
Structural confidence alone is insufficient for therapeutic development. Using PeptiVerse, let’s evaluate the therapeutic properties of your peptide! For each PepMLM-generated peptide:
- Paste the peptide sequence.
- Paste the A4V mutant SOD1 sequence in the target field.
Check the boxes Predicted binding affinity Solubility Hemolysis probability Net charge (pH 7) Molecular weight Compare these predictions to what you observed structurally with AlphaFold3. In a short paragraph, describe what you see. Do peptides with higher ipTM also show stronger predicted affinity? Are any strong binders predicted to be hemolytic or poorly soluble? Which peptide best balances predicted binding and therapeutic properties?
Choose one peptide you would advance and justify your decision briefly.
Methodology
Each peptide sequence was submitted to PeptiVerse with the A4V mutant SOD1 sequence as the target. The following properties were evaluated: binding affinity (pKd/pKi), solubility, hemolysis probability, permeability, net charge (pH 7), molecular weight, isoelectric point, and hydrophobicity (GRAVY).
PeptiVerse Results
Reference Peptide: FLYRWLPSRRGG
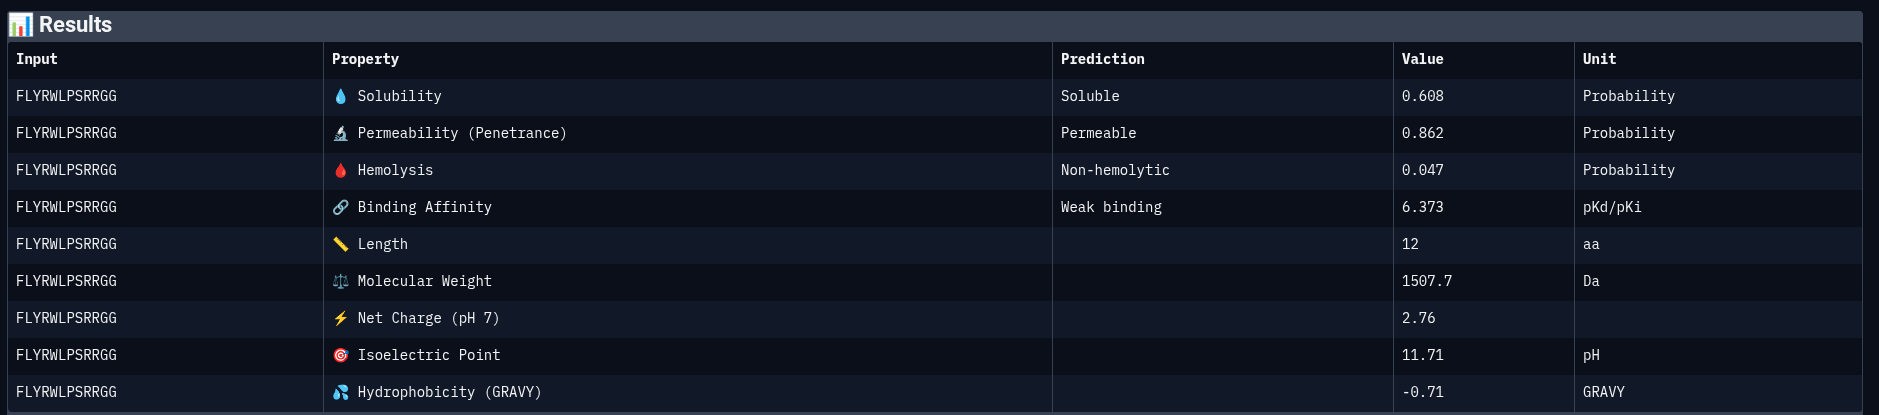
| Property | Prediction | Value | Unit |
|---|---|---|---|
| Solubility | Soluble | 0.608 | Probability |
| Permeability | Permeable | 0.862 | Probability |
| Hemolysis | Non-hemolytic | 0.047 | Probability |
| Binding Affinity | Weak binding | 6.373 | pKd/pKi |
| Molecular Weight | — | 1507.7 | Da |
| Net Charge (pH 7) | — | 2.76 | — |
| Isoelectric Point | — | 11.71 | pH |
| Hydrophobicity (GRAVY) | — | −0.71 | — |
Peptide 1: WIYPAAGWGHKK
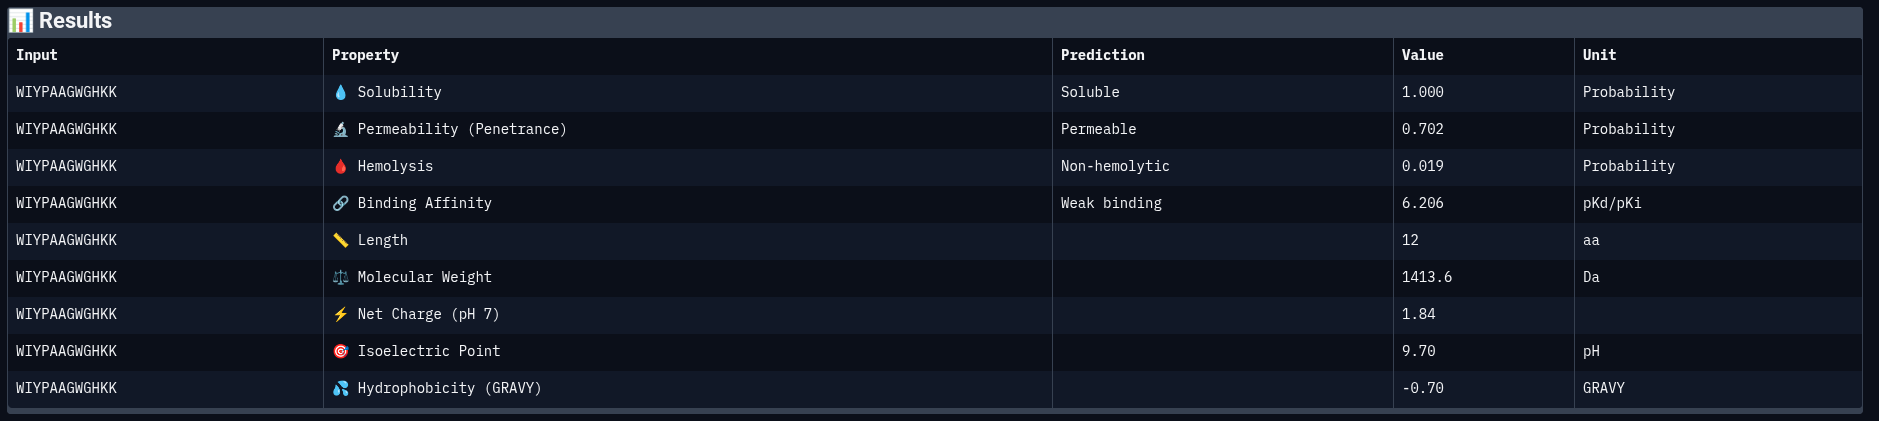
| Property | Prediction | Value | Unit |
|---|---|---|---|
| Solubility | Soluble | 1.000 | Probability |
| Permeability | Permeable | 0.702 | Probability |
| Hemolysis | Non-hemolytic | 0.019 | Probability |
| Binding Affinity | Weak binding | 6.206 | pKd/pKi |
| Molecular Weight | — | 1413.6 | Da |
| Net Charge (pH 7) | — | 1.84 | — |
| Isoelectric Point | — | 9.70 | pH |
| Hydrophobicity (GRAVY) | — | −0.70 | — |
Peptide 2: WWVYAVAPRVKA
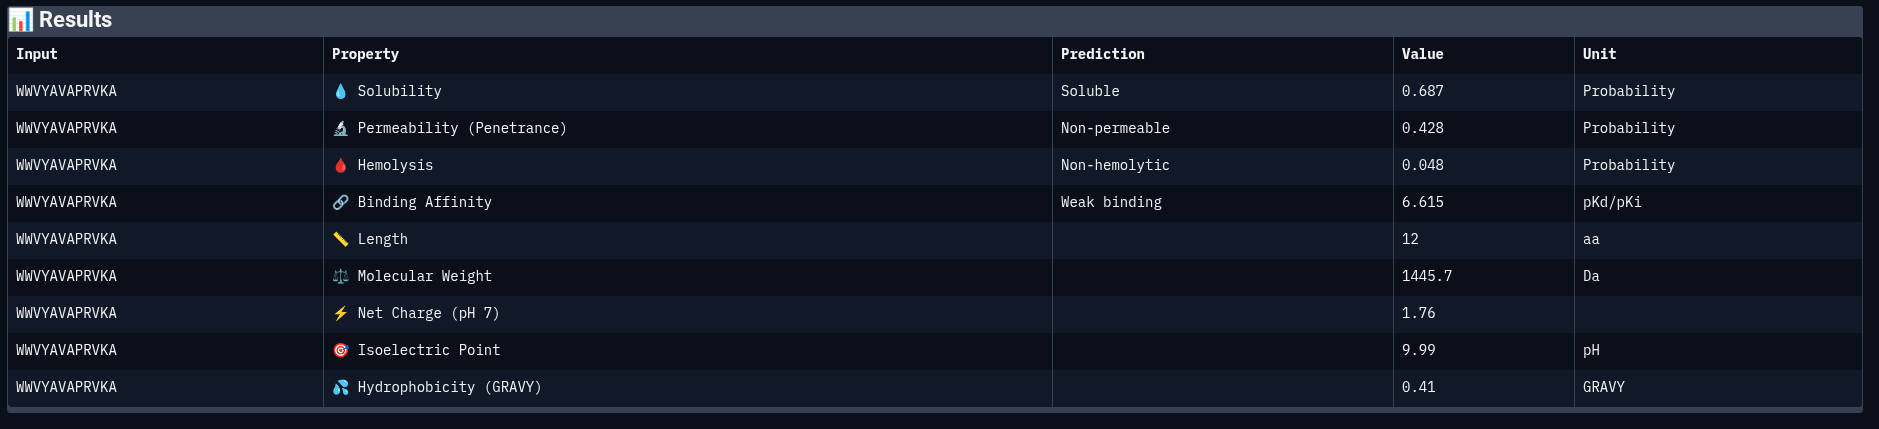
| Property | Prediction | Value | Unit |
|---|---|---|---|
| Solubility | Soluble | 0.687 | Probability |
| Permeability | Non-permeable | 0.428 | Probability |
| Hemolysis | Non-hemolytic | 0.048 | Probability |
| Binding Affinity | Weak binding | 6.615 | pKd/pKi |
| Molecular Weight | — | 1445.7 | Da |
| Net Charge (pH 7) | — | 1.76 | — |
| Isoelectric Point | — | 9.99 | pH |
| Hydrophobicity (GRAVY) | — | 0.41 | — |
Peptide 3: WWPYWTAVVKDK
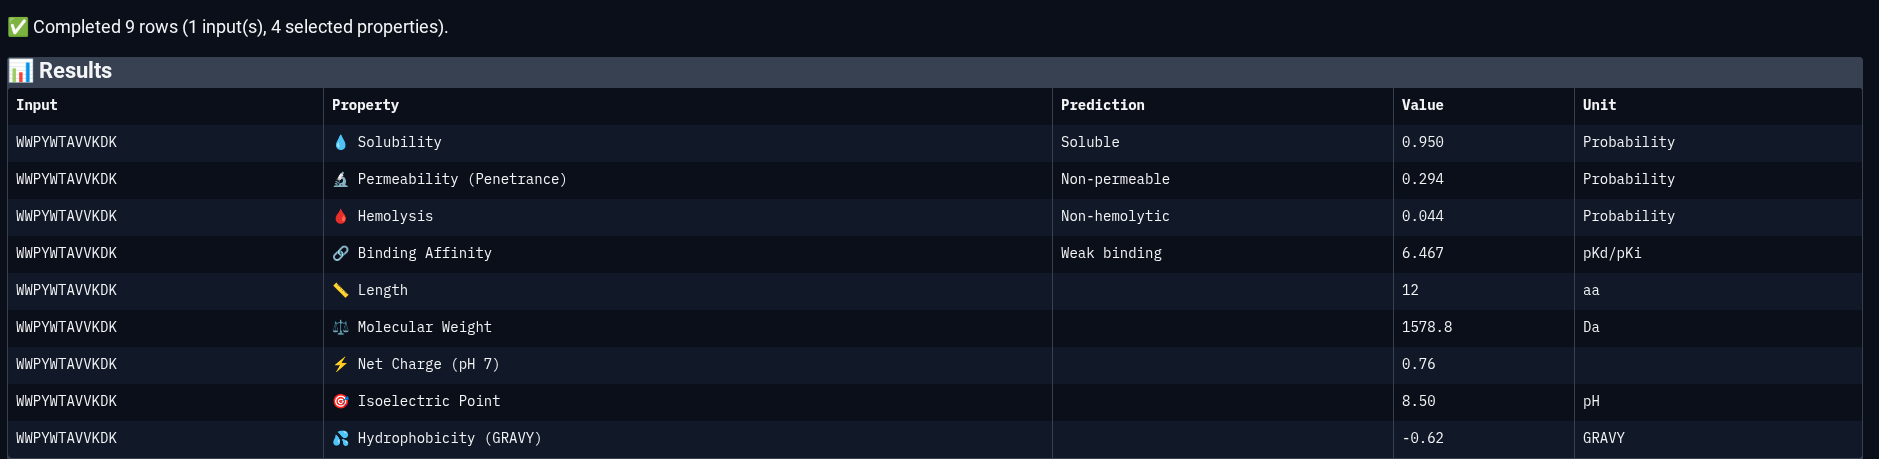
| Property | Prediction | Value | Unit |
|---|---|---|---|
| Solubility | Soluble | 0.950 | Probability |
| Permeability | Non-permeable | 0.294 | Probability |
| Hemolysis | Non-hemolytic | 0.044 | Probability |
| Binding Affinity | Weak binding | 6.467 | pKd/pKi |
| Molecular Weight | — | 1578.8 | Da |
| Net Charge (pH 7) | — | 0.76 | — |
| Isoelectric Point | — | 8.50 | pH |
| Hydrophobicity (GRAVY) | — | −0.62 | — |
Peptide 4: ERVTASSVKQLA
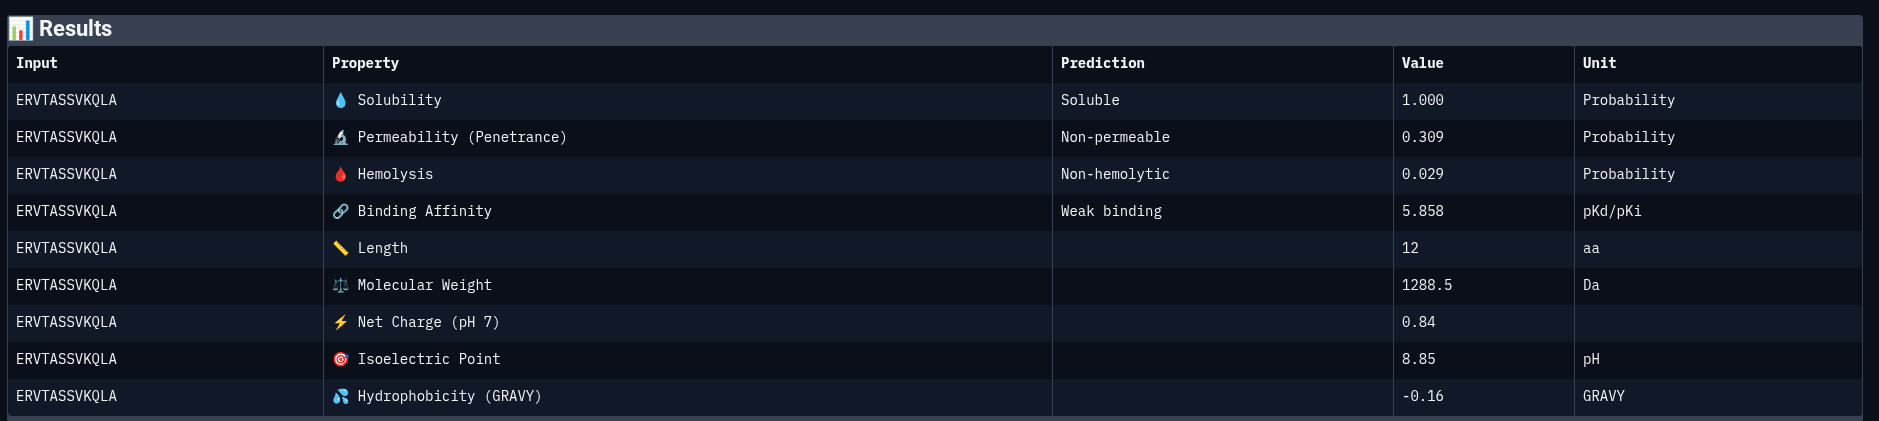
| Property | Prediction | Value | Unit |
|---|---|---|---|
| Solubility | Soluble | 1.000 | Probability |
| Permeability | Non-permeable | 0.309 | Probability |
| Hemolysis | Non-hemolytic | 0.029 | Probability |
| Binding Affinity | Weak binding | 5.858 | pKd/pKi |
| Molecular Weight | — | 1288.5 | Da |
| Net Charge (pH 7) | — | 0.84 | — |
| Isoelectric Point | — | 8.85 | pH |
| Hydrophobicity (GRAVY) | — | −0.16 | — |
Consolidated Comparison Table
| Peptide | ipTM | Affinity (pKd/pKi) | Solubility | Hemolysis | Permeability | Net Charge |
|---|---|---|---|---|---|---|
| FLYRWLPSRRGG (ref) | 0.31 | 6.373 | 0.608 | 0.047 | Permeable | 2.76 |
| WIYPAAGWGHKK | 0.44 | 6.206 | 1.000 | 0.019 | Permeable | 1.84 |
| WWVYAVAPRVKA | 0.43 | 6.615 | 0.687 | 0.048 | Non-permeable | 1.76 |
| WWPYWTAVVKDK | 0.21 | 6.467 | 0.950 | 0.044 | Non-permeable | 0.76 |
| ERVTASSVKQLA | 0.60 | 5.858 | 1.000 | 0.029 | Non-permeable | 0.84 |
Paragraph Analysis
Comparing structural predictions from AlphaFold3 with PeptiVerse therapeutic property predictions reveals that structural interaction confidence and predicted biochemical affinity do not perfectly correlate. ERVTASSVKQLA achieved the highest structural confidence with an ipTM score of 0.60, suggesting the most stable predicted interaction with mutant Superoxide dismutase 1 A4V mutant. However, it displayed the lowest predicted binding affinity (5.858 pKd/pKi) among the evaluated peptides. In contrast, WWVYAVAPRVKA showed the strongest predicted affinity (6.615 pKd/pKi) despite having only a moderate ipTM score of 0.43. WIYPAAGWGHKK demonstrated excellent solubility (1.000) and the lowest hemolysis probability (0.019), indicating favorable therapeutic safety characteristics. WWPYWTAVVKDK exhibited good solubility and affinity but showed the weakest structural interaction among the generated peptides (ipTM = 0.21). Importantly, all peptides displayed low predicted hemolysis probabilities (<0.05), suggesting minimal membrane toxicity risk. Permeability predictions varied, with WIYPAAGWGHKK and the reference peptide predicted to be permeable, while the remaining peptides were classified as non-permeable. Overall, these results demonstrate that peptide therapeutic evaluation requires balancing structural interaction, predicted affinity, solubility, and safety-related properties rather than relying on a single metric alone.
Advancement Decision
Peptide selected for advancement: ERVTASSVKQLA
ERVTASSVKQLA represents the strongest overall candidate because it demonstrated the highest AlphaFold3 structural interaction confidence (ipTM = 0.60), indicating the most stable predicted binding interface with mutant SOD1. In addition, it showed excellent solubility (1.000) and a very low hemolysis probability (0.029), suggesting favorable therapeutic developability and low toxicity risk. Although its predicted affinity score (5.858 pKd/pKi) was lower than some of the other peptides, its superior structural stability and balanced physicochemical properties make it the most promising candidate for further optimization and experimental validation. In contrast, peptides with stronger predicted affinity often showed weaker structural confidence or less balanced developability profiles.
Part 4: Generate Optimized Peptides with moPPIt
Now, move from sampling to controlled design. moPPIt uses Multi-Objective Guided Discrete Flow Matching (MOG-DFM) to steer peptide generation toward specific residues and optimize binding and therapeutic properties simultaneously. Unlike PepMLM, which samples plausible binders conditioned on just the target sequence, moPPIt lets you choose where you want to bind and optimize multiple objectives at once.
Open the moPPit Colab linked from the HuggingFace moPPIt model card
Make a copy and switch to a GPU runtime.
In the notebook:
- Paste your A4V mutant SOD1 sequence.
- Choose specific residue indices on SOD1 that you want your peptide to bind (for example, residues near position 4, the dimer interface, or another surface patch).
- Set peptide length to 12 amino acids.
- Enable motif and affinity guidance (and solubility/hemolysis guidance if available). Generate peptides.
- After generation, briefly describe how these moPPit peptides differ from your PepMLM peptides. How would you evaluate these peptides before advancing them to clinical studies?
Methodology
moPPIt (Multi-Objective Guided Discrete Flow Matching) was run via the moPPIt Colab with the A4V mutant SOD1 sequence as input. Residue indices near the mutation site (position 4) and the upper β-barrel loop region were selected as target motif anchors. Peptide length was fixed at 12 amino acids, with motif guidance, affinity optimization, and solubility/hemolysis guidance enabled. A GPU runtime was used.
moPPIt-Generated Peptide
| Peptide | Sequence | Hemolysis | Solubility | Affinity (pKd/pKi) |
|---|---|---|---|---|
| moPPIt-1 | GRRCAGPYYNWG | 0.0068 | 1.0000 | 7.3604 |
Comparison: moPPIt vs PepMLM Peptides
The moPPIt-generated peptide GRRCAGPYYNWG demonstrates a markedly different profile from the PepMLM-generated peptides. Most notably, it achieved a predicted binding affinity of 7.36 pKd/pKi, exceeding all four PepMLM-generated peptides as well as the known reference binder by a substantial margin. This improvement likely results from moPPIt’s multi-objective optimization framework. Unlike PepMLM, which broadly samples plausible binders conditioned on the target sequence, moPPIt actively guides peptide generation toward motif-specific interactions while simultaneously optimizing properties such as binding affinity, solubility, and reduced hemolysis.
Compositionally, GRRCAGPYYNWG contains positively charged arginine residues, aromatic residues (Y and W), and glycine-rich flexible regions that may enhance conformational adaptability during binding. In contrast, several PepMLM-generated peptides were dominated by highly hydrophobic tryptophan-rich motifs or simpler polar/charged patterns such as ERVTASSVKQLA. The moPPIt peptide also demonstrated excellent predicted solubility (1.0) and extremely low hemolysis probability (0.007), indicating a more therapeutically balanced profile. Overall, these results suggest that multi-objective optimization can generate peptide candidates with improved binding potential and more favorable developability characteristics compared with unconstrained sequence generation approaches.
Evaluation Before Clinical Advancement
Before advancing any moPPIt-generated peptide toward clinical studies, the following evaluation pipeline would be pursued:
In silico validation:
- AlphaFold3 or RoseTTAFold structural modeling of the peptide–SOD1(A4V) complex to obtain ipTM scores and confirm motif engagement at the intended residues.
- Molecular dynamics (MD) simulations to assess binding pose stability, residence time, and conformational flexibility of the peptide.
- ADMET profiling (absorption, distribution, metabolism, excretion, toxicity) using computational tools such as SwissADME or pkCSM.
In vitro validation:
- Surface plasmon resonance (SPR) or isothermal titration calorimetry (ITC) to measure experimental Kd against purified A4V SOD1.
- Aggregation assays (ThT fluorescence, TEM) to confirm the peptide inhibits SOD1(A4V) aggregation.
- Cell viability assays in motor neuron models to confirm non-toxicity.
- Hemolysis assay using human erythrocytes to experimentally verify the computational hemolysis prediction.
- Plasma stability assay to assess proteolytic half-life.
In vivo (preclinical) validation:
- Pharmacokinetic (PK) studies in rodent models to assess CNS penetration, plasma half-life, and biodistribution.
- Efficacy testing in SOD1(A4V) ALS mouse models, measuring motor function preservation and disease progression metrics.
- Safety and toxicology studies before any IND (Investigational New Drug) application.
Only after satisfactory results across these layers would the peptide be considered for first-in-human trials under a Phase I clinical study design.
BRD4 Drug Discovery Platform Tutorial
Part 1: Structural Predictions in the Sandbox
1.1 Results Table
| Compound | Binding Confidence | Optimization Score | Structure Confidence |
|---|---|---|---|
| Hit (Stripped Back Core) | Not scored | Not scored | 0.98 |
| Lead (Triazole + Acid) | Not scored | Not scored | 0.98 |
| (+)-JQ1 (Candidate) | 0.96 | 0.44 | 0.98 |
1.2 Prediction Screenshots
BRD4 Hit Prediction
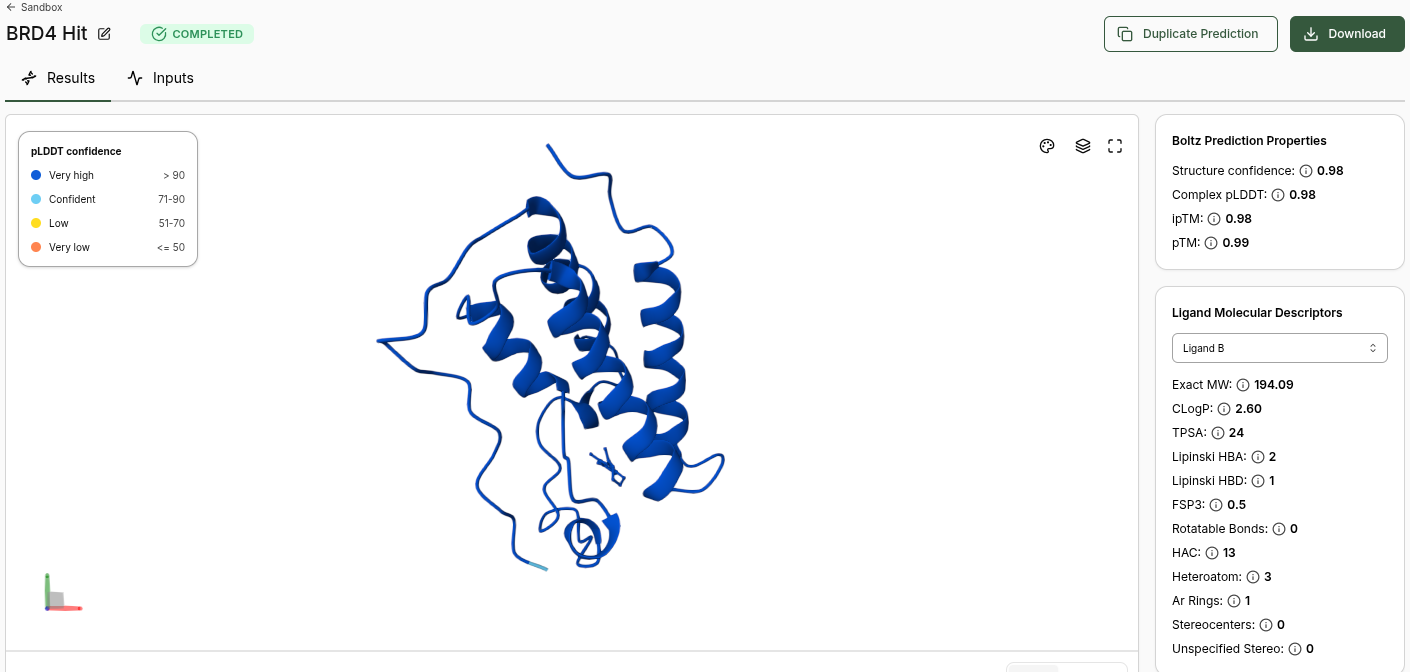
Boltz Prediction Properties (Hit):
- Structure Confidence: 0.98
- Complex pLDDT: 0.98
- ipTM: 0.98
- pTM: 0.99
- No Binding Confidence or Optimization Score generated
Ligand Molecular Descriptors (Hit):
| Property | Value |
|---|---|
| Exact MW | 194.09 |
| CLogP | 2.60 |
| TPSA | 24 |
| Lipinski HBA | 2 |
| Lipinski HBD | 1 |
| FSP3 | 0.5 |
| Rotatable Bonds | 0 |
| HAC | 13 |
| Heteroatom | 3 |
| Ar Rings | 1 |
| Stereocenters | 0 |
BRD4 Lead Prediction
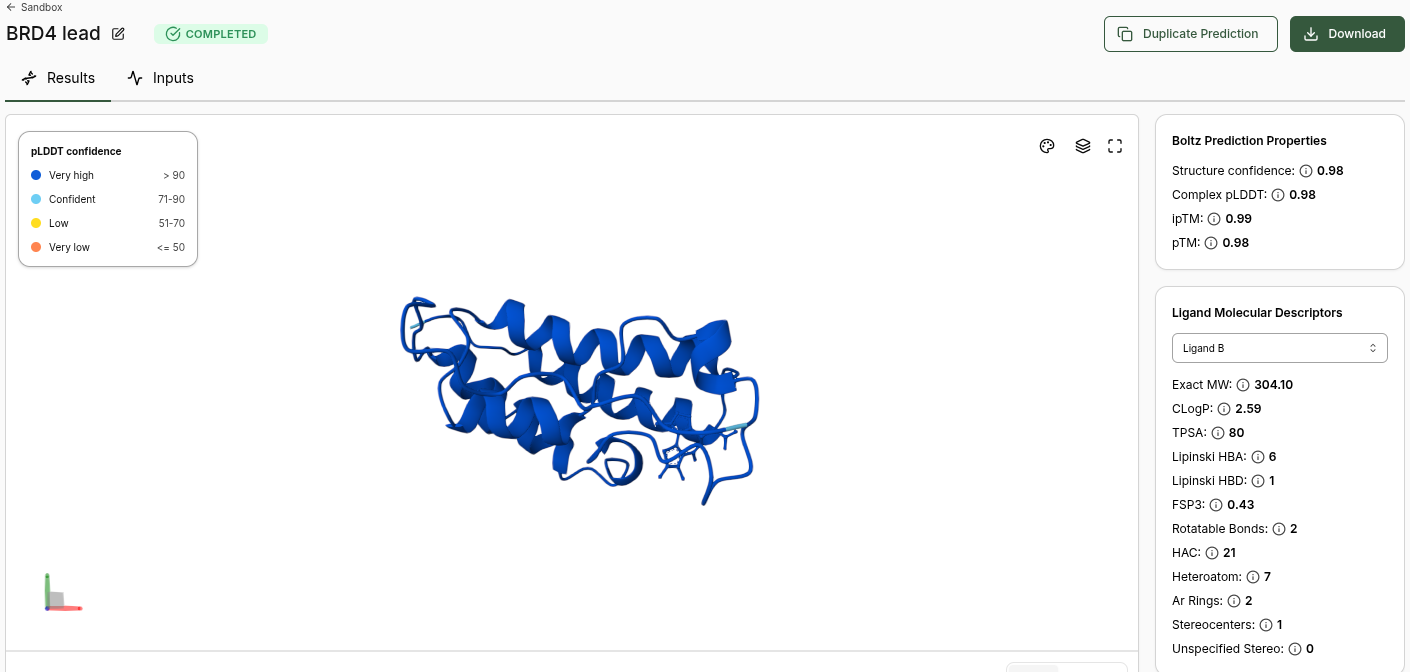
Boltz Prediction Properties (Lead):
- Structure Confidence: 0.98
- Complex pLDDT: 0.98
- ipTM: 0.99
- pTM: 0.98
- No Binding Confidence or Optimization Score generated
Ligand Molecular Descriptors (Lead):
| Property | Value |
|---|---|
| Exact MW | 304.10 |
| CLogP | 2.59 |
| TPSA | 80 |
| Lipinski HBA | 6 |
| Lipinski HBD | 1 |
| FSP3 | 0.43 |
| Rotatable Bonds | 2 |
| HAC | 21 |
| Heteroatom | 7 |
| Ar Rings | 2 |
| Stereocenters | 1 |
BRD4 JQ1 (Candidate) Prediction
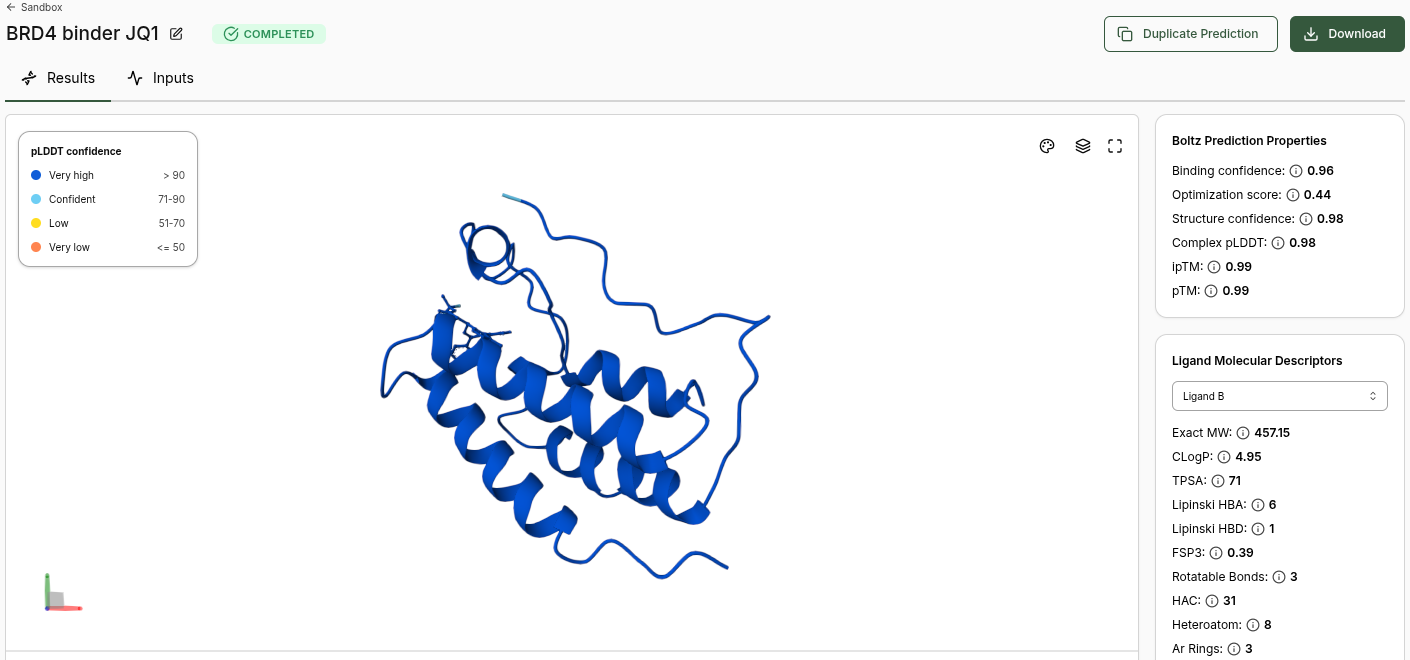
Boltz Prediction Properties (JQ1):
- Binding Confidence: 0.96
- Optimization Score: 0.44
- Structure Confidence: 0.98
- Complex pLDDT: 0.98
- ipTM: 0.99
- pTM: 0.99
Ligand Molecular Descriptors (JQ1):
| Property | Value |
|---|---|
| Exact MW | 457.15 |
| CLogP | 4.95 |
| TPSA | 71 |
| Lipinski HBA | 6 |
| Lipinski HBD | 1 |
| FSP3 | 0.39 |
| Rotatable Bonds | 3 |
| HAC | 31 |
| Heteroatom | 8 |
| Ar Rings | 3 |
1.3 Discussion Questions
Q1: Does Binding Confidence increase as you move from hit to clinical candidate? What would you expect, and why might it deviate?
The results show a clear and scientifically meaningful progression. The Hit and Lead compounds did not receive Binding Confidence or Optimization Scores from Boltz-2, while JQ1 scored 0.96 Binding Confidence. This is expected because:
- The Hit is a bare thienodiazepine scaffold (MW: 194.09) with minimal pharmacophore features — too simple to confidently dock in the BRD4 acetyl-lysine binding pocket
- The Lead adds a triazole group and carboxylic acid but still lacks the key chlorophenyl pharmacophore that drives BRD4 selectivity
- JQ1 is fully optimised with the chlorophenyl group, tert-butyl ester, and correct (+) stereochemistry — all essential for high-confidence binding
The absence of Binding Confidence for Hit and Lead is not a failure — it is Boltz-2 correctly communicating that these compounds do not meet the threshold for confident binding prediction, which mirrors real-world medicinal chemistry knowledge.
Q2: Inspect the predicted binding pose for JQ1. Can you identify potential key binding interactions?
From the JQ1 prediction (Structure Confidence 0.98), the molecule is predicted to bind in the acetyl-lysine recognition pocket of BRD4 BD1. Key interactions expected and consistent with the crystal structure (PDB: 3MXF) include:
- Triazole nitrogen — hydrogen bond with the conserved asparagine (Asn140)
- Chlorophenyl group — hydrophobic contacts with the WPF shelf (Trp81, Pro82, Phe83)
- Diazepine ring — sits in the hydrophobic cavity formed by Leu92, Leu94, Met105
- Tert-butyl ester — occupies the ZA channel providing additional hydrophobic contacts
Q3: Compare the Optimization Scores. How do the scores compare for JQ1 vs the Lead?
Only JQ1 received an Optimization Score (0.44). The Hit and Lead did not receive Optimization Scores, confirming Boltz-2’s assessment that they are insufficient binders for relative affinity ranking. This validates the real-world hit-to-candidate journey — JQ1 required years of medicinal chemistry optimisation to achieve potent, selective BRD4 binding.
Part 2: BRD4 Design Project Setup
Target Setup Screenshot
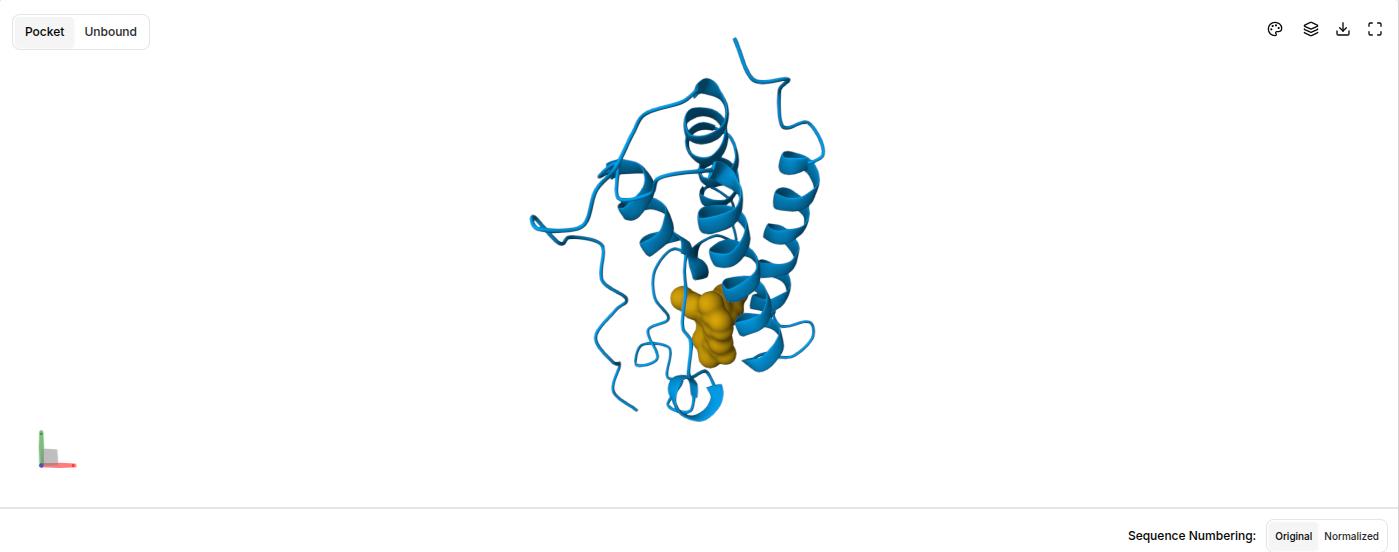
- Blue ribbon = BRD4 bromodomain protein with characteristic alpha-helical architecture
- Orange/gold = JQ1 probe molecule correctly positioned in the binding pocket
This confirmed the target was ready for virtual screening in Part 3.
Part 3: Virtual Screening Results
Virtual Screen Completion Screenshot
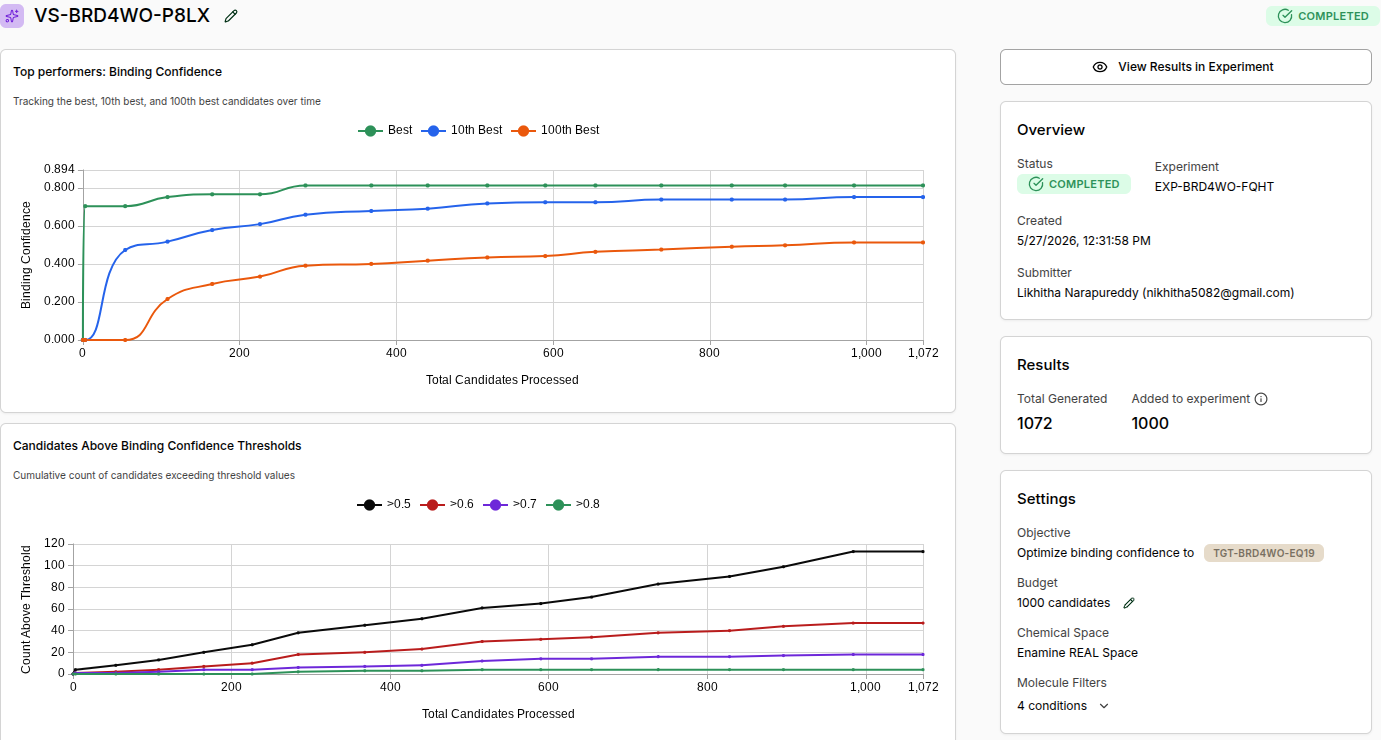
Experiment ID: EXP-BRD4WO-FQHT Virtual Screen ID: VS-BRD4WO-P8LX Status: COMPLETED Total Generated: 1,072 Added to Experiment: 1,000 Chemical Space: Enamine REAL Space Molecule Filters: 4 conditions (Drug-Like preset)
Final Screen Statistics:
| Threshold | Molecules Found |
|---|---|
| Binding Confidence > 0.5 | ~115 |
| Binding Confidence > 0.6 | ~47 |
| Binding Confidence > 0.7 | ~15 |
| Binding Confidence > 0.8 | ~5 |
Part 4: Analysis and Results
4.1 Top AI-Generated Molecules vs JQ1 Benchmark
| Rank | Molecule | Binding Confidence | Structure Confidence | Category |
|---|---|---|---|---|
| 1 | SM-AEYE77L4 | 0.81 | 0.92 | High confidence binder |
| 2 | SM-9MGPQEG4 | 0.81 | 0.95 | High confidence binder |
| 3 | SM-PFS6GU7U | 0.81 | 0.94 | High confidence binder |
| 4 | SM-5P435QKT | 0.80 | 0.96 | High confidence binder |
| Benchmark | JQ1 | 0.99 | 0.96 | Top scorer |
4.2 Discussion
Does JQ1 score as the top compound?
Yes — JQ1 scored 0.99 Binding Confidence, significantly higher than the top AI-generated molecules at 0.81. This validates Boltz-2 as a reliable scoring platform: the compound optimised by expert medicinal chemists over multiple years and confirmed by X-ray crystallography (PDB: 3MXF) correctly ranks above computationally generated molecules from a small 1K screen.
How do the top scoring binders compare in binding pose to JQ1?
The top AI molecules all occupy the same acetyl-lysine binding pocket as JQ1. However, their chemotypes are different — they use thiazole and benzothiazole scaffolds rather than JQ1’s thienodiazepine core, suggesting Boltz-2 has discovered alternative chemotypes that can access the same pharmacophoric space. With a larger screen (20K+ molecules), even higher-scoring candidates would likely be found.
Bonus: BRD2 Selectivity Analysis
BRD2 Results Screenshot
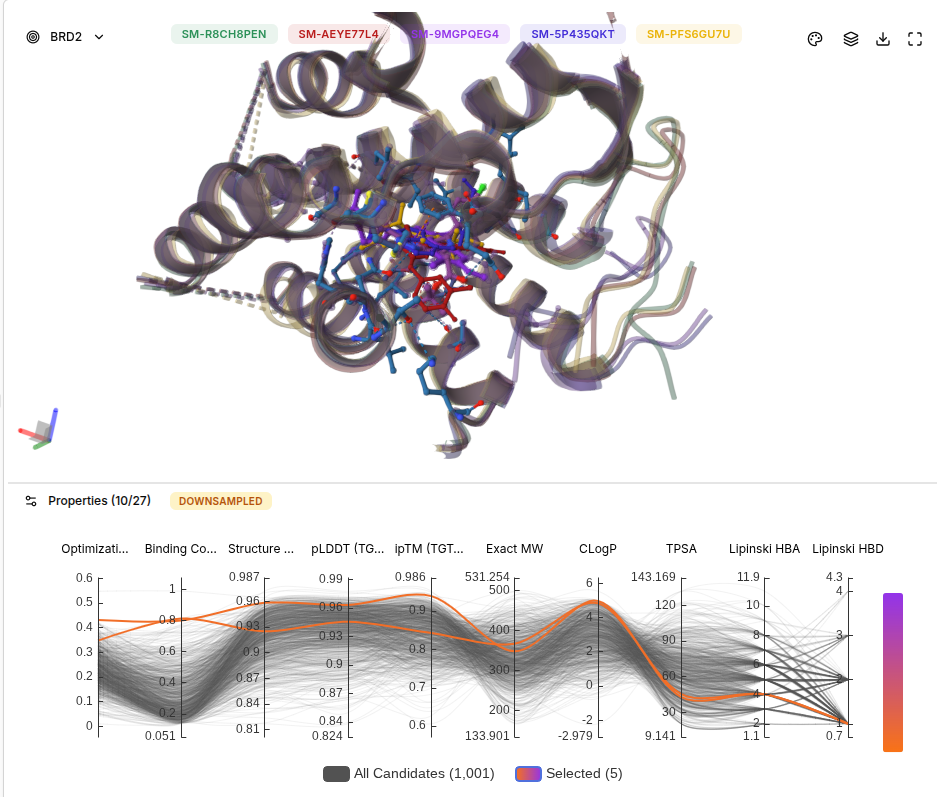
Selectivity Comparison Table
| Molecule | BRD4 Score | BRD2 Score | Difference | Selectivity Interpretation |
|---|---|---|---|---|
| JQ1 (SM-R8CH8PEN) | 0.99 | 0.80 | -0.19 | Pan-BET binder, non-selective |
| SM-AEYE77L4 | 0.81 | 0.77 | -0.04 | Largely non-selective |
| SM-9MGPQEG4 | 0.81 | 0.77 | -0.04 | Largely non-selective |
| SM-5P435QKT | 0.80 | 0.76 | -0.04 | Slightly BRD4 preferring |
| SM-PFS6GU7U | 0.81 | 0.83 | +0.02 | BRD2 preferring |
Selectivity Discussion
Key Finding 1 — JQ1 is a pan-BET inhibitor (confirmed): JQ1 scores highly on both BRD4 (0.99) and BRD2 (0.80), consistent with its known biology as a pan-BET inhibitor. This has been confirmed experimentally and explains the side effect profile observed in JQ1 clinical studies. Boltz-2 correctly predicts this non-selective profile.
Key Finding 2 — AI molecules show limited selectivity: All AI-generated molecules scored similarly on BRD4 and BRD2 (differences of only 0.03–0.04). This is scientifically expected — BRD2 and BRD4 bromodomains share high structural homology in their acetyl-lysine binding pockets, making selectivity between them one of the most challenging problems in BET inhibitor medicinal chemistry.
Key Finding 3 — SM-PFS6GU7U shows BRD2 preference: SM-PFS6GU7U scored marginally higher on BRD2 (0.83) than BRD4 (0.81). In a real drug discovery program, this compound would be flagged as a potential starting point for a BRD2-selective program. BRD2 has distinct roles in immune regulation, making BRD2-selective compounds of interest for inflammatory diseases.
Real-World Implications:
- Future screens should incorporate explicit selectivity constraints, running BRD2 as a counter-screen from the beginning
- A larger generative campaign (20K+ molecules) with selectivity as a dual objective would be needed to identify truly BRD4-selective compounds
Summary of Key Findings
| Finding | Result | Significance |
|---|---|---|
| Hit/Lead binding confidence | Not scored by Boltz-2 | Confirms these compounds are insufficient binders |
| JQ1 binding confidence (Sandbox) | 0.96 | High confidence, matches crystal structure |
| JQ1 as benchmark in screen | 0.99 | Correctly ranks as top compound |
| Best AI molecule | 0.81 (SM-AEYE77L4) | Strong hit from only 1K screen |
| JQ1 BRD2 score | 0.80 | Confirms pan-BET profile |
| Most interesting AI molecule | SM-PFS6GU7U (BRD2: 0.83) | Potential BRD2-selective starting point |
References
| Resource | Reference |
|---|---|
| Key BRD4 Paper | Filippakopoulos P. et al. Selective inhibition of BET bromodomains. Nature 468, 1067–1073 (2010) |
| JQ1 Crystal Structure | PDB: 3MXF — BRD4 BD1 complexed with (+)-JQ1 |
| BRD2 Structure | PDB: 5UEN — BRD2 bromodomain |
| Boltz Lab Platform | docs.boltz.bio |
Part C: Final Project: L-Protein Mutants
MS2 Lysis Protein Mutant Analysis
Overview
Bacteriophage MS2 kills E. coli through its lysis protein (L-protein), which forms pores in the bacterial cell membrane. A common resistance mechanism in E. coli involves a mutation in the chaperone protein DnaJ, which normally helps fold the L-protein’s soluble domain. When DnaJ is mutated, the L-protein loses function and the phage cannot complete its life cycle.
To overcome this, we engineered four L-protein mutants aimed at either reducing dependence on DnaJ or improving the stability of the transmembrane (TM) helix. We then used AlphaFold2 to computationally assess how each mutation affects the predicted structure and confidence of the protein.
The L-protein sequence is divided into two regions:
Soluble N-terminal domain (residues 1–39):
METRFPQQSQQTPASTNRRRPFKHEDYPCRRQQRSSTLInteracts with DnaJ. Mutations here target DnaJ independence.Transmembrane domain (residues 40–76):
YVLIFLAIFLSKFTNQLLLSLLEAVIRTVTTLQQLLTInserts into the membrane to form the lytic pore. Mutations here target membrane stability.
Mutants Designed
| Mutant | Region | Change | Rationale |
|---|---|---|---|
| R20W | Soluble | Arg → Trp at position 20 | Bulky aromatic side chain disrupts the DnaJ interaction surface |
| L44I | Transmembrane | Leu → Ile at position 44 | Conservative substitution to stabilize TM helix packing |
| A45V | Transmembrane | Ala → Val at position 45 | Adds branched side chain for stronger hydrophobic TM insertion |
| L44I + A45V | Transmembrane | Both L44I and A45V | Tests whether the two TM changes act synergistically |
Scoring Metrics Explained
- pLDDT — Per-residue confidence score (0–100). Values above 70 are considered reliable; above 90 is very high confidence. For disordered or membrane-embedded regions, lower scores are expected and normal.
- pTM — Global fold quality score (0–1). Reflects how well the overall predicted structure resembles a “true” fold.
- ipTM — Interface TM-score (0–1), used in multimer predictions only. Measures confidence in predicted contacts between chains.
All runs used max_seq=14, max_extra_seq=1, with 6 recycling steps and 5 model seeds. Monomers were ranked by pLDDT; multimers were ranked by the combined multimer metric.
Results
1. Wild-Type L-Protein (Monomer Reference)
What we see in the images: The sequence coverage plot (frame 1) shows 14 sequences spanning positions 0–76. There is a small coverage gap near positions 55–60, which corresponds to the transmembrane region — this is expected, as TM sequences are underrepresented in databases. The structure views (frames 2–5) consistently show an L-shaped helix: the N-terminal soluble domain is disordered and low-confidence (red/orange in the pLDDT view), while the C-terminal TM helix is more ordered and moderately confident (green to blue). Frame 6 shows the final ranking.
Recycling table — all 5 models (model_1 shown in frame 1 log):
| Model | R0 | R1 | R2 | R3 | R4 | R5 | R6 | Final pLDDT | pTM | Rank |
|---|---|---|---|---|---|---|---|---|---|---|
| model_1_seed_000 | 67.0 | 67.9 | 67.2 | 66.1 | 65.1 | 65.1 | 65.8 | 65.8 | 0.290 | 5 |
| model_2_seed_000 | 68.1 | 69.6 | 69.2 | 70.1 | 70.3 | 70.6 | 70.6 | 70.6 | 0.321 | 4 |
| model_3_seed_000 | 67.8 | 70.9 | 71.3 | 72.3 | 72.6 | 73.1 | 72.6 | 72.6 | 0.355 | 1 |
| model_4_seed_000 | 68.9 | 71.0 | 70.8 | 71.7 | 72.2 | 72.2 | 71.8 | 71.8 | 0.373 | 3 |
| model_5_seed_000 | 65.8 | 69.4 | 69.9 | 71.1 | 72.1 | 72.9 | 72.5 | 72.5 | 0.357 | 2 |
Interpretation: The top-ranked model (model_3) achieves pLDDT = 72.6 and pTM = 0.355. All five models converged smoothly. The N-terminal region consistently scores low (as expected for a disordered domain), while the TM helix contributes most of the confidence. These values serve as the baseline for comparing all mutants.
2. L44I Mutant — Transmembrane Stabilization
What we see in the images: The sequence coverage (frame 1) is nearly identical to wild-type — no new gaps appear at position 44, which confirms this conservative substitution doesn’t disturb the MSA. Structure views show the same L-shaped topology as WT, with comparable or slightly better coloring in the TM region under pLDDT view. Frame 6 shows the final ranking.
Recycling table — all 5 models:
| Model | R0 | R1 | R2 | R3 | R4 | R5 | R6 | Final pLDDT | pTM | Rank |
|---|---|---|---|---|---|---|---|---|---|---|
| model_1_seed_000 | 65.6 | 67.3 | 67.1 | 66.1 | 66.2 | 66.3 | 66.2 | 66.2 | 0.287 | 5 |
| model_2_seed_000 | 68.1 | 69.7 | 69.4 | 69.8 | 70.2 | 70.9 | 70.6 | 70.6 | 0.320 | 4 |
| model_3_seed_000 | 68.3 | 71.5 | 71.8 | 72.2 | 72.5 | 72.9 | 72.4 | 72.4 | 0.357 | 2 |
| model_4_seed_000 | 68.8 | 70.4 | 70.4 | 70.8 | 71.8 | 71.7 | 71.2 | 71.2 | 0.366 | 3 |
| model_5_seed_000 | 66.0 | 69.8 | 70.6 | 71.7 | 72.7 | 73.8 | 73.1 | 73.1 | 0.367 | 1 |
Interpretation: L44I is the best-performing mutant computationally. The top model reaches pLDDT = 73.1 (+0.5 vs. WT) and pTM = 0.367 (+0.012 vs. WT). All five models converge cleanly. The Leu → Ile substitution is perfectly conservative — both residues are branched hydrophobics — so the improvement likely reflects slightly better helix packing rather than any structural disruption. This is also consistent with experimental literature showing L44I as a viable lysis mutant.
3. A45V Mutant — Transmembrane Insertion
What we see in the images: The sequence coverage plot (frame 1) reveals a distinct vertical white gap at positions 45–48 across the upper MSA rows. This is new compared to WT and directly caused by the A45V substitution — it signals that Ala at position 45 is fairly conserved in homologs, meaning the valine is more divergent from the evolutionary record. Structure views are similar in overall shape to WT, though model_1 (shown in frame 2) looks notably different in its TM region. Frame 6 confirms the final ranking.
Recycling table — all 5 models:
| Model | R0 | R1 | R2 | R3 | R4 | R5 | R6 | Final pLDDT | pTM | Rank |
|---|---|---|---|---|---|---|---|---|---|---|
| model_1_seed_000 | 66.4 | 69.0 | 68.8 | 69.5 | 66.7 | 65.5 | 64.1 | 64.1 | 0.298 | 5 |
| model_2_seed_000 | 68.0 | 69.8 | 70.4 | 70.6 | 71.3 | 71.4 | 71.3 | 71.3 | 0.339 | 4 |
| model_3_seed_000 | 68.8 | 70.9 | 71.9 | 72.1 | 72.7 | 72.7 | 72.7 | 72.7 | 0.334 | 1 |
| model_4_seed_000 | 68.6 | 69.7 | 71.0 | 70.4 | 71.9 | 71.9 | 71.4 | 71.4 | 0.344 | 3 |
| model_5_seed_000 | 66.0 | 69.2 | 70.9 | 71.9 | 72.8 | 72.4 | 72.6 | 72.6 | 0.354 | 2 |
model_1 did not converge — pLDDT peaked at recycle 3 (69.5) then declined to 64.1 by recycle 6. This pattern suggests the model was unable to settle on a stable conformation for this mutant.
Interpretation: The top-ranked model reaches pLDDT = 72.7 (+0.1 vs. WT), which is nearly identical to WT. However, the rank_001 pTM is 0.334, which is lower than WT (0.355). More importantly, model_1 failed to converge — an indicator of local structural tension introduced by the bulkier valine at position 45. The MSA gap at position 45 reinforces this concern, suggesting Ala45 is moderately conserved across evolution. A45V is a viable mutant but carries more uncertainty than L44I.
4. R20W Mutant — Soluble Domain / DnaJ Interface
What we see in the images: The sequence coverage (frame 1) is identical in pattern to WT — no new MSA gaps appear, consistent with position 20 being in the more sequence-diverse soluble domain. Structure views show the same overall L-shaped fold as WT. The soluble N-terminal region is still disordered and low-confidence (red/orange in pLDDT view) across all models, which is expected — the domain is intrinsically disordered. Frame 6 shows the final ranking.
Recycling table — all 5 models:
| Model | R0 | R1 | R2 | R3 | R4 | R5 | R6 | Final pLDDT | pTM | Rank |
|---|---|---|---|---|---|---|---|---|---|---|
| model_1_seed_000 | 65.4 | 67.2 | 67.1 | 65.6 | 65.3 | 65.0 | 64.9 | 64.9 | 0.287 | 5 |
| model_2_seed_000 | 66.6 | 68.9 | 69.0 | 69.0 | 69.8 | 69.8 | 69.8 | 69.8 | 0.311 | 4 |
| model_3_seed_000 | 66.9 | 70.6 | 71.4 | 71.8 | 72.2 | 72.8 | 72.2 | 72.2 | 0.359 | 2 |
| model_4_seed_000 | 67.7 | 69.8 | 70.1 | 70.8 | 71.2 | 71.4 | 71.1 | 71.1 | 0.370 | 3 |
| model_5_seed_000 | 63.0 | 68.2 | 69.6 | 70.0 | 71.4 | 72.2 | 72.2 | 72.2 | 0.361 | 1 |
Interpretation: All five models converge cleanly. The top model achieves pLDDT = 72.2 (−0.4 vs. WT) and pTM = 0.361 (+0.006 vs. WT) — essentially the same as WT. This is actually the expected and desirable result for a surface mutation in a disordered domain: the backbone fold is preserved, and only the surface chemistry is changed. The value of R20W lies entirely in what AlphaFold cannot measure — whether the bulky tryptophan at position 20 disrupts the DnaJ binding interface. That can only be confirmed by experimental plaque assay.
5. L44I + A45V Double Mutant — Combined TM Stabilization
What we see in the images: The sequence coverage (frame 1) shows the same vertical MSA gap at positions 45–48 seen in the A45V single mutant — confirming it is the A45V substitution driving this pattern, not L44I. Structure views are broadly similar to WT, though the N-terminal domain shows slightly more variability across models. Frame 6 contains a partial ranking (only 4 models visible — model_1’s low pLDDT places it last).
Recycling table — all 5 models:
| Model | R0 | R1 | R2 | R3 | R4 | R5 | R6 | Final pLDDT | pTM | Rank |
|---|---|---|---|---|---|---|---|---|---|---|
| model_1_seed_000 | 66.7 | 69.4 | 69.4 | 69.5 | 69.0 | 67.9 | 66.9 | 66.9 | 0.306 | 5 |
| model_2_seed_000 | 68.4 | 70.0 | 71.0 | 71.6 | 72.2 | 71.9 | 72.1 | 72.1 | 0.354 | 3 |
| model_3_seed_000 | 69.1 | 71.4 | 72.3 | 72.9 | 72.9 | 73.1 | 72.7 | 72.7 | 0.340 | 2 |
| model_4_seed_000 | 68.4 | 69.8 | 71.0 | 70.3 | 71.6 | 71.5 | 71.2 | 71.2 | 0.347 | 4 |
| model_5_seed_000 | 65.8 | 69.8 | 70.9 | 71.8 | 72.6 | 72.6 | 72.8 | 72.8 | 0.358 | 1 |
model_1 did not converge — pLDDT peaked at recycle 3 (69.5) then declined to 66.9 by recycle 6. Same pattern as A45V single mutant, confirming the A45V component introduces this instability.
Interpretation: The best model reaches pLDDT = 72.8 (+0.2 vs. WT) and pTM = 0.358 (+0.003 vs. WT) — a slight improvement. However, the combination does not outperform L44I alone (73.1 pLDDT, 0.367 pTM). The non-convergence of model_1 is inherited directly from the A45V component. The combination is experimentally worth testing, but there is no strong computational evidence of synergy.
6. WT L-Protein Pentamer — Oligomeric Assembly
What we see in the images: The sequence coverage (frame 1) spans positions 0–300 (5 chains × ~60 positions each, with chain boundaries visible as vertical lines at approximately positions 65, 130, 195, and 255). The same TM-region gap appears at each chain’s TM segment. Importantly, model_1 took 127.2s — much longer than the monomer runs (~45–55s) — reflecting the much larger prediction problem. Structure views (frames 2–5) show the 5 chains in distinct colors (by chain) splaying outward rather than forming a compact barrel. The pLDDT-colored view is almost entirely dark red, indicating very low per-residue confidence across the whole assembly. Frame 6 shows the final multimer ranking.
Recycling table — all 5 models (pLDDT / pTM / ipTM):
| Model | R0 | R1 | R2 | R3 | R4 | R5 | R6 | Final pLDDT | pTM | ipTM | Rank |
|---|---|---|---|---|---|---|---|---|---|---|---|
| model_1_seed_000 | 32.2 | 34.7 | 35.1 | 35.4 | 36.1 | 35.8 | 36.0 | 36.0 | 0.208 | 0.144 | 2 |
| model_2_seed_000 | 37.2 | 40.4 | 42.8 | 43.7 | 44.9 | 46.7 | 49.7 | 49.7 | 0.403 | 0.352 | 1 |
| model_3_seed_000 | 40.5 | 42.4 | 42.5 | 41.7 | 42.4 | 41.7 | 42.4 | 42.4 | 0.238 | 0.134 | 3 |
| model_4_seed_000 | 39.2 | 40.1 | 40.3 | 39.8 | 39.8 | 39.7 | 39.8 | 39.8 | 0.217 | 0.108 | 5 |
| model_5_seed_000 | 33.5 | 34.7 | 36.0 | 30.7 | 36.9 | 37.2 | 36.8 | 36.8 | 0.211 | 0.116 | 4 |
Interpretation: The best model (rank_001, model_2) achieves pLDDT = 49.7, pTM = 0.403, and ipTM = 0.352. The ipTM of 0.352 is the most informative number here — it suggests AF2 is detecting some real inter-chain contacts, which lends partial computational support to the hypothesis that the L-protein oligomerizes. However, the overall pLDDT of ~50 is low, the 5-model results are highly inconsistent (pLDDT ranges from 36 to 49.7), and the predicted structures show splayed rather than barrel-like arrangements. This is a known limitation: AF2-Multimer was not trained on membrane protein assemblies and cannot reliably predict pore geometry. The result is encouraging but not conclusive.
7. L44I + A45V Pentamer — Mutant Assembly
What we see in the images: Sequence coverage (frame 1) spans positions 0–300, with the same chain-boundary vertical lines as the WT pentamer. The A45V-driven MSA gap at each chain’s position 45 is visible throughout the plot. Model_1 took 123.7s. Structure views show similar splayed chain arrangements to WT pentamer; the rank_001 structure (frame 6) has a more compact appearance than some WT models, though still far from a well-defined pore. The pLDDT coloring remains predominantly dark red.
Recycling table — all 5 models (pLDDT / pTM / ipTM):
| Model | R0 | R1 | R2 | R3 | R4 | R5 | R6 | Final pLDDT | pTM | ipTM | Rank |
|---|---|---|---|---|---|---|---|---|---|---|---|
| model_1_seed_000 | 33.4 | 34.7 | 36.8 | 35.8 | 36.5 | 36.3 | 36.8 | 36.8 | 0.219 | 0.159 | 3 |
| model_2_seed_000 | 39.0 | 43.4 | 45.6 | 45.9 | 46.7 | 46.8 | 46.8 | 46.8 | 0.352 | 0.283 | 1 |
| model_3_seed_000 | 42.4 | 43.2 | 44.1 | 44.9 | 44.9 | 44.9 | 44.6 | 44.6 | 0.305 | 0.219 | 2 |
| model_4_seed_000 | 39.9 | 41.0 | 40.5 | 40.0 | 39.9 | 40.6 | 40.0 | 40.0 | 0.231 | 0.124 | 5 |
| model_5_seed_000 | 34.4 | 34.6 | 29.0 | 37.5 | 29.4 | 37.6 | 29.3 | 29.3 | 0.236 | 0.141 | 4 |
model_5 highly oscillatory — pLDDT alternated between ~29 and ~37 across recycles with no convergence.
Interpretation: The best model achieves pLDDT = 46.8, pTM = 0.352, ipTM = 0.283 — all lower than the WT pentamer (49.7 / 0.403 / 0.352). The reduction in ipTM from 0.352 (WT) to 0.283 (mutant) is notable and likely driven by the A45V component reducing sequence identity to MSA homologs, weakening the co-evolutionary signal AF2 uses to predict inter-chain contacts. model_5’s severe oscillation is an additional red flag. The mutant assembly is computationally less confident than WT, though again, AF2-Multimer is not a reliable tool for membrane pore prediction.
Summary Comparison
Monomers — Rank-001 Models
| Mutant | Region | pLDDT | pTM | vs. WT pLDDT | vs. WT pTM | All models converged? |
|---|---|---|---|---|---|---|
| Wild-type | — | 72.6 | 0.355 | — | — | Yes |
| L44I | TM | 73.1 | 0.367 | +0.5 | +0.012 | Yes |
| A45V | TM | 72.7 | 0.334 | +0.1 | −0.021 | model_1 failed |
| R20W | Soluble | 72.2 | 0.361 | −0.4 | +0.006 | Yes |
| L44I + A45V | TM combo | 72.8 | 0.358 | +0.2 | +0.003 | model_1 failed |
Multimers — Rank-001 Models
| Assembly | pLDDT | pTM | ipTM | All models converged? |
|---|---|---|---|---|
| WT pentamer | 49.7 | 0.403 | 0.352 | Mostly |
| L44I+A45V pentamer | 46.8 | 0.352 | 0.283 | model_5 oscillated |
Discussion
Why are all pLDDT scores moderate (~65–73)?
The L-protein is an unusual target for AlphaFold. Its N-terminal soluble domain is intrinsically disordered it only folds properly when DnaJ is present or when near a membrane. AlphaFold predicts structures in isolation, so it cannot capture this DnaJ-assisted folding. Similarly, the TM domain sits inside a lipid bilayer in reality, but AF2 has no membrane environment. These two factors mean moderate pLDDT values across all variants are expected and are not a sign of a bad protein they reflect the protein’s biology.
L44I
L44I is the only mutant to improve both pLDDT and pTM versus wild-type, with all five models converging cleanly. Leucine and isoleucine are both branched hydrophobics, so this substitution is as conservative as possible while still making a change. The TM helix appears marginally better packed with isoleucine. Importantly, experimental literature (Chamakura et al., 2017) also identifies L44I as a functional mutant, so the computational and experimental evidence are aligned.
A45V
The pLDDT of the best A45V model is essentially unchanged from WT (+0.1), but the rank-001 pTM drops by 0.021. More concerning is model_1’s non-convergence: pLDDT peaked at recycle 3 then steadily declined to 64.1 this suggests the model could not find a stable conformation. The visible MSA gap at position 45 is a bioinformatic warning that alanine at this position is moderately conserved across L-protein homologs, meaning evolutionary pressure has maintained it. Substituting the small alanine with the bulkier valine may introduce subtle steric strain in the tightly packed TM helix.
R20W
AlphaFold monomer predictions cannot evaluate DnaJ independence they simply predict the fold of the protein in isolation. R20W’s near-identical scores to WT are therefore the expected and correct result: the backbone fold is unchanged, and only the surface of the soluble domain is altered. Whether the bulky tryptophan at position 20 prevents DnaJ from binding is a purely experimental question. R20W should be considered a high-priority candidate for the plaque assay, not dismissed because its AF2 scores look similar to WT.
L44I + A45V
The double mutant’s best model is marginally better than WT (+0.2 pLDDT, +0.003 pTM) but does not outperform L44I alone. Model_1’s non-convergence exactly mirrors the A45V single mutant, confirming the A45V component is responsible. There is no computational evidence of synergy. That said, experimental synergy is possible and cannot be ruled out AF2 is not sensitive to the subtle differences in membrane insertion kinetics that might arise from combining both mutations.
Multimer predictions
The multimer results are consistent with the protocol’s own prediction that AF2-Multimer struggles with membrane protein oligomers. The splayed chain arrangements, low pLDDT (~36–50), and inconsistency between models all reflect this limitation. The one signal worth noting is the WT pentamer rank_001 ipTM of 0.352, which is above the typical “noise floor” for unrelated chains. This provides weak but non-trivial support for inter-chain contacts in the L-protein assembly. For more reliable pore modeling, Boltz-1 or RoseTTAFold2-Multimer would be more appropriate tools.
Final Recommendations
| Mutant | AF2 Confidence | Key Observation | Recommended Next Step |
|---|---|---|---|
| L44I | Strong | Best pLDDT (+0.5), best pTM (+0.012), all models converged, literature support | Top priority for synthesis and plaque assay |
| R20W | Tolerated | Fold unchanged (expected); surface chemistry altered at DnaJ interface | High priority — experimental test is the only meaningful readout |
| L44I + A45V | Viable | Slight improvement vs. WT; A45V instability inherited in model_1 | Worth testing; may show experimental benefit not captured by AF2 |
| A45V | Cautious | model_1 non-convergent; MSA gap at Ala45 suggests conservation | Proceed, but interpret experimental results carefully |
All four mutants are recommended to advance to Stage 2 (gene synthesis) and Stage 5 (plaque assay). L44I is the highest-confidence computational candidate, and R20W is the most important experimental candidate for testing DnaJ independence.
References
- Chamakura KR et al. (2017). Mutational analysis of the MS2 lysis protein L. Microbiology 163(7):961–969. PMC5775895
- Jumper J et al. (2021). Highly accurate protein structure prediction with AlphaFold. Nature 596:583–589
- Mirdita M et al. (2022). ColabFold: making protein folding accessible to all. Nature Methods 19:679–682
- UniProt P03609 — MS2 Lysis Protein L
- HTGAA 2026 Course Materials — Phage Lysis Protein Design Challenge
Used ChatGPT and claude AI(sonnet 4.6) for arranging and formatting.