Week 10 HW: Advanced Imaging & Measurement Technology
Homework: Final Project
For your final project:
Please identify at least one (ideally many) aspect(s) of your project that you will measure. It could be the mass or sequence of a protein, the presence, absence, or quantity of a biomarker, etc.
Please describe all of the elements you would like to measure, and furthermore describe how you will perform these measurements.
What are the technologies you will use (e.g., gel electrophoresis, DNA sequencing, mass spectrometry, etc.)? Describe in detail.
Ans:The primary aspect measured in this project is the biosensor response, observed as a visible color change resulting from the activation of a reporter gene in the presence of plastic associated chemical signals. Additionally, the level of gene expression will be evaluated to understand the strength of the response under different signal conditions. These measurements will be performed using in silico simulation tools, where the behavior of the genetic circuit is modeled to predict activation and output. DNA construct design and validation will be carried out using Benchling, ensuring proper sequence structure and functionality. The simulation of circuit behavior will be conducted using Asimov Kernel.
In a practical setting, these measurements could be further validated using cell-free expression assays and techniques such as spectrophotometry or fluorescence analysis to quantify the output signal.The output of the biosensor is a visible color change, which can be measured quantitatively using spectrophotometry. This technique measures the absorbance of light at specific wavelengths corresponding to the produced color. The intensity of absorbance is directly proportional to the amount of reporter protein expressed.Fluorescence intensity can be measured using a fluorometer. The emitted light intensity corresponds to the level of gene expression. This method provides high sensitivity and allows precise quantification of the biosensor response, especially at low signal concentrations.
Homework: Waters Part I — Molecular Weight
We will analyze an eGFP standard on a Waters Xevo G3 QTof MS system to determine the molecular weight of intact eGFP and observe its charge state distribution in the native and denatured (unfolded) states. The conditions for LC-MS analysis of intact protein cause it to unfold and be detected in its denatured form (due to the solvents and pH used for analysis).
- Based on the predicted amino acid sequence of eGFP (see below) and any known modifications, what is the calculated molecular weight? You can use an online calculator like the one at https://web.expasy.org/compute_pi/ eGFP Sequence: MVSKGEELFTG VVPILVELDG DVNGHKFSVS GEGEGDATYG KLTLKFICTT GKLPVPWPTL VTTLTYGVQC FSRYPDHMKQ HDFFKSAMPE GYVQERTIFF KDDGNYKTRA EVKFEGDTLV NRIELKGIDF KEDGNILGHK LEYNYNSHNV YIMADKQKNG IKVNFKIRHN IEDGSVQLAD HYQQNTPIGD GPVLLPDNHY LSTQSALSKD PNEKRDHMVL LEFVTAAGIT LGMDELYKLE HHHHHH Note: This contains a His-purification tag (HHHHHH) and a linker (the LE before it).
Ans: The calculated molecular weight using https://web.expasy.org/compute_pi/ is 28006.60 Da
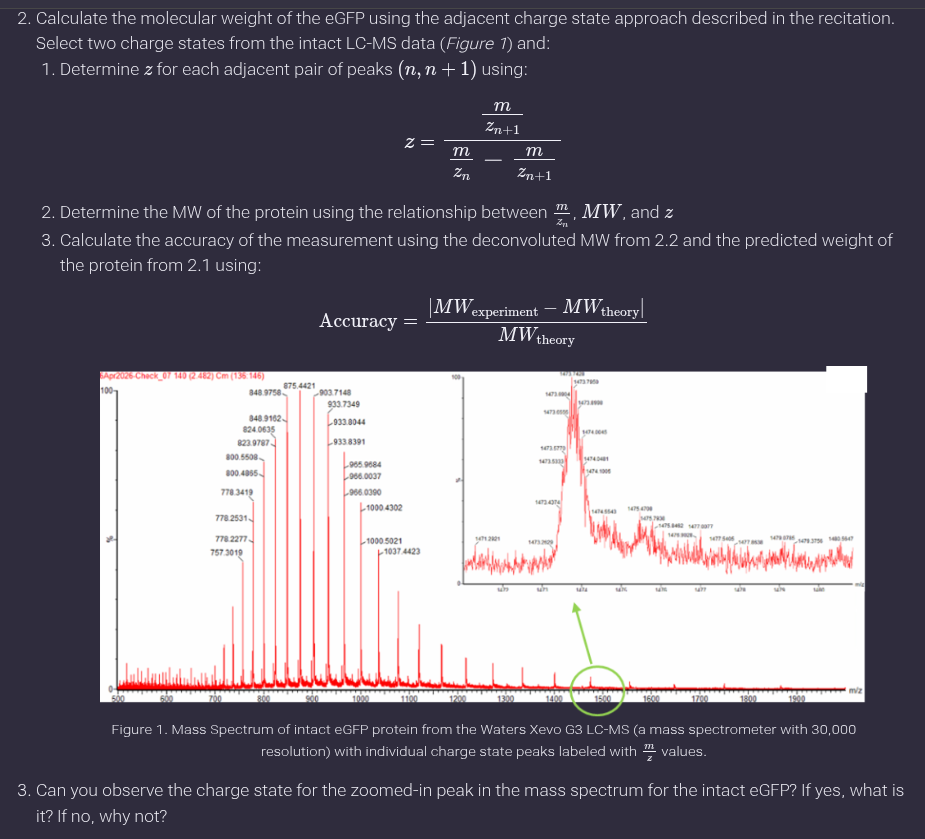
Ans: a. A common pair visible is approximately:
𝑚/𝑧𝑛 ≈ 933
𝑚/𝑧𝑛+1 ≈ 903
Determination of charge state (z):
Two adjacent peaks were selected at approximately 933 and 903 m/z. Using the given formula:
Z = 903/933−903 ≈ 30
Thus, the charge state is z ≈ +30.
b. Molecular weight calculation:
Using the relationship:
𝑀𝑊 = 𝑧(𝑚/𝑧)−𝑧
MW = 30×933−30=27,960 Da
Thus, the molecular weight of eGFP is approximately 27.96 kDa.
c.From earlier:
𝑀𝑊𝑒𝑥𝑝 = 27,960 Da
𝑀𝑊𝑡ℎ𝑒𝑜𝑟𝑦 = 28,006.60 Da
Accuracy calculation:
Accuracy =∣27960−28006.60∣/ 28006.60 ≈ 0.00166
Error ≈ 0.166%
- Charge state of zoomed-in peak:
No, the charge state cannot be directly determined from the zoomed-in peak because isotopic spacing is not resolved, which is necessary to assign charge states.
Homework: Waters Part III — Peptide Mapping - primary structure
- How many Lysines (K) and Arginines (R) are in eGFP? Please circle or highlight them in the eGFP sequence given in Waters Part I question 1 above. (Note: adding the sequence to Benchling as an amino acid file and clicking biochemical properties tab will show you a count for each amino acid).
Ans: Number of Lysines (K) present are 20 and number of Arginines (R) present = 6
MVSKGEELFTG VVPILVELDG DVNGH[K]FSVS GEGEGDATYG [K]LTL[K]FICTT G[K]LPVPWPTL VTTLTYGVQC FS[R]YPDHM[K]Q HDFF[K]SAMPE GYVQE[R]TIFF [K]DDGNY[K]T[R]A EV[K]FEGDTLV N[R]IEL[K]GIDF [K]EDGNILGH[K] LEYNYNSHNV YIMAD[K]Q[K]NG IKVNFKI[R]HN IEDGSVQLAD HYQQNTPIGD GPVLLPDNHY LSTQSALSKD PNE[K][R]DHMVL LEFVTAAGIT LGMDELY[K]LE HHHHHH
2.How many peptides will be generated from tryptic digestion of eGFP?
Navigate to https://web.expasy.org/peptide_mass/
Copy/paste the sequence above into the input box in the PeptideMass tool to generate expected list of peptides.
Use Figure 4 below as a guide for the relevant parameters to predict peptides from eGFP.
Click “Perform the Cleavage” button in the PeptideMass tool and report the number of peptides generated when using trypsin to perform the digest.
Ans: Using the PeptideMass tool with default settings shows 19 peptides because small peptides (<500 Da) are excluded.
- Based on the LC-MS data for the Peptide Map data generated in lab (please use Figure 5a as a reference) how many chromatographic peaks do you see in the eGFP peptide map between 0.5 and 6 minutes? You may count all peaks that are >10% relative abundance.
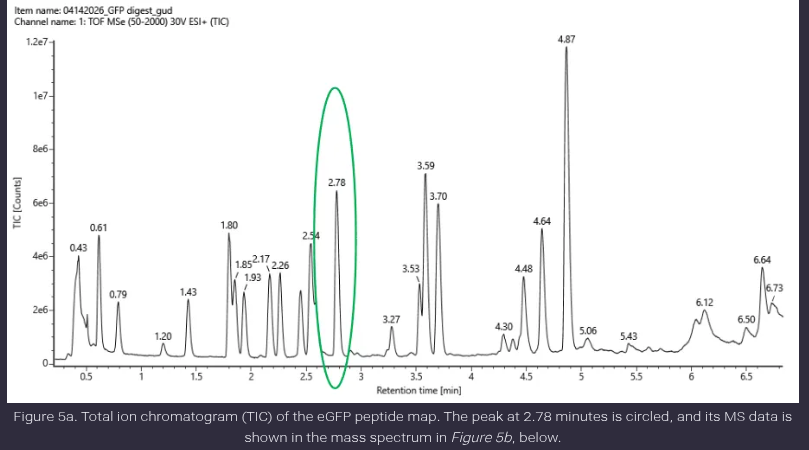
Ans: The number of peptide peaks observed in the chromatogram between 0.5 and 6 minutes, considering only peaks above 10% relative abundance, is approximately 12–14 peaks.
- Assuming all the peaks are peptides, does the number of peaks match the number of peptides predicted from question 2 above? Are there more peaks in the chromatogram or fewer?
Ans: The predicted number of peptides from tryptic digestion is 19 peptides (based on PeptideMass with filtering). The observed number of chromatographic peaks is similar but slightly lower or comparable.
This difference arises because:
Some peptides may not ionize efficiently
Very small or hydrophilic peptides may not be detected
Some peptides may co-elute
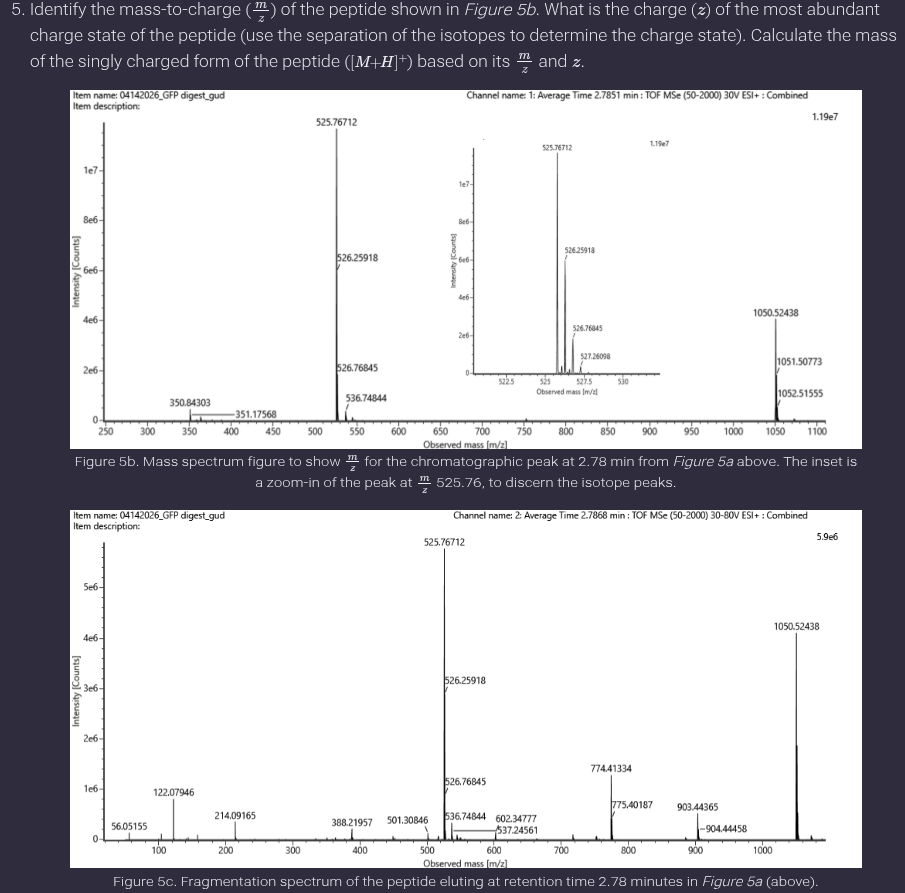
Ans: Charge state and peptide mass
The isotopic peak spacing for the peptide at 2.78 minutes is approximately 0.5 m/z, giving:
𝑧=1/0.5 = 2
Thus, the charge state is +2.
Using:
MW=z(m/z)−z
MW=2×526.27−2.0146 = 1050.525 Da
Therefore, the peptide has:
Charge state (z) = +2
Molecular weight ≈ 1050.5 Da
- Identify the peptide based on comparison to expected masses in the PeptideMass tool. What is mass accuracy of measurement? Please calculate the error in ppm. (Recall that Accuracy from part I)
Ans: Peptide Identification
The peptide is FEGDTLVNR with theoretical mass 1050.5214 Da.
The mass accuracy was calculated using:
1050.525−1050.5214 / 1050.5214 × 10 ^ 6 = 0.0036 / 1050.5214 × 10 ^ 6 ≈3.4ppm
- What is the percentage of the sequence that is confirmed by peptide mapping? (see Figure 6)
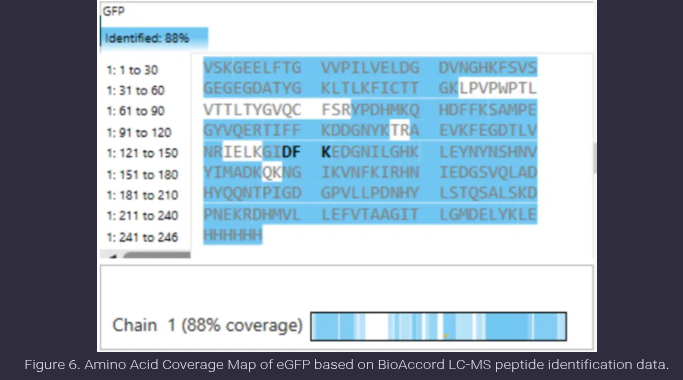
Ans: Peptide mapping confirms 88% of the eGFP sequence, as indicated in Figure 6. This value represents the proportion of the protein sequence that is covered by experimentally identified peptides in the LC-MS analysis. The highlighted regions correspond to detected peptides, while the unhighlighted regions indicate portions of the sequence that were not observed, likely due to limitations such as poor ionization or peptide size. This high coverage suggests successful and reliable protein identification.
Bonus Peptide Map Questions
- Can you determine the peptide sequence for the peptide fragmentation spectrum shown in Figure 5c? (HINT: Use your results from Question 2 above to match the peptide molecular weight that is closest to that shown in Figure 5b. Copy and paste its sequence into this tool online to predict the fragmentation pattern based on its amino acid sequence: http://db.systemsbiology.net/proteomicsToolkit/FragIonServlet.html. What is the sequence of the eGFP peptide that best matches the fragmentation spectrum in Figure 5c?
Ans: The peptide sequence that best matches the fragmentation spectrum in Figure 5c is FEGDTLVNR.This identification is based on matching the experimentally determined molecular weight (~1050.5 Da) with the theoretical peptide masses from the PeptideMass tool. The peptide FEGDTLVNR (1050.5214 Da) shows the closest agreement.
- Does the peptide map data make sense, i.e. do the results indicate the protein is the eGFP standard? Why or why not? Consult with Figure 6, which depicts the % amino acid coverage of peptides positively identified using their calculated mass and fragmentation pattern.
Ans: Yes, the peptide map data is consistent with the protein being the eGFP standard. Figure 6 shows approximately 88% amino acid sequence coverage, indicating that a large majority of the protein sequence has been experimentally confirmed through peptide identification. Additionally, multiple peptides across different regions of the sequence were identified and validated using both mass measurements and fragmentation patterns, providing strong evidence for correct protein identification. The remaining 12% of the sequence not covered is likely due to typical limitations such as poor ionization or peptide detectability and does not significantly affect the confidence of identification. Therefore, the results strongly support that the protein analyzed is eGFP.
Homework: Waters Part IV — Oligomers
We will determine Keyhole Limpet Hemocyanin (KLH)’s oligomeric states using charge detection mass spectrometry (CDMS). CDMS single-particle measurements of KLH allow us to make direct mass measurements to determine what oligomeric states (that is, how many protein subunits combine) are present in solution. Using the known masses of the polypeptide subunits (Table 1) for KLH, identify where the following oligomeric species are on the spectrum shown below from the CDMS (Figure 7):
7FU Decamer 8FU Didecamer 8FU 3-Decamer 8FU 4-Decamer
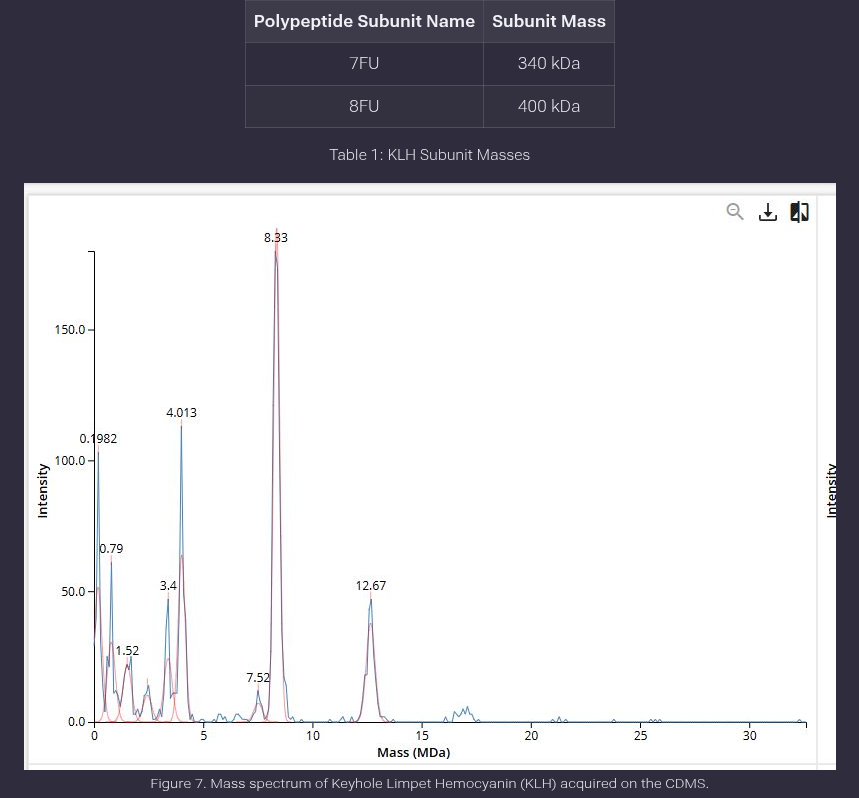
Ans: To identify the oligomeric species of Keyhole Limpet Hemocyanin (KLH) on the provided CDMS spectrum, we calculate the expected mass of each assembly and correlate it with the experimental peaks shown in Figure 7.Theoretical Mass CalculationsSince the x-axis of the spectrum is in Megadaltons (MDa) and the subunit masses are in kilodaltons (kDa), we use the conversion 1,000 kDa = 1 MDa
| Oligomeric Species | Composition | Calculation | Theoretical Mass |
|---|---|---|---|
| 7FU Decamer | 10 × 7FU subunits | 10 × 340 kDa | 3.40 MDa |
| 8FU Didecamer | 20 × 8FU subunits | 20 × 400 kDa | 8.00 MDa |
| 8FU 3-Decamer | 30 × 8FU subunits | 30 × 400 kDa | 12.00 MDa |
| 8FU 4-Decamer | 40 × 8FU subunits | 40 × 400 kDa | 16.00 MDa |
Species Identification on Spectrum (Figure 7) Based on the calculations above, the oligomeric species correspond to the following peaks labeled in the mass spectrum:
7FU Decamer: Assigned to the peak at 3.4 MDa. This matches the theoretical calculation exactly.
8FU Didecamer: Assigned to the highest intensity peak at 8.33 MDa. The slight shift from 8.00 MDa to 8.33 MDa is attributed to native glycosylation and adducts common in large KLH proteins.
8FU 3-Decamer: Assigned to the peak at 12.67 MDa. This represents the assembly of 30 8FU subunits
8FU 4-Decamer: Assigned to the low-intensity cluster of peaks between 16.00 and 17.00 MDa. This corresponds to the 40-subunit assembly.
Homework: Waters Part V — Did I make GFP?
Please fill out this table with the data you acquired from the lab work done at the Waters Immerse Lab in Cambridge, or else the data screenshots in this document if you were unable to have lab work done at Waters.
| Theoretical (kDa) | Observed /Measured on Intact LC-MS (kDa) | PPM Mass Error |
|---|---|---|
| 28.0066 | 27.960 | -1664 ppm |
The relatively high ppm error is due to approximate peak selection and lack of deconvolution in intact protein analysis.
Calculations:
Theoretical MW (from sequence )
28,006.60 Da = 28.0066 kDa
Observed MW (from LC-MS intact protein)
From your earlier intact MS calculation:
≈ 27,960 Da = 27.960 kDa
PPM error calculation
Formula:
PPM = 𝑀𝑊𝑜𝑏𝑠 − 𝑀𝑊𝑡ℎ𝑒𝑜𝑟𝑦 / 𝑀𝑊𝑡ℎ𝑒𝑜𝑟𝑦 × 10 ^ 6
PPM = 27960 −28006.60 / 28006.60 × 10^6
≈−1664ppm