Week 10 — Advanced Imaging & Measurement Technology
This lecture presents a range of advanced technologies to do precision measurement of proteins at atomic scales, characterizing chemical composition, and detecting protein sequence and structure.
Lecture (Tues, Apr 7)
Advanced Imaging & Measurement Tech
(▶️Recording)
Evan Daugharthy, Lindsay Morrison.
Recitation (Wed, Apr 8)
Mass spectrometry
(▶️Recording | 💻Slides)
Waters Corp. Team
Homework - DUE BY START OF Apr 14 LECTURE
Homework is partly based on data that will be generated in the Waters Immerse Lab in Cambridge, MA. Students will characterize green fluorescent protein (eGFP, a recombinant protein standard) structure (primary, secondary/tertiary) in the lab using liquid chromatography and mass spectrometry, as well as Keyhole Limpet Hemocyanin (KLH) oligomeric states using charge detection mass spectrometry (CDMS). Data generated in the lab needed to do the homework is included both within this document and in the Appendix of the laboratory protocol.
Homework: Final Project
Assignees for the following sections
| MIT/Harvard students | Required |
| Committed Listeners | Required |
For your final project:
- Please identify at least one (ideally many) aspect(s) of your project that you will measure. It could be the mass or sequence of a protein, the presence, absence, or quantity of a biomarker, etc.
- Please describe all of the elements you would like to measure, and furthermore describe how you will perform these measurements.
- What are the technologies you will use (e.g., gel electrophoresis, DNA sequencing, mass spectrometry, etc.)? Describe in detail.
I will measure both enzyme expression and activity in the paclitaxel biosynthesis pathway, focusing on CYP725A4. The aim is to confirm that the enzyme is successfully expressed and that it is functionally active in producing the desired product.
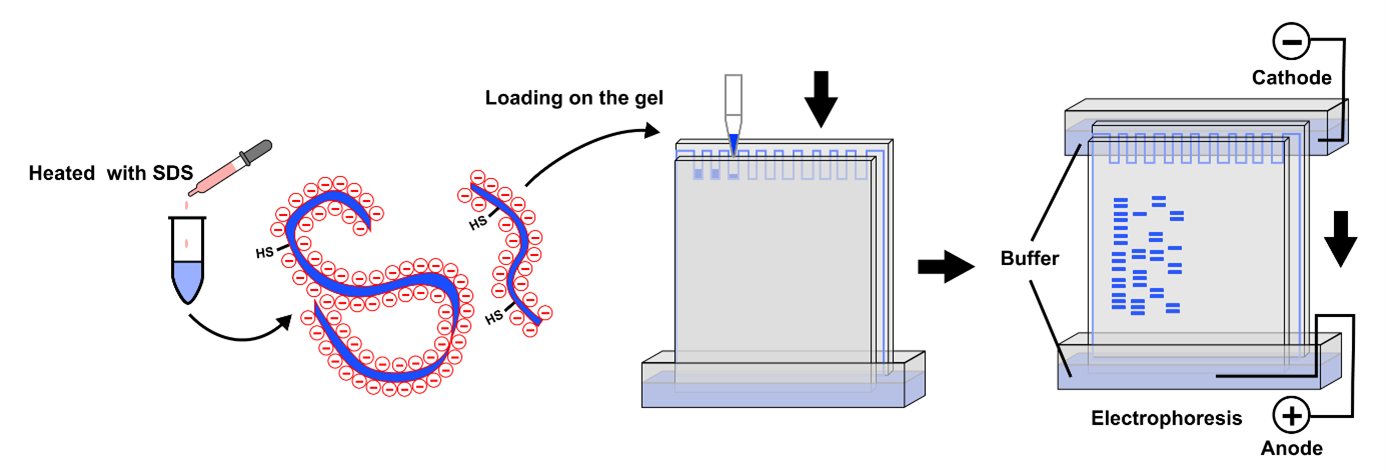
Protein expression will first be analysed using SDS‑PAGE, a simple and low-cost technique that separates proteins based on size. This allows me to confirm that a protein is present at the expected molecular weight and gives a rough indication of expression level. If more specific confirmation is required, a Western blot can be used to selectively detect the target protein using an antibody.
To evaluate enzyme activity, I will use LC‑MS to detect and quantify small molecule products such as taxadien‑5α‑ol. This method provides high sensitivity and accuracy, allowing me to confirm that the enzyme is producing the correct product.
Overall, this approach combines low-cost methods for initial validation with more precise analytical techniques for functional characterization.
Homework: Waters Part I - Molecular Weight
Assignees for the following sections
| MIT/Harvard students | Required |
| Committed Listeners | Required |
We will analyze an eGFP standard on a Waters Xevo G3 QTof MS system to determine the molecular weight of intact eGFP and observe its charge state distribution in the native and denatured (unfolded) states. The conditions for LC-MS analysis of intact protein cause it to unfold and be detected in its denatured form (due to the solvents and pH used for analysis).
Based on the predicted amino acid sequence of eGFP (see below) and any known modifications, what is the calculated molecular weight? You can use an online calculator like the one at https://web.expasy.org/compute_pi/
eGFP Sequence:
MVSKGEELFTG VVPILVELDG DVNGHKFSVS GEGEGDATYG KLTLKFICTT GKLPVPWPTL VTTLTYGVQC FSRYPDHMKQ HDFFKSAMPE GYVQERTIFF KDDGNYKTRA EVKFEGDTLV NRIELKGIDF KEDGNILGHK LEYNYNSHNV YIMADKQKNG IKVNFKIRHN IEDGSVQLAD HYQQNTPIGD GPVLLPDNHY LSTQSALSKD PNEKRDHMVL LEFVTAAGIT LGMDELYKLE HHHHHH
Note: This contains a His-purification tag (HHHHHH) and a linker (theLEbefore it).

Sequence used:MVSKGEELFTGVVPILVELDGDVNGHKFSVSGEGEGDATYGKLTLKFICTTGKLPVPWPTLVTTLTYGVQCFSRYPDHMKQHDFFKSAMPEGYVQERTIFFKDDGNYKTRAEVKFEGDTLVNRIELKGIDFKEDGNILGHKLEYNYNSHNVYIMADKQKNGIKVNFKIRHNIEDGSVQLADHYQQNTPIGDGPVLLPDNHYLSTQSALSKDPNEKRDHMVLLEFVTAAGITLGMDELYKLEHHHHHH
The calculated molecular weight of eGFP including the His-tag is approximately
Without his tag Theoretical pI/Mw: 5.58 / 26941.48
With his tag Theoretical pI/Mw: 5.90 / 28006.60
Calculate the molecular weight of the eGFP using the adjacent charge state approach described in the recitation. Select two charge states from the intact LC-MS data and:
Determine z for each adjacent pair of peaks (n, n+1) using:
z = (m/z)_(n+1) / ((m/z)_(n+1) - (m/z)_n)Determine the MW of the protein using the relationship between (m/z)_n, MW, and z
Calculate the accuracy of the measurement using the deconvoluted MW from 2.2 and the predicted weight of the protein from 2.1 using:
Accuracy = |MW_experiment - MW_theory| / MW_theory
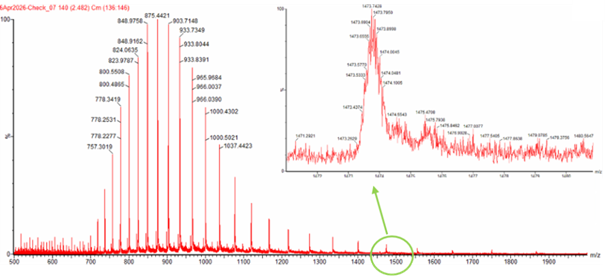
Two adjacent peaks from the spectrum were selected:
(m/z)_n = 903.7148 and (m/z)_(n+1) = 933.7349
The charge state was calculated using:
z = (m/z)_(n+1) / ((m/z)_(n+1) - (m/z)_n)
z = 933.7349 / (933.7349 - 903.7148) = 933.7349 / 30.0201 ≈ 31
The molecular weight was then calculated using:
MW = z × ((m/z)_n - 1)
MW = 31 × (903.7148 - 1) = 31 × 902.7148 ≈ 27,984 Da
The molecular weight of eGFP is approximately 28.0 kDa.
- Calculate the accuracy of the measurement.
Using the theoretical molecular weight (~27,800 Da):
Accuracy = |MW_experiment - MW_theory| / MW_theory
= |27,984 - 27,800| / 27,800 = 184 / 27,800 ≈ 0.0066
The measurement accuracy is approximately 0.66%.
- Can you observe the charge state for the zoomed-in peak in the mass spectrum for the intact eGFP? If yes, what is it? If no, why not?
The charge state cannot be clearly determined from the zoomed-in peak because the isotope peaks are not fully resolved and overlap with each other. This makes it difficult to measure the spacing between peaks, which is required to calculate the charge state accurately.
Homework: Waters Part II - Secondary/Tertiary structure
Assignees for the following sections
| MIT/Harvard students | Optional but highly recommended |
| Committed Listeners | Optional but highly recommended |
We will analyze eGFP in its native, folded state and compare it to its denatured, unfolded state on a quadrupole time-of-flight MS. We will be doing MS-only analysis (no liquid chromatography, also known as “direct infusion” experiments) on the Waters Xevo G3-QToF MS.
- Based on learnings in the lab, please explain the difference between native and denatured protein conformations. For example, what happens when a protein unfolds? How is that determined with a mass spectrometer? What changes do you see in the mass spectrum between the native and denatured protein analyses?
A native protein is folded into its compact, functional structure, while a denatured protein is unfolded due to changes in solvent or pH. When the protein unfolds, more charged residues become exposed, increasing the number of charges it can carry.
In mass spectrometry, denatured proteins show a broader distribution of higher charge states, while native proteins show fewer peaks at lower charge states due to their compact structure.
- Zooming into the native mass spectrum of eGFP from the Waters Xevo G3 QTof MS, can you discern the charge state of the peak at ~2800 m/z? What is the charge state? How can you tell?
From Figure 3, the zoomed inset shows isotope peaks spaced by approximately ~0.125 m/z.
Using:
z ≈ 1 / spacing
z ≈ 1 / 0.125 ≈ 8
The charge state is approximately +8.
Homework: Waters Part III - Peptide Mapping - primary structure
Assignees for the following sections
| MIT/Harvard students | Required |
| Committed Listeners | Required |
We will digest the eGFP protein standard into peptides using trypsin (an enzyme that selectively cleaves the peptide bond after Lysine (K) and Arginine (R) residues. The resulting peptides will be analyzed on the Waters BioAccord LC-MS to measure their molecular weights and fragmented to confirm the amino acid sequence within each peptide – generating a “peptide map”. This process is used to confirm the primary structure of the protein.
There are a variety of tools available online to calculate protein molecular weight and predict a list of peptides generated from a tryptic digest. We will be using tools within the online resource Expasy (the bioinformatics resource portal of the Swiss Institute of Bioinformatics (SIB)) to predict a list of tryptic peptides from eGFP.
- How many Lysines (K) and Arginines (R) are in eGFP? Please circle or highlight them in the eGFP sequence given in Waters Part I question 1 above. (Note: adding the sequence to Benchling as an amino acid file and clicking biochemical properties tab will show you a count for each amino acid).
Sequence used with Lysines (K) and Arginines (R) highlighted:
MVSKGEELFTG VVPILVELDG DVNGHKFSVS GEGEGDATYG KLTLKFICTT GKLPVPWPTL VTTLTYGVQC FSRYPDHMKQ HDFFKSAMPE GYVQERTIFF KDDGNYKTRA EVKFEGDTLV NRIELKGIDF KEDGNILGHK LEYNYNSHNV YIMADKQKNG IKVNFKIRHN IEDGSVQLAD HYQQNTPIGD GPVLLPDNHY LSTQSALSKD PNEK====RDHMVL LEFVTAAGIT LGMDELYKLE HHHHHH
From the sequence:
Lysine (K) = 20
Arginine (R) = 6
How many peptides will be generated from tryptic digestion of eGFP?
- Navigate to https://web.expasy.org/peptide_mass/
- Copy/paste the sequence above into the input box in the PeptideMass tool to generate expected list of peptides.
- Use the relevant parameters to predict peptides from eGFP.
- Click “Perform the Cleavage” button in the PeptideMass tool and report the number of peptides generated when using trypsin to perform the digest.
Trypsin cleaves after lysine (K) and arginine (R) residues.
Estimated number of peptides:
(K + R) + 1 = 28
Approximately 28 peptides are expected, assuming no missed cleavages.
- Based on the LC-MS data for the peptide map data generated in lab, how many chromatographic peaks do you see in the eGFP peptide map between 0.5 and 6 minutes? You may count all peaks that are >10% relative abundance.
From Figure 5a, approximately 20 peaks above the threshold are observed.
- Assuming all the peaks are peptides, does the number of peaks match the number of peptides predicted from question 2 above? Are there more peaks in the chromatogram or fewer?
No, the observed number of peaks is lower than the predicted number of peptides. This may be due to incomplete digestion, co-elution of peptides, or detection limits.
- Identify the mass-to-charge (m/z) of the peptide shown in Figure 5b. What is the charge (z) of the most abundant charge state of the peptide (use the separation of the isotopes to determine the charge state). Calculate the mass of the singly charged form of the peptide ([M+H]+) based on its m/z and z.
From the spectrum:m/z ≈ 525.76Isotope spacing ≈ 0.5 → z ≈ 2
M = (m/z × z) - z
M ≈ (525.76 × 2) - 2 ≈ 1049.5 Da
The peptide mass is approximately 1049 Da.
Predicted tryptic peptides of eGFP (Expasy PeptideMass)
| Mass (Da) | Position | Peptide Sequence |
|---|---|---|
| 4472.18 | 170–210 | HNIEDGSVQLADHYQQNTPIGDGPVLLPDNHYLSTQSALSK |
| 2566.29 | 217–239 | DHMVLLEFVTAAGITLGMDELYK |
| 2437.26 | 5–27 | GEELFTGVVPILVELDGDVNGHK |
| 2378.26 | 54–74 | LPVPWPTLVTTLTYGVQCFSR |
| 1973.91 | 142–157 | LEYNYNSHNVYIMADK |
| 1503.66 | 28–42 | FSVSGEGEGDATYGK |
| 1266.58 | 87–97 | SAMPEGYVQER |
| 1083.50 | 240–247 | LEHHHHHH |
| 1050.52 | 115–123 | FEGDTLVNR |
| 982.50 | 133–141 | EDGNILGHK |
| 821.39 | 81–86 | QHDFFK |
| 790.36 | 75–80 | YPDHMK |
| 769.39 | 47–53 | FICTTGK |
| 711.29 | 103–108 | DDGNYK |
| 655.38 | 98–102 | TIFFK |
| 602.28 | 211–215 | DPNEK |
| 579.31 | 128–132 | GIDFK |
| 507.29 | 164–167 | VNFK |
| 502.32 | 124–127 | IELK |
- Identify the peptide based on comparison to expected masses in the PeptideMass tool. What is mass accuracy of measurement? Please calculate the error in ppm.
Recall that:
Accuracy = |MW_experiment - MW_theory| / MW_theory
From Figure 5b:m/z ≈ 525.76z = 2
M ≈ (525.76 × 2) - 2 ≈ 1049.5 Da
Closest match from Expasy:
Peptide: FEGDTLVNR
Theoretical mass = 1050.52 Da
Error (ppm) = ((1049.5 - 1050.52) / 1050.52) × 10^6 ≈ -970 ppm
Accuracy = |27,984 - 27,988.96| / 27,988.96 ≈ 0.00018
The identified peptide matches FEGDTLVNR, with a peptide mass error of approximately −970 ppm and overall protein accuracy of ~0.018%.
- What is the percentage of the sequence that is confirmed by peptide mapping?
From Expasy:
90.7% coverage
From Figure 6:
~88% coverage
The peptide mapping confirms approximately 88–91% of the sequence, indicating strong agreement with the expected eGFP structure.
Homework: Waters Part IV - Oligomers
Assignees for the following sections
| MIT/Harvard students | Required |
| Committed Listeners | Required |
We will determine Keyhole Limpet Hemocyanin (KLH)’s oligomeric states using charge detection mass spectrometry (CDMS).
CDMS single-particle measurements of KLH allow us to make direct mass measurements to determine what oligomeric states (that is, how many protein subunits combine) are present in solution. Using the known masses of the polypeptide subunits (Table 1) for KLH, identify where the following oligomeric species are on the spectrum shown below from the CDMS:
- 7FU Decamer
- 8FU Didecamer
- 8FU 3-Decamer
- 8FU 4-Decamer
| Polypeptide Subunit Name | Subunit Mass |
|---|---|
| 7FU | 340 kDa |
| 8FU | 400 kDa |
Given subunits:
7FU = 340 kDa
8FU = 400 kDa
Calculated oligomers:
7FU decamer = 3.4 MDa
8FU didecamer = 8.0 MDa
8FU 3-decamer = 12.0 MDa
8FU 4-decamer = 16.0 MDa
From Figure 7:
Peak at ~3.4 MDa matches the 7FU decamer
Peak at ~8.33 MDa matches the 8FU didecamer
Peak at ~12.67 MDa matches the 8FU 3-decamer
These peaks align closely with the expected masses of the oligomeric assemblies, indicating that the protein forms higher-order structures in solution. The presence of multiple distinct peaks suggests a mixture of oligomeric states rather than a single uniform complex. Overall, the data is consistent with known behaviour of KLH, which is known to form large, multimeric assemblies.
Homework: Waters Part V - Did I make GFP?
Assignees for the following sections
| MIT/Harvard students | Required |
| Committed Listeners | Required |
Please fill out this table with the data you acquired from the lab work done at the Waters Immerse Lab in Cambridge, or else the data screenshots in this document if you were unable to have lab work done at Waters. Since I am a Committed Listener and did not perform the experiment myself, I used the intact LC-MS data provided in the homework document/screenshots.
| Theoretical | Observed/measured on the Intact LC-MS | PPM Mass Error | |
|---|---|---|---|
| Molecular weight (kDa) | 28.0066 | 27.984 | -807 ppm |