Week 10 HW: Imaging and Measurment
Please identify at least one (ideally many) aspect(s) of your project that you will measure. It could be the mass or sequence of a protein, the presence, absence, or quantity of a biomarker, etc // Please describe all of the elements you would like to measure, and furthermore describe how you will perform these measurements. What are the technologies you will use (e.g., gel electrophoresis, DNA sequencing, mass spectrometry, etc.)? Describe in detail.
There are many aspects of my project that will need to be measured. I will need to confirm amplification and expression of my gene(s). If pigment is yielded, I will need to measure how much pigment per cell is produced and the saturation of that pigment. The technologies I would use to measure the aspects stated above would be polymerase chain reaction, gel electrophoresis, OD600, and Absorbance spectroscopy.
Possible technologies considering alternative methodologies and designs:
Plate reading, fluoresence Image J measurement for GFP-MAPPING strategy used in the literature.
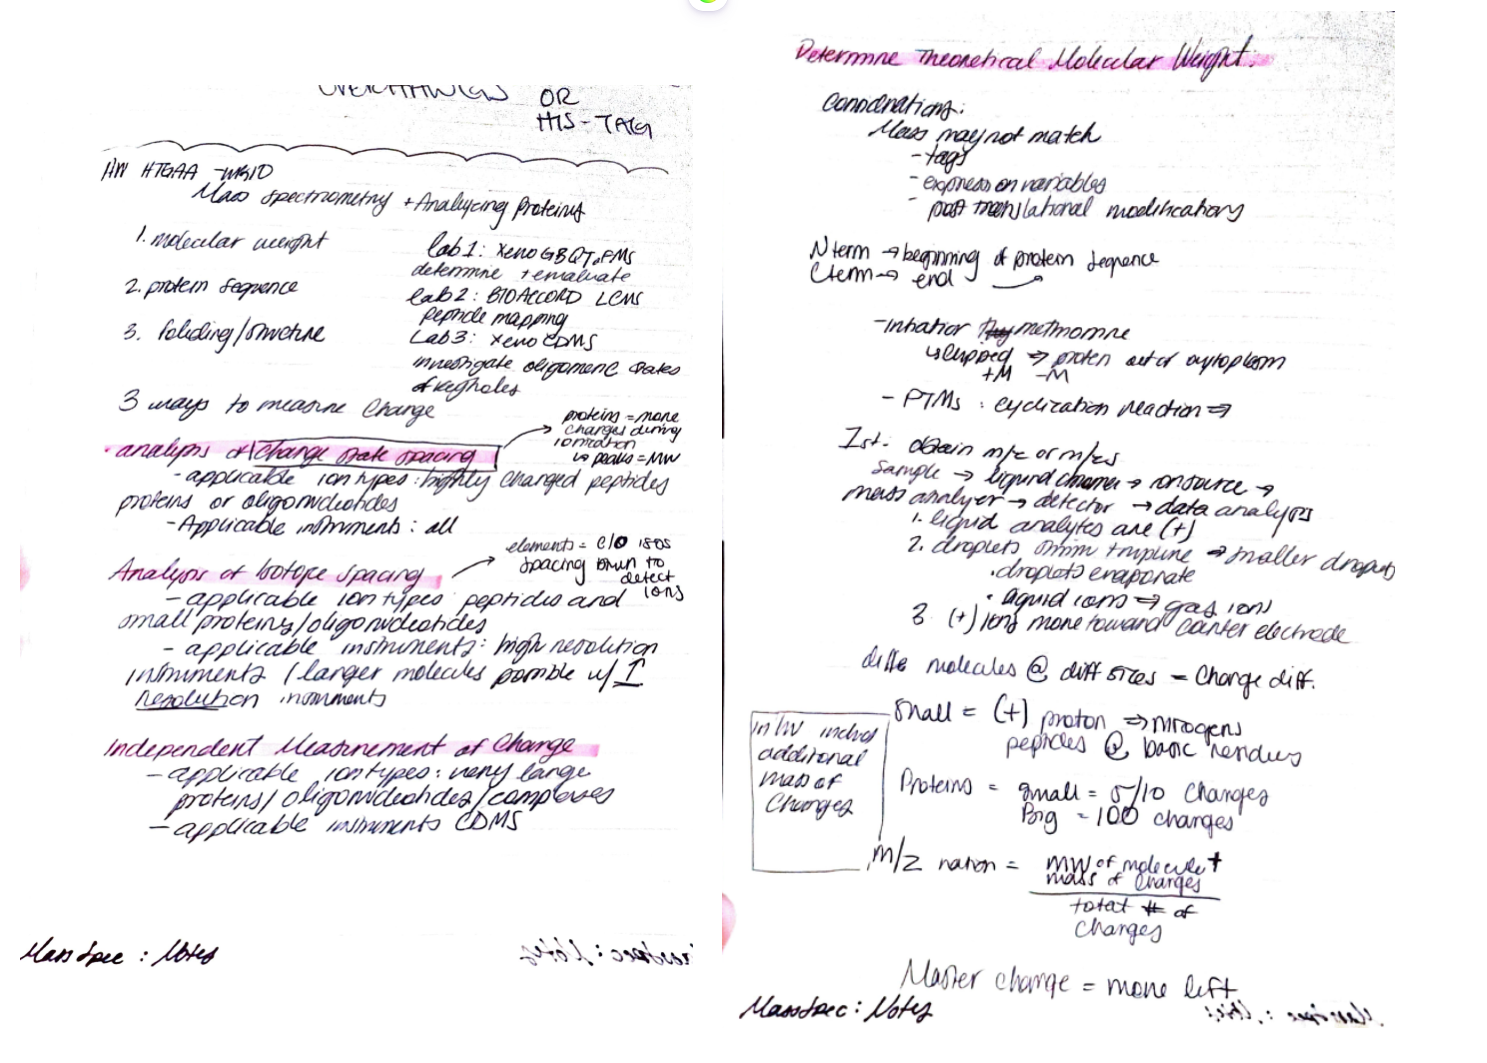
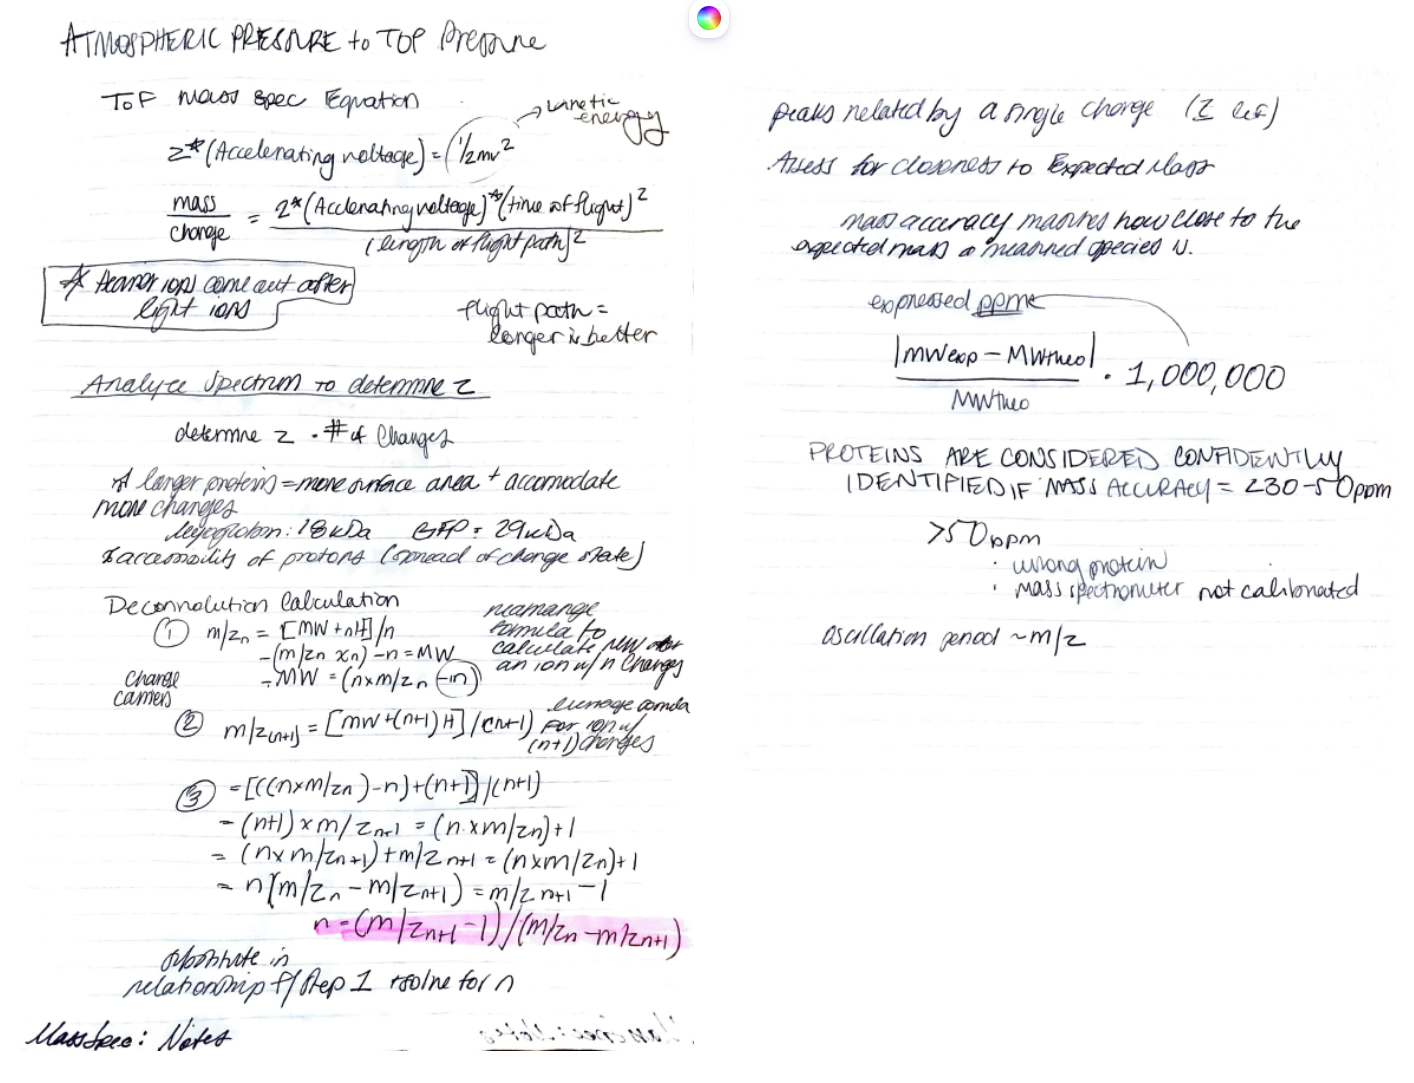
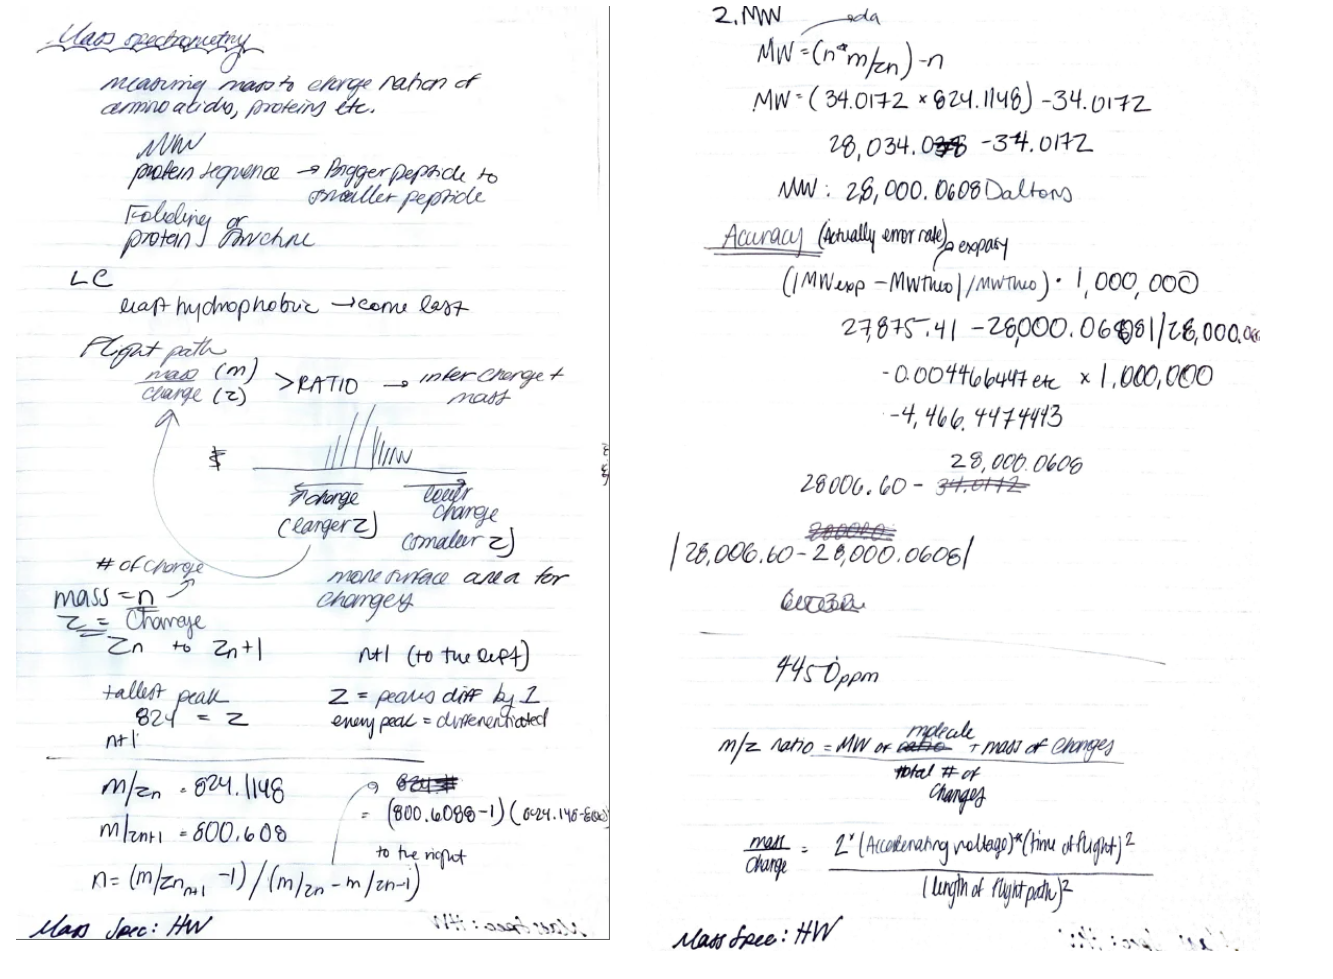
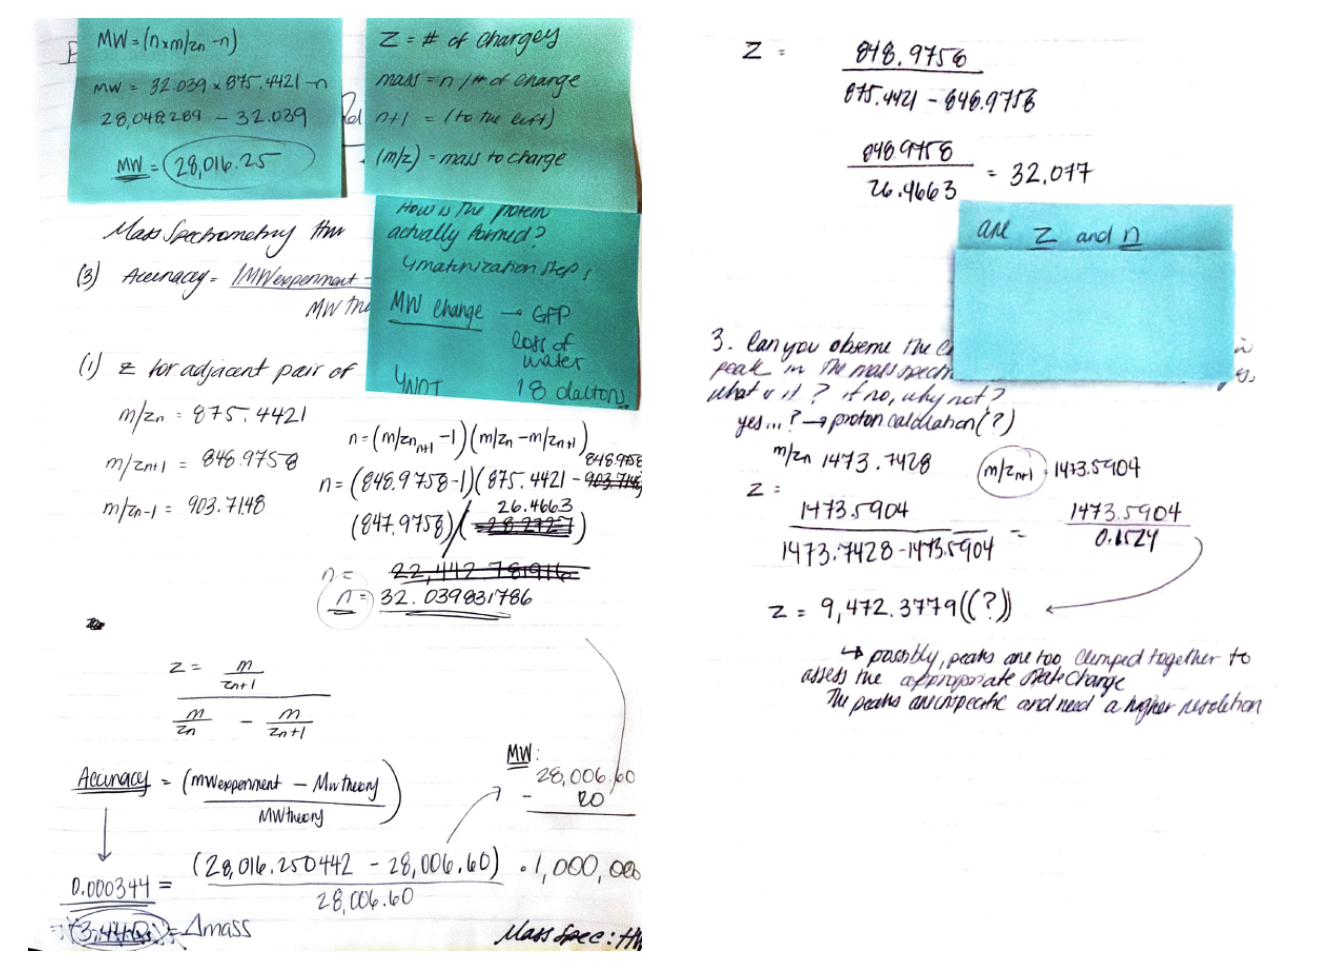
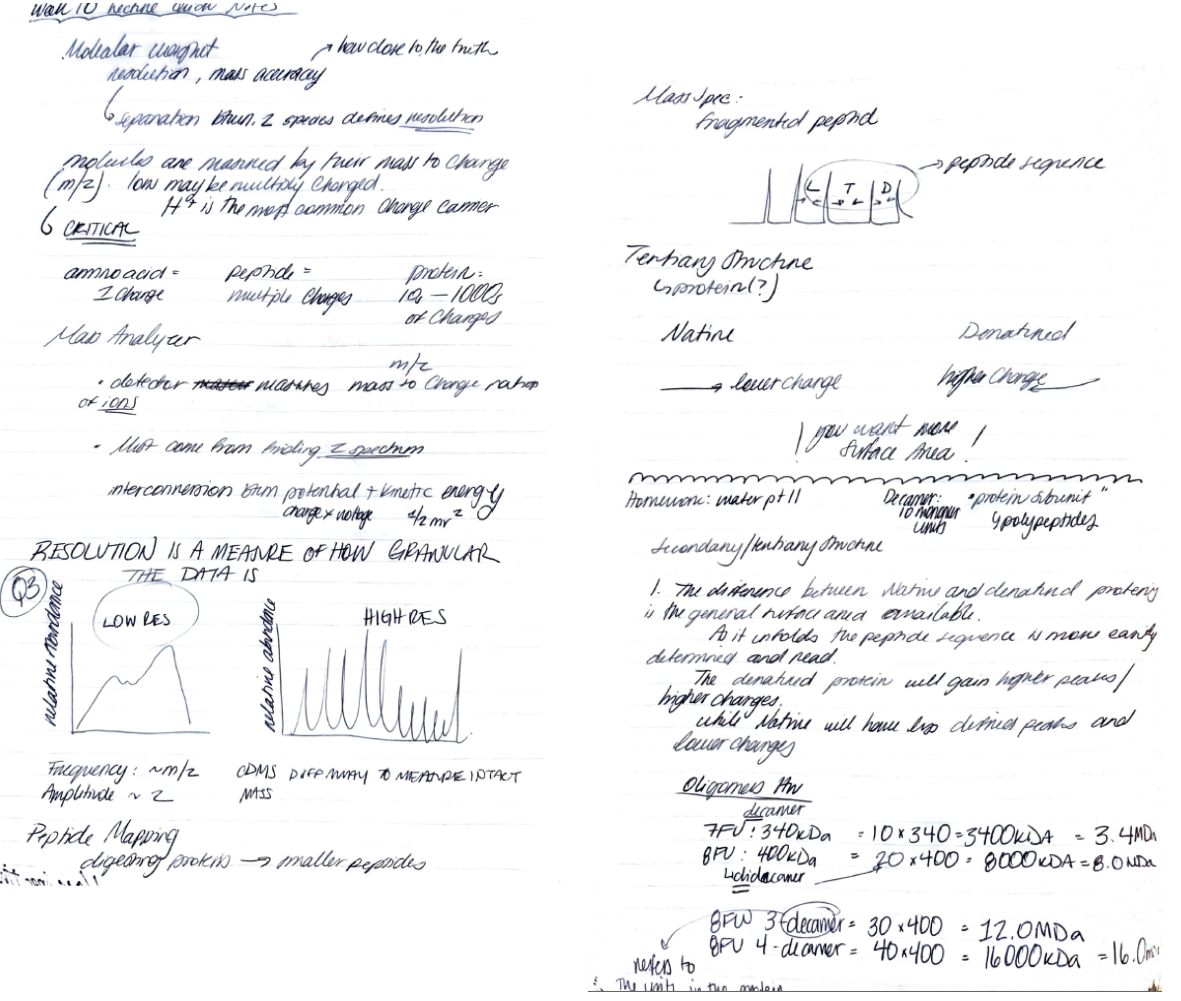
I did a majority of homework in my lab notebook and have uploaded the images of those pages down below.
We will analyze an eGFP standard on a Waters Xevo G3 QTof MS system to determine the molecular weight of intact eGFP and observe its charge state distribution in the native and denatured (unfolded) states. The conditions for LC-MS analysis of intact protein cause it to unfold and be detected in its denatured form (due to the solvents and pH used for analysis).
Based on the predicted amino acid sequence of eGFP (see below) and any known modifications, what is the calculated molecular weight? You can use an online calculator like the one at https://web.expasy.org/compute_pi/eGFP Sequence:
MVSKGEELFTG VVPILVELDG DVNGHKFSVS GEGEGDATYG KLTLKFICTT GKLPVPWPTL VTTLTYGVQC FSRYPDHMKQ HDFFKSAMPE GYVQERTIFF KDDGNYKTRA EVKFEGDTLV NRIELKGIDF KEDGNILGHK LEYNYNSHNV YIMADKQKNG IKVNFKIRHN IEDGSVQLAD HYQQNTPIGD GPVLLPDNHY LSTQSALSKD PNEKRDHMVL LEFVTAAGIT LGMDELYKLE HHHHHH
Note: This contains a His-purification tag (HHHHHH) and a linker (the LE before it).
The molecular weight of the eGFP sequence is:
Theoretical pI/Mw: 5.90 / 28006.60
Directly Shown from EXPASY:
Theoretical pI/Mw (average)
Sequence:
10 20 30 40 50 60
MVSKGEELFT GVVPILVELD GDVNGHKFSV SGEGEGDATY GKLTLKFICT TGKLPVPWPT
70 80 90 100 110 120
LVTTLTYGVQ CFSRYPDHMK QHDFFKSAMP EGYVQERTIF FKDDGNYKTR AEVKFEGDTL
130 140 150 160 170 180
VNRIELKGID FKEDGNILGH KLEYNYNSHN VYIMADKQKN GIKVNFKIRH NIEDGSVQLA
190 200 210 220 230 240
DHYQQNTPIG DGPVLLPDNH YLSTQSALSK DPNEKRDHMV LLEFVTAAGI TLGMDELYKL EHHHHHH
Theoretical pI/Mw: 5.90 / 28006.60
Without the His-tag and LE linker:
Theoretical pI/Mw (average)
Sequence:
10 20 30 40 50 60
MVSKGEELFT GVVPILVELD GDVNGHKFSV SGEGEGDATY GKLTLKFICT TGKLPVPWPT
70 80 90 100 110 120
LVTTLTYGVQ CFSRYPDHMK QHDFFKSAMP EGYVQERTIF FKDDGNYKTR AEVKFEGDTL
130 140 150 160 170 180
VNRIELKGID FKEDGNILGH KLEYNYNSHN VYIMADKQKN GIKVNFKIRH NIEDGSVQLA
190 200 210 220 230
DHYQQNTPIG DGPVLLPDNH YLSTQSALSK DPNEKRDHMV LLEFVTAAGI TLGMDELYK
Theoretical pI/Mw: 5.58 / 26941.48
Theoretical pI/Mw (average)
Sequence:
10 20 30 40 50 60
VSKGEELFTG VVPILVELDG DVNGHKFSVS GEGEGDATYG KLTLKFICTT GKLPVPWPTL
70 80 90 100 110 120
VTTLTYGVQC FSRYPDHMKQ HDFFKSAMPE GYVQERTIFF KDDGNYKTRA EVKFEGDTLV
130 140 150 160 170 180
NRIELKGIDF KEDGNILGHK LEYNYNSHNV YIMADKQKNG IKVNFKIRHN IEDGSVQLAD
190 200 210 220 230
HYQQNTPIGD GPVLLPDNHY LSTQSALSKD PNEKRDHMVL LEFVTAAGIT LGMDELYK
Theoretical pI/Mw: 5.59 / 26810.29
PEPTIDE MASS
MVSKGEELFTG VVPILVELDG DVNGHKFSVS GEGEGDATYG KLTLKFICTT GKLPVPWPTL VTTLTYGVQC FSRYPDHMKQ HDFFKSAMPE GYVQERTIFF KDDGNYKTRA EVKFEGDTLV NRIELKGIDF KEDGNILGHK LEYNYNSHNV YIMADKQKNG IKVNFKIRHN IEDGSVQLAD HYQQNTPIGD GPVLLPDNHY LSTQSALSKD PNEKRDHMVL LEFVTAAGIT LGMDELYKLE HHHHHH
20 K 6 R
How many peptides will be generated from tryptic digestion of eGFP?
Navigate to https://web.expasy.org/peptide_mass/
Copy/paste the sequence above into the input box in the PeptideMass tool to generate expected list of peptides. Use Figure 4 below as a guide for the relevant parameters to predict peptides from eGFP.
Click “Perform the Cleavage” button in the PeptideMass tool and report the number of peptides generated when using trypsin to perform the digest.
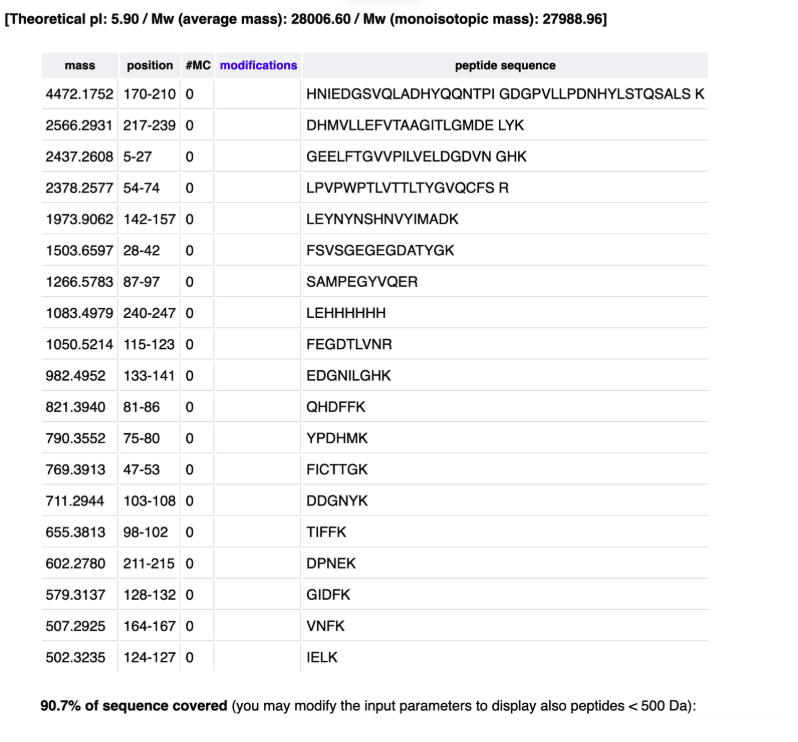
[Theoretical pI: 5.90 / Mw (average mass): 28006.60 / Mw (monoisotopic mass): 27988.96] 10 20 30 40 50 60
mvskGEELFT GVVPILVELD GDVNGHKFSV SGEGEGDATY GKltlkFICT TGKLPVPWPT
70 80 90 100 110 120
LVTTLTYGVQ CFSRYPDHMK QHDFFKSAMP EGYVQERTIF FKDDGNYKtr aevkFEGDTL
130 140 150 160 170 180
VNRIELKGID FKEDGNILGH KLEYNYNSHN VYIMADKqkn gikVNFKirH NIEDGSVQLA
190 200 210 220 230 240
DHYQQNTPIG DGPVLLPDNH YLSTQSALSK DPNEKrDHMV LLEFVTAAGI TLGMDELYKL EHHHHHH
19 PEPTIDES
Based on the LC-MS data for the Peptide Map data generated in lab (please use Figure 5a as a reference) how many chromatographic peaks do you see in the eGFP peptide map between 0.5 and 6 minutes? You may count all peaks that are >10% relative abundance.
21 PEAKS
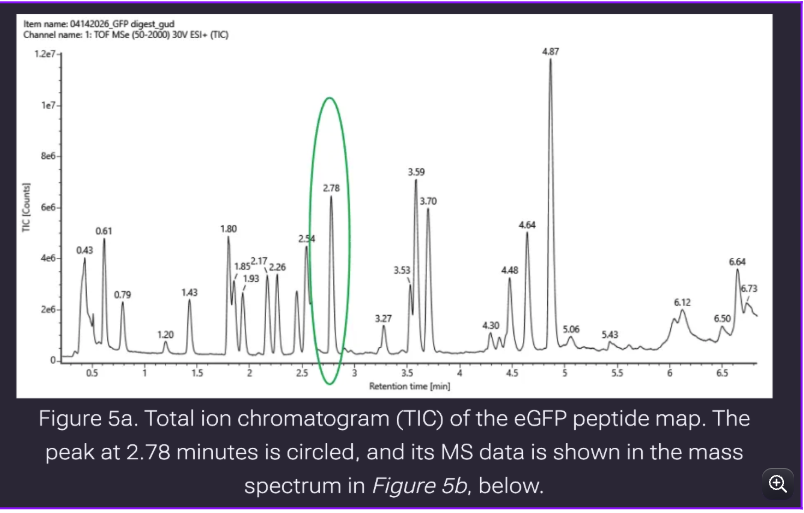
More peptides in the observed, in predicted only 19 peptides How are we classifying peaks? Perhaps 3 will not be calculated as a valid peak