Week 10 HW: Imaging and Measurement
Homework: Final Project
Please identify at least one (ideally many) aspect(s) of your project that you will measure.
R/:
I would like to measure the expression levels of mutant p53 protein across different cancer types. High accumulation of mutant p53 (due to MDM2 being unable to degrade it) would indicate a GOF mutation, making those cancers more susceptible to p53 GOF-driven oncogenesis.
Please describe all of the elements you would like to measure and how you will perform these measurements.
R/:
First, I will perform DNA sequencing to confirm the specific GOF mutation in TP53. Then, I will use Western Blot (SDS-PAGE + anti-p53 antibody detection) to quantify p53 protein levels across cancer samples. Additionally, mass spectrometry (LC-MS) will be used to confirm the exact mutant protein sequence and molecular weight.
Homework: Waters Part I — Molecular Weight
We will analyze an eGFP standard on a Waters Xevo G3 QTof MS system.
1. Theoretical Molecular Weight
eGFP Sequence
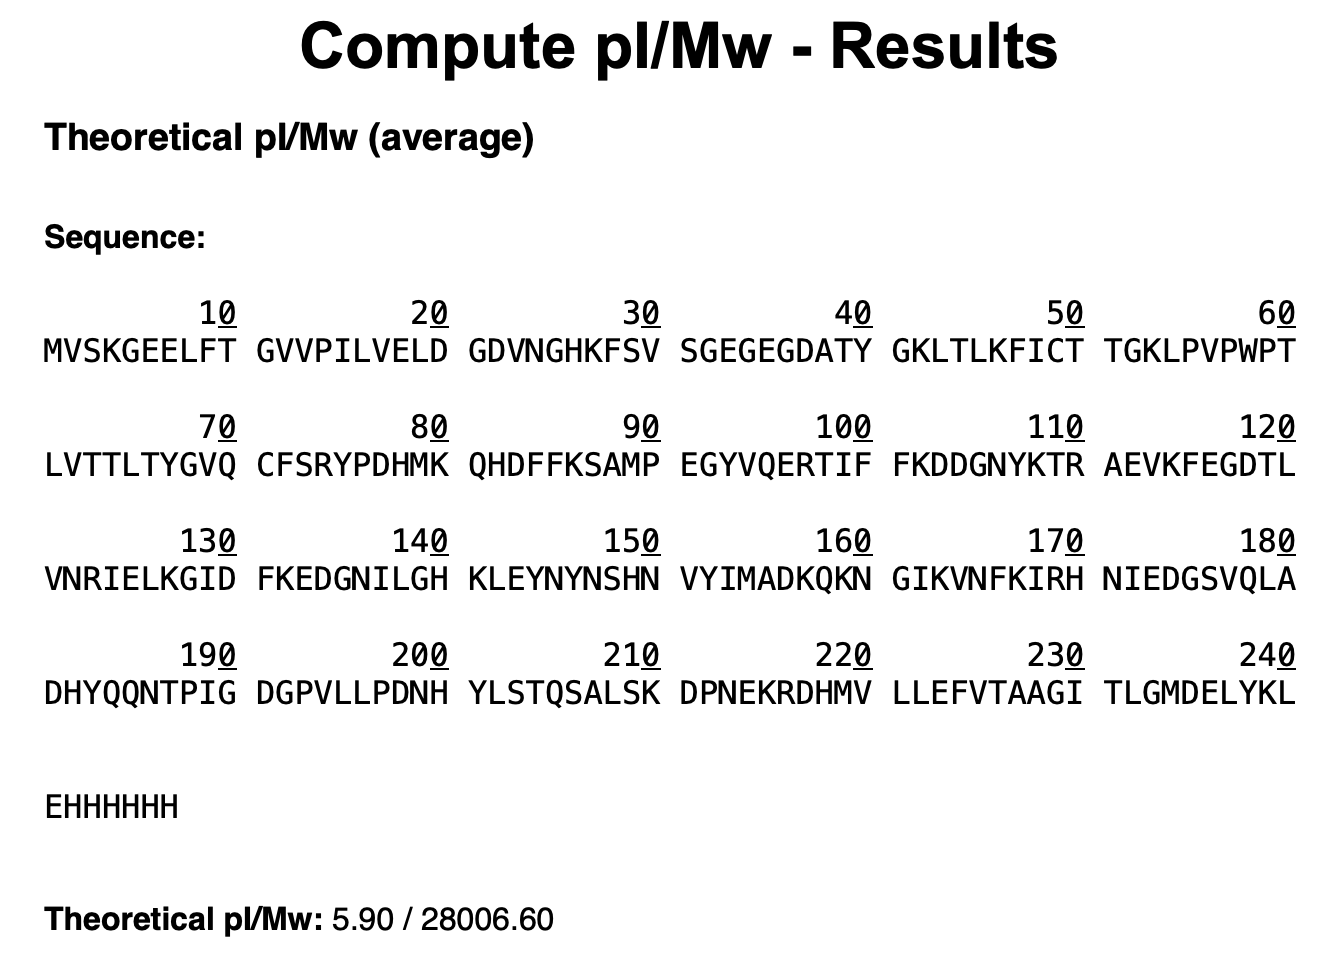
MVSKGEELFTG VVPILVELDG DVNGHKFSVS GEGEGDATYG KLTLKFICTT GKLPVPWPTL VTTLTYGVQC FSRYPDHMKQ HDFFKSAMPE GYVQERTIFF KDDGNYKTRA EVKFEGDTLV NRIELKGIDF KEDGNILGHK LEYNYNSHNV YIMADKQKNG IKVNFKIRHN IEDGSVQLAD HYQQNTPIGD GPVLLPDNHY LSTQSALSKD PNEKRDHMVL LEFVTAAGIT LGMDELYKLE HHHHHH
Note: Contains His-tag (HHHHHH) and linker (LE).
R/:
Based on ExPASy Compute pI/Mw, the theoretical molecular weight of eGFP is 28,006.60 Da (~28 kDa).
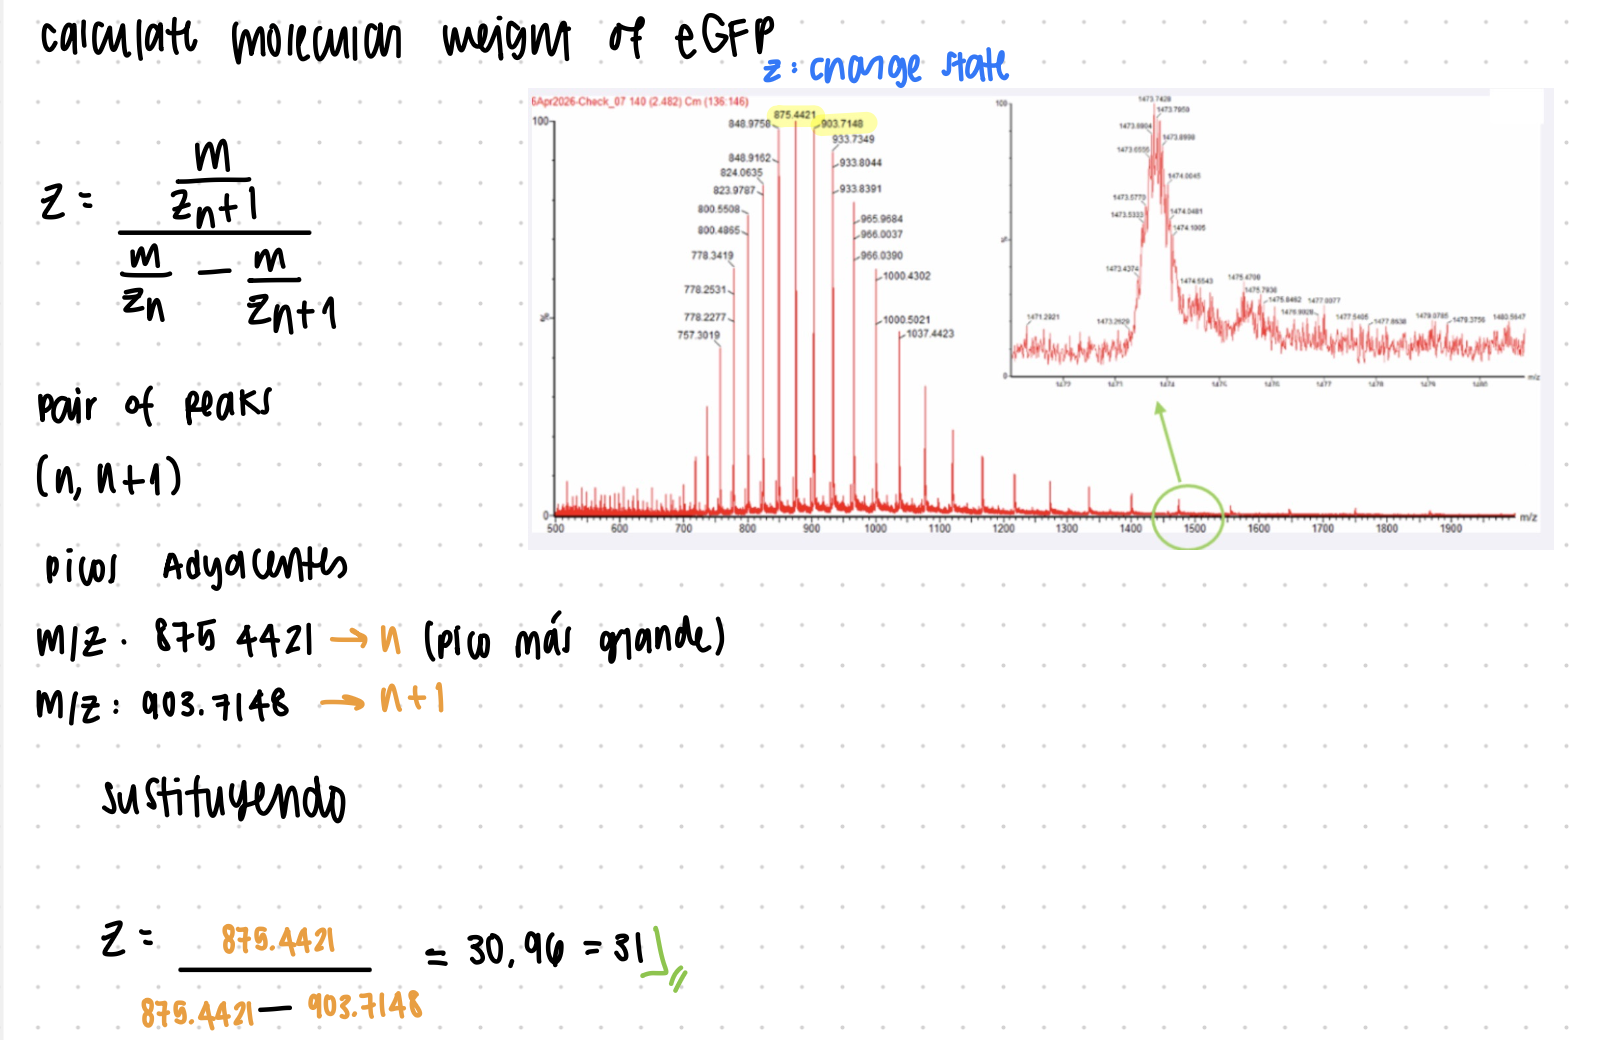
2. Molecular Weight from Charge States
Calculate MW using adjacent charge states from LC-MS (Figure 1).
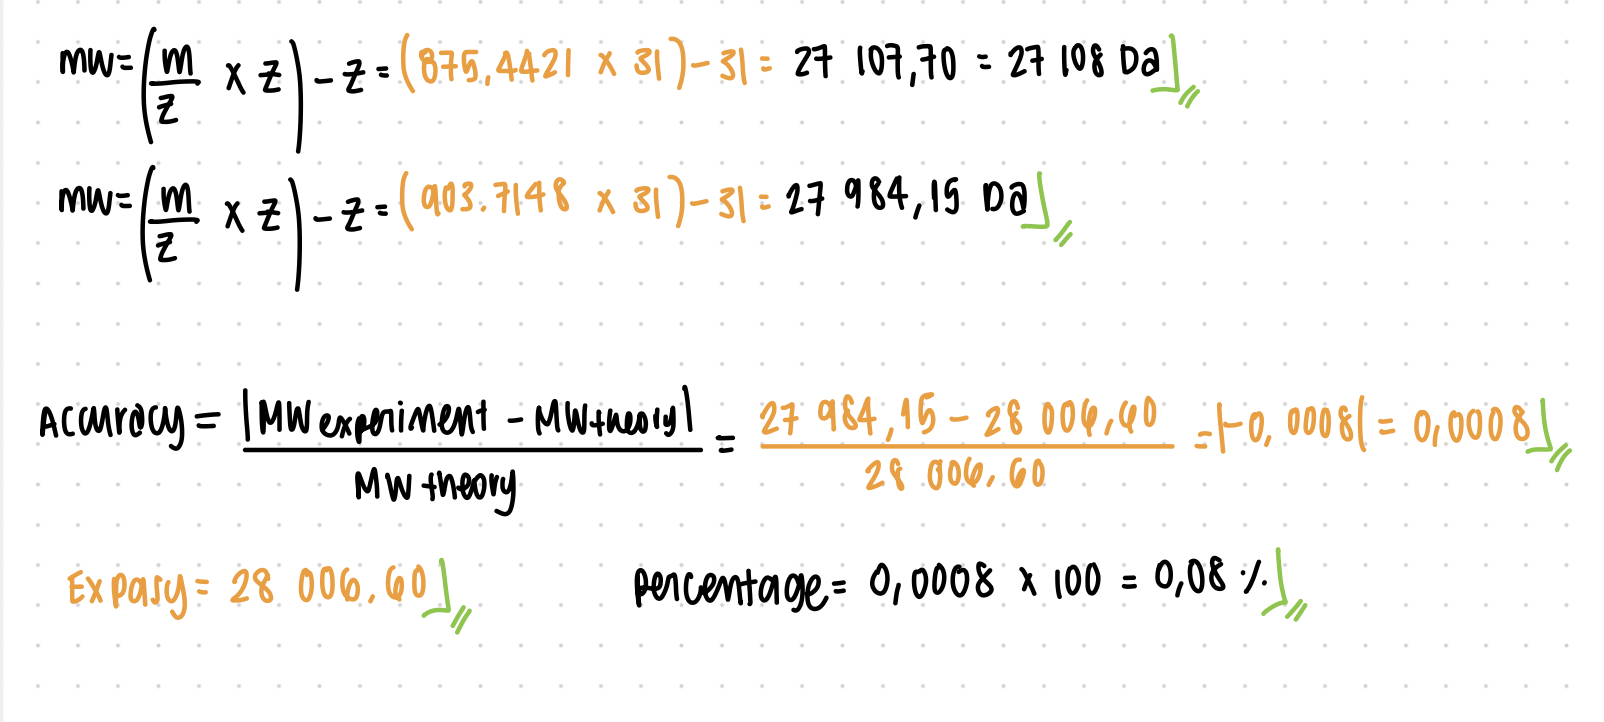
3. Accuracy Calculation
Compare deconvoluted MW vs theoretical MW.
Homework: Waters Part II — Secondary/Tertiary Structure
1. Native vs Denatured Proteins
R/:
Native proteins maintain their 3D folded structure, while denatured proteins unfold and expose more basic residues (Lys, Arg), allowing higher protonation.
In MS:
- Denatured proteins: many peaks at low m/z (high charge states)
- Native proteins: fewer peaks at high m/z (low charge states)
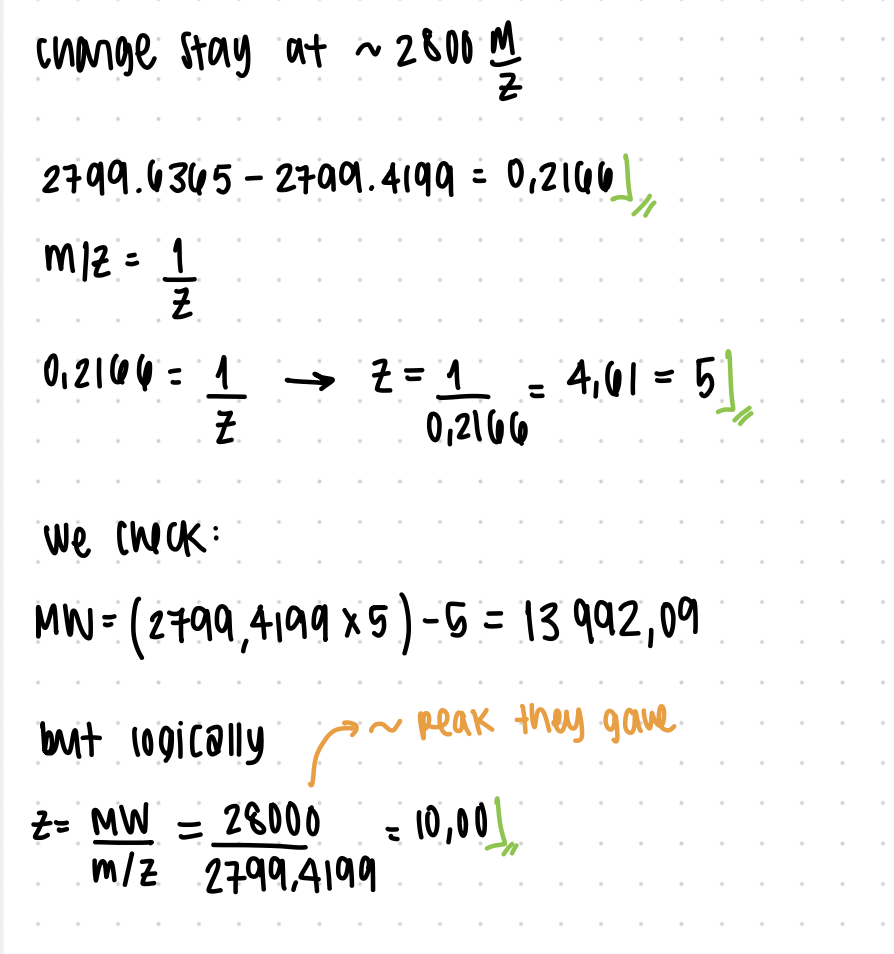
2. Charge State Determination
R/:
The peak at ~2800 m/z corresponds to z = 10.
Calculation:
z = 28,000 / 2,799.4199 ≈ 10
This low charge state is consistent with a folded (native) protein.
Homework: Waters Part III — Peptide Mapping (Primary Structure)
We digest eGFP with trypsin (cuts after K and R).
1. Lysine and Arginine Count
R/:
eGFP contains:
- 20 Lysines (K)
- 6 Arginines (R)
- Total = 26 cleavage sites
2. Number of Peptides
Steps
- Use ExPASy PeptideMass
- Input sequence
- Perform trypsin digestion
R/:
Tryptic digestion of eGFP generates 25 peptides.
3. Chromatographic Peaks in the Peptide Map
Based on the LC-MS peptide map shown in Figure 5a, approximately 22 chromatographic peaks above 10% relative abundance can be observed between 0.5 and 6 minutes.
Figure 5a shows the total ion chromatogram (TIC) of the eGFP peptide map. The peak at 2.78 minutes is circled, and its MS data is shown in Figure 5b.
4. Comparison Between Observed and Predicted Peptides
R/:
The number of peaks does not perfectly match the number of predicted peptides. There are fewer peaks observed in the chromatogram (22 peaks) than peptides predicted from tryptic digestion (25 peptides).
This could be explained by the size and behavior of some peptides. Very small peptides (<500 Da) are not retained efficiently in the LC column and may therefore not appear as distinct chromatographic peaks.
5. Identification of m/z, Charge State, and Singly Charged Mass
Part 1: Identify the m/z of the Most Abundant Charge State
Looking at Figure 5b, the tallest peak in the spectrum is located at:
m/z = 525.76712
This corresponds to the most abundant charge state of the peptide.
Part 2: Determine the Charge (z) Using Isotope Separation
In the inset (zoom-in) of Figure 5b, the isotope peaks are:
- 525.76712
- 526.25918
- 526.76845
The separation between consecutive isotope peaks is:
526.25918 − 525.76712 = 0.492 ≈ 0.5 m/z units
Because isotopes differ by approximately 1 Da in real mass, but the spectrum displays m/z, the observed separation corresponds to:
1/z
Therefore:
z = 1 / 0.5 = 2
The most abundant charge state of this peptide is:
z = 2+
Part 3: Calculate the Singly Charged Form [M+H]+
To convert from the observed m/z value (z = 2) to the singly charged mass [M+H]+, the following equation is used:
[M+H]+ = (m/z × z) − (z − 1) × 1.00728
Substituting the values:
[M+H]+ = (525.76712 × 2) − (1 × 1.00728)
= 1051.53424 − 1.00728
= 1050.527 Da
This matches the peak observed at 1050.52438 in Figure 5b, confirming the calculation.
6. Peptide Identification and Mass Accuracy
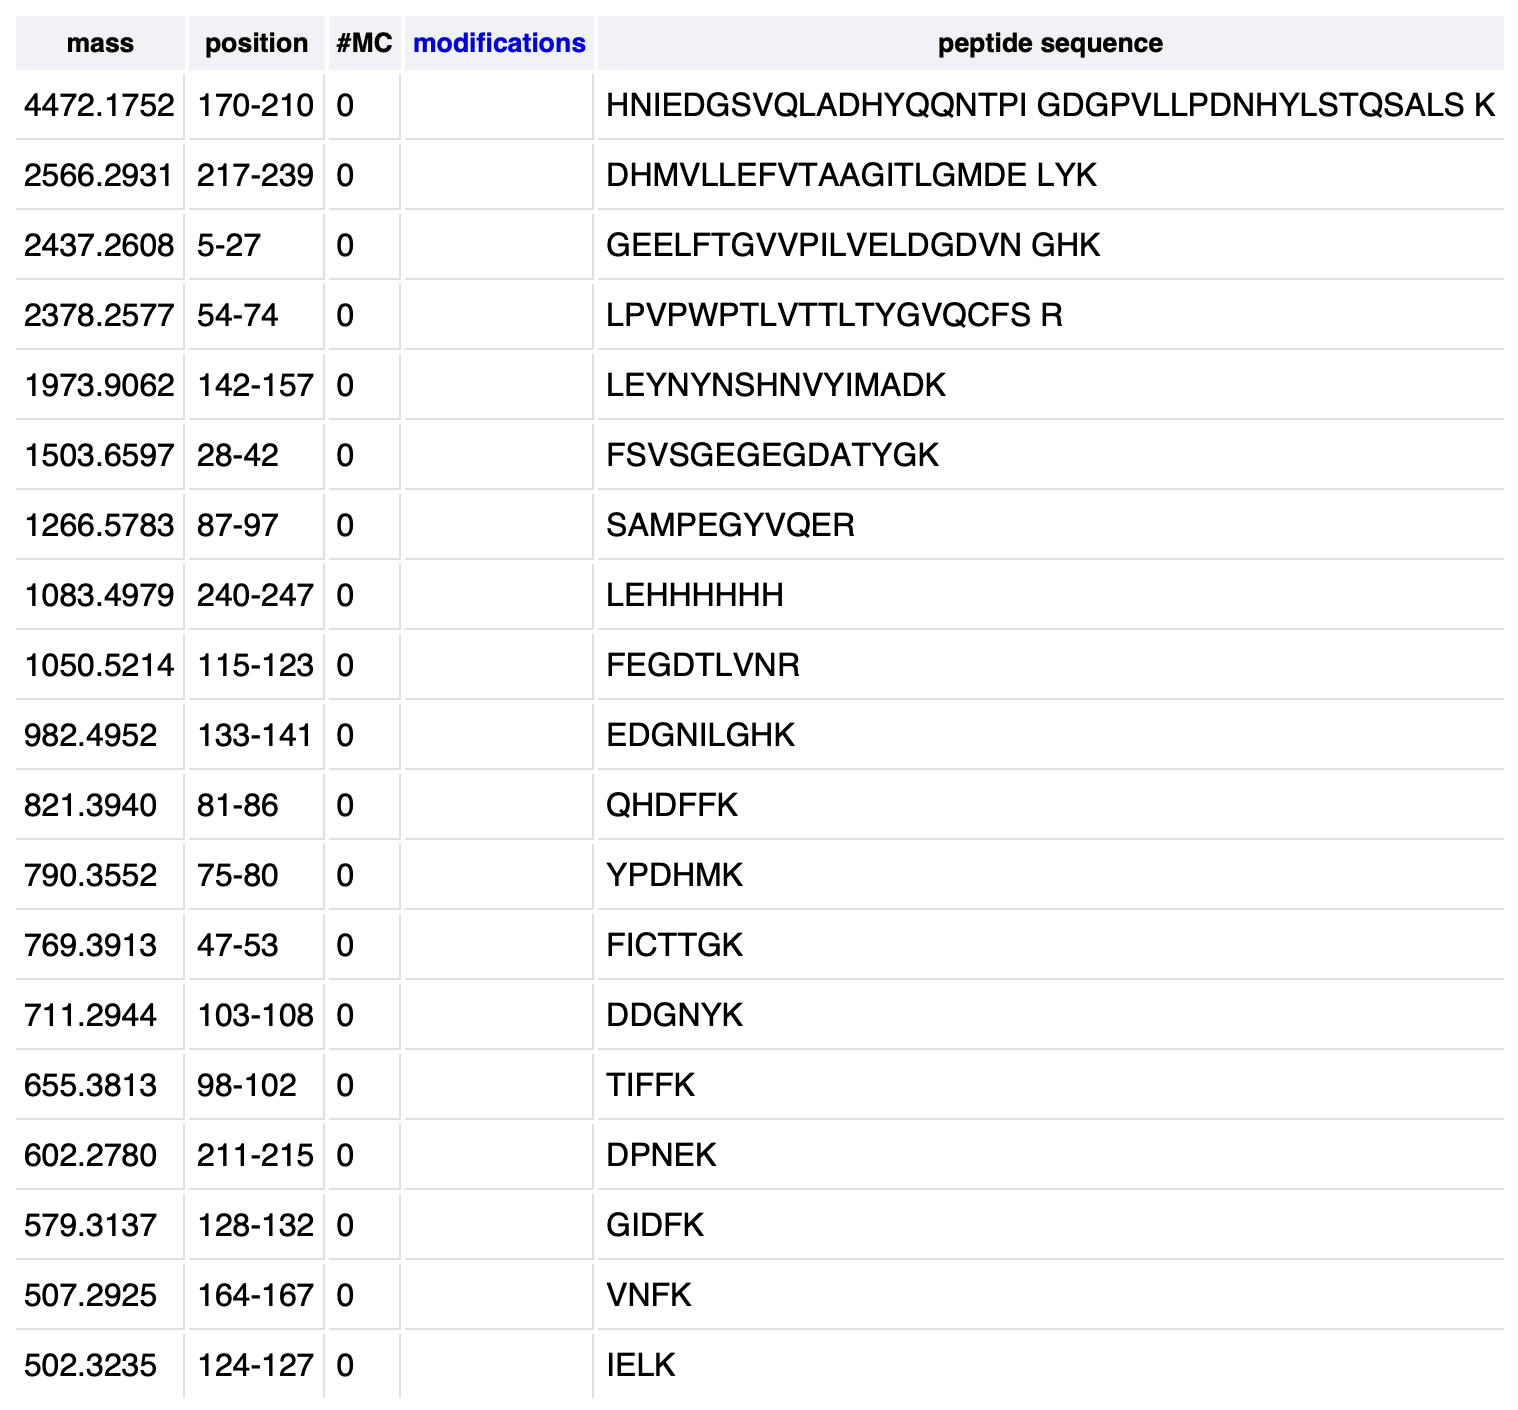
Using the PeptideMass tool (ExPASy) with the eGFP sequence and trypsin digestion, the peptide with a theoretical monoisotopic [M+H]+ mass closest to the experimentally observed value of 1050.52438 Da was identified as:
FEGDTLVNR (residues 115–123)
The mass accuracy was calculated as follows:
error (ppm) = |1050.52438 − 1050.5214| / 1050.5214 × 10⁶
≈ 2.84 ppm
This low error (~2.84 ppm) is consistent with the high mass accuracy expected from a TOF (Time-of-Flight) mass spectrometer.
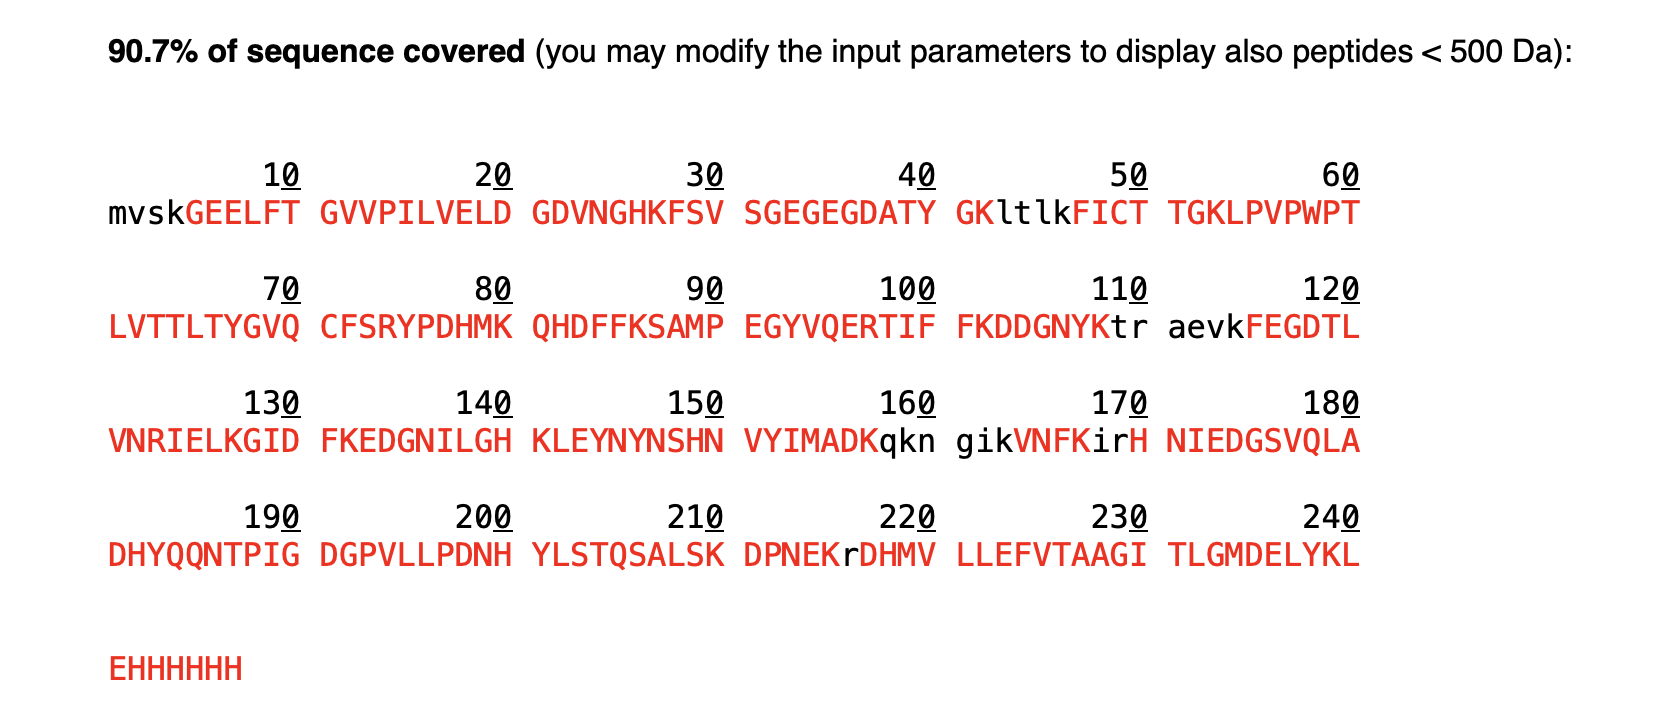
7. Sequence Coverage Confirmed by Peptide Mapping
R/:
Based on the amino acid coverage map shown in Figure 6, approximately 88% of the eGFP sequence was confirmed by peptide mapping. This means that peptides covering 88% of the total amino acid sequence were successfully identified using their calculated masses and fragmentation patterns with the BioAccord LC-MS system.
Homework: Waters Part IV — Oligomers
Using the known subunit masses from Table 1, the expected masses of each oligomeric species were calculated and matched to the peaks observed in Figure 7:
7FU Decamer:
10 × 340 kDa = 3,400 kDa (3.4 MDa) → peak at 3.4 MDa8FU Didecamer:
20 × 400 kDa = 8,000 kDa (8.0 MDa) → peak at 8.33 MDa8FU 3-Decamer:
30 × 400 kDa = 12,000 kDa (12.0 MDa) → peak at 12.67 MDa8FU 4-Decamer:
40 × 400 kDa = 16,000 kDa (16.0 MDa) → small peak near 16 MDa
The calculated masses are consistent with the peaks observed in the CDMS spectrum, confirming the presence of these oligomeric states of KLH in solution.