Week 4 HW: Protein Design - Part I
Part A. Conceptual Questions
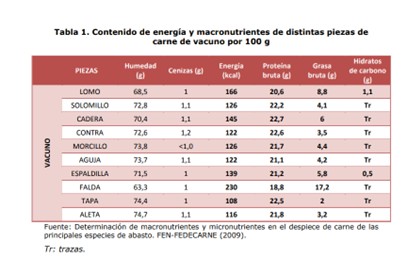
1. How many molecules of amino acids do you take with a piece of 500 grams of meat? First, I researched how much protein the meat contains. I assumed it was beef, and I saw that the amount of protein per gram varies depending on the cut (FEN, 2012). I calculated the average protein content of 10 cuts and got 19.46, which I rounded up to 20g per 100g.
- A Dalton is a unit of molecular mass defined as 1 atomic mass unit (amu) which is 1/12 of the mass of a carbon 12 atom.
1 Da ~ mass of a single proton or neutron ~ 1.66 x 10⁻²⁴ g
100 Da ~ 1.66 x 10⁻²² g/molecule, that is the mass of a single amino acid (one molecule). - g of Protein to moles of amino acids:
Moles of amino acids = (mass of protein (g)) / (average molecular weight per amino acid (g/mol))
(100 g)/(100 g/mol) = 1 mol of amino acid - If (Avogadro’s number): 1 mol = 6.022 x 10²³ molecules/mol
How many molecules in 1 mol of amino acids? ~6.022 x 10²³ molecules/mol in 500 gr of meat
2. Why do humans eat beef but do not become a cow, eat fish but do not become fish? Because humans eat food that provides molecules, not organisms.
3. Why are there only 20 natural amino acids? The 20 amino acids were selected based on availability, stability, and functional suitability, forming an optimal set for building proteins in early life.
There are only 20 standard amino acids because evolution selected a set that is chemically diverse, structurally compatible with protein folding, and efficient for accurate translation.
While more amino acids were likely available early on, translation precision and the need to reduce errors led to the retention of this specific set (Weber & Miller, 1981).
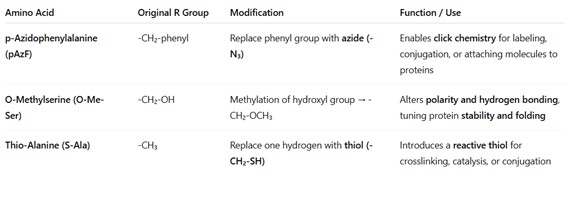
4. Can you make other non-natural amino acids? Design some new amino acids. Non-natural amino acids can be designed to introduce new functions, enhance stability, or modify reactivity in proteins, extending the capabilities of the 20 standard amino acids; however, their exact behavior cannot be fully predicted, so careful experimental validation and optimization are essential.
To design a new amino acid, I need to study their structure, variability, and functionality:
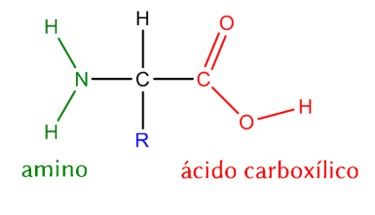
Structure and Function of α-Amino Acids
- Central α-carbon – the connection point for all groups.
- Amino group (-NH₂) – basic, participates in peptide bonds.
- Carboxyl group (-COOH) – acidic, participates in peptide bonds and proton transfer.
- Hydrogen (H) – small, allows proper folding.
- Side chain (R group) – variable, determines the chemical properties and identity of the amino acid.
Variability: Differences between amino acids come from the R group, which can be hydrophobic, polar, acidic, basic, aromatic, or special (like cysteine or proline).
Functional roles:
Amino and carboxyl groups: form the peptide backbone and participate in chemical reactions.
Side chain (R): defines polarity, charge, reactivity, hydrogen bonding, and overall protein structure.
Design implications:
Synthetic amino acids often modify the side chain (R) to introduce new chemical functions, stability, or reactivity.
Modifying the α-carbon, amino, or carboxyl groups is less common but can create β-amino acids or N-alkylated variants, affecting folding.
The side chain (R group) determines the identity and functionality of an amino acid, while the backbone maintains the ability to form proteins. Synthetic modifications expand the chemical possibilities beyond the 20 standard amino acids.
Now, I do not know much about synthetic modifications, and I asked chatgpt3:
I also found an interesting article about synthetic amino acids (Rovner et al., 2015), it shows a practical application of synthetic amino acids (sAAs) to control and engineer organisms, and expand protein functionality beyond natural amino acids:
- Incorporation into essential proteins: TAG codons in key genes are reassigned to encode synthetic amino acids, demonstrating how sAAs can be integrated into functional proteins.
- Biocontainment: Cells only grow when supplied with sAAs, highlighting their use for controlling viability.
- Expanding the genetic code: sAAs enable new chemical functionalities beyond the 20 natural amino acids, allowing the design of synthetic proteins with novel properties.
5. Where did amino acids come from before enzymes that make them, and before life started? Before enzymes and living cells existed, amino acids likely formed through natural (abiotic) chemical processes. The main explanations are:
- Chemical reactions on early times of earth: On the early Earth, simple atmospheric gases such as carbon dioxide (CO₂), methane (CH₄), ammonia (NH₃), and hydrogen (H₂) are thought to have reacted under energy sources such as lightning, volcanic heat, and ultraviolet radiation. Within the theoretical framework proposed by Alexander Oparin (1924, 1938) and J. B. S. Haldane (1929), these energy-driven processes could have led to the abiotic formation of organic molecules in the primitive oceans. Experimental support for this hypothesis was later provided by the Miller-Urey experiment (Miller, 1953), which demonstrated that amino acids can form under simulated early Earth conditions.
- Formation in space and delivery to Earth: Amino acids may also have formed in space and later been delivered to Earth through cometary and asteroidal material. Organic compounds, including amino acids and phosphorus-bearing molecules, have been detected in the coma of comet 67P/Churyumov-Gerasimenko, demonstrating that prebiotic chemicals can form in extraterrestrial environments (Altwegg et al., 2016). More recently, samples from the asteroid Bennu returned by NASA’s OSIRIS-REx revealed amino acids whose isotopic signatures suggest formation in very cold primordial ices in the early Solar System (Baczynski et al 2026).
- Mineral catalysis before enzymes: Mineral surfaces and metal ions on the early Earth could have acted as simple catalysts before enzymes evolved, helping to concentrate organic compounds and promote chemical reactions. Recent reviews show that clays and other minerals can adsorb and organize amino acids and other prebiotic molecules, enhancing their reactions and potentially aiding the formation of more complex organics such as peptides and polymers in prebiotic settings (Nogal et al., 2023).
Overall, evidence suggests that amino acids existed before life began, and enzymes evolved later to make these natural chemical processes more efficient.
6. If you make an α-helix using D-amino acids, what handedness (right or left) would you expect? If an α-helix is constructed entirely from D-amino acids, the helix will adopt the opposite handedness compared to a helix made of L-amino acids and its functionality can change. Natural proteins are composed of L-amino acids, which form right-handed α-helices. D-amino acids are mirror images of L-amino acids, so when used exclusively, they form left-handed α-helices.
If an α-helix composed of L-amino acids is instead made entirely from D-amino acids, the helix becomes a mirror image of the original. L-amino acids form right-handed helices, while D-amino acids form left-handed helices, flipping the spatial arrangement of the side chains. Because many biological interactions are chiral-specific, this mirror-image helix often cannot interact with the same enzymes, receptors, or partners as the L-helix. As a result, the functionality can change: D-amino acid helices may be more resistant to proteases, more stable, or have novel chemical properties, but they rarely replicate the exact biological activity of the original L-amino acid helix.
7. Can you discover additional helices in proteins? Yes. Additional helices in proteins can be discovered through experimental methods such as X-ray crystallography, NMR, or cryo-EM, as well as through computational structure prediction tools like AlphaFold. In some cases, regions that appear disordered can form helices only under certain conditions (for example, upon binding to another molecule), revealing previously unrecognized helical structures.
8. Why are most molecular helices right-handed? Most molecular helices are right-handed because biological molecules are chiral. Proteins are built from L-amino acids, whose geometry makes the right-handed α-helix energetically more stable and free of steric clashes than the left-handed version. Similarly, the stereochemistry of sugars in DNA favors a right-handed double helix (B-DNA).
9. Why do β-sheets tend to aggregate? β-sheets tend to aggregate because their structure allows strong interactions between different protein molecules.
When a protein is partially unfolded, its backbone and hydrophobic regions become exposed. β-strands from different molecules can then align side by side and form many hydrogen bonds. Their flat and extended shape also allows close packing (antiparallel, parallel, mixed).
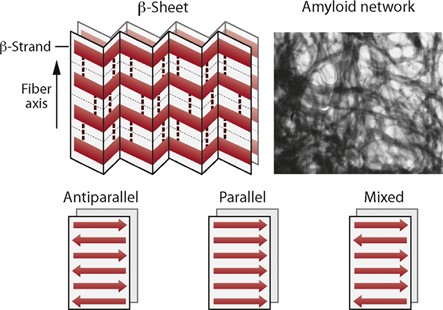 
These interactions lower the overall free energy of the system, making the aggregated β-sheet structure (such as amyloid fibrils) more stable than the unfolded proteins (Maury 2015).
Protein aggregation does not mean the native protein becomes more stable. Instead, when a protein is partially unfolded or misfolded, it is in a relatively unstable, high-energy state. Exposed hydrophobic regions and backbone groups can then form intermolecular interactions (hydrophobic contacts and hydrogen bonds, often arranged as β-sheets).
These interactions lower the overall free energy of the system, making the aggregated state more thermodynamically stable than the unfolded monomers — even though it is not the functional native state.
So, aggregation is energetically favorable compared to the misfolded/unfolded state, but it represents a loss of normal protein function.
In short, β-sheets are fundamental structural elements of proteins that are crucial for both normal function and, in some cases, disease.
- What is the driving force for β-sheet aggregation? The main driving force for β-sheet aggregation is the formation of extensive intermolecular hydrogen bonds combined with hydrophobic interactions, which lower the free energy of the system and stabilize the cross-β fibril structure.
10. Why do many amyloid diseases form β-sheets? Many amyloid diseases form β-sheets because misfolded proteins can easily reorganize into this structure.
An amyloid disease is a disorder in which certain proteins misfold and form abnormal aggregates called amyloid fibrils. The proteins misfold, and form structures rich in β-sheets, sticking together and building stable fibrils. These fibrils accumulate in tissues or organs and interfere with normal cell function. Over time, this accumulation can damage cells and lead to disease (Alzheimer’s disease - amyloid-β plaques in the brain; Parkinson’s disease - α-synuclein aggregates, Systemic amyloidosis - amyloid deposits in organs like the heart or kidneys (Monsellier & Chiti 2007, Cheng et al 2012, Bolshette et al 2014).
In simple terms, an amyloid disease happens when misfolded proteins aggregate and build up in the body, causing tissue damage.
- Can you use amyloid β-sheets as materials? Yes. Amyloid β-sheets can be used as materials because their structure forms highly ordered and stable fibrils. These fibrils are strong, resistant to heat and chemical degradation, and can self-assemble into nanofibers. Because of these properties, researchers are exploring their use in nanotechnology, tissue engineering scaffolds, biosensors, and drug delivery systems. Despite their association with disease in the body, amyloid β-sheets from vegetable protein have promising applications as engineered biomaterials. They have been applied in renewable and biodegradable bioplastics and in water purification membranes for heavy metal removal (Li et al 2023).
References
- Altwegg, K., Balsiger, H., Bar-Nun, A., et al. (2016). Prebiotic chemicals—amino acid and phosphorus—in the coma of comet 67P/Churyumov-Gerasimenko. Science Advances, 2(5), e1600285.
- Blachier, F. (2025). Amino Acids Before Life and in the First Living Organisms. In: The Evolutionary Journey of Amino Acids. Springer, Cham.
- Bolshette, N. B., Thakur, K. K., Bidkar, A. P., et al. (2014). Protein folding and misfolding in the neurodegenerative disorders: a review. Revue Neurologique, 170(3), 151-161.
- Cheng, P. N., Liu, C., Zhao, M., Eisenberg, D., & Nowick, J. S. (2012). Amyloid β-sheet mimics that antagonize protein aggregation and reduce amyloid toxicity. Nature Chemistry, 4(11), 927-933.
- Fundación Española de la Nutrición (FEN). (2012). Guía Nutricional de la Carne.
- Haldane, J. B. S. (1929). Origin of life. Ration. Annu., 148, 3–10.
- Li, T., Zhou, J., Peydayesh, M., et al. (2023). Plant protein amyloid fibrils for multifunctional sustainable materials. Advanced Sustainable Systems, 7(4), 2200414.
- Maury, C. P. J. (2015). Primordial genetics: Information transfer in a pre-RNA world based on self-replicating beta-sheet amyloid conformers. Journal of Theoretical Biology, 382, 292-297.
- Miller, S. L. (1953). A production of amino acids under possible primitive earth conditions. Science, 117(3046), 528-529.
- Monsellier, E., & Chiti, F. (2007). Prevention of amyloid-like aggregation as a driving force of protein evolution. EMBO Reports, 8(8), 737.
- Nogal, N., Sanz-Sánchez, M., Vela-Gallego, S., et al. (2023). The protometabolic nature of prebiotic chemistry. Chemical Society Reviews, 52(21), 7359-7388.
- Rovner, A. J., Haimovich, A. D., Katz, S. R., et al. (2015). Recoded organisms engineered to depend on synthetic amino acids. Nature, 518(7537), 89-93.
- Weber, A. L., & Miller, S. L. (1981). Reasons for the occurrence of the twenty coded protein amino acids. Journal of Molecular Evolution, 17(5), 273-284.
Part B. Proteine Analysis and Visualization
In this part of the homework, you will be using online resources and 3D visualization software to answer questions about proteins. Pick any protein (from any organism) of your interest that has a 3D structure and answer the following questions:
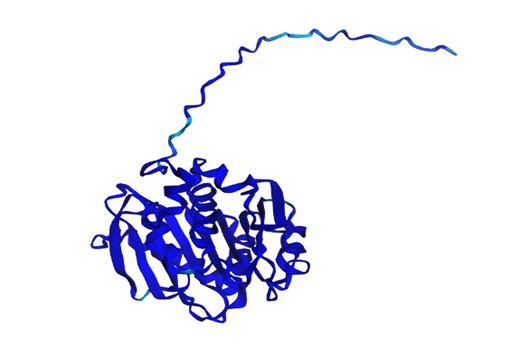
1. Briefly describe the protein you selected and why you selected it. PETase (Poly(ethylene terephthalate) hydrolase, sp|A0A0K8P6T7.1|PETH_PISS1) is a bacterial enzyme specialized in degrading PET (polyethylene terephthalate), a polymer widely used in plastic bottles and packaging. This protein belongs to the α/β-hydrolase fold family, which includes enzymes such as lipases, esterases, and cutinases, sharing a characteristic structural fold of alternating α-helices and β-sheets, as well as a conserved catalytic triad (Ser–His–Asp/Glu) essential for its hydrolytic activity. PETase functions by breaking the ester bonds in PET, facilitating plastic biodegradation and making it a biotechnologically relevant model for enzymatic recycling studies.
This protein was selected for the molecular analysis and visualization section because its structure is well-characterized and its function is clear and measurable. It allows the application of bioinformatics tools to explore features such as folds, active sites, hydrophobic regions, and interaction patterns, demonstrating in a practical way how an enzyme’s structure is directly linked to its biological function and industrial applications.
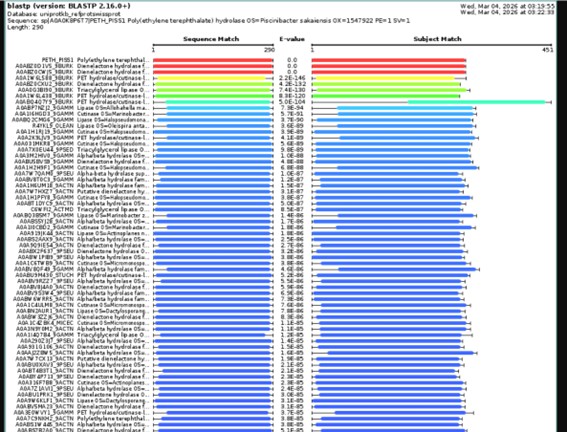
2. Identify the amino acid sequence of your protein. This is the amino acid sequence of the protein PETase.
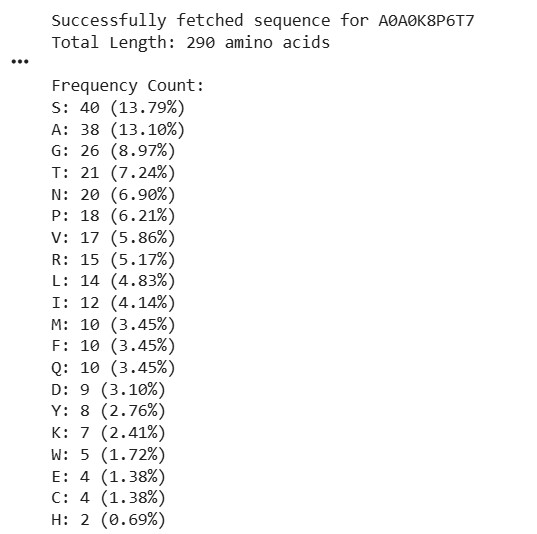
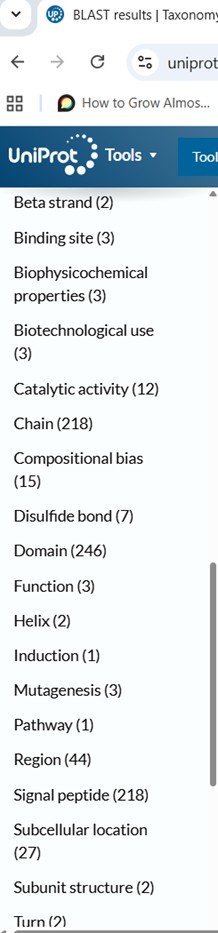
- How long is it? What is the most frequent amino acid? You can use this Colab notebook to count the frequency of amino acids. The lenght of the proteine is 290 aminoacids, and the most common amino acid is S (Serine).
- How many protein sequence homologs are there for your protein? Hint: Use Uniprot’s BLAST tool to search for homologs.
How to use BLAST Analysis of PETase BLAST (Basic Local Alignment Search Tool) is a program that compares a query sequence, either DNA or protein, against sequences in public databases. It is used to identify similar or homologous sequences, predict the family or likely function of a protein, and analyze evolutionary conservation or important functional motifs. For protein sequences, the BLASTp algorithm is typically used to compare amino acid sequences.
Step 1: Input Sequence: Copy the amino acid sequence of the protein you wish to analyze (for example, PETase from UniProt). Paste it into the “Enter Query Sequence” field. The sequence can be provided in FASTA format or as a plain amino acid string.
PETase_A0A0K8P6T7 MNFPRASRLMQAAVLGGLMAVSAAATAQTNPYARGPNPTAASLEASAGPFTVRSFTVSRPSGYGAGTVYY…
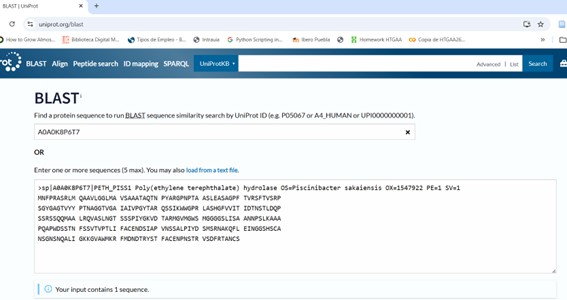
- Step 2: Select Target Database: I used UniProtKB/Swiss-prot, the Best for reliable and curated results. Then check the rest of parameters:
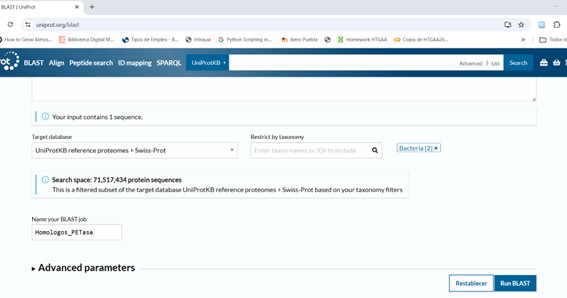
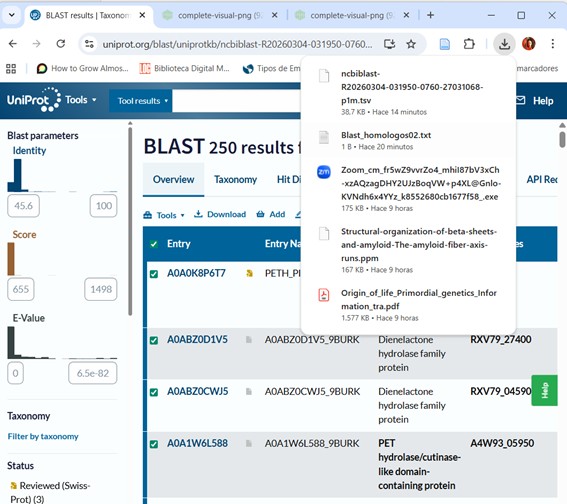
Pres Run BLAST and wait until they notify your results are ready.File .tsv was downloaded, and also I downloaded .png file.
How to interpret the results from Blast?

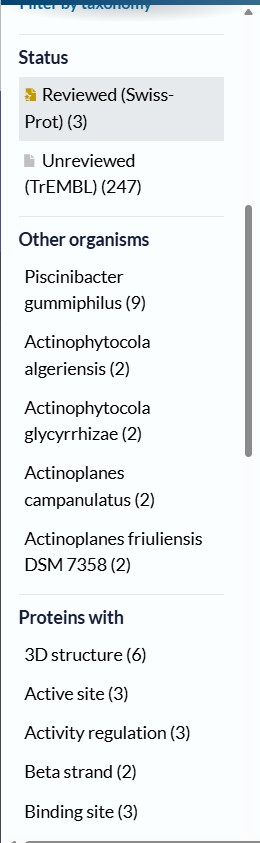
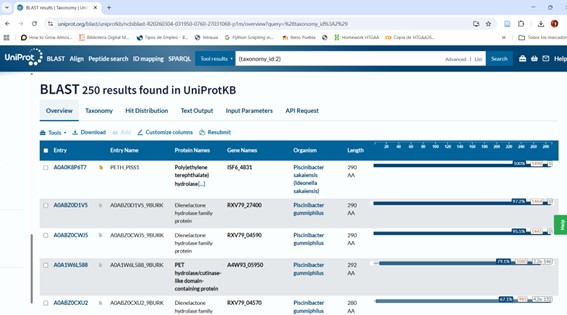
The BLAST analysis against UniProtKB returned 250 highly significant hits (E-value < 10⁻⁸²).
Most sequences exhibit 47–52% identity, with some closely related homologs reaching 83–100% identity.
The identified proteins have an average length of 280–320 amino acids, which is consistent with enzymes belonging to the α/β hydrolase fold superfamily.
Functionally, the main homologs correspond to cutinases, lipases, and PET hydrolases, many of which are found in bacteria within the phylum Actinobacteria.
The presence of reviewed Swiss-Prot entries and homologs with available three-dimensional structures further supports the functional prediction.
Overall, the results indicate that the analyzed protein belongs to the α/β hydrolase superfamily and likely exhibits hydrolase activity toward ester bonds, with potential capability for polyester degradation such as PET.
3. Identify the structure page of your protein in RCSB.
- When was the structure solved? Is it a good quality structure? Good quality structure is the one with good resolution. Smaller the better (Resolution: 2.70 Å)
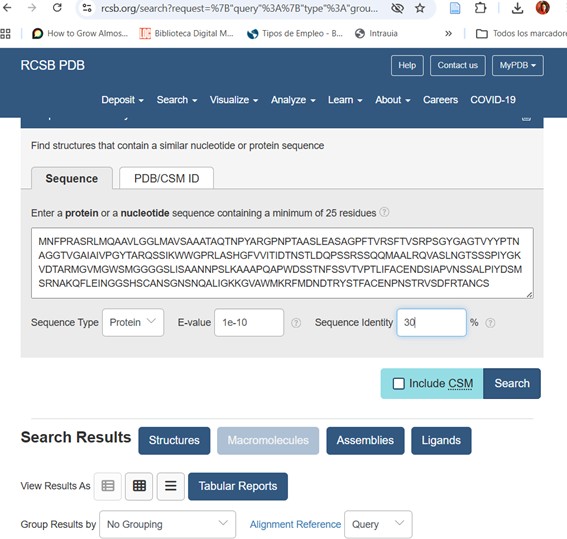
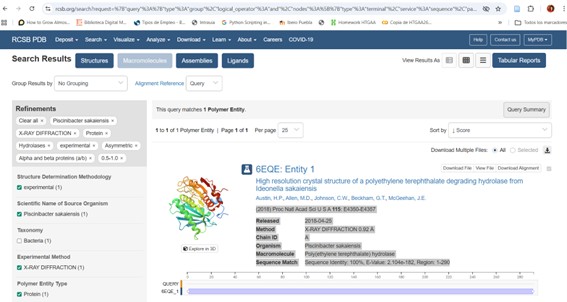
The crystal structure of poly(ethylene terephthalate) hydrolase (PETase) from Piscinibacter sakaiensis corresponds to PDB entry 5XH3. The structure was published in 2018 in Proceedings of the National Academy of Sciences and determined using X-ray diffraction.
The reported resolution is 0.92 Å, indicating exceptionally high structural quality. Since lower resolution values reflect greater atomic precision, this structure provides near-atomic detail and is considered extremely reliable.
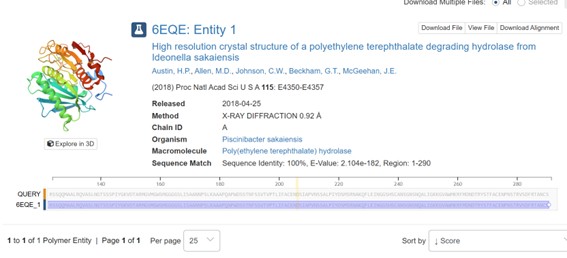
The analyzed chain (Chain A) shows 100% sequence identity with the query sequence across residues 1–290, confirming that this structure corresponds exactly to the studied protein.
In addition to the protein chain, the structure contains water molecules and other crystallographic components typical of high-resolution X-ray structures.
According to SCOP structural classification, the protein belongs to the alpha and beta (α/β) protein class, consistent with the α/β-hydrolase fold family identified through sequence analysis and BLAST results.
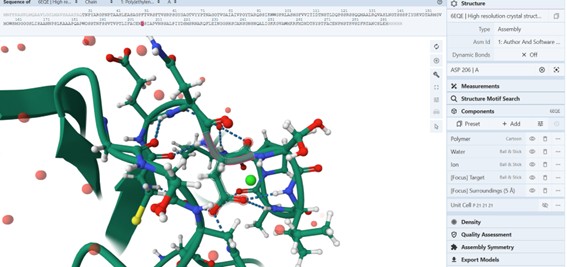
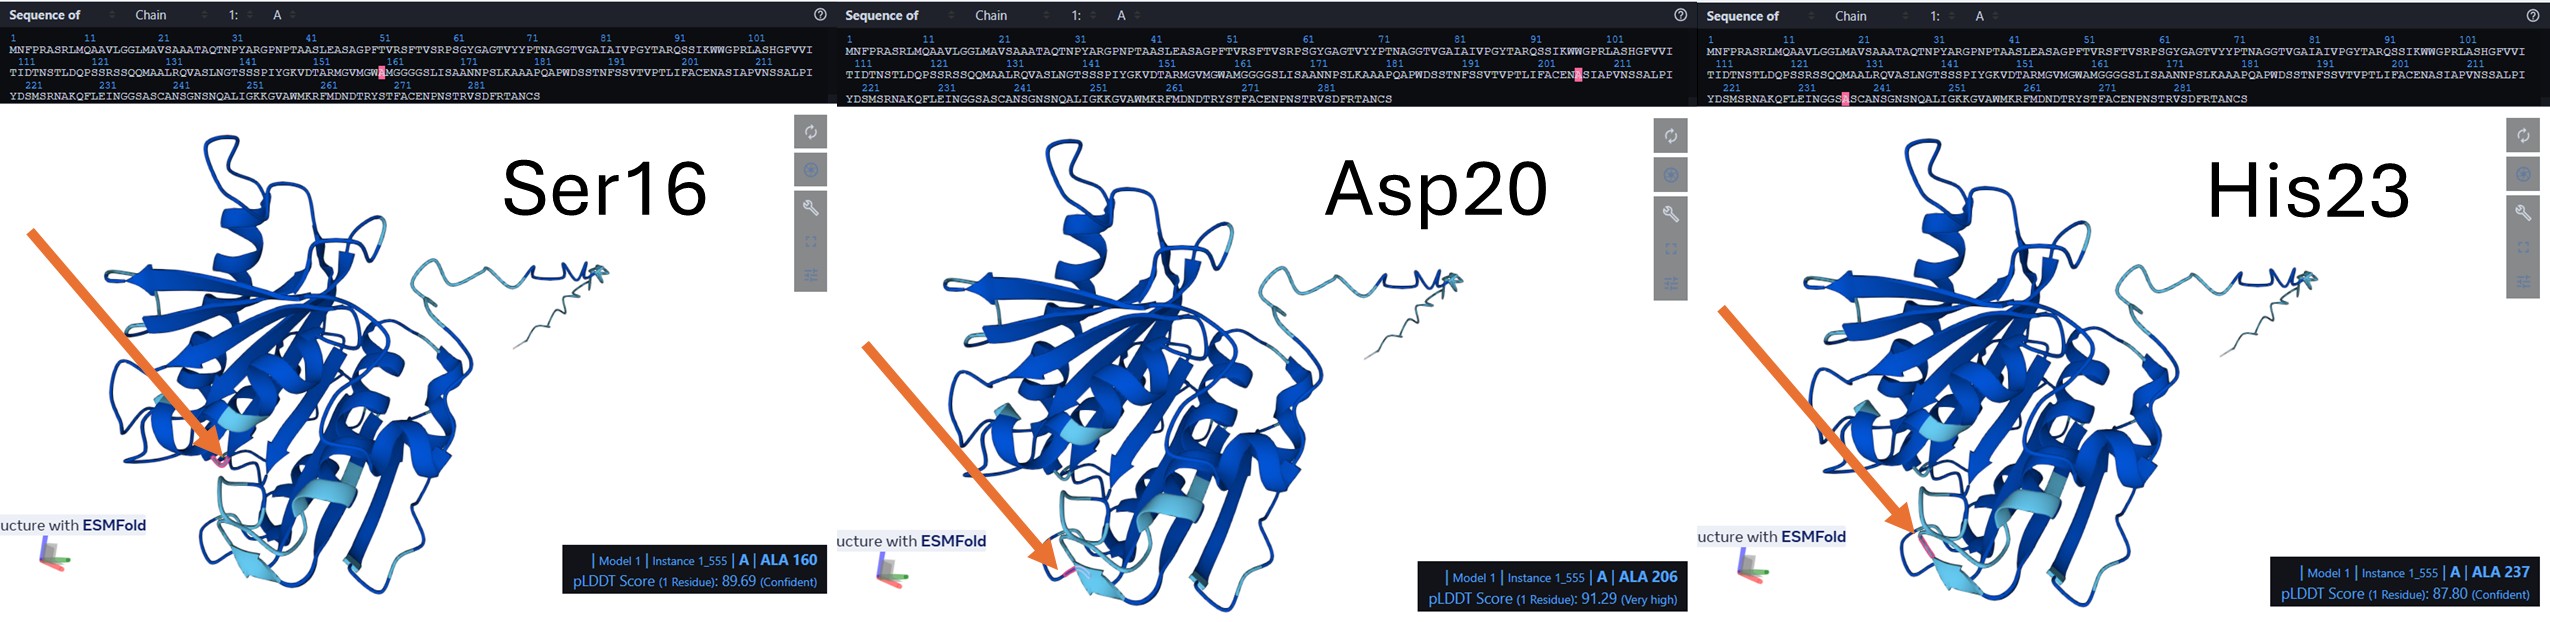
In the amino acid sequence, the catalytic triad was identified at positions Ser160, Asp206, and His237. These conserved residues form the active site of the enzyme and are responsible for its hydrolytic activity. Ser160 acts as the nucleophile, His237 functions as a general base, and Asp206 stabilizes the histidine residue. Together, this catalytic machinery enables the hydrolysis of ester bonds, consistent with the characteristic mechanism of α/β-hydrolase fold enzymes such as PETase.
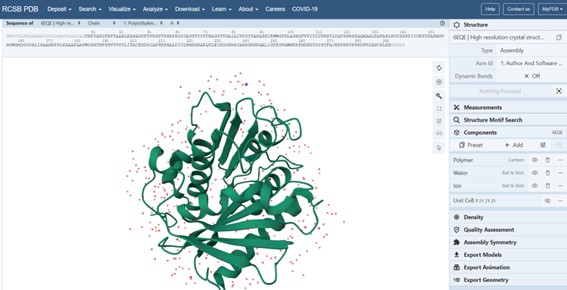
See 6EQE in the picture below:
As example, Position Asp 206 (S):
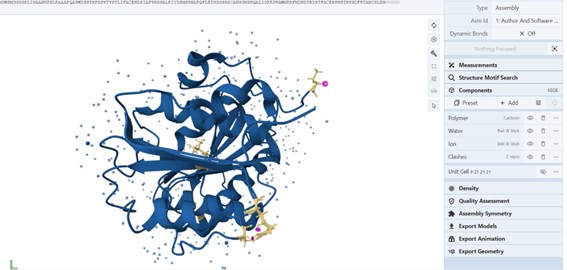
- Are there any other molecules in the solved structure apart from protein?
Yes, the crystal structure includes additional molecules such as water and crystallization agents. These are not part of the protein itself but are present due to the experimental conditions and may contribute to structural stabilization.
The figure below (RCSB) shows other molecules such as Polymer (solid dark blue), Water (doots lighter blue around), Ion (dark blue dots) and clashes (yellow structures with pink rings).
- Does your protein belong to any structure classification family?
Yes, the protein belongs to the α/β-hydrolase fold structural family, characterized by a central β-sheet surrounded by α-helices and a conserved Ser–Asp–His catalytic triad (explanation above).
4. Open the structure of your protein in any 3D molecule visualization software.
- PyMol Tutorial Here (hint: ChatGPT is good at PyMol commands)
- Visualize the protein as “cartoon”, “ribbon” and “ball and stick”.
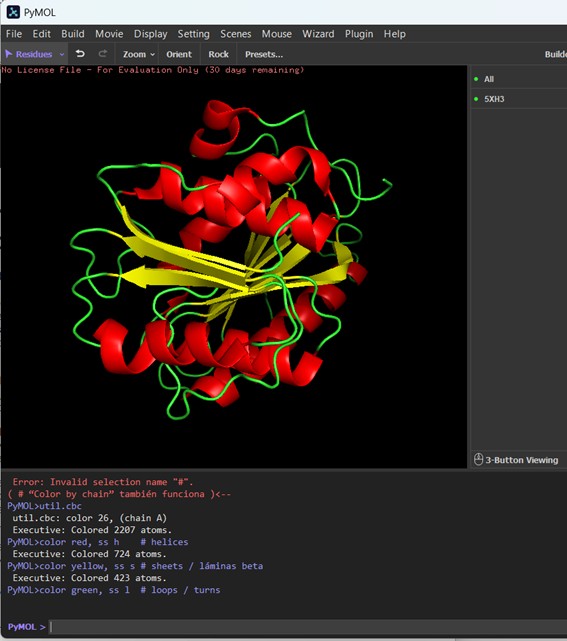
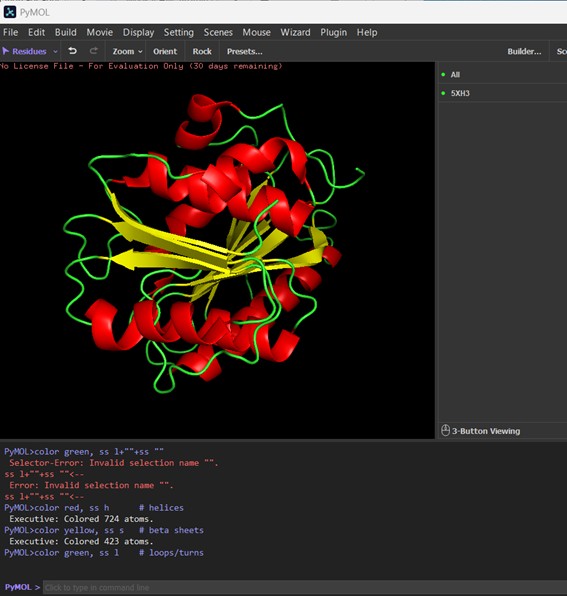
Figure description (Cartoon representation): The protein structure is shown in cartoon representation, which highlights the secondary structure elements. Red regions correspond to α-helices, yellow regions indicate β-sheets, and green regions represent loops or turns connecting the secondary structure elements. This visualization allows us to quickly see the overall fold of the protein and the organization of helices, sheets, and loops within the 3D structure.
 ---
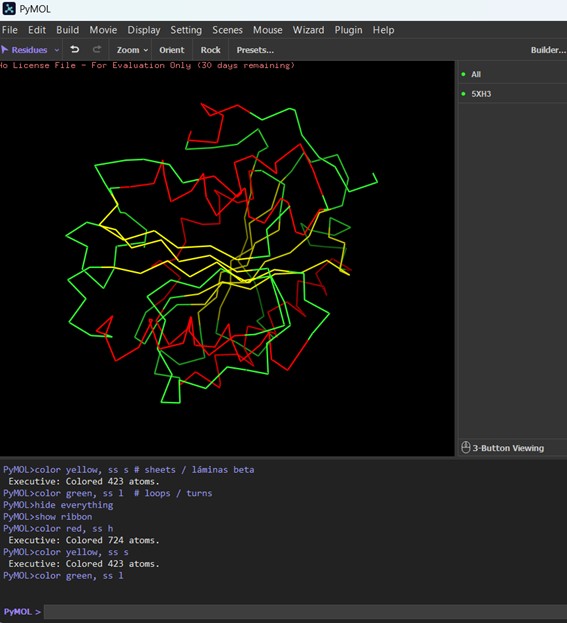
---The protein is shown in ribbon representation, highlighting its secondary structure. α-helices are colored red, β-sheets yellow, and loops/turns green. This view emphasizes the overall fold and connectivity of the protein backbone, even though short β-strands may appear as simple lines rather than arrows.
 ---
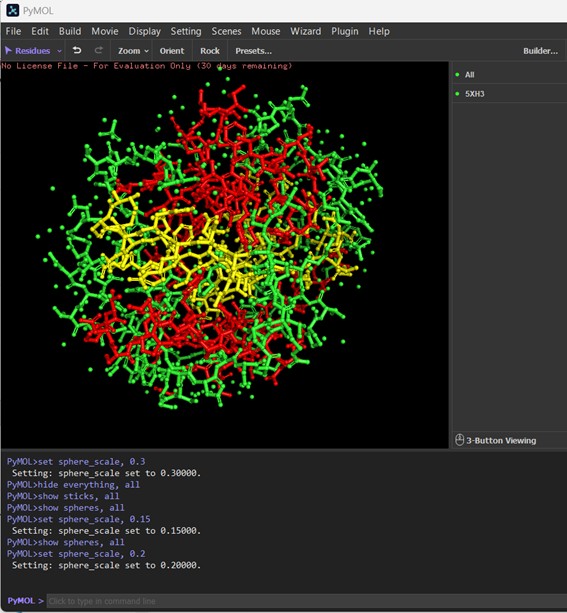
---Ball-and-Stick Representation: The protein is visualized using the ball-and-stick model, where atoms are represented as spheres and bonds as sticks. The spheres are scaled to clearly show individual atoms without cluttering the image. In this representation, the distribution of atoms along the protein backbone and side chains is visible, highlighting the chemical connectivity within the enzyme. The colors correspond to residue types: for example, carbon atoms in green, oxygen in red, nitrogen in blue, and sulfur in yellow, allowing differentiation of polar, nonpolar, and reactive groups. This view emphasizes the three-dimensional arrangement of amino acids, which is critical for understanding active sites, substrate binding, and potential catalytic interactions.
 ---
---- Color the protein by secondary structure. Does it have more helices or sheets?
The protein is colored by secondary structure: red for α-helices, yellow for β-sheets, and green for loops/turns. Visually, the PETase structure contains more α-helices than β-sheets, indicating that helical regions dominate the fold, while sheets are present but less abundant. Loops and turns (green) connect these elements and form the flexible parts of the protein.
 ---
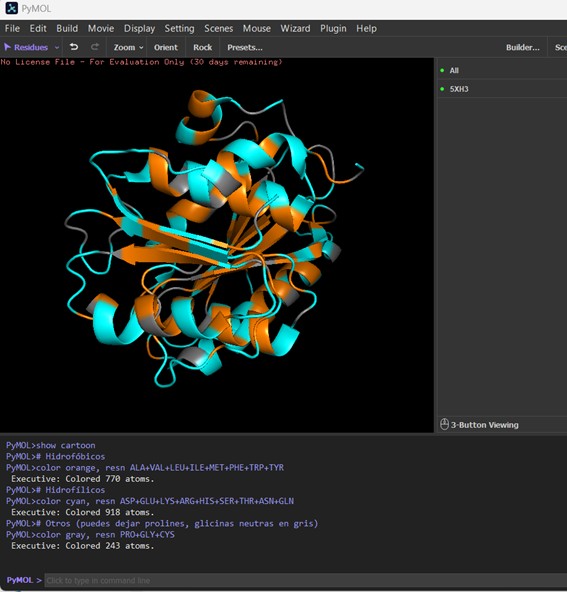
---- Color the protein by residue type. What can you tell about the distribution of hydrophobic vs hydrophilic residues?
The protein is visualized in cartoon representation, with residues colored according to their chemical properties. Hydrophobic residues (Ala, Val, Leu, Ile, Met, Phe, Trp, Tyr) are shown in orange, hydrophilic residues (Asp, Glu, Lys, Arg, His, Ser, Thr, Asn, Gln) are in cyan, and other residues such as Pro and Gly are colored gray. The distribution shows that hydrophobic residues are mostly buried within the protein core, stabilizing the structure, while hydrophilic residues are more exposed on the surface, potentially interacting with the solvent or other molecules.
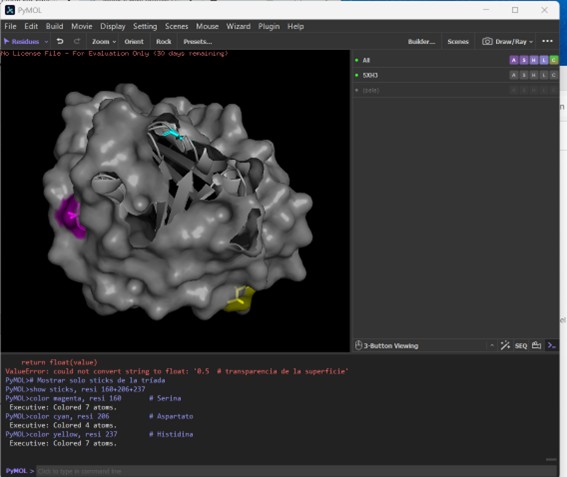
- Visualize the surface of the protein. Does it have any “holes” (aka binding pockets)?
The protein is displayed as a semi-transparent surface on a black background, highlighting the overall shape and potential binding pockets. The catalytic triad is distinctly colored: serine 160 in magenta, aspartate 206 in cyan, and histidine 237 in yellow. The triad is clearly visible on the surface, within a main binding pocket. This coloring emphasizes the spatial arrangement of the catalytic residues relative to the protein fold, allowing easy identification of the active site and nearby substrate-binding regions.
As the protein PETase belongs to the PETase / PET-digesting enzyme family, which includes hydrolases capable of degrading poly(ethylene terephthalate) (EC 3.1.1.101). This family information will be used to restrict the BLAST search to proteins with the same functional classification, ensuring that the results are relevant homologs. In Restrict by Taxonomy field, I included “bacteria”. This configuration will focus the results on relevant, functional homologs in bacterial species.
Part C. Using ML-Based Protein Desing Tools
In this section, we will learn about the capabilities of modern protein AI models and test some of them in your chosen protein.
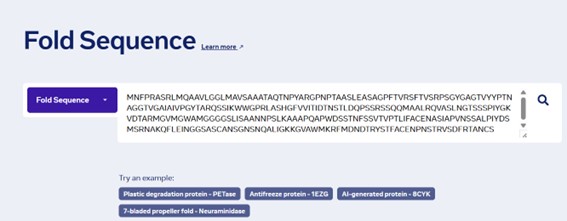
1. Copy the HTGAA_ProteinDesign2026.ipynb notebook and set up a Colab instance with GPU.

2. Choose your favorite protein from the PDB.
sp|A0A0K8P6T7.1|PETH_PISS1 RecName: Full=Poly(ethylene terephthalate) hydrolase; Short=PET hydrolase; Short=PETase; AltName: Full=PET-digesting enzyme; Flags: Precursor
Sequence:
MNFPRASRLMQAAVLGGLMAVSAAATAQTNPYARGPNPTAASLEASAGPFTVRSFTVSRPSGYGAGTVYYPTNAGGTVGAIAIVPGYTARQSSIKWWGPRLASHGFVVITIDTNSTLDQPSSRSSQQMAALRQVASLNGTSSSPIYGKVDTARMGVMGWAMGGGGSLISAANNPSLKAAAPQAPWDSSTNFSSVTVPTLIFACENDSIAPVNSSALPIYDSMSRNAKQFLEINGGSASCANSGNSNQALIGKKGVAWMKRFMDNDTRYSTFACENPNSTRVSDFRTANCS
3.We will now try multiple things in the three sections below; report each of these results in your homework writeup on your HTGAA website:
C1. Protein Language Modeling
1. Deep Mutational Scans
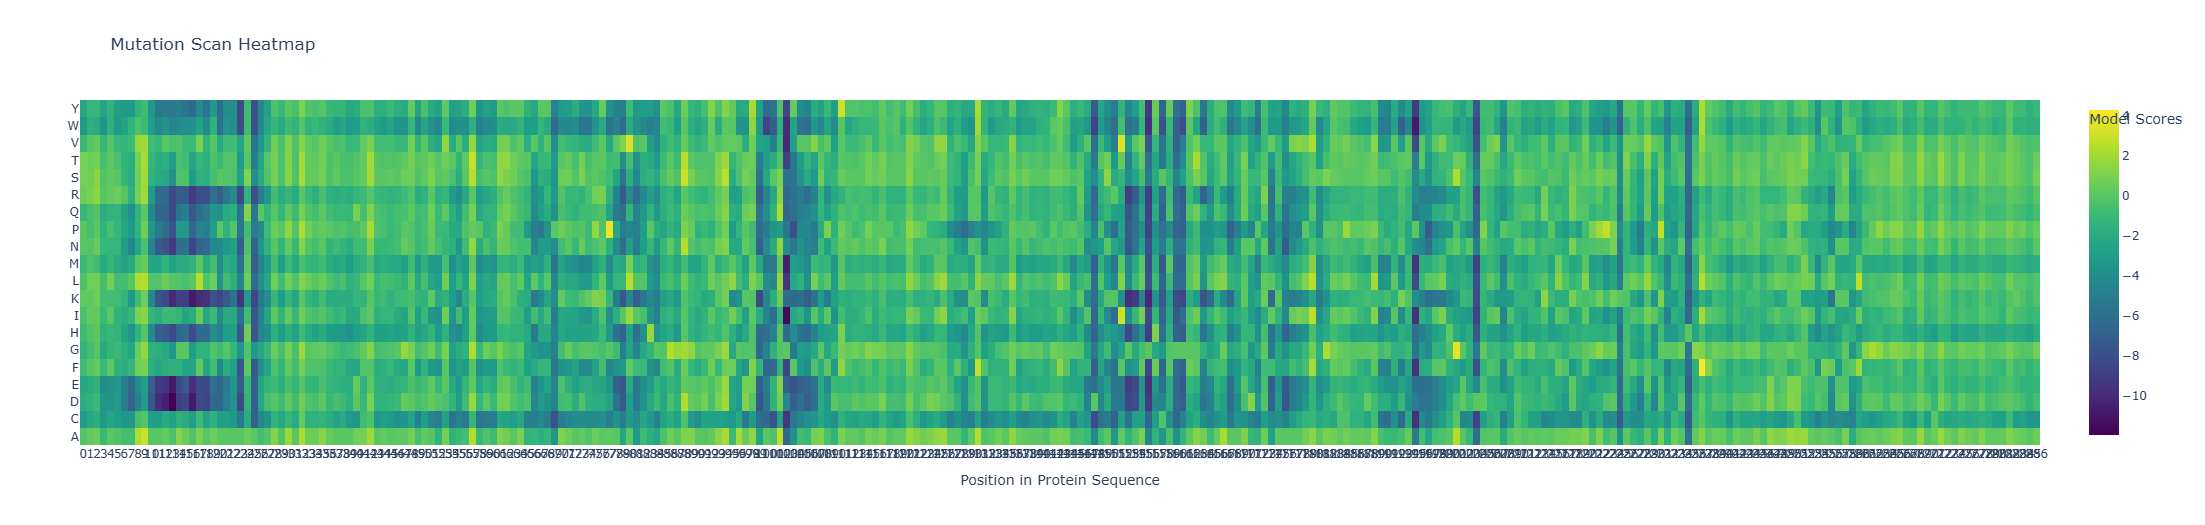
a. Use ESM2 to generate an unsupervised deep mutational scan of your protein based on language model likelihoods.
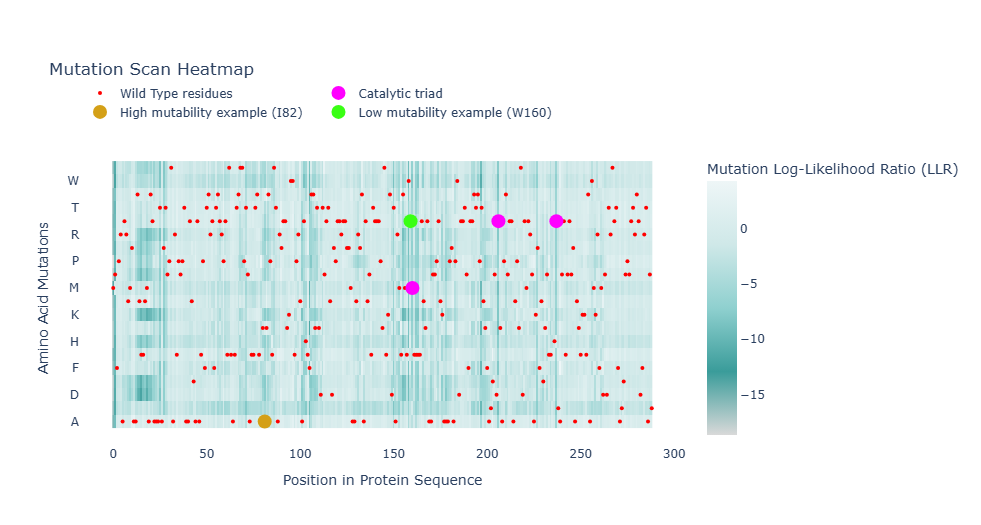
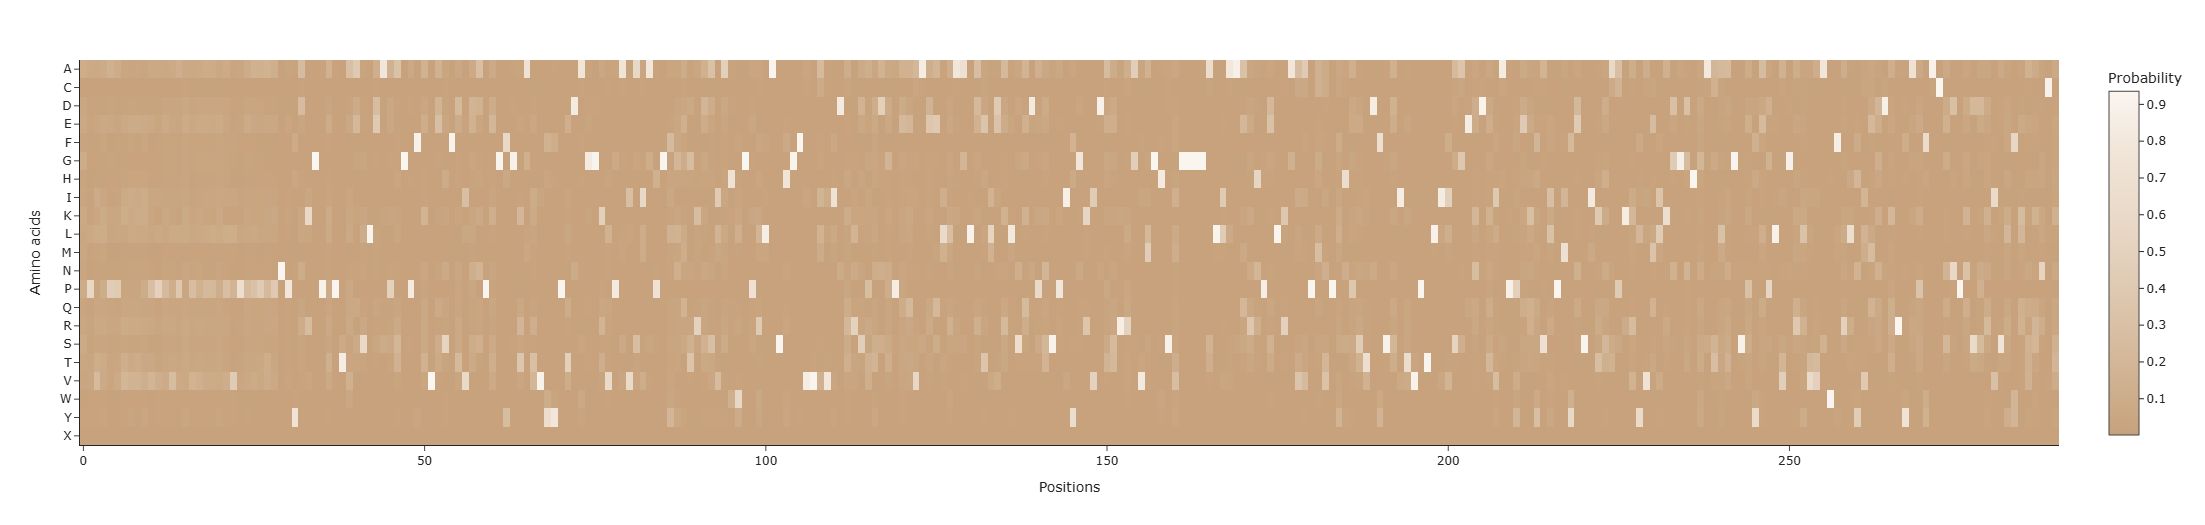
Model Scores | Mutation Scan Heatmap | Position in Protein Sequence | Amino Acid Mutations:
The heatmap represents the log-likelihood ratio (LLR) between a mutant residue and the original amino acid (wild type, WT). Positive or less negative values indicate that a mutation is relatively tolerated by the model, whereas strongly negative values suggest that the substitution is unlikely and potentially deleterious.
b. Can you explain any particular pattern?
To answer this section, the script was improved to get visual data to support the explanation:
To investigate the mutational tolerance of the protein sequence, an unsupervised deep mutational scan (DMS) was generated using the ESM2 protein language model. In this analysis, every position of the sequence is systematically mutated to each of the 20 standard amino acids, and the model estimates the likelihood of each substitution based on learned evolutionary patterns from large protein databases.
Overall, positions 11 to 30 show that more than half of the amino acids have negative probabilities, indicating these sites are less tolerant to substitutions and likely structurally or functionally constrained. In contrast, positions 262 to 289 display predominantly positive probabilities, suggesting these regions are more flexible and can accommodate a wider range of amino acid changes without compromising stability or function. This pattern highlights differential mutational tolerance across the protein sequence.
In the figure, red markers indicate the wild-type residues of the original protein sequence. These serve as a reference point for comparing the predicted likelihood of mutations at each position.
The catalytic triad residues (Ser161, Asp207, and His238) are highlighted in fuchsia. These positions show very low tolerance to mutation, consistent with their essential role in enzymatic catalysis.
Two additional positions illustrate different mutational behaviors predicted by the model:
- I82 (mustard yellow): relatively tolerant region; several substitutions are accepted.
- Trp160 (bright green): highly constrained region; strong preference for wild-type residue.
Overall, positions associated with catalytic activity or structural stability show strong intolerance to mutation, whereas more flexible regions exhibit greater mutational tolerance. These results illustrate how protein language models can infer functional signals directly from sequence data without experimental supervision.
Script link: Colab Notebook
c. (Bonus): Compare predictions to experimental DMS data:
Simonich, C., McMahon, T. E., & Bloom, J. (2026, January). Deep Mutational Scanning of the RSV Fusion Protein Reveals Mutational Constraint and Antibody Escape Mutations. Open Forum Infectious Diseases, 13(Supplement_1), ofaf695-1973.
The experimental scans in Simonich et al. (2026) cover the RSV F ectodomain, testing nearly all single amino-acid mutations. These sequences can be input into a protein language model, and its predictions of mutational effects can be compared directly to the DMS results to assess how well the model captures functional constraints and antibody escape.
2. Latent Space Analysis
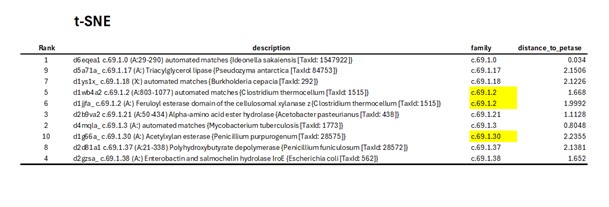
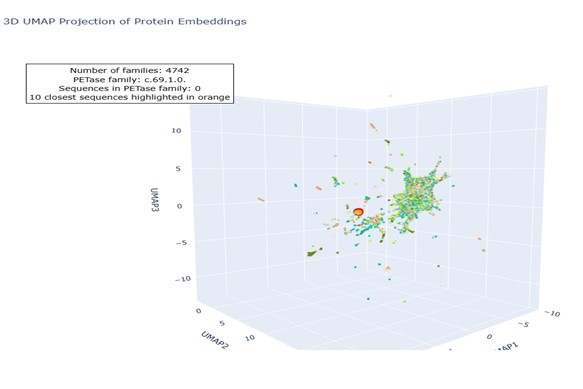
a. Use the provided sequence dataset to embed proteins in reduced dimensionality Protein embeddings were generated for each sequence using a pretrained protein language model. Each sequence was converted into a fixed-length vector by averaging the token-level representations from the final hidden layer. The embeddings were combined into a single matrix and reduced to three dimensions using t-distributed Stochastic Neighbor Embedding (t-SNE), which preserves local relationships so that proteins with similar embeddings appear close in the 3D space. In the final visualization, each protein is represented as a point and colored according to its SCOPe family classification, enabling the identification of structural or functional groups. The dataset contains 4,742 SCOPe families.
This is the link to the improved scritp in case you want to run it with your data: https://colab.research.google.com/drive/1cGdmxSwvy_ueY4OwWHuA1f7LGaTVKXWn#scrollTo=HoCzNbI7rBTL&line=5&uniqifier=1.
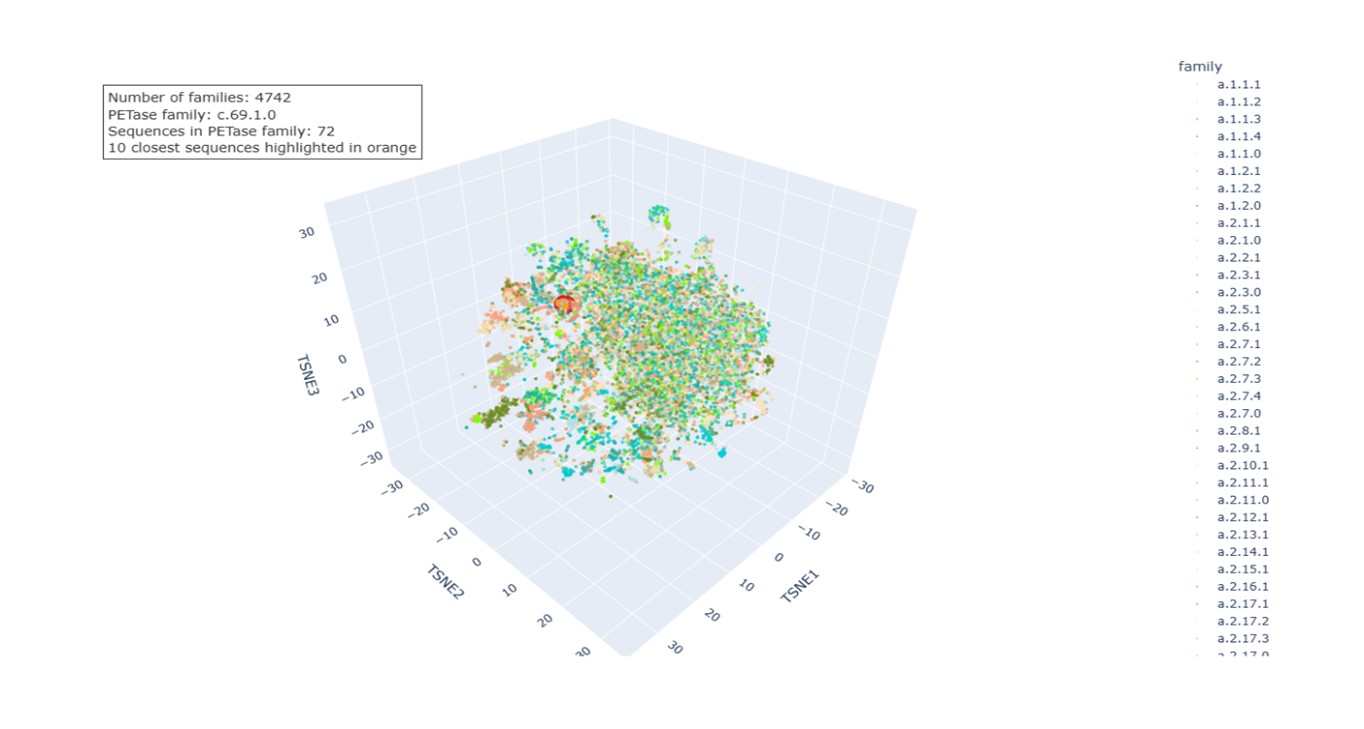
b. Analyze the different formed neighborhoods: do they approximate similar proteins?.
The neighborhoods observed in the t-SNE visualization correspond to groups of proteins with similar embeddings. Because the embeddings capture sequence patterns and structural information learned by the language model, proteins with similar biological characteristics tend to cluster together. This is supported by the coloring based on SCOPe families, as many clusters contain proteins from the same or closely related families, reflecting shared structural folds or evolutionary relationships.
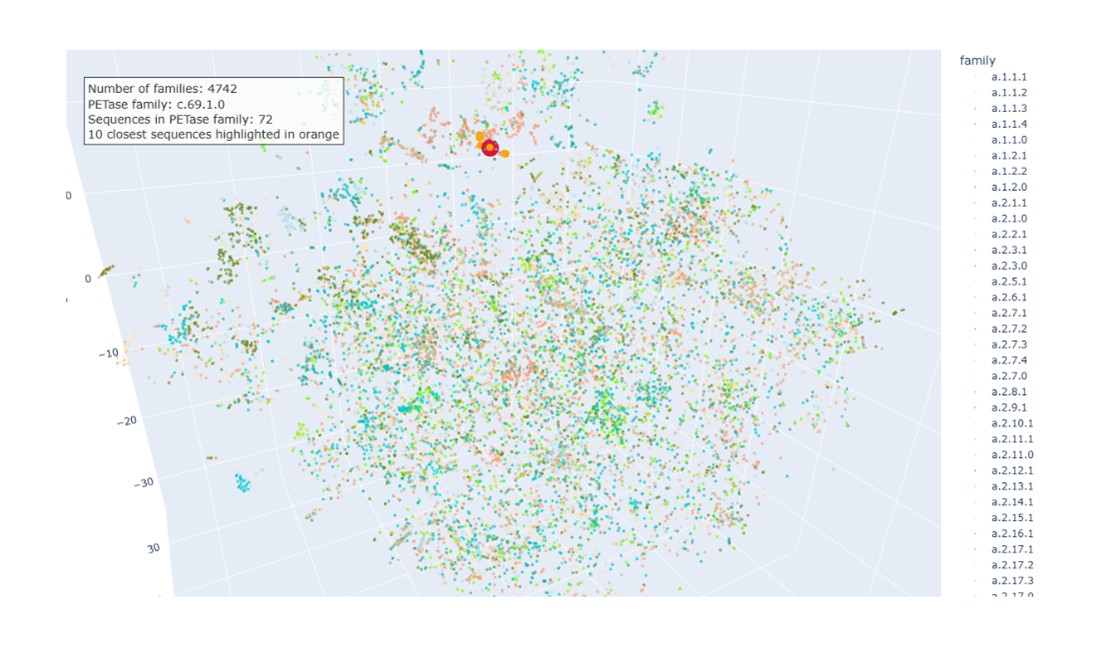
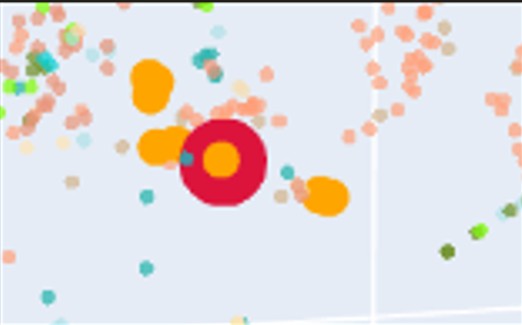
c. Place your protein (PETase) in the resulting map and explain its position and similarity to its neighbors. The PETase sequence was embedded using the same procedure as the dataset proteins and projected into the same t-SNE space. In the visualization:
- PETase highlighted in red.
- SCOPe family c.69.1.0 in salmon (72 sequences).
- Ten nearest neighbors identified by cosine similarity (orange).
PETase is located within the region occupied by members of this family, indicating that the embedding correctly captures its relationship with structurally related proteins.
The identifiers and SCOPe family annotations of the ten closest proteins are shown in the next Table:
- Dimensionality reduction also performed with UMAP, preserving both local and global structure.
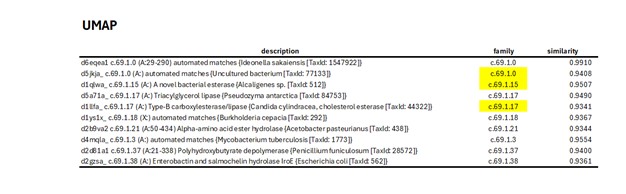
Both dimensionality reduction methods produced similar but not identical results. The sets of the ten nearest proteins identified by t-SNE and Uniform Manifold Approximation and Projection overlap partially, with three sequences differing between the two top-10 lists. This difference (in yellow) arises because t-distributed Stochastic Neighbor Embedding focuses mainly on preserving local neighbor relationships, whereas UMAP attempts to preserve both local and global structure. Consequently, the overall clustering patterns are comparable, but the exact nearest neighbors of PETase vary slightly, illustrating how different dimensionality reduction methods can influence similarity interpretations.
- UMAP Script link: Colab Notebook
C2. Protein Folding
1. Folding
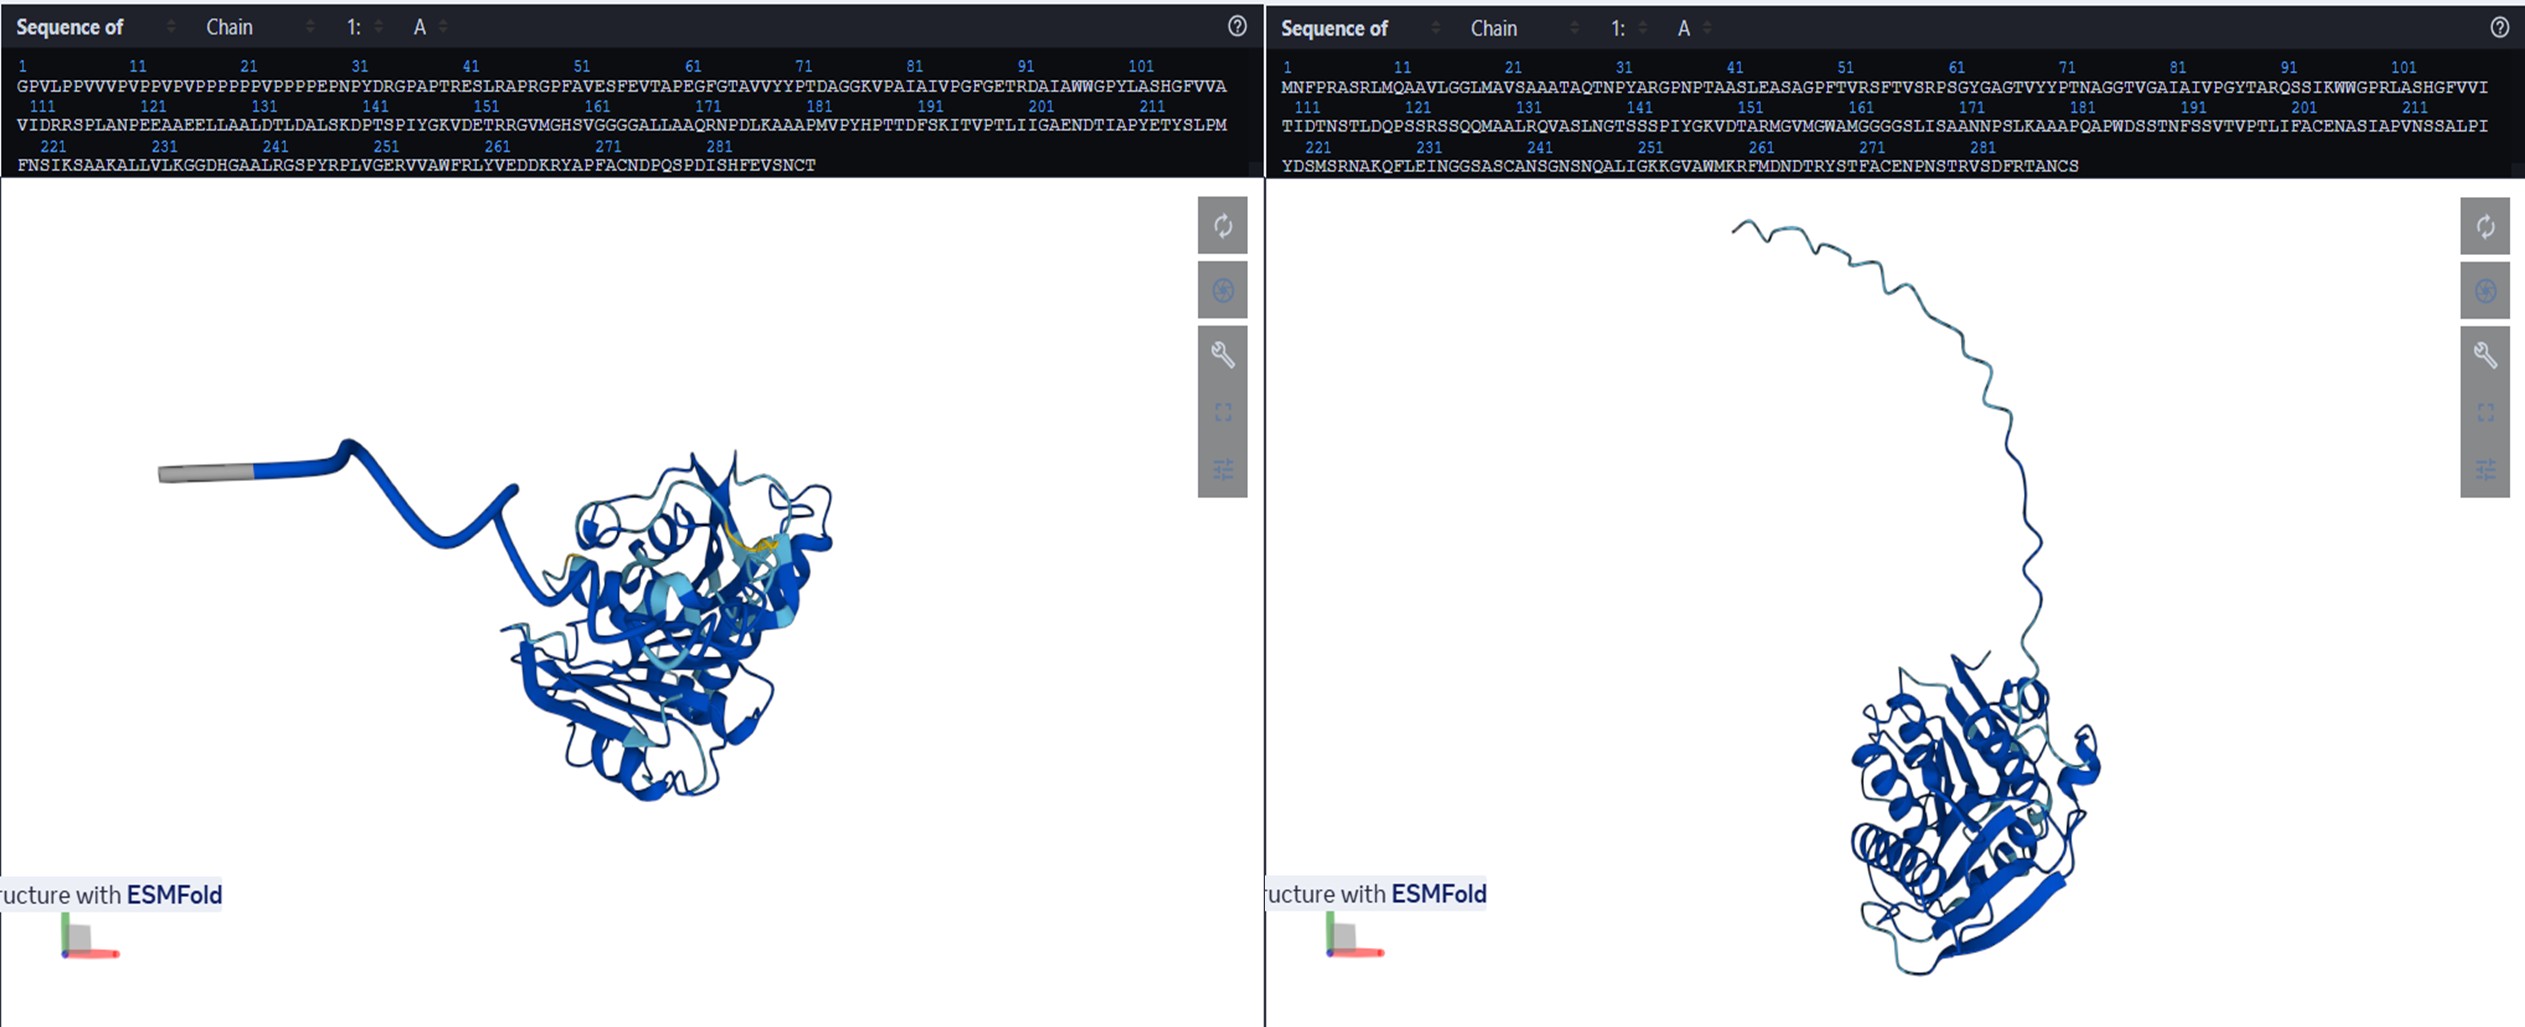
a. Fold your protein with ESMFold. Do the predicted coordinates match your original structure?
The structure was predicted with ESMFold (copies = 1, num_recycles = 3) and visualized with py3Dmol, colored by pLDDT (blue = high confidence, red = low confidence).
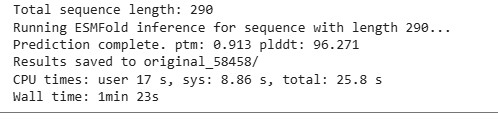
The resulting protein sequence has a total length of 290 residues. The prediction produced a pTM score of 0.913 and an average pLDDT confidence score of 96.27, indicating a high-confidence structural model.
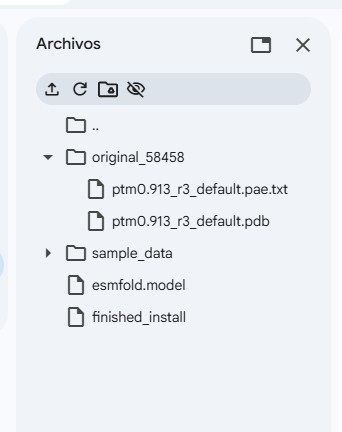
Two output files were generated. The file ptm0.913_r3_default.pdb contains the predicted three-dimensional structure of the protein, including atomic coordinates, and will be used later for structural visualization and further structural analysis. The file ptm0.913_r3_default.pae.txt contains the Predicted Aligned Error (PAE) matrix, which describes the expected positional error between residue pairs and will be referenced in a later section for model confidence evaluation.
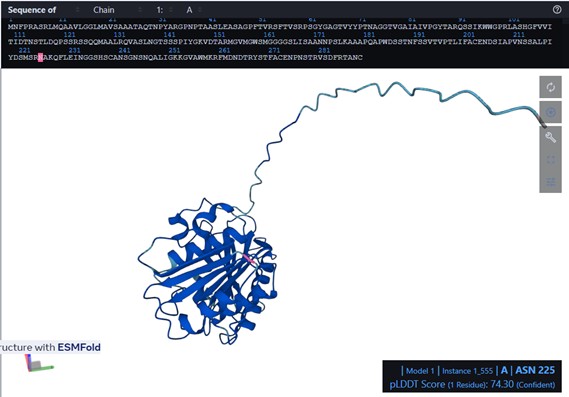
I used ESMFold in ESMatlas.com, which allows you to hover over amino acid positions in the protein and displays the confidence at that position. For example, the protein prediction shows areas in lighter blue. According to ESMAtlas (see the red circle in the next figure), this particular position (ASN 225) has a pLDDT of 74.30%. So a pLDDT of 74.3% indicates that ASN 225’s predicted position is moderately reliable, though there could be some flexibility or uncertainty in its exact placement.
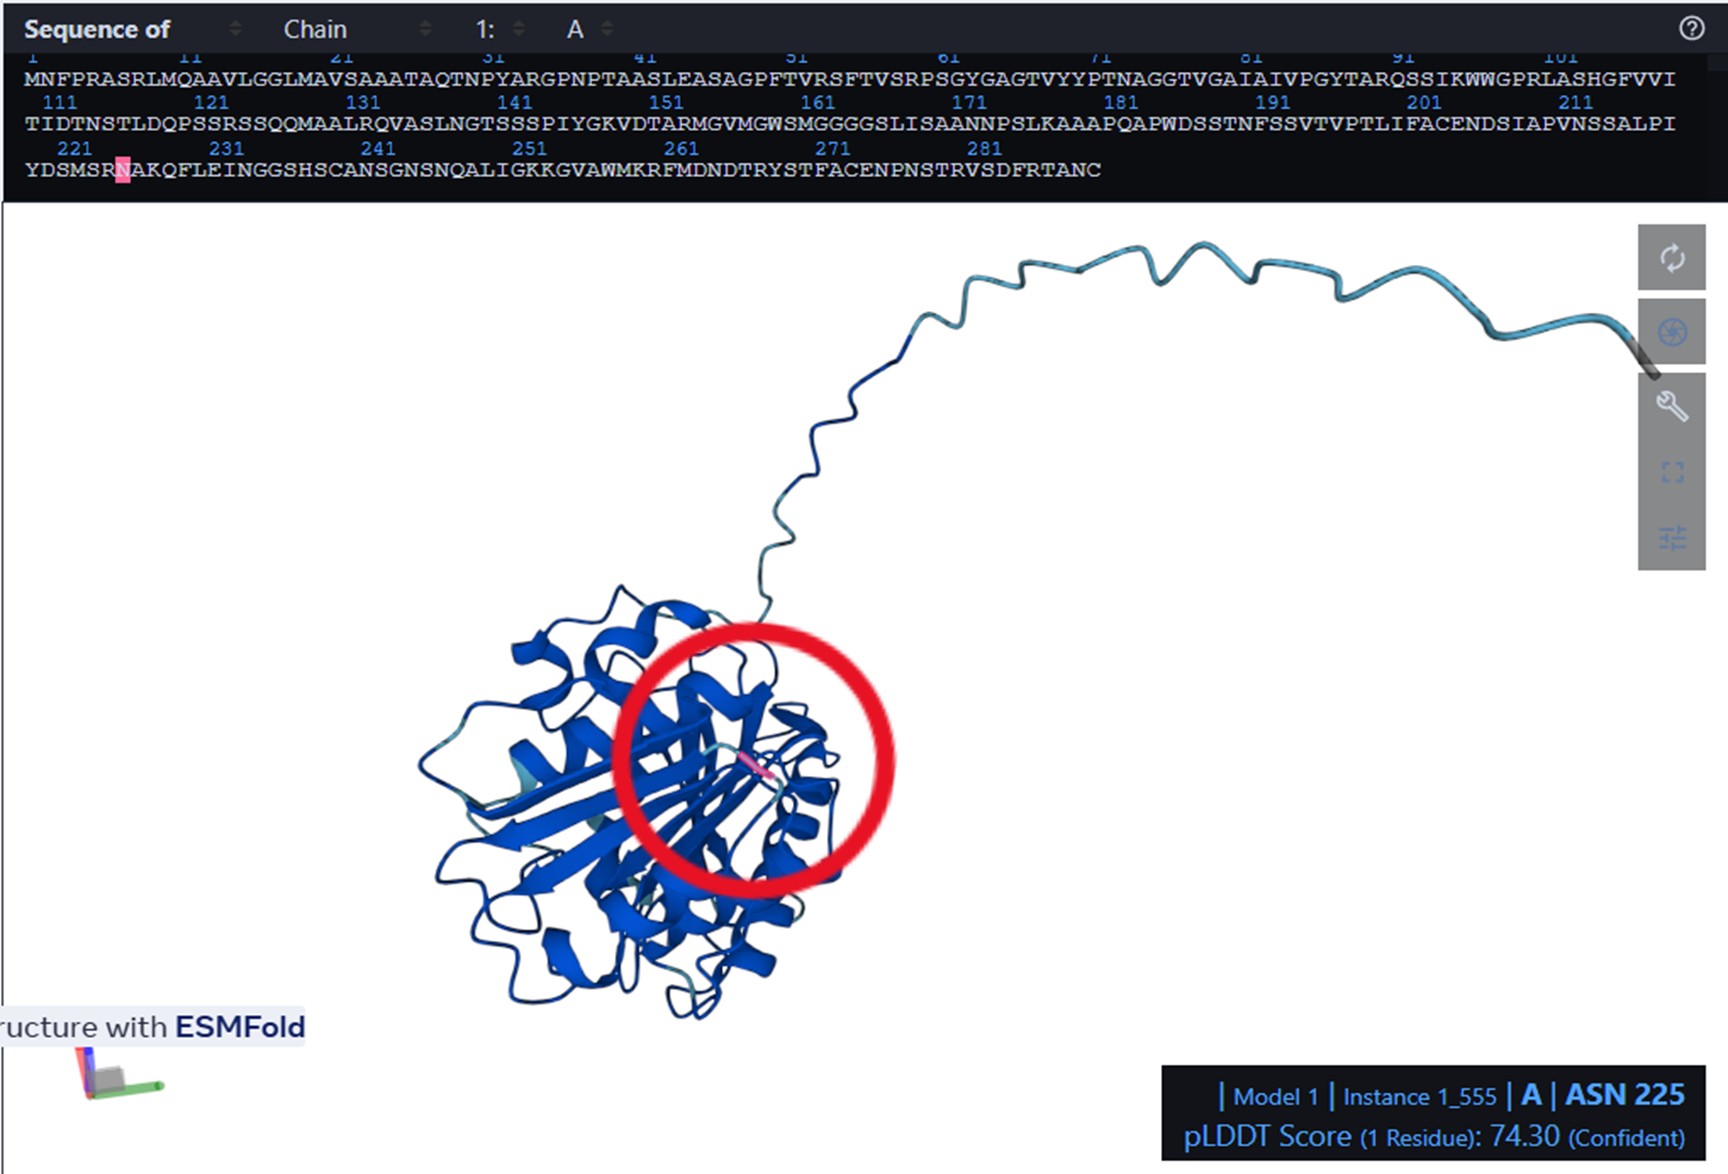
b. Try changing the sequence, first try some mutations, then large segments. Is your protein structure resilient to mutations?b) Try changing the sequence, first try some mutations, then large segments. Is your protein structure resilient to mutations?
I performed a mutation in Catalytic triad to disrupt PETase catalytic function by replacing the three key residues with alanine (S160, D206, H237):
- S160 (Serine) – nucleophile in the active site → mutated to A (Alanine)
- D206 (Aspartate) – stabilizes histidine and participates in proton relay → mutated to A
- H237 (Histidine) – acts as a general base in catalysis → mutated to A
(Positions are marked in red, orange arrow pointing to it; see 3 figures below, level of pLDDT included in the figure for each position before mutation.)
Sequence to be mutated and mutations positions in black:
MNFPRASRLM QAAVLGGLMA VSAAATAQTN PYARGPNPTA ASLEASAGPF TVRSFTVSRP SGYGAGTVYY PTNAGGTVGA IAIVPGYTAR QSSIKWWGPR LASHGFVVIT IDTNSTLDQP SSRSSQQMAA LRQVASLNGT SSSPIYGKVD TARMGVMGWS MGGGGSLISA ANNPSLKAAA PQAPWDSSTN FSSVTVPTLI FACENDSIAP VNSSALPIYD SMSRNAKQFL EINGGSHSCA NSGNSNQALI GKKGVAWMKR FMDNDTRYST FACENPNSTR VSDFRTANCS
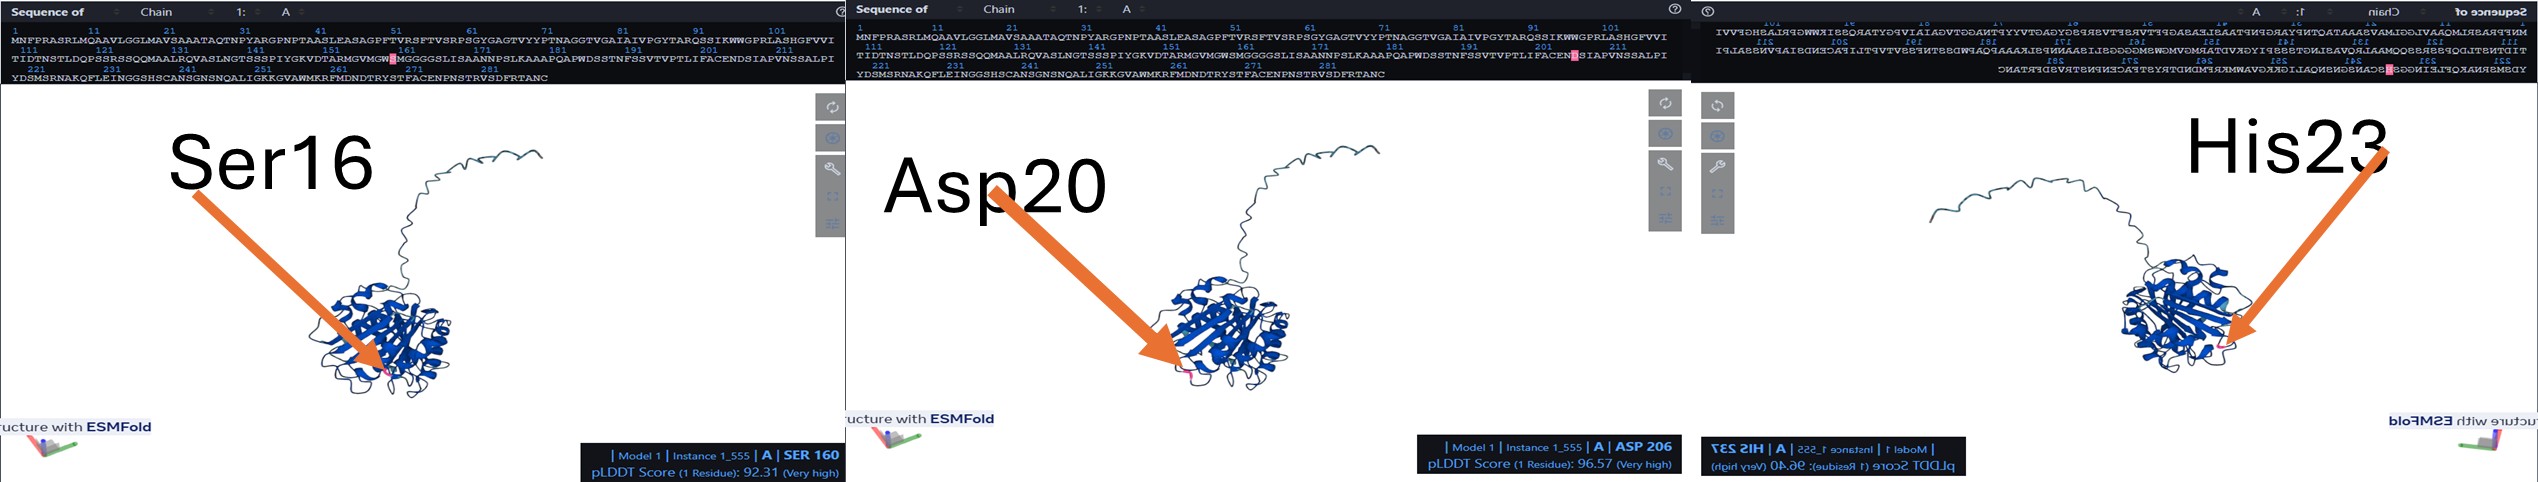
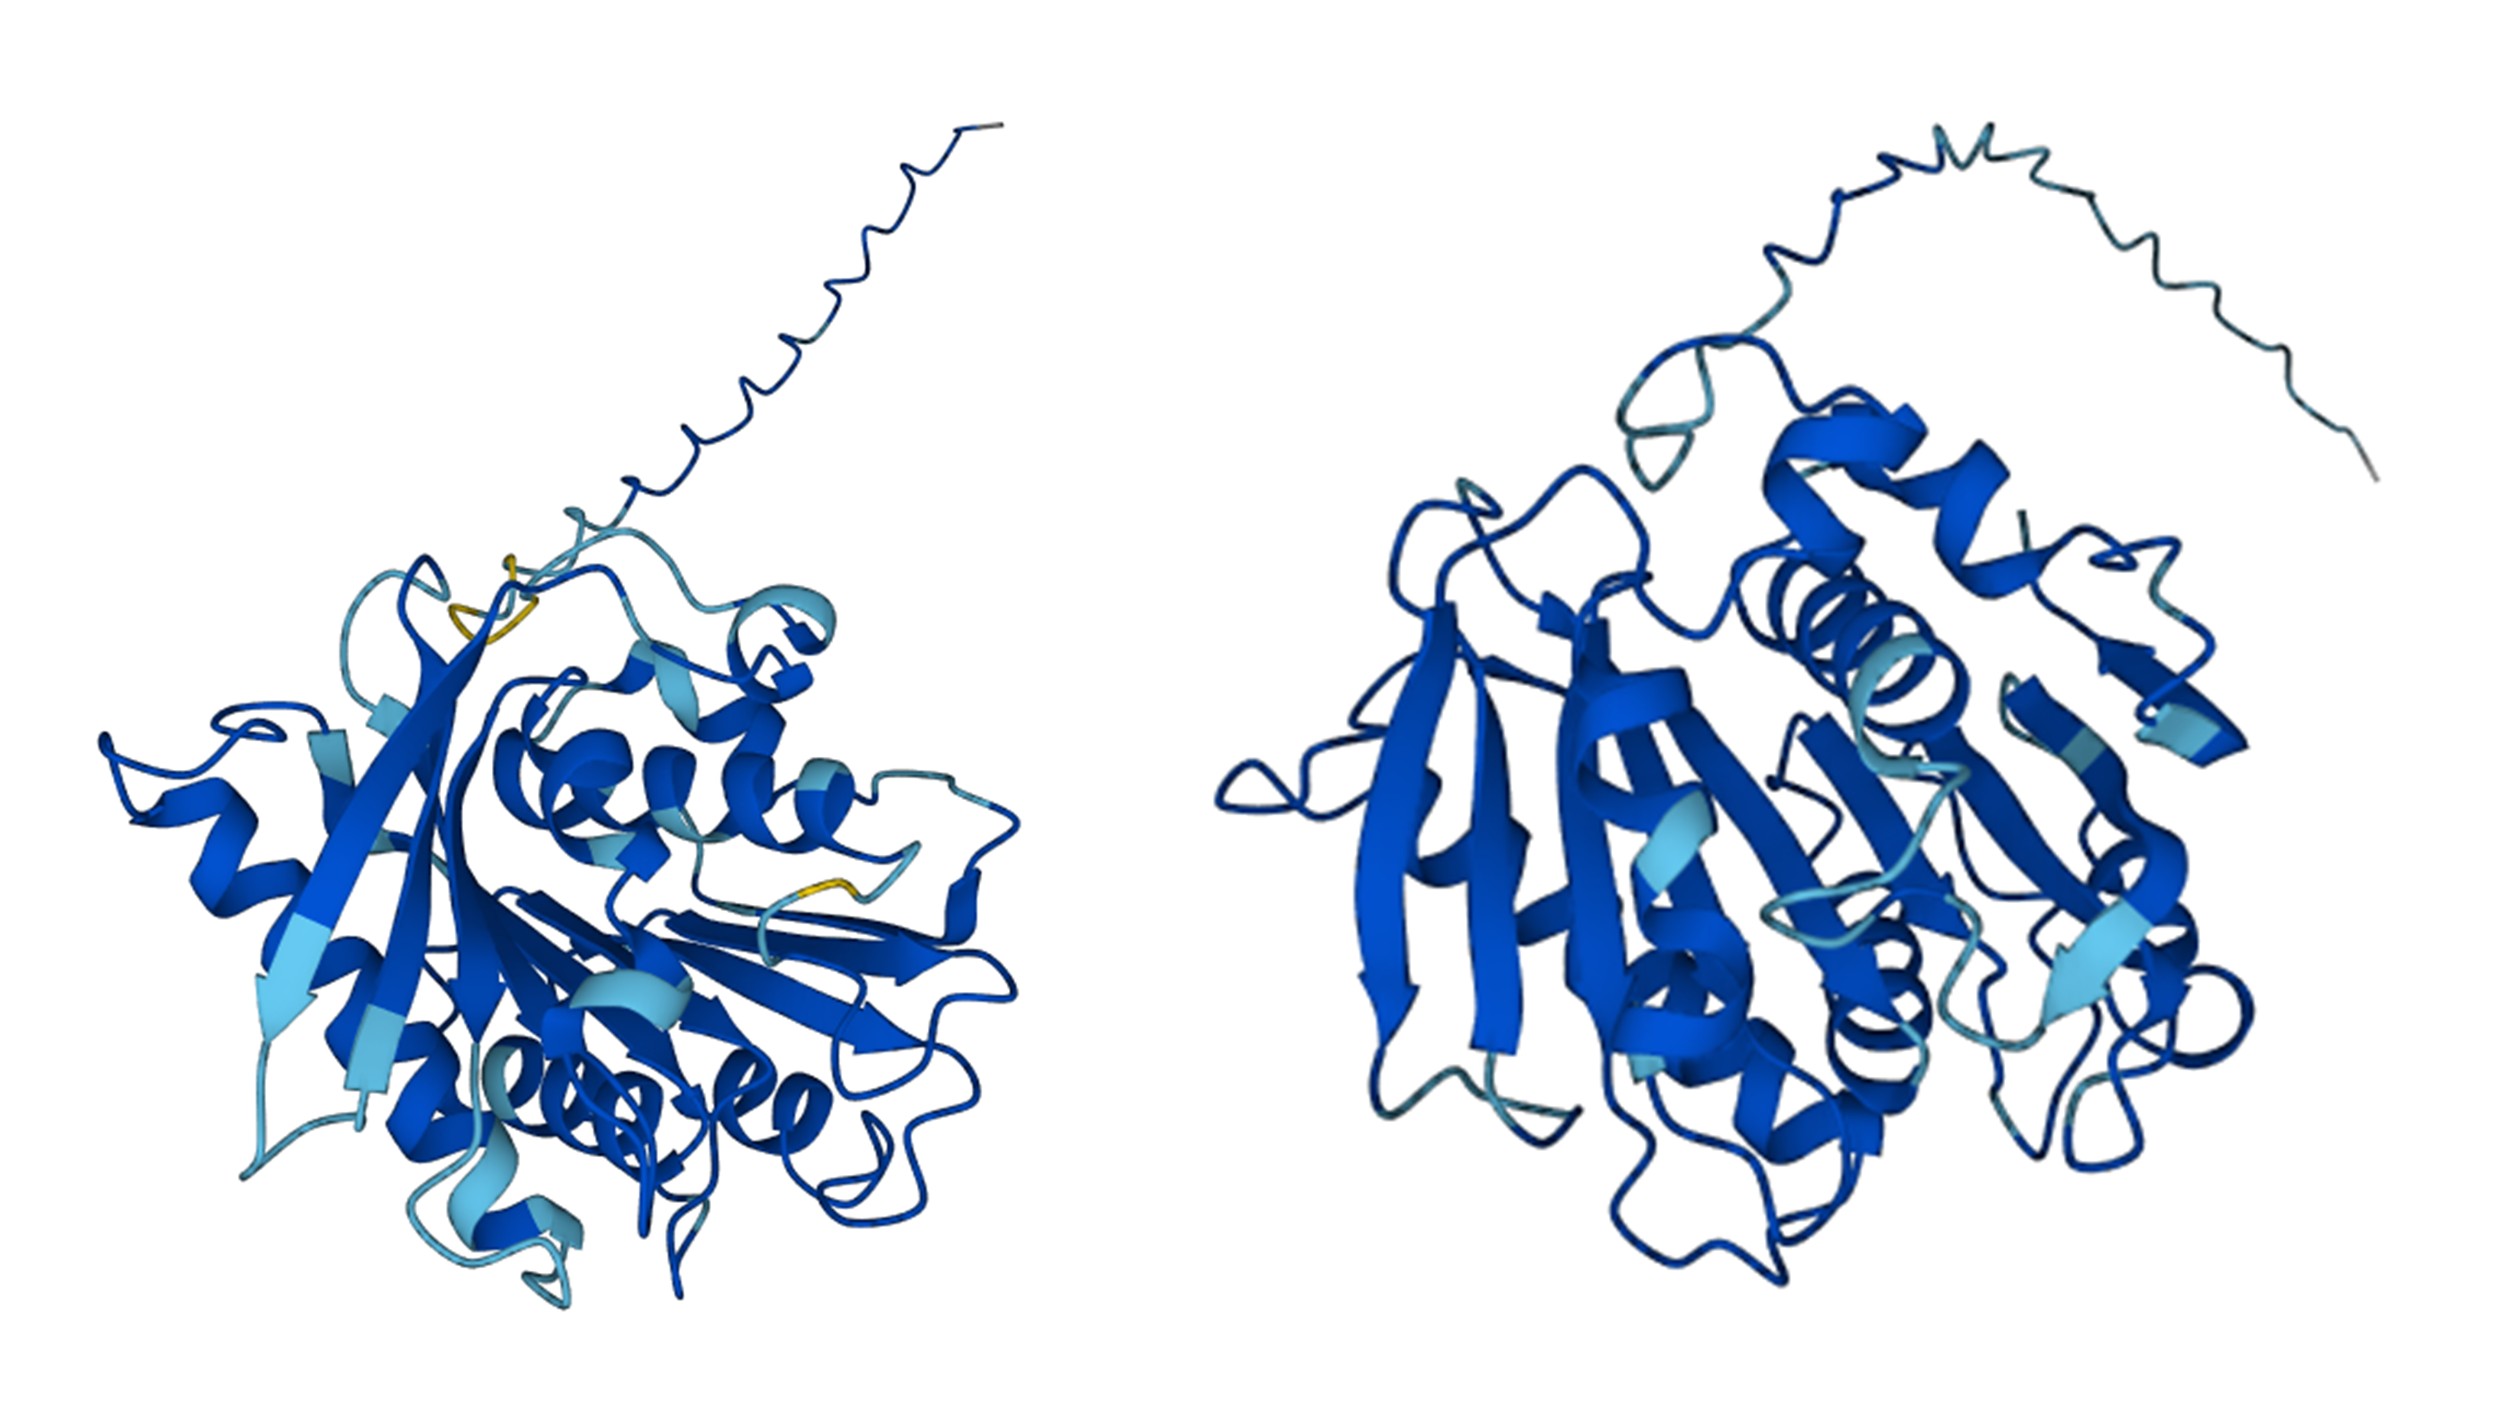
With ESMFold in colab:
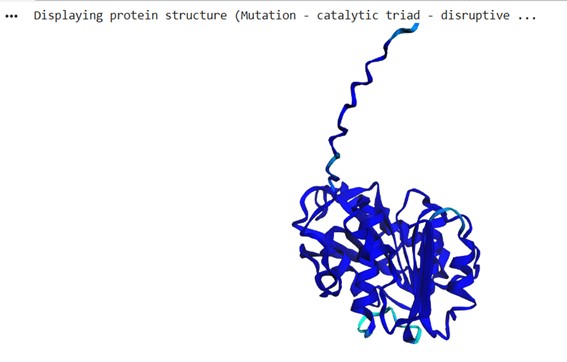
The mutated sequence was inserted in ESMatlas.com (ESMFold): The local changes in color reflect a reduction in confidence/pLDDT near the active site, consistent with structural perturbation. It was faster to get the level of pLDDT in ESMatlas.com (ESMFold) where I insert the mutated sequence after.
Most of the protein remains blue, but certain areas got light blue meaning that the pLDDT falls nearly below 90% of confidence. The mutations effectively target the catalytic function in the three positions without dramatically altering the overall fold.
C3. Protein Generation
Inverse-Folding a protein: Let’s now use the backbone of your chosen PDB to propose sequence candidates via ProteinMPNN.
a. Inverse protein folding with ProteinMPNN using backbone from ptm0.913_r3_default.pdb.
The input backbone for sequence design was the 3D structure predicted by ESMFold for PETase, stored in: /content/original_58458/ptm0.913_r3_default.pdb
b. Pretrained model weights v_48_020.pt were downloaded from Hugging Face.
c. Model parameters:
- Version: v_48_020
- Edges: 48
- Hidden dimension: 128
- Encoder layers: 3
- Decoder layers: 3
- Training noise: 0.2 Å
- Backbone noise: 0.0 Å
d. Native sequence evaluated: Score = 1.4683 (negative log-likelihood).
e. Designed sequence generated (temperature = 0.1):
GPVLPPVVVPVPPVPVPPPPPPVPPPPEPNPYDRGPAPTRESLRAPRGPFAVESFEVTAPEGFGTAVVYYPTDAGGKVPAIAIVPGFGETRDAIAWWGPYLASHGFVVAVIDRRSPLANPEEAAEELLAALDTLDALSKDPTSPIYGKVDETRRGVMGHSVGGGGALLAAQRNPDLKAAAPMVPYHPTTDFSKITVPTLIIGAENDTIAPYETYSLPMFNSIKSAAKALLVLKGGDHGAALRGSPYRPLVGERVVAWFRLYVEDDKRYAPFACNDPQSPDISHFEVSNCT
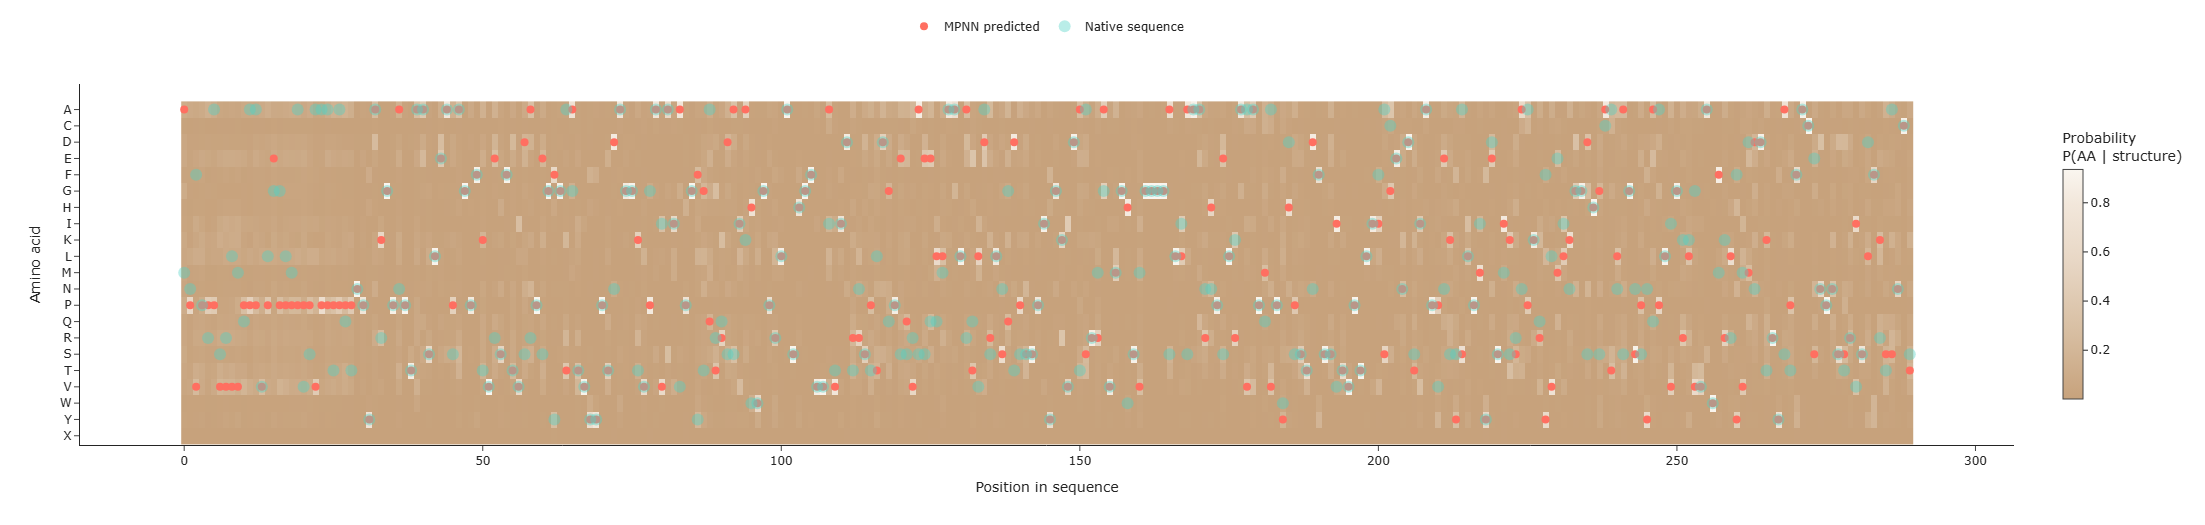
f. ProteinMPNN predicts the probability of each of the 21 amino acids at every position of the sequence. The predicted log-probabilities were converted into probabilities using the exponential function and averaged to obtain a position-specific probability matrix.
These probabilities were visualized using a heatmap, where: • X-axis: sequence position • Y-axis: amino acid type • Color intensity: predicted probability
Two markers were added to the heatmap: • Coral points: amino acids with the highest predicted probability at each position (ProteinMPNN prediction). • Jade points: residues from the native sequence.
This visualization allows a direct comparison between the predicted optimal sequence and the original protein sequence, which account 45% of position recovery between them.
- Script link: Colab Notebook
Questions Answered
Analyze predicted sequence probabilities vs original:
ProteinMPNN predicted sequence has lower negative log-likelihood (0.7572) compared to the native (1.4683), showing higher compatibility. Heatmap highlights conserved and flexible positions, sequence recovery ~0.455.Input designed sequence into ESMFold and compare:
- Prediction visualized in esmatlas.com.
- Predicted structure shows local variations (color differences) but overall fold largely preserved.
The ESMFold-predicted structure shows regions in light blue and yellow absent in the original. These colors reflect lower pLDDT confidence, indicating higher uncertainty or flexibility in the predicted positions. The designed sequence preserves the overall fold, but local substitutions introduce slight variability in some regions, while dark blue areas remain well-defined and conserved.
Part D. Group Brainstorm on Bacteriophage Engineering
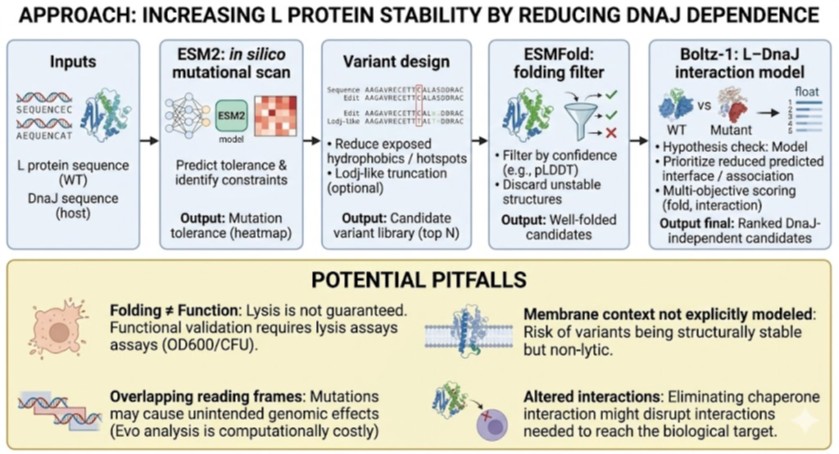
Bacteriophage Engineering Proposal: L Protein Stabilization
Primary Goal: Increased stability (easiest).
Specific Approach: Engineering DnaJ-independence by reducing chaperone-recognition signals while preserving the structural scaffold of the L protein.
1. Computational Tools and Pipeline Justification
To achieve this goal, we propose a three-step computationally efficient pipeline:
Step 1: Sequence-level Mutational Scanning using ESM2
- Approach: We will perform a zero-shot in silico mutational scan across the L protein sequence using the ESM2 Protein Language Model (PLM). We aim to identify exposed hydrophobic patches (typical DnaJ recognition motifs) and propose polar/hydrophilic substitutions.
- Why this helps: ESM2 has learned deep evolutionary constraints across millions of protein sequences. It allows us to rapidly differentiate between highly constrained residues (which are structurally vital and “untouchable”) and mutation-tolerant positions. This ensures we only disrupt chaperone-binding motifs without breaking the core evolutionary scaffold of the protein, all at a fraction of the computational cost of molecular dynamics.
Step 2: Rapid Structural Filtering using ESMFold
- Approach: The top candidate sequences from the ESM2 scan will be predicted using ESMFold. We will filter out any variants that collapse, show low pLDDT (confidence) scores, or have a high RMSD compared to the Wild-Type (WT) backbone.
- Why this helps: While ESM2 evaluates sequence-level fitness, we need explicit 3D structural validation. ESMFold is significantly faster than AlphaFold2, making it ideal for high-throughput filtering. This step ensures that our hydrophilic mutations do not inadvertently destroy the L protein’s ability to fold independently.
Step 3: Complex Modeling using Boltz-1
- Approach: We will model the L protein + DnaJ complex for both the WT and our top folded mutant candidates. We will analyze the predicted interface contacts and Predicted Aligned Error (PAE) to assess binding affinity.
- Why this helps: Folding correctly in isolation is not enough; we must explicitly prove reduced chaperone dependency. By comparing the mutant-DnaJ interface against the WT-DnaJ interface, we can prioritize variants that maintain a stable fold but show a significantly weakened or abolished interaction with the DnaJ chaperone.
2. Potential Pitfalls
Pitfall 1: Overlapping Reading Frames and Genomic Constraints.
Phage genomes are highly compact, meaning the DNA sequence encoding the L protein might also encode parts of other proteins or regulatory elements in alternative reading frames. Our targeted mutations could have unintended, fatal consequences for the phage’s overall viability. While genomic foundation models like Evo could assess these genome-wide constraints, their computational cost is prohibitive for our current scope.Pitfall 2: The Stability vs. Function Trade-off.
ESMFold guarantees that the protein adopts a stable 3D conformation in solution, but it does not guarantee biological function (membrane lysis). Lytic activity heavily depends on complex factors like membrane insertion dynamics, oligomerization, and reaction kinetics. Furthermore, completely abolishing chaperone interaction might inadvertently prevent the L protein from being properly delivered to its target membrane.