Week 10 HW: Advanced Imaging & Measurement Technology
PART A: Final Project
1. Please identify at least one (ideally many) aspect(s) of your project that you will measure. It could be the mass or sequence of a protein, the presence, absence, or quantity of a biomarker, etc.
In this project, it would be recommended to measure several aspects related to microbial adhesion proteins involved in biofilm formation on microplastics. These include the molecular weight and amino acid sequence of candidate adhesion proteins, as well as their relative abundance. It would also be useful to measure the presence and quantity of biofilm formation on synthetic polymer surfaces. Additionally, evaluating protein–surface interactions, such as binding affinity to plastics, would provide insight into adhesion mechanisms. Finally, physicochemical properties such as hydrophobicity and surface charge could be analyzed, as they are known to influence protein adhesion behavior.
2. Please describe all of the elements you would like to measure, and furthermore describe how you will perform these measurements.
In this project, I would like to measure several elements related to microbial adhesion proteins and biofilm formation on microplastics. First, I would like to determine the molecular weight and amino acid sequence of candidate adhesion proteins using liquid chromatography–mass spectrometry (LC-MS). This would involve digesting the proteins with trypsin to generate peptides, followed by separation using liquid chromatography and analysis by mass spectrometry to obtain mass-to-charge ratios and reconstruct the protein sequence.
I would also like to investigate protein structure and folding using native and denatured mass spectrometry. By comparing the charge state distributions under different conditions, I could infer differences in protein conformation and stability.
Additionally, I would like to measure protein–surface interactions by performing adhesion assays, where proteins are incubated with synthetic polymer surfaces and the amount of bound protein is quantified.
I would also like to evaluate biofilm formation using assays such as crystal violet staining to quantify biomass attached to surfaces.
Finally, I would like to analyze physicochemical properties such as hydrophobicity and surface charge using computational tools, as these factors influence protein adhesion behavior.
3. What are the technologies you will use (e.g., gel electrophoresis, DNA sequencing, mass spectrometry, etc.)? Describe in detail.
In this project, I would use several complementary analytical and experimental technologies to study microbial adhesion proteins and biofilm formation.
First, I would use liquid chromatography–mass spectrometry (LC-MS) to analyze protein molecular weight and amino acid sequence. Proteins would be digested with trypsin into peptides, which would then be separated by liquid chromatography and analyzed by mass spectrometry to determine their mass-to-charge ratios. Tandem mass spectrometry (MS/MS) would be used to fragment peptides and reconstruct their amino acid sequences.
I would also use native and denatured mass spectrometry to investigate protein structure and folding. By comparing charge state distributions under different conditions, this technique allows for the analysis of protein conformation and structural stability.
To study protein–surface interactions, I would use adhesion assays, where proteins are incubated with microplastic surfaces and the amount of bound protein is measured.
For biofilm quantification, I would use a crystal violet staining assay, which measures the total biomass attached to a surface through absorbance.
Additionally, I would use computational tools for sequence analysis and structure prediction, such as bioinformatics software and protein modeling platforms, to evaluate properties like hydrophobicity, charge, and predicted 3D structure.
Together, these technologies provide a comprehensive approach to analyzing protein identity, structure, and function in biofilm formation.
Waters Part I — Molecular Weight
1. Calculation of Molecular Weight for eGFP
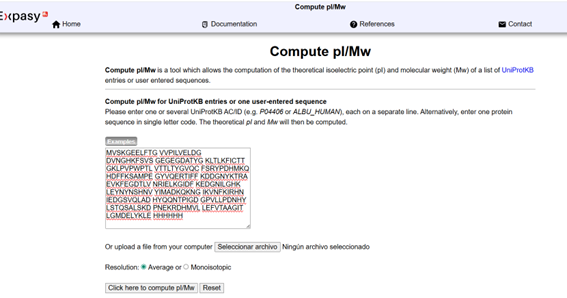
Based on the predicted amino acid sequence of eGFP (see below) and any known modifications, what is the calculated molecular weight? You can use an online calculator such as:
https://web.expasy.org/compute_pi/
Note: This contains a His-purification tag (HHHHHH) and a linker (the LE before it).
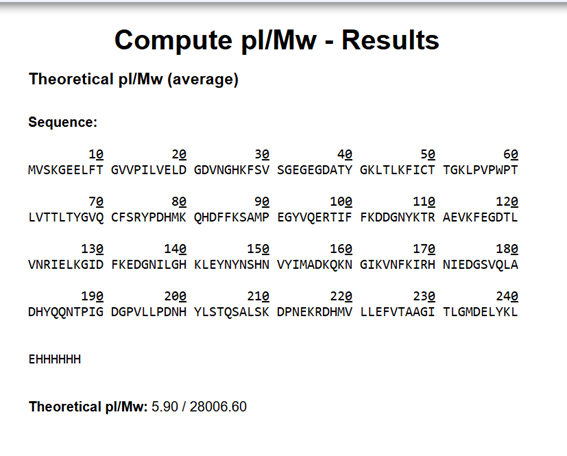
The sequence was inserted into the ExPASy calculator and obtained a molecular weight of 28,006.60 Da and an isoelectric point (pI) of 5.90. The molecular weight indicates the total mass of the protein, including the initiator methionine (M), the C-terminal His-tag (HHHHHH), and the linker sequence (LE) present in the construct. The isoelectric point indicates the pH at which the protein has no net charge.
2. Calculate the molecular weight of the eGFP using the adjacent charge state approach described in the recitation. Select two charge states from the intact LC-MS data (Figure 1) and:
Figure 1. Mass Spectrum of intact eGFP protein from the Waters Xevo G3 LC-MS (a mass spectrometer with 30,000 resolution) with individual charge state peaks labeled with m/z values.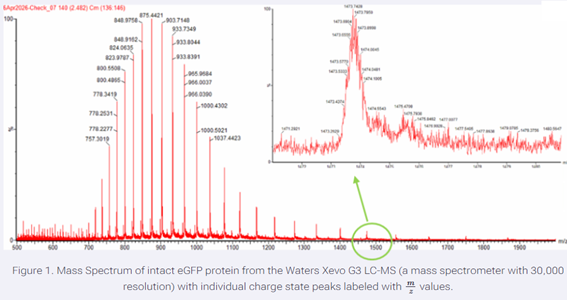
2.1 determine z for each adjacent pair of peaks (n, n+1) using:
To determine the charge state (z) from adjacent peaks, the relationship between two consecutive charge states (n and n+1) is used, including the exact proton mass (mH = 1.007276 Da):
z = (m/zₙ₊₁ − mH) / (m/zₙ − m/zₙ₊₁)
Using two adjacent peaks from the spectrum:
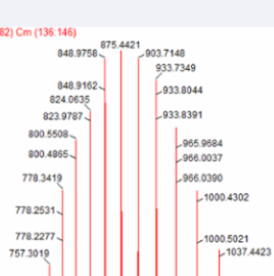
m/zₙ = 848.9758
m/zₙ₊₁ = 875.4421
Substituting:
z = (875.4421 − 1.007276) / (848.9758 − 875.4421)
z = 874.4348 / (−26.4663)
z ≈ −33.06
Since the charge state cannot be negative, the absolute value is taken:
z ≈ 33.06
So, the peak at m/z = 848.98 corresponds to a charge state of +33, and the adjacent peak at m/z = 875.44 corresponds to +32.
The term mH = 1.007276 Da corresponds to the mass of a proton (H⁺). In electrospray ionization (ESI), proteins gain protons to become positively charged ions, written as [M + zH]ᶻ⁺. Each proton adds both one positive charge and a small amount of mass (~1.007276 Da). For this reason, this value is included in the equation.
The negative value obtained comes from the order of the m/z values in the denominator and does not have physical meaning.
2.2 Determine the molecular weight (MW) of the protein using the relationship between m/zₙ, MW, and z.
The molecular weight (MW) of the protein is calculated using the relationship:
MW = (z × m/zₙ) − z
Using the determined charge state:
z ≈ 33.06
m/zₙ = 848.9758
Substituting:
MW = (33.06 × 848.9758) − 33.06
MW = 28067.15 − 33.06
MW ≈ 28,034.09 Da
Therefore, the molecular weight of the protein is approximately 28.03 kDa, which is consistent with the expected mass of eGFP.
This calculation uses a simplified approach assuming a proton mass of approximately 1 Da, which is sufficient for this analysis.
2.3 Calculate the accuracy of the measurement using the deconvoluted MW from 2.2 and the predicted weight of the protein from 2.1 using:
The mass accuracy is calculated using the following expression:
ppm error = (|MW_exp − MW_theo| / MW_theo) × 10^6
Using the obtained values:
MW_exp = 28,034.09 Da
MW_theo = 28,006.60 Da
Substituting:
ppm = (|28,034.09 − 28,006.60| / 28,006.60) × 10^6
ppm = (27.49 / 28,006.60) × 10^6
ppm ≈ 981 ppm
Therefore, the mass accuracy is approximately 981 ppm.
This value is significantly higher than the acceptable range of 30–50 ppm, which suggests that there may be an error in the calculation or that the selected peaks were not optimal for determining the charge state.
2.4 Can you observe the charge state for the zoomed-in peak in the mass spectrum for the intact eGFP? If yes, what is it? If no, why not? No, the charge state cannot be directly observed from the zoomed-in peak at ~1470 m/z.
In the zoomed region, the signal appears as a broad peak without resolved isotopic structure. Since the isotopic peaks are not visible, it is not possible to determine the charge state using isotopic spacing (which would require resolving peaks separated by 1/z).
Additionally, this peak does not follow the main charge state distribution observed in the spectrum, as it appears isolated and does not form part of a consistent series of adjacent charge states.
Therefore, the charge state cannot be determined directly from this peak, and it is likely due to a different species (such as a contaminant or adduct) rather than the main protein signal.
Waters Part II — Secondary/Tertiary structure
We will analyze eGFP in its native, folded state and compare it to its denatured, unfolded state on a quadrupole time-of-flight MS. We will be doing MS-only analysis (no liquid chromatography, also known as “direct infusion” experiments) on the Waters Xevo G3-QToF MS.
1. Based on learnings in the lab, please explain the difference between native and denatured protein conformations. For example, what happens when a protein unfolds? How is that determined with a mass spectrometer? What changes do you see in the mass spectrum between the native and denatured protein analyses (Figure 2)?
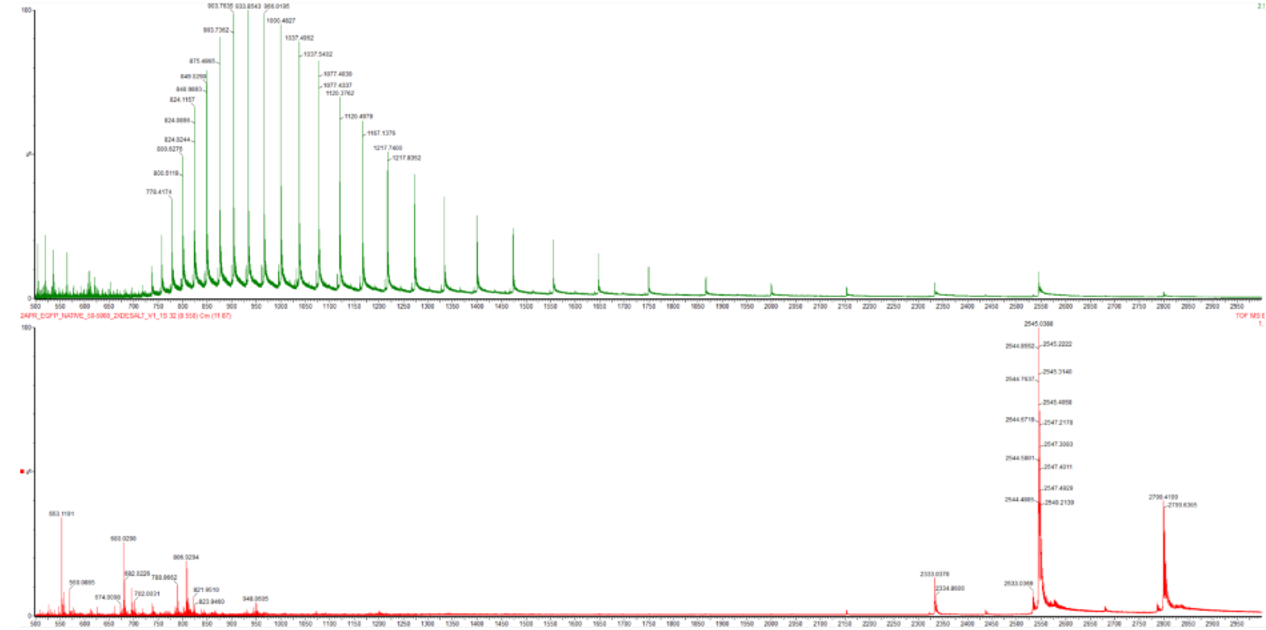
Figure 2. Comparison of the mass spectra between denatured (top) and native (bottom) eGFP standard on the Waters Xevo G3 QTof MS.
Native proteins have a compact and well-folded structure, while denatured proteins are unfolded and more extended. When a protein unfolds, its higher-order structure is disrupted, which increases the exposed surface area.
This structural change affects how the protein is ionized in electrospray ionization (ESI). In the native state, fewer protonation sites are accessible, so the protein acquires fewer charges. In contrast, in the denatured state, more surface area is exposed, allowing more protonation sites and resulting in higher charge states.
This difference is clearly observed in the mass spectrum. Native proteins show a narrow charge state distribution with lower charge states (higher m/z values), indicating a more uniform and stable conformation. On the other hand, denatured proteins show a broader charge state distribution with higher charge states (lower m/z values), reflecting increased conformational heterogeneity.
In Figure 2, the denatured protein (top) shows peaks shifted to lower m/z values, corresponding to higher charge states, while the native protein (bottom) shows peaks at higher m/z values with fewer charge states. Additionally, the denatured spectrum is more spread out, indicating the presence of multiple conformations in solution.
Therefore, the charge state distribution and peak position in the mass spectrum provide information about both the folding state and the conformational dynamics of the protein.
2. Zooming into the native mass spectrum of eGFP from the Waters Xevo G3 QTof MS (see Figure 3), can you discern the charge state of the peak at ~2800 m/z? What is the charge state? How can you tell?
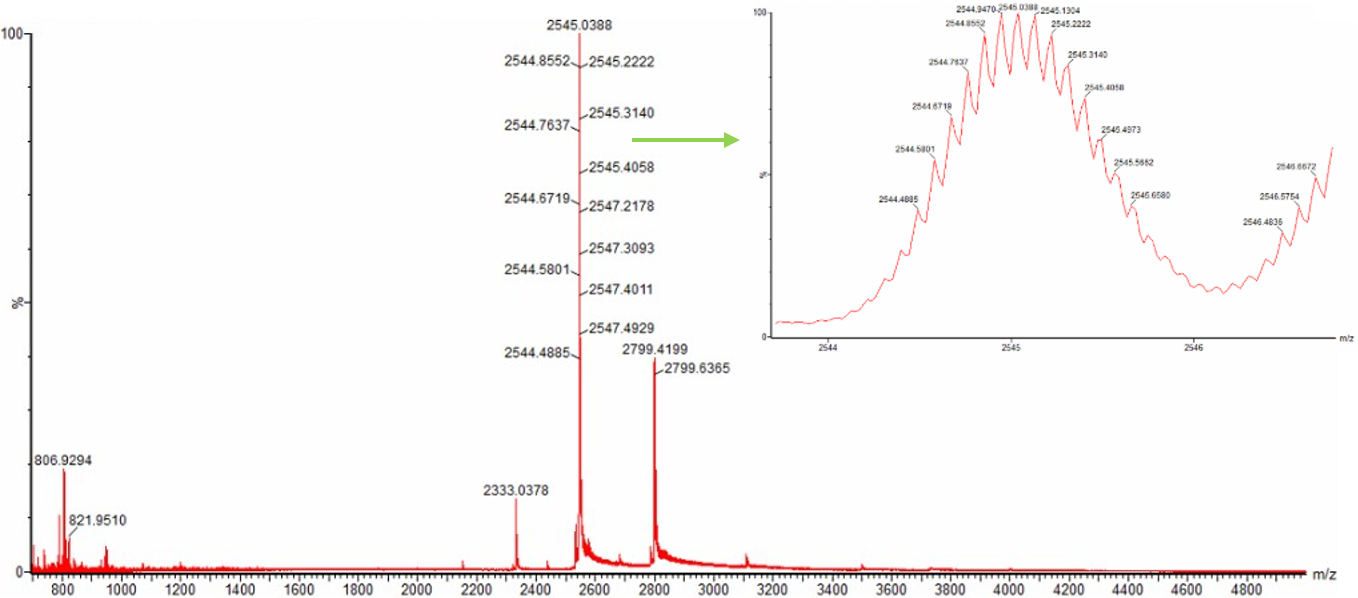
Figure 3. Native eGFP mass spectrum from the Waters Xevo G3 Q-Tof MS. The inset is a zoomed-in view of the charge state at ~2800 m/z on a mass spectrometer with 30,000 resolution.
No, the charge state of the peak at ~2800 m/z cannot be directly determined.
Although the peak at approximately 2799 m/z is clearly visible in the spectrum, there is no resolved isotopic structure shown for this peak. Without visible isotopic spacing, it is not possible to determine the charge state using the relationship spacing = 1/z.
In contrast, another peak around ~2545 m/z shows clear isotopic resolution, which would allow charge determination. However, for the ~2800 m/z peak, this information is not available.
Therefore, the charge state cannot be directly determined from this peak.
Waters Part III — Peptide Mapping - primary structure
We will digest the eGFP protein standard into peptides using trypsin (an enzyme that selectively cleaves the peptide bond after Lysine (K) and Arginine (R) residues. The resulting peptides will be analyzed on the Waters BioAccord LC-MS to measure their molecular weights and fragmented to confirm the amino acid sequence within each peptide – generating a “peptide map”. This process is used to confirm the primary structure of the protein.
There are a variety of tools available online to calculate protein molecular weight and predict a list of peptides generated from a tryptic digest. We will be using tools within the online resource Expasy (the bioinformatics resource portal of the Swiss Institute of Bioinformatics (SIB)) to predict a list of tryptic peptides from eGFP.
1. How many Lysines (K) and Arginines (R) are in eGFP? Please circle or highlight them in the eGFP sequence given in Waters Part I question 1 above. (Note: adding the sequence to Benchling as an amino acid file and clicking biochemical properties tab will show you a count for each amino acid).
MVS**K**GEELFTG VVPILVELDG DVNGHKFSVS GEGEGDATYG KLTLKFICTTGKLPVPWPTL VTTLTYGVQC FSRYPDHMKQ HDFFKSAMPE GYVQERTIFF
KDDGNYKTRA EVKFEGDTLV NRIELKGIDF KEDGNILGHK LEYNYNSHNV
YIMADKQKNG IKVNFKIRHN IEDGSVQLAD HYQQNTPIGD GPVLLPDNHY
LSTQSALSKD PNEKRDHMVL LEFVTAAGIT LGMDELYKLE HHHHHH
MVSKGEELFTG VVPILVELDG DVNGHKFSVS GEGEGDATYG KLTLKFICTT GKLPVPWPTL VTTLTYGVQC FSRYPDHMKQ HDFFKSAMPE GYVQERTIFF KDDGNYKTRA EVKFEGDTLV NRIELKGIDF KEDGNILGHK LEYNYNSHNV YIMADKQKNG IKVNFKIRHN IEDGSVQLAD HYQQNTPIGD GPVLLPDNHY LSTQSALSKD PNEK****RDHMVL LEFVTAAGIT LGMDELYKLE HHHHHH
The eGFP amino acid sequence was analyzed to determine the number of trypsin cleavage sites. Trypsin specifically cleaves peptide bonds at the C-terminal side of Lysine (K) and Arginine (R) residues.
- Total number of Lysine (K) residues: 20
- Total number of Arginine (R) residues: 6
These residues represent the potential cleavage sites and define the set of peptides generated during tryptic digestion.
2. How many peptides will be generated from tryptic digestion of eGFP?
- Navigate to https://web.expasy.org/peptide_mass/
- Copy/paste the sequence above into the input box in the PeptideMass tool to generate expected list of peptides.
- Use Figure 4 below as a guide for the relevant parameters to predict peptides from eGFP.
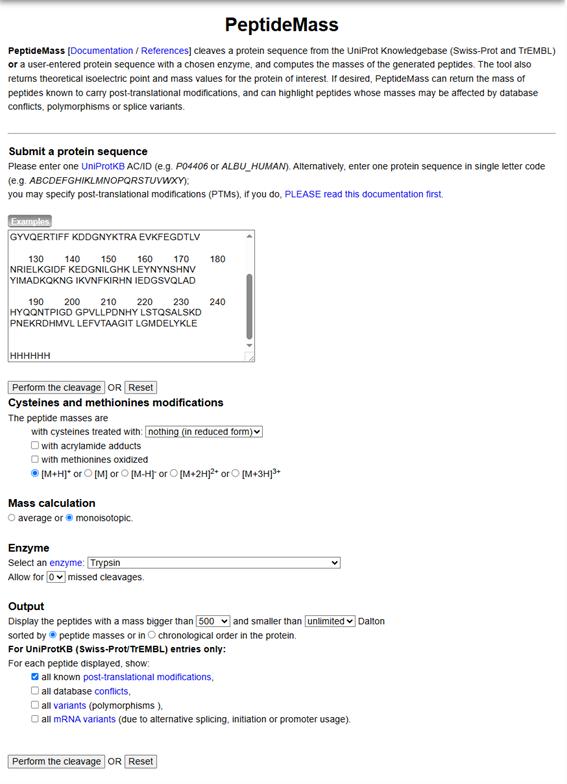
Figure 4. Example conditions for predicting the number of tryptic peptides from the eGFP standard. Please replicate all parameters shown above.
- Click “Perform the Cleavage” button in the PeptideMass tool and report the number of peptides generated when using trypsin to perform the digest.
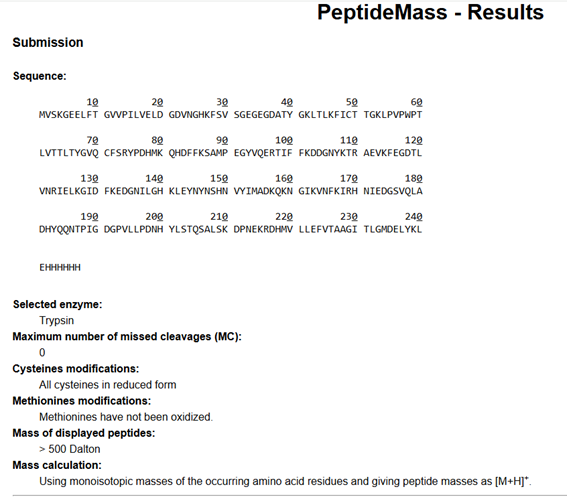
Using the ExPASy PeptideMass tool with the specified parameters (trypsin digestion, 0 missed cleavages, and peptides > 500 Da), a total of 19 peptides were generated from the eGFP sequence.
Although the sequence contains 20 Lysine (K) and 6 Arginine (R) residues (26 potential cleavage sites), the number of observed peptides is lower due to several factors:
Mass filtering (> 500 Da):
Peptides with a molecular weight below 500 Da are excluded based on the selected parameters. Therefore, some cleavage products are not included in the final count.Trypsin cleavage rules:
Trypsin cleaves at the C-terminal side of K and R residues; however, cleavage efficiency can be affected by sequence context (e.g., steric hindrance or neighboring residues).Terminal peptides:
The number of resulting peptides is not always equal to the number of cleavage sites, as the protein sequence generates one additional peptide fragment at the N- and C-termini.
Overall, the reported number of peptides reflects both the enzymatic specificity of trypsin and the filtering criteria applied during the in silico digestion.
In addition to determining the number of peptides generated, the ExPASy PeptideMass tool provides the theoretical monoisotopic masses of each tryptic fragment. Under the specified conditions (trypsin digestion, 0 missed cleavages, peptides > 500 Da), the following peptide masses (Da) for a total of 19 peptides were obtained:
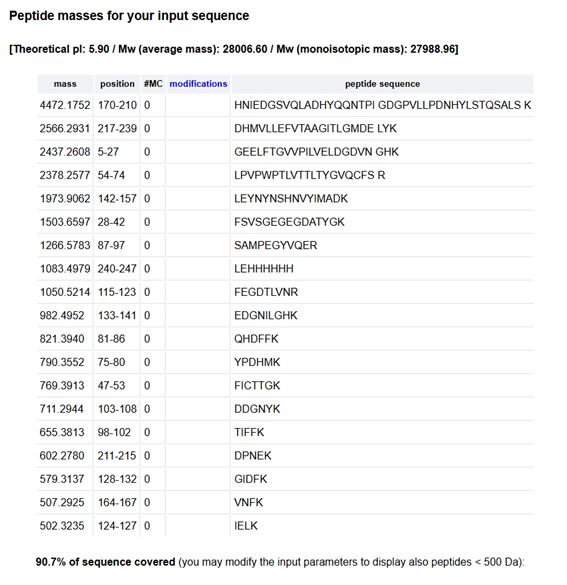
The sum of these peptide masses accounts for the majority of the protein sequence, consistent with the reported 90.7% sequence coverage. The small fraction of missing mass corresponds to peptides below the 500 Da threshold, which were excluded based on the selected parameters.
This peptide mass distribution reflects the expected outcome of trypsin digestion, where cleavage at Lysine (K) and Arginine (R) residues generates a set of peptides with predictable sizes and masses. The agreement between the theoretical digestion and the observed peptide masses supports the accuracy of the sequence and the digestion model.
Overall, this analysis demonstrates how peptide mapping enables verification of protein primary structure through the comparison of predicted and experimentally observed peptide masses.
3. Based on the LC-MS data for the Peptide Map data generated in lab (please use Figure 5a as a reference) how many chromatographic peaks do you see in the eGFP peptide map between 0.5 and 6 minutes? You may count all peaks that are >10% relative abundance.
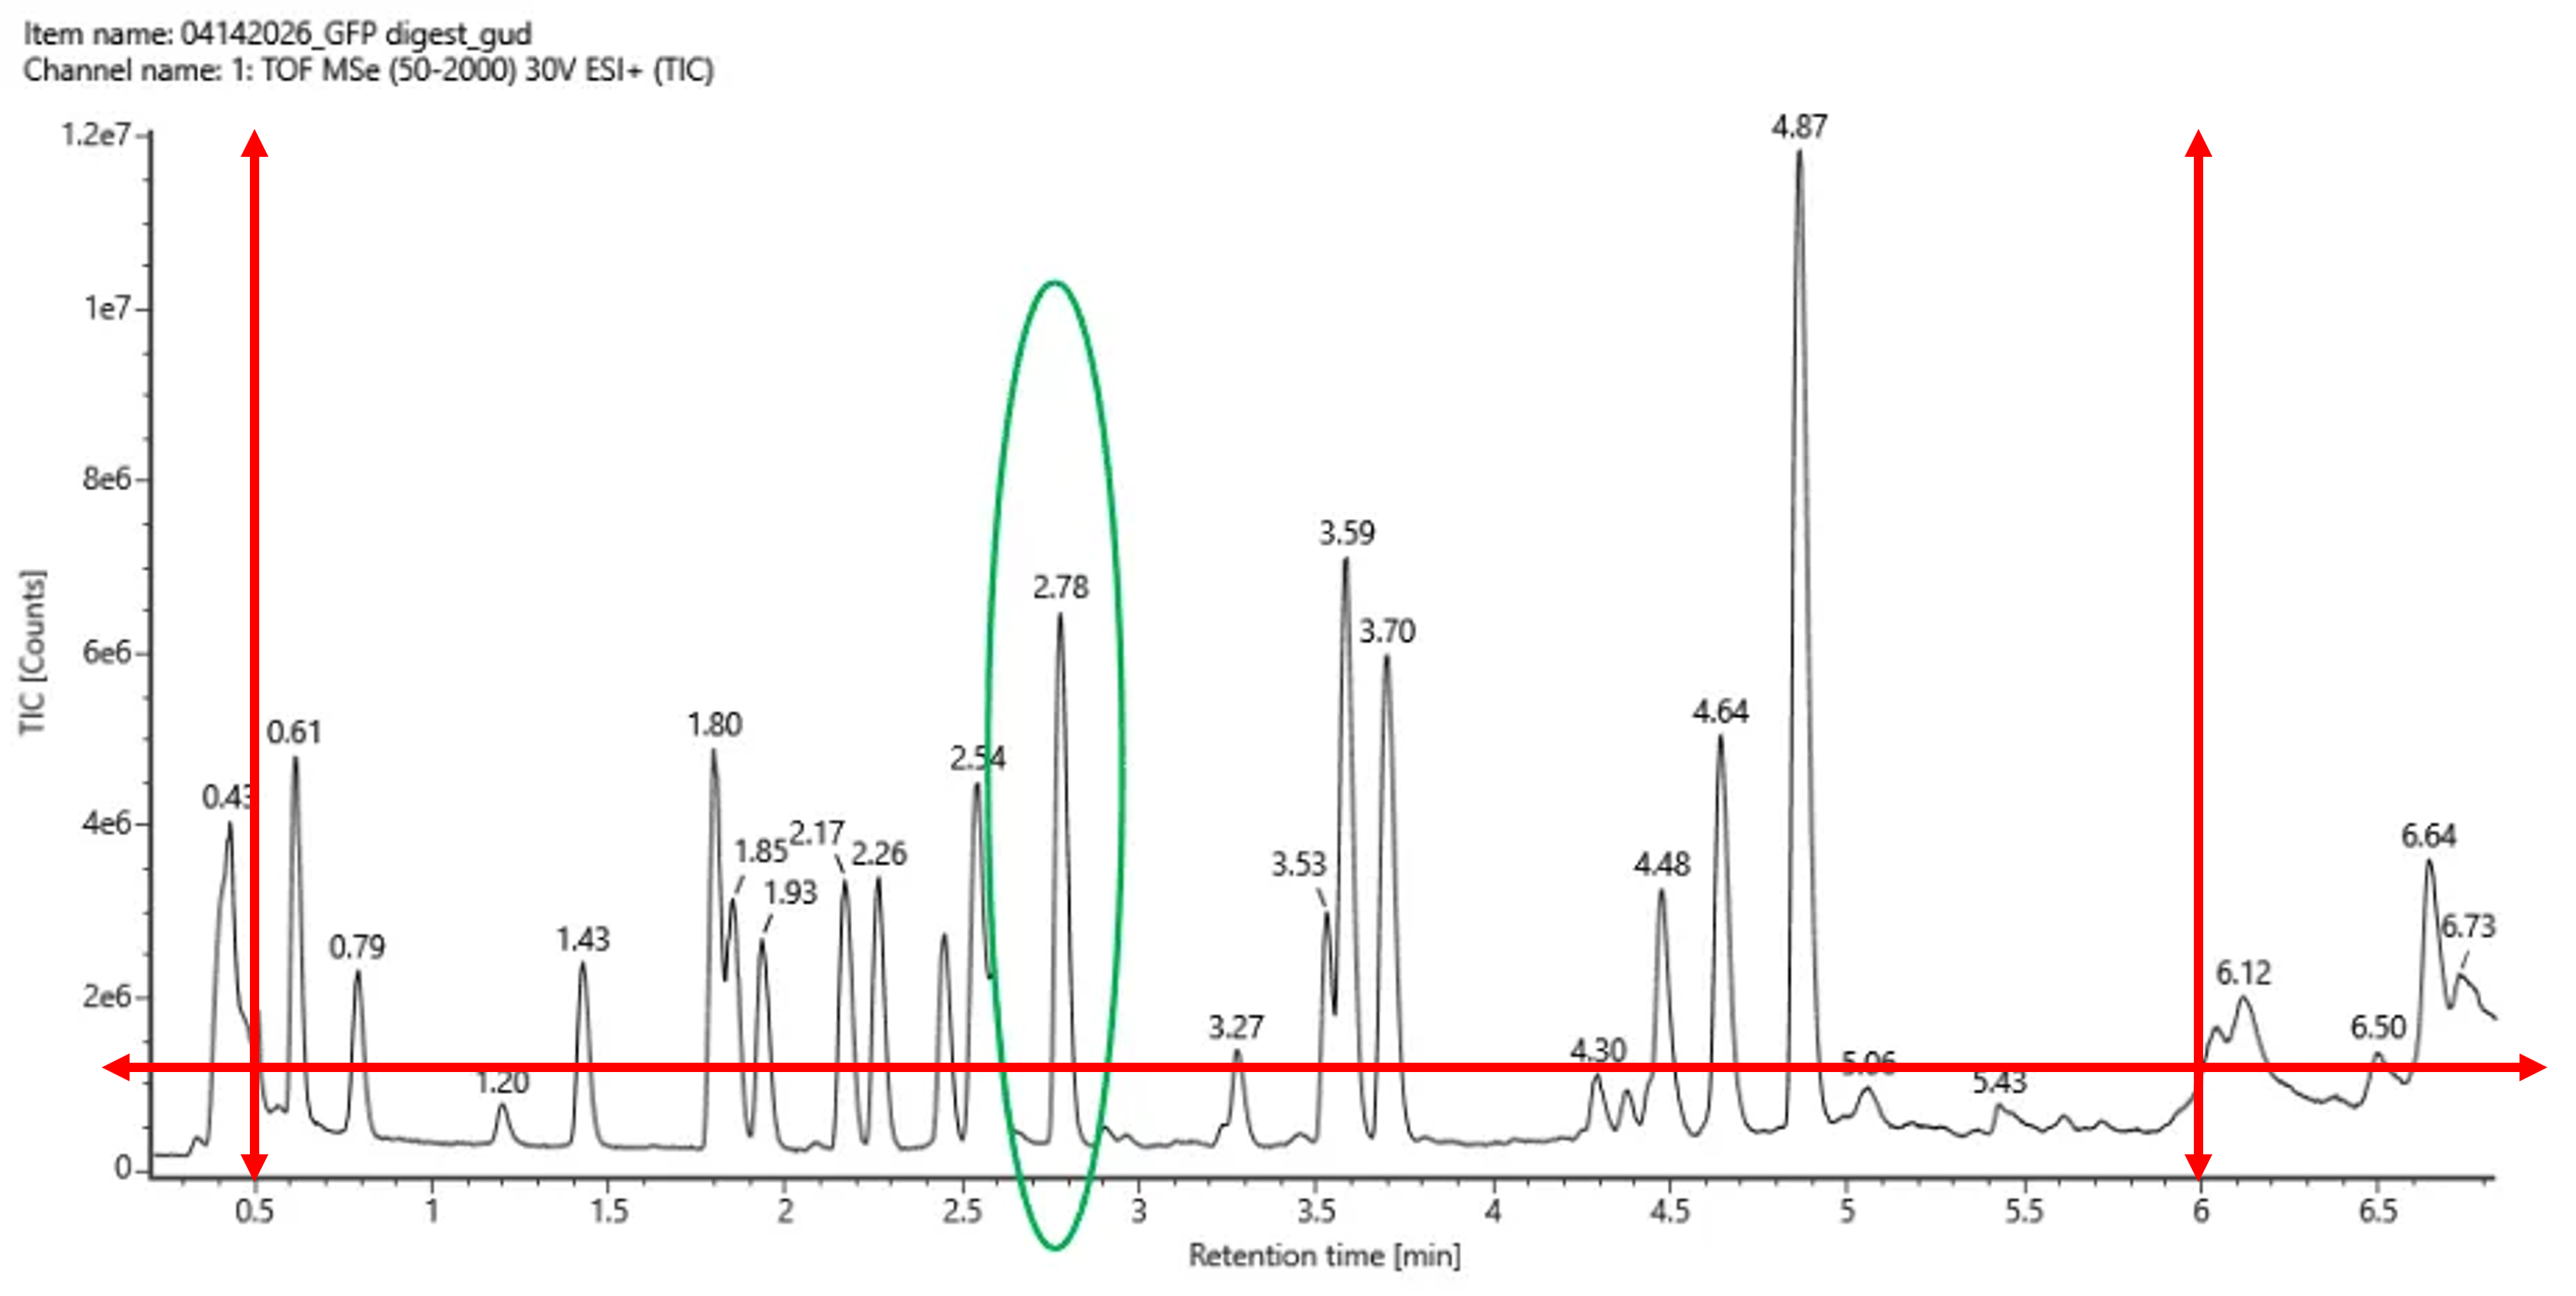
Figure 5a. Total ion chromatogram (TIC) of the eGFP peptide map. The peak at 2.78 minutes is circled, and its MS data is shown in the mass spectrum in Figure 5b, below.
Based on the LC-MS data shown in Figure 5a, the chromatographic peaks between 0.5 and 6.0 minutes were analyzed. A threshold of 10% relative abundance was applied, corresponding to approximately 1.2 × 10⁶ TIC counts.
Only peaks exceeding this threshold were considered for the analysis. After carefully examining the chromatogram, the following peaks were identified:
- 0.61 min, 0.79 min, 1.43 min, 1.80 min, 1.85 min
- 1.93 min, 2.17 min, 2.26 min, 2.54 min, 2.78 min
- 3.27 min, 3.53 min, 3.59 min, 3.70 min, 4.48 min
- 4.64 min, 4.87 min
In total, 17 chromatographic peaks above the 10% relative abundance threshold were observed within the selected retention time window.
Peaks such as 4.30, 5.06, and 5.43 minutes were excluded, as their intensities were below the defined threshold.
This analysis reflects the main peptide fragments detected in the eGFP digest under the given LC-MS conditions.
4. Assuming all the peaks are peptides, does the number of peaks match the number of peptides predicted from question 2 above? Are there more peaks in the chromatogram or fewer?
Based on the in silico digestion results from Question 2, a total of 19 peptides were predicted.
From the LC-MS chromatogram analysis (Figure 5a), approximately 17 chromatographic peaks above the 10% relative abundance threshold were observed between 0.5 and 6 minutes.
Therefore, the number of observed peaks is slightly lower than the number of predicted peptides.
This difference can be explained by several factors:
- Some peptides may not be detected due to poor ionization efficiency.
- Certain peptides may be present at low abundance and fall below the detection threshold.
- Co-elution of peptides may result in overlapping peaks that are not resolved as separate signals.
- Experimental limitations in LC-MS detection can also contribute to missing signals.
Overall, the chromatogram shows fewer peaks than the theoretically predicted peptides.
5. Identify the mass-to-charge (m/z) of the peptide shown in Figure 5b. What is the charge (z) of the most abundant charge state of the peptide (use the separation of the isotopes to determine the charge state). Calculate the mass of the singly charged form of the peptide ([M+H]+) based on its m/z and z.
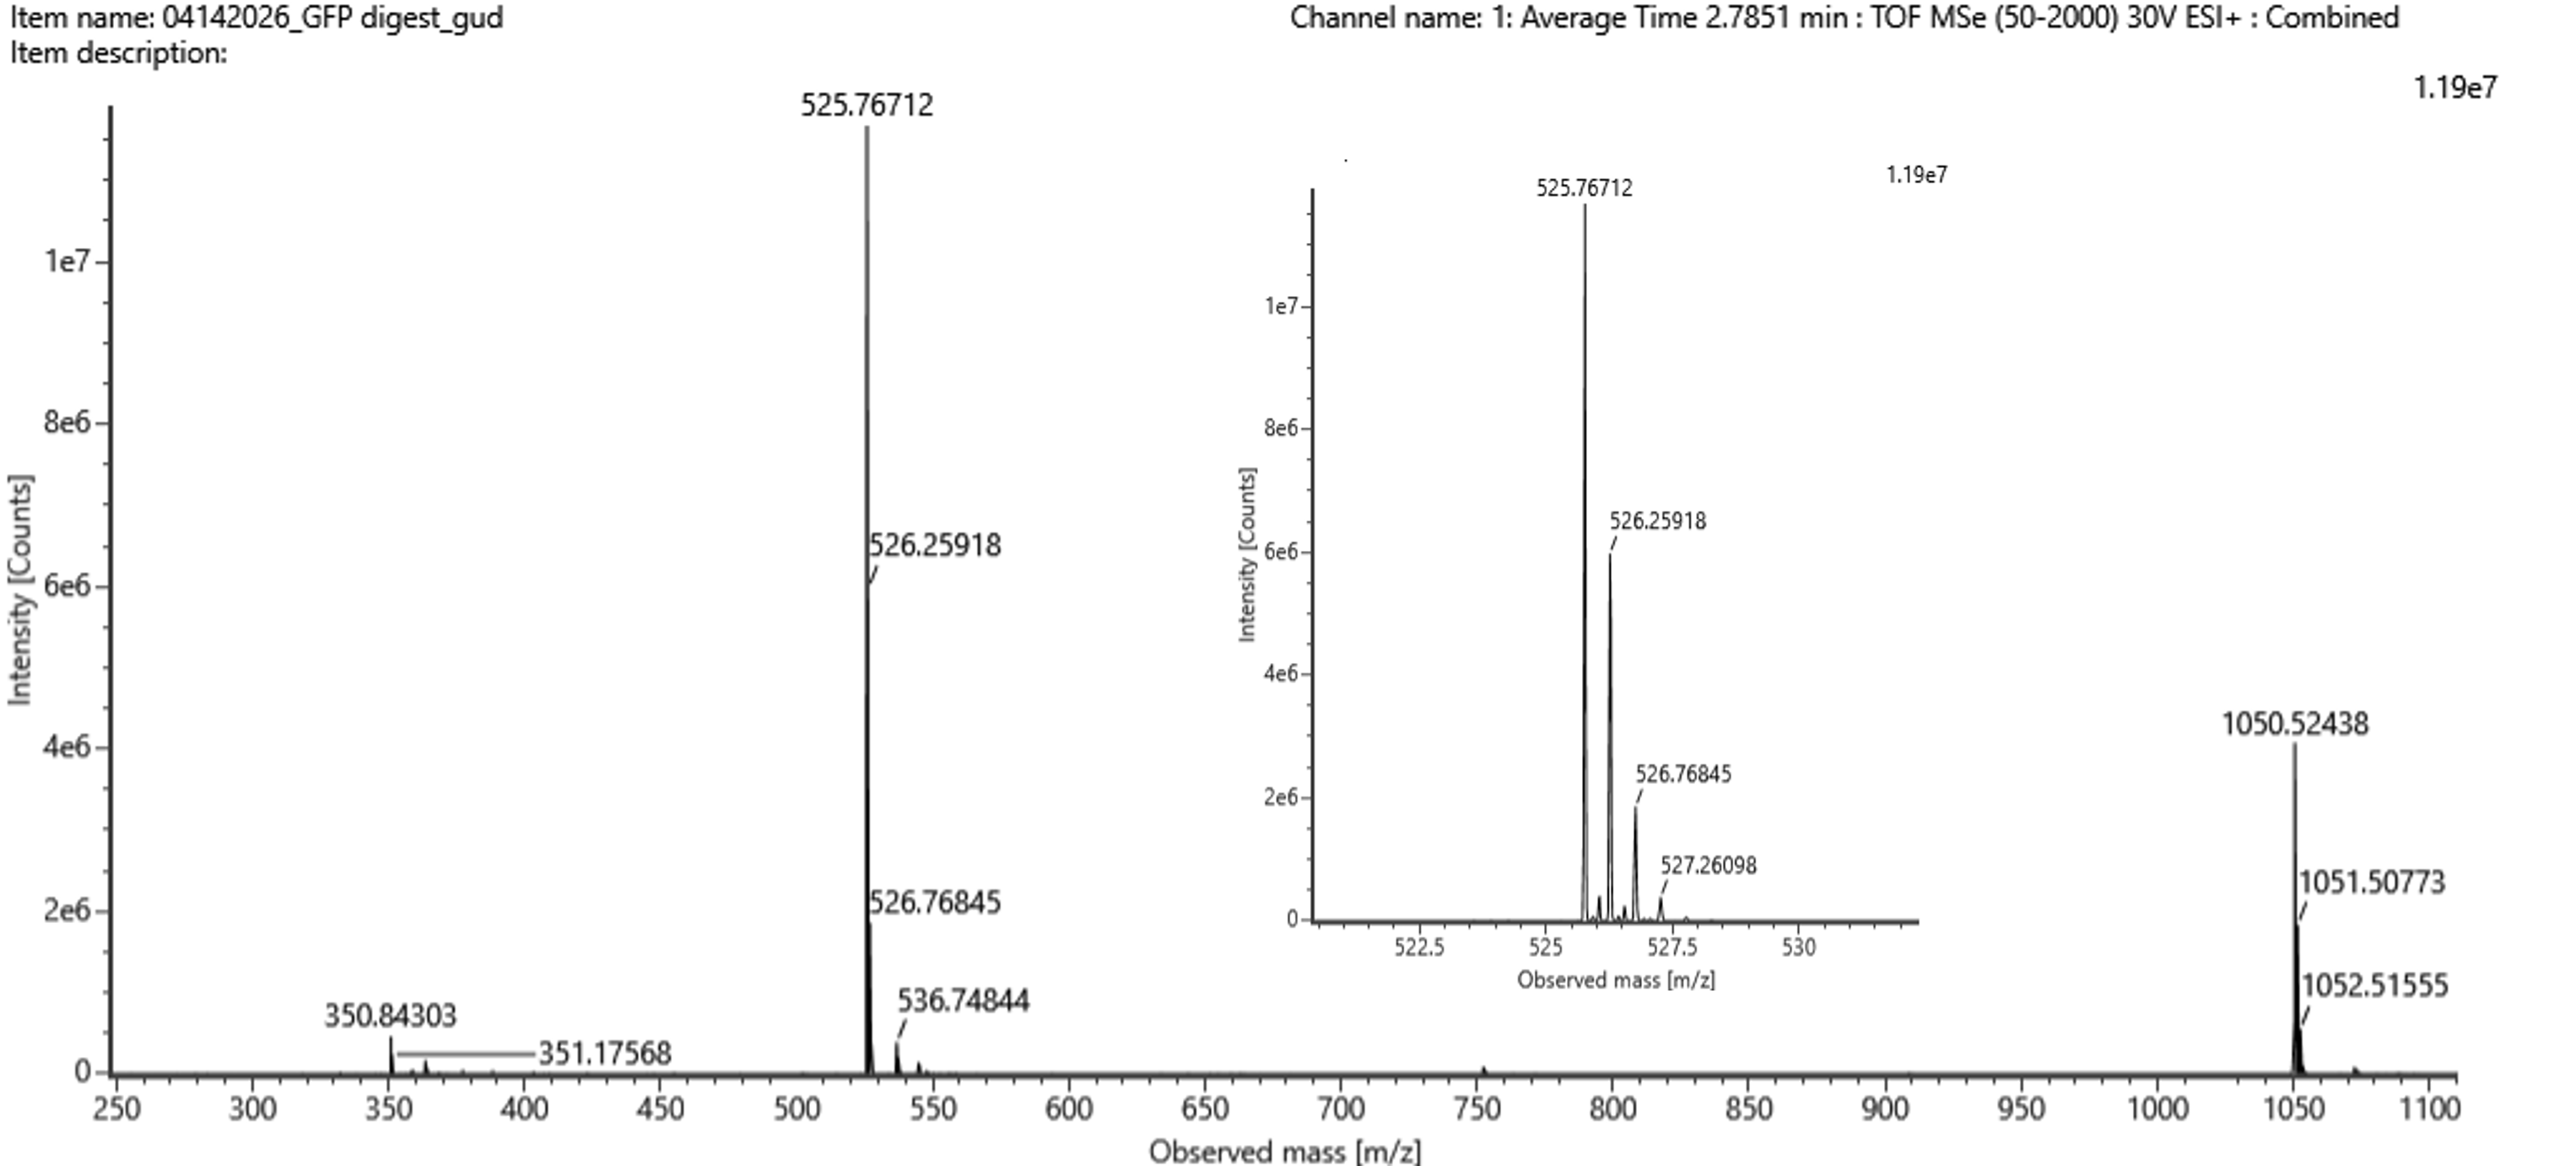
Figure 5b. Mass spectrum figure to show for the chromatographic peak at 2.78 min from Figure 5a above. The inset is a zoom-in of the peak at m/z 525.76, to discern the isotope peaks.
The most intense peak in the mass spectrum is observed at m/z ≈ 525.77, corresponding to the most abundant charge state of the peptide.
Determination of the Charge State (z)
From the zoomed-in isotope pattern, the following consecutive peaks were observed:
525.76712, 526.25918, 526.76845, 527.26098
The spacing between peaks was calculated as:
526.25918 − 525.76712 = 0.49206
526.76845 − 526.25918 = 0.50927
527.26098 − 526.76845 = 0.49253
These values give an average Δ(m/z) ≈ 0.50.
Using the relationship:
z = 1 / Δ(m/z)
z ≈ 1 / 0.50 = 2
Therefore, the peptide has a charge state of z = +2.
Calculation of the Singly Charged Mass [M+H]⁺
In mass spectrometry, the observed m/z is related to the peptide mass by:
m/z = (M + zH) / z
Where:
- M = neutral mass of the peptide
- H = mass of a proton ≈ 1.007 Da
- z = charge state
Rearranging:
M = (m/z × z) − (z × H)
The singly charged form is:
[M+H]⁺ = M + H
[M+H]⁺ = (m/z × z) − (z − 1) × H
Substituting the values:
m/z = 525.77
z = 2
H = 1.007 Da
[M+H]⁺ = (525.77 × 2) − (2 − 1) × 1.007
[M+H]⁺ = 1051.54 − 1.007
[M+H]⁺ ≈ 1050.53 Da
The peptide has:
- m/z ≈ 525.77
- charge state z = +2
- calculated singly charged mass [M+H]⁺ ≈ 1050.53 Da
This result is further supported by the presence of a peak at m/z ≈ 1050.52 in the fragmentation spectrum (Figure 5c), corresponding to the singly charged form of the same peptide.
6. Identify the peptide based on comparison to expected masses in the PeptideMass tool. What is mass accuracy of measurement? Please calculate the error in ppm. (Recall that Accuracy = |MW experiment - MW theory|/MW theory
The peptide was identified by comparing the experimentally determined mass with the theoretical masses obtained from the PeptideMass tool.
The observed singly charged mass was approximately 1050.53 Da, which matches closely with the theoretical mass of 1050.5214 Da for the peptide FEGDTLVNR (positions 115–123).
Error (ppm) was calculated using:
Error (ppm) = |MW_exp − MW_theory| / MW_theory × 10^6
Substituting the values:
|1050.53 − 1050.5214| = 0.0086
Error = (0.0086 / 1050.5214) × 10^6
Error ≈ 8.19 ppm
The peptide is identified as FEGDTLVNR, and the mass accuracy of the measurement is approximately 8.2 ppm, indicating a good agreement between experimental and theoretical values.
7. What is the percentage of the sequence that is confirmed by peptide mapping? (see Figure 6)
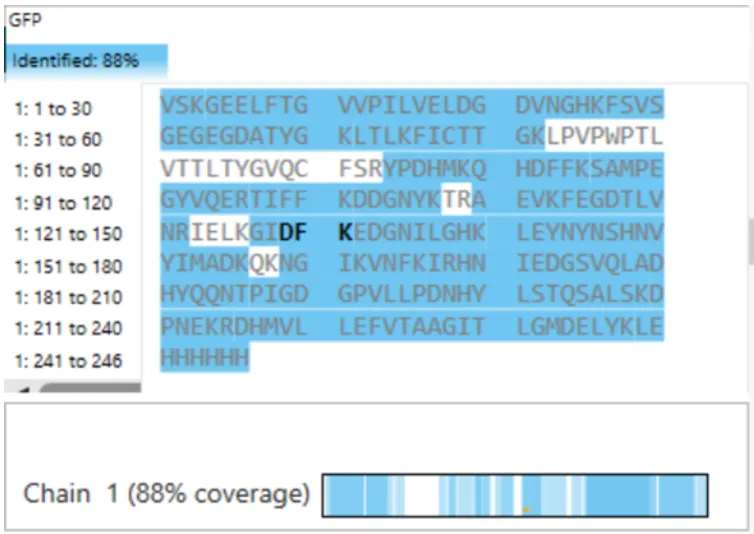
Figure 6. Amino Acid Coverage Map of eGFP based on BioAccord LC-MS peptide identification data.
Based on Figure 6, the percentage of the protein sequence confirmed by peptide mapping is 88%.
This value represents the sequence coverage obtained from the identified peptides, indicating that the majority of the protein sequence was successfully detected and validated.
Bonus Peptide Map Questions
8. Can you determine the peptide sequence for the peptide fragmentation spectrum shown in Figure 5c? (HINT: Use your results from Question 2 above to match the peptide molecular weight that is closest to that shown in Figure 5b. Copy and paste its sequence into this tool online to predict the fragmentation pattern based on its amino acid sequence: http://db.systemsbiology.net/proteomicsToolkit/FragIonServlet.html. What is the sequence of the eGFP peptide that best matches the fragmentation spectrum in Figure 5c?
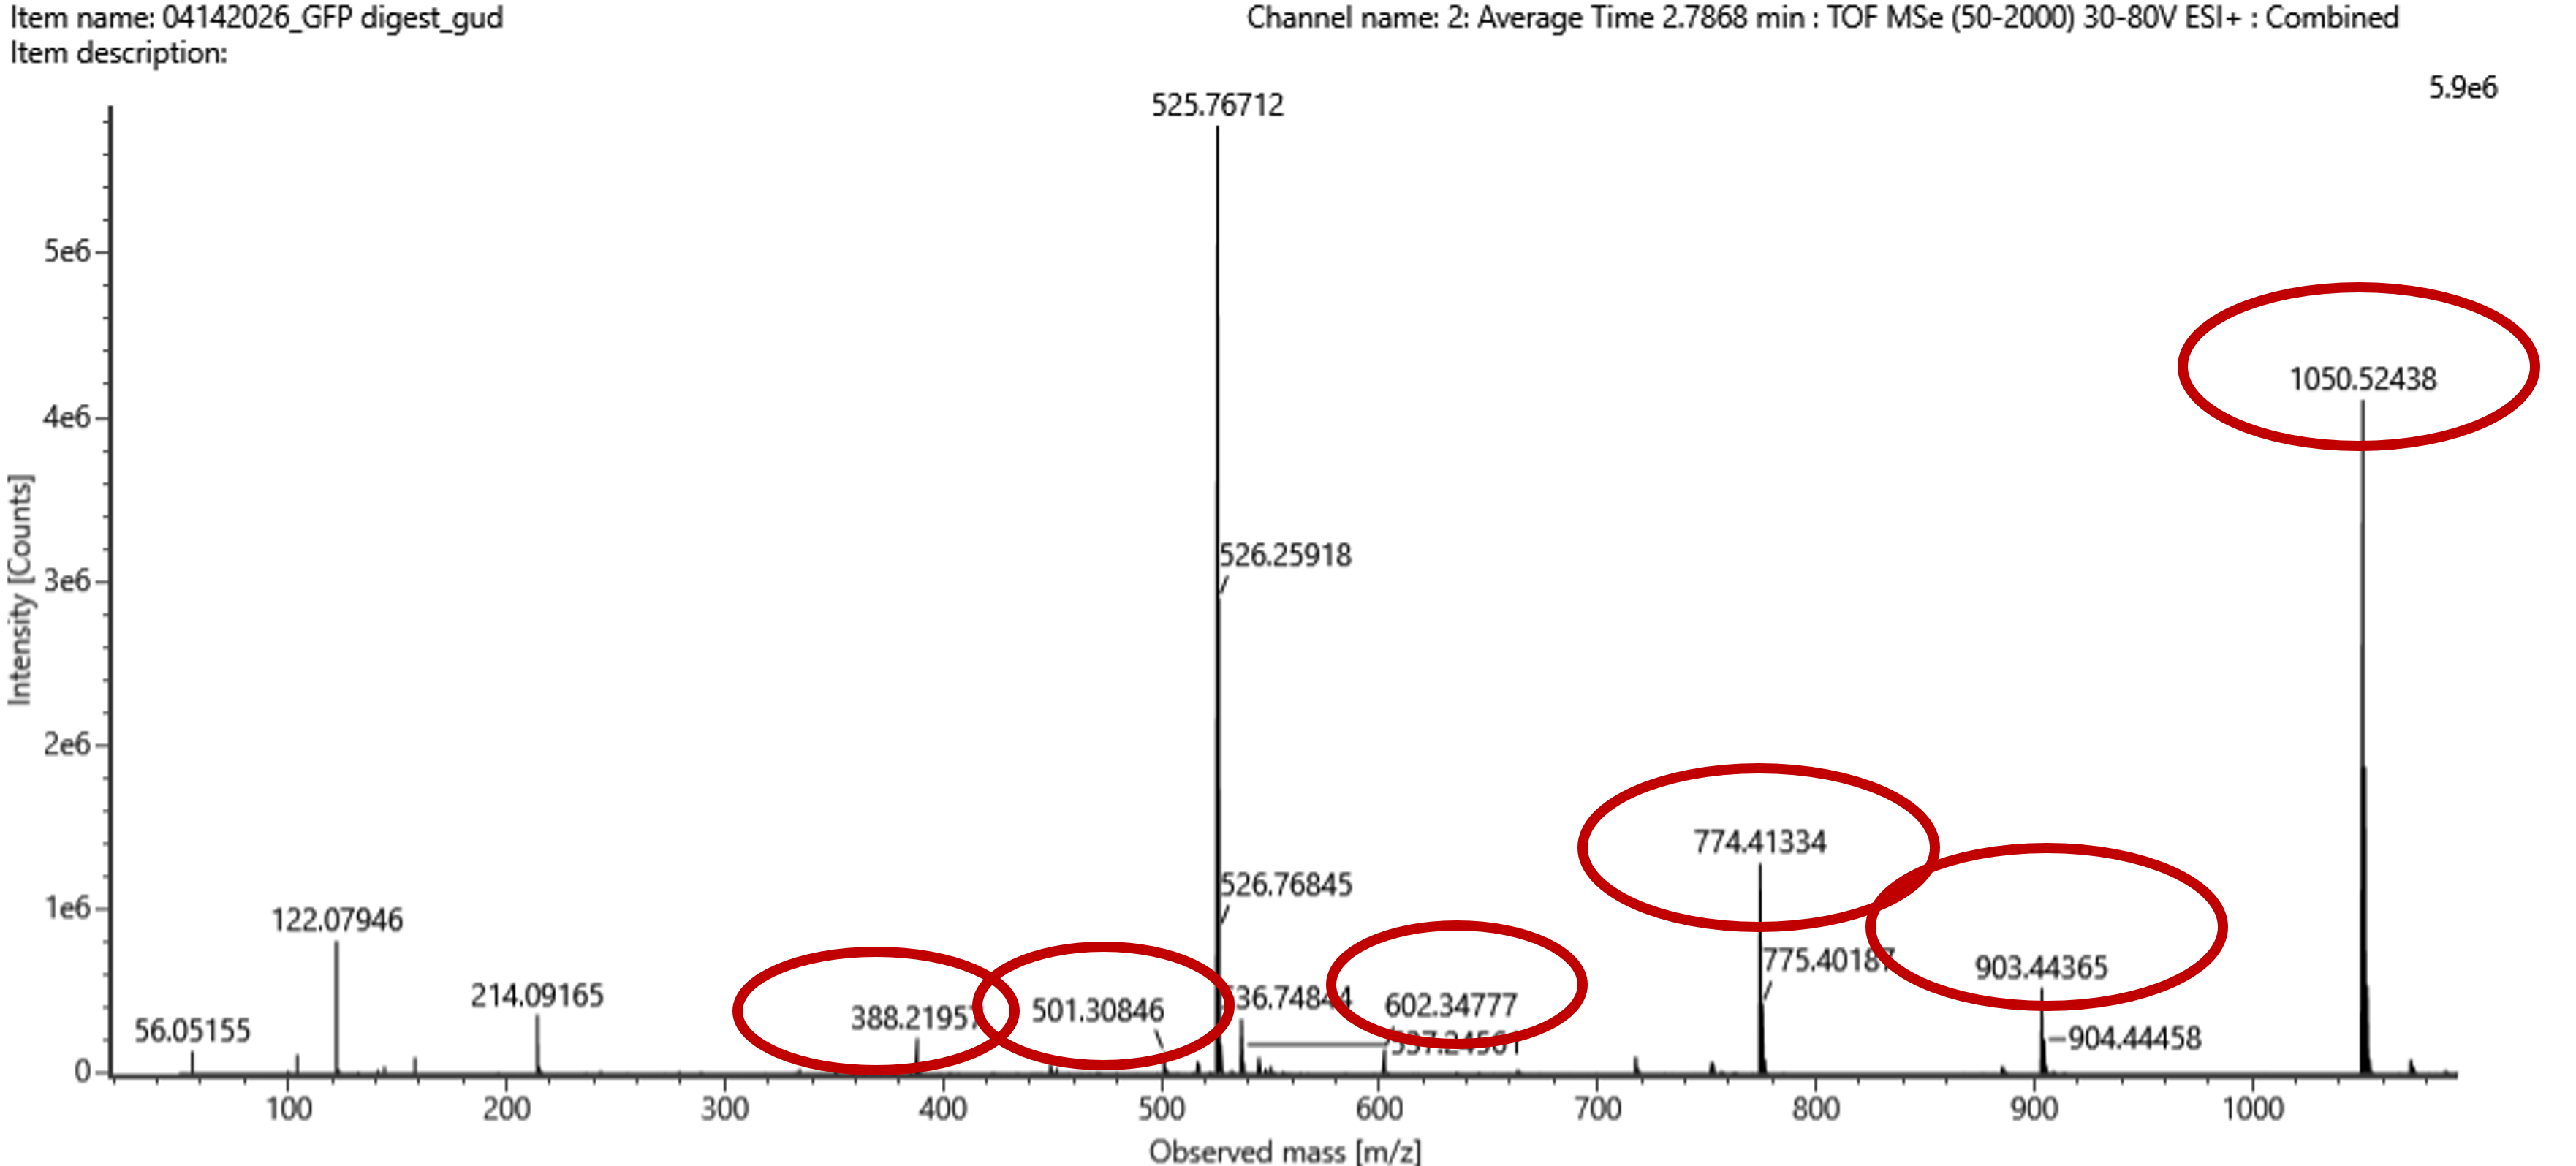
Figure 5c. Fragmentation spectrum of the peptide eluting at retention time 2.78 minutes in Figure 5a (above).
To determine the peptide sequence corresponding to the fragmentation spectrum (Figure 5c), the following approach was used:
a. The experimental mass of the peptide was first determined from Figure 5b, where the singly charged ion was observed at approximately 1050.52 Da.
b. This value was compared with the theoretical peptide masses obtained in Question 2. The closest match corresponded to the peptide:
FEGDTLVNR (MW = 1050.5214 Da) (answer question 6).
c. To validate this assignment, the peptide sequence was entered into the Fragment Ion Calculator (Proteomics Toolkit), selecting:
- Monoisotopic mass
- Charge state +1
- b- and y-ions
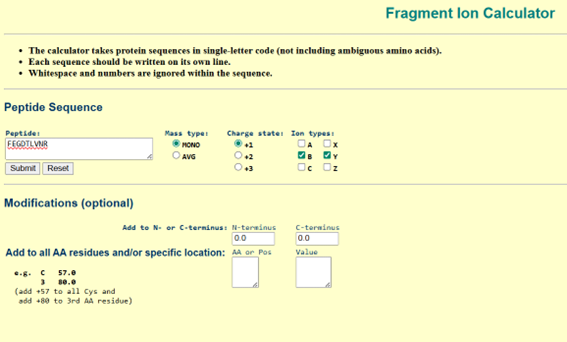
d. The predicted fragmentation pattern (b- and y-ions) was then compared to the experimental MS/MS spectrum (Figure 5c).
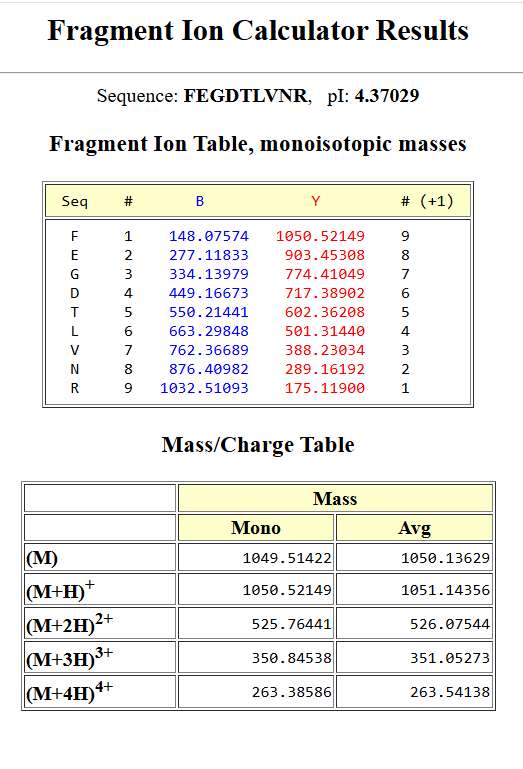
Results: Fragment Ion Comparison
The red circles in Figure 5c correspond to the theoretical peaks that match the observed ones.
| Ion | Sequence (C-term) | Theoretical m/z (Da) | Observed m/z (Figure 5c) | Match |
|---|---|---|---|---|
| y9 | FEGDTLVNR | 1050.52149 | 1050.52438 | ~Match |
| y8 | EGDTLVNR | 903.45308 | 903.44365 | ~Match |
| y7 | GDTLVNR | 774.41049 | 774.41334 | ~Match |
| y6 | DTLVNR | 717.38902 | — | Not observed |
| y5 | TLVNR | 602.36208 | ~602.34777 | ~Match |
| y4 | LVNR | 501.31440 | 501.30846 | ~Match |
| y3 | VNR | 388.23034 | 388.21957 | ~Match |
| y2 | NR | 289.16192 | — | Not observed |
| y1 | R | 175.11900 | — | Not observed |
Interpretation:
The comparison between the theoretical and experimental fragmentation data shows a good agreement.
The main y-ion series (y9, y8, y7) matches very well with the observed peaks, with only very small differences in m/z values. These differences are very low and acceptable in LC-MS/MS experiments.
Other ions such as y5, y4 and y3 also match the spectrum, although some of them appear with lower intensity. This still supports the identification of the peptide.
Some ions (y6, y2, y1) are not observed, but this is normal in fragmentation experiments. It can be due to low intensity, inefficient fragmentation, or signals below the detection limit.
Overall, the presence of several matching y-ions confirms the peptide sequence.
Additional Peaks
Some peaks in the spectrum do not match the predicted y-ions of the peptide FEGDTLVNR.
These peaks may come from:
- b-ions or other fragment ions
- background noise
- small impurities or co-eluting peptides
These additional peaks do not affect the identification, since the main y-ion series is clearly observed.
Conclusion: The peptide sequence that best matches the fragmentation spectrum is FEGDTLVNR
The good agreement between theoretical and experimental fragment ions confirms the correct identification of the peptide.
9. Does the peptide map data make sense, i.e. do the results indicate the protein is the eGFP standard? Why or why not? Consult with Figure 6, which depicts the % amino acid coverage of peptides positively identified using their calculated mass and fragmentation pattern.
The peptide map data is consistent with the expected results for the eGFP standard.
According to Figure 6, the sequence coverage is approximately 88%, which is a relatively high value. This means that most of the protein sequence has been successfully identified.
In addition, the peptides were confirmed using both their calculated mass and their fragmentation patterns, which increases the confidence in the identification.
Even though the coverage is not 100%, this is normal in LC-MS/MS experiments. Some peptides may not be detected due to low intensity, poor ionization, or limitations in the experimental method.
Overall, the results make sense and strongly suggest that the protein analyzed corresponds to the eGFP standard.
Waters Part IV — Oligomers
We will determine Keyhole Limpet Hemocyanin (KLH)’s oligomeric states using charge detection mass spectrometry (CDMS). CDMS single-particle measurements of KLH allow us to make direct mass measurements to determine what oligomeric states (that is, how many protein subunits combine) are present in solution. Using the known masses of the polypeptide subunits (Table 1) for KLH, identify where the following oligomeric species are on the spectrum shown below from the CDMS (Figure 7): 7FU Decamer 8FU Didecamer 8FU 3-Decamer 8FU 4-Decamer
| Polypeptide Subunit Name | Subunit Mass |
|---|---|
| 7FU | 340 kDa |
| 8FU | 400 kDa |
| Table 1: KLH Subunit Masses |
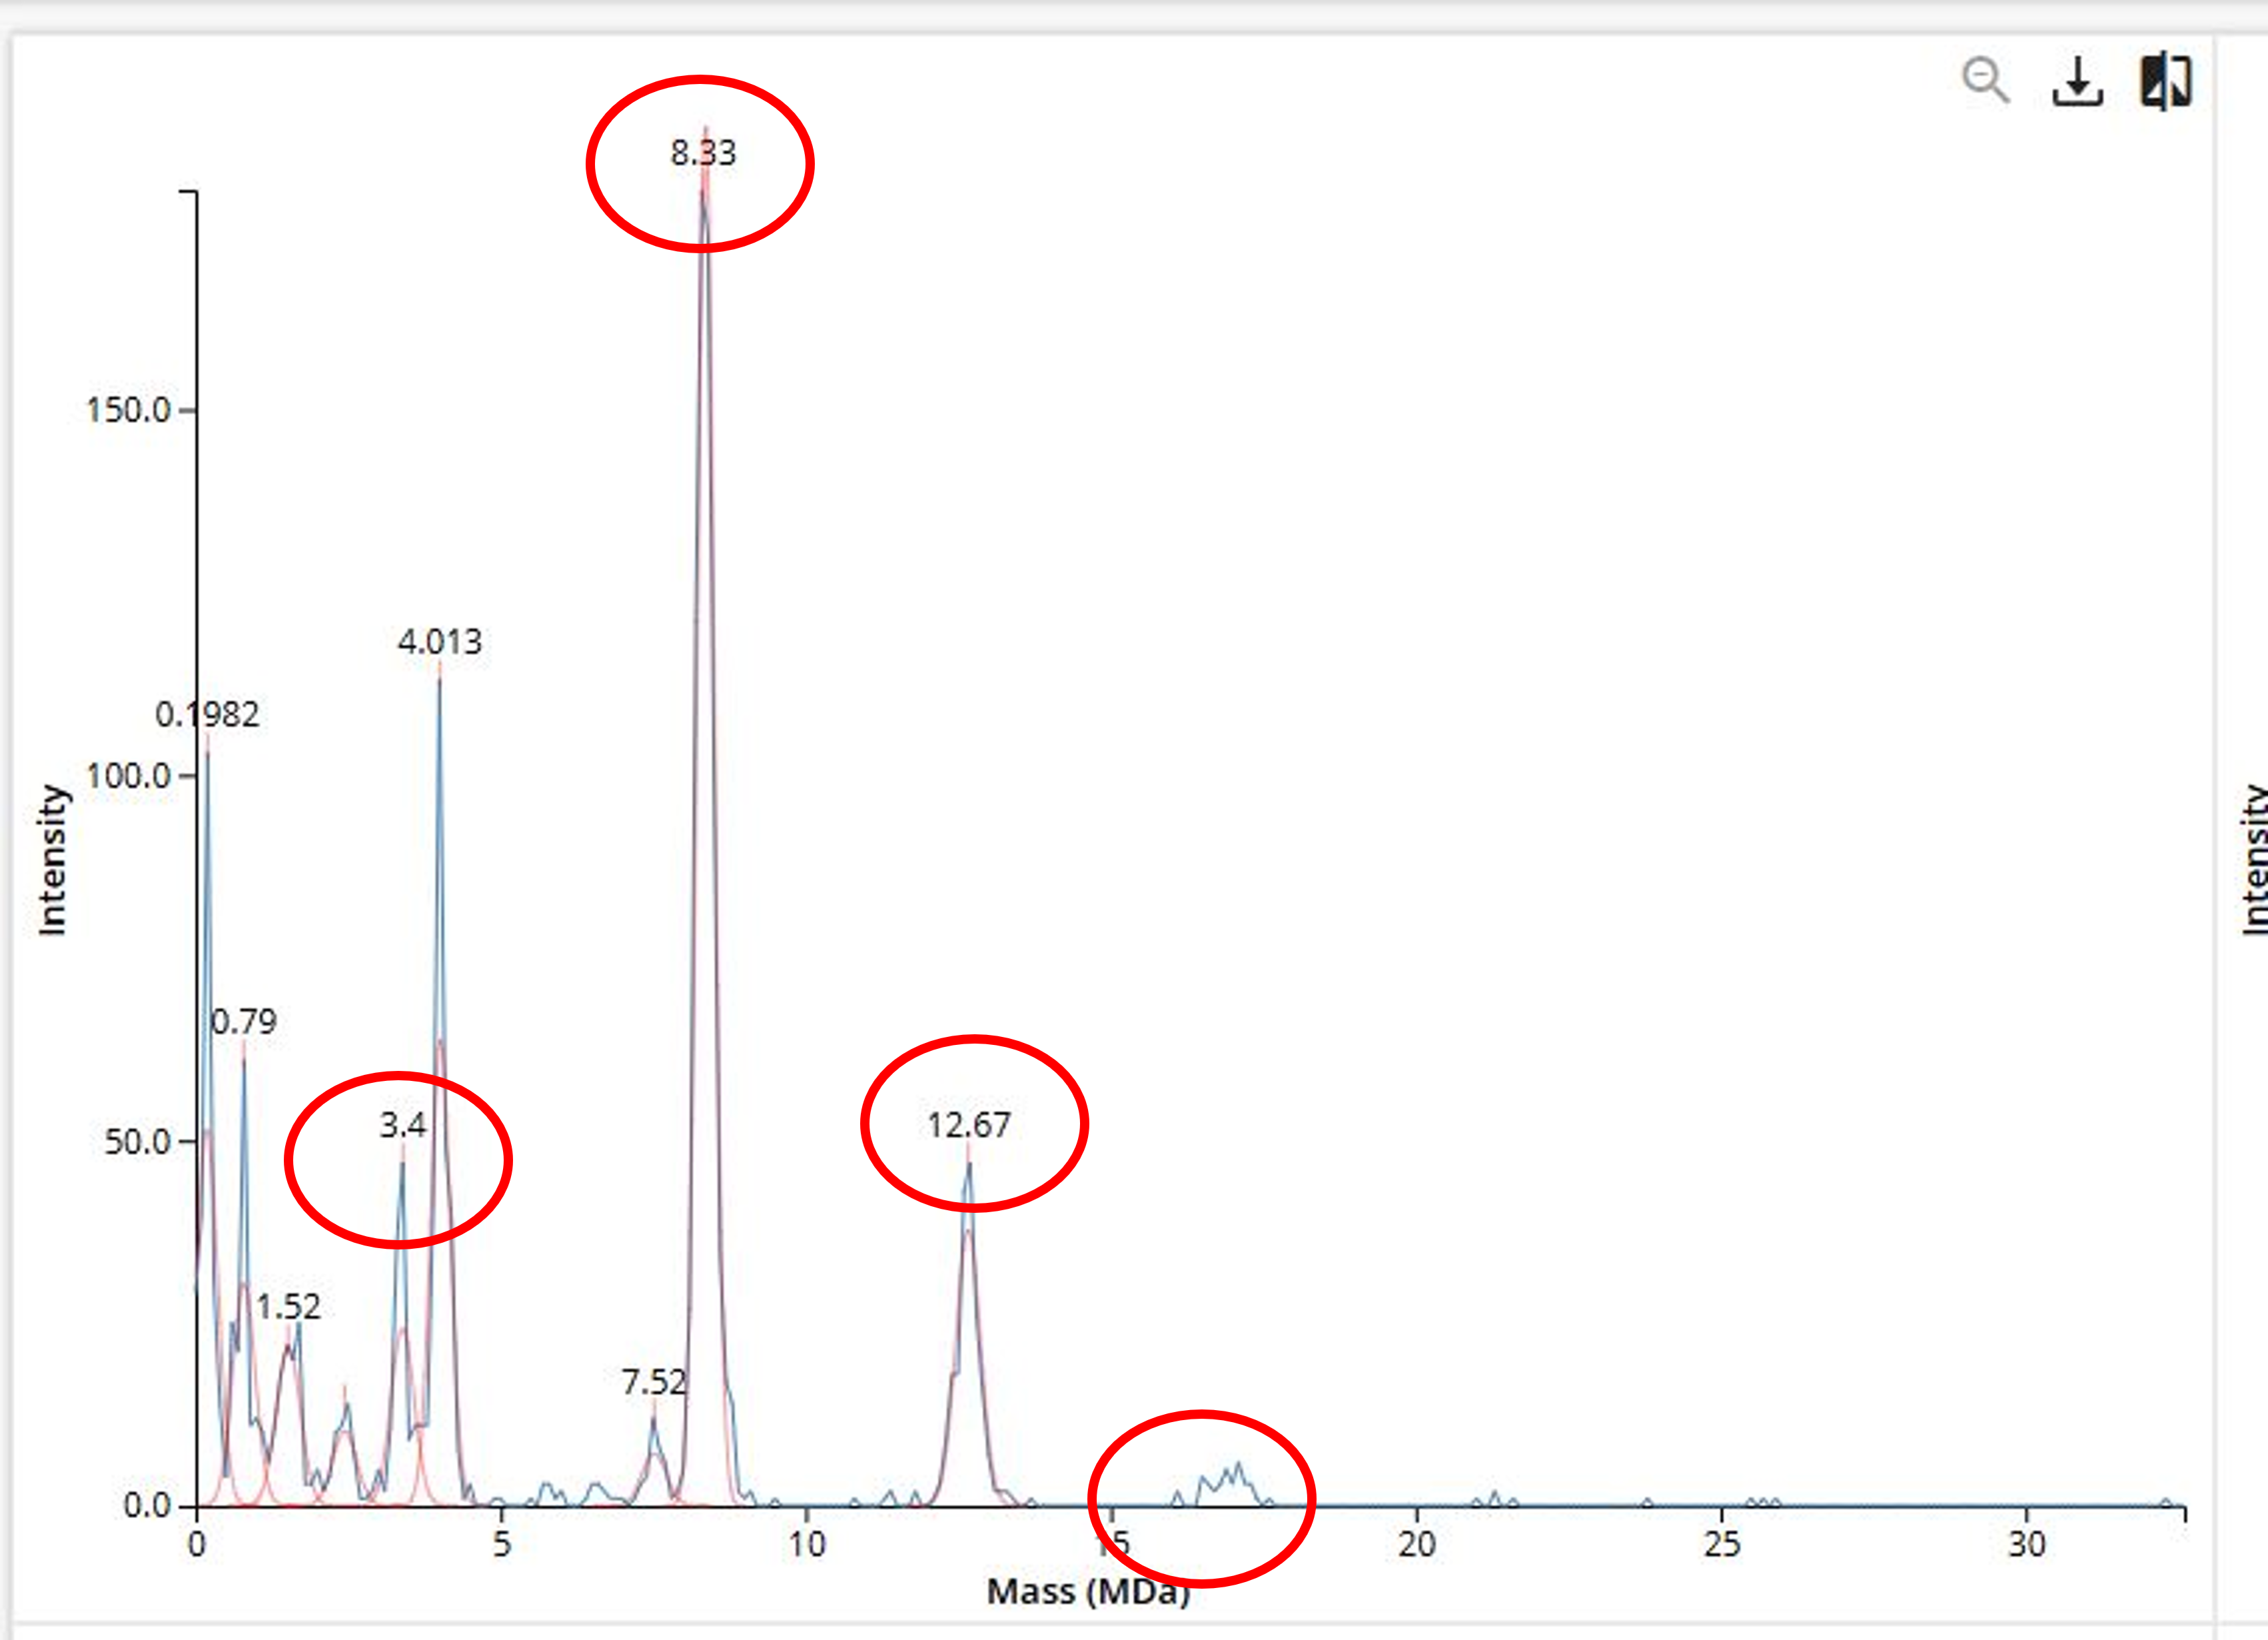
Figure 7. Mass spectrum of Keyhole Limpet Hemocyanin (KLH) acquired on the CDMS.
The oligomeric states of KLH can be determined based on multiples of a decamer unit, where one decamer corresponds to 10 protein subunits.
Using the known subunit masses:
- 7FU = 340 kDa
- 8FU = 400 kDa
The expected masses are:
7FU Decamer (10 subunits)
10 × 340 kDa = 3400 kDa = 3.4 MDa8FU Didecamer (20 subunits)
20 × 400 kDa = 8000 kDa = 8.0 MDa8FU 3-Decamer (30 subunits)
30 × 400 kDa = 12000 kDa = 12.0 MDa8FU 4-Decamer (40 subunits)
40 × 400 kDa = 16000 kDa = 16.0 MDa
In the CDMS spectrum (Figure 7), these oligomeric species can be identified at the corresponding mass values. The peaks circled in red match closely with the expected masses:
- A peak at ~3.4 MDa corresponds to the 7FU decamer
- A strong peak at ~8.3 MDa corresponds to the 8FU didecamer
- A peak at ~12.7 MDa corresponds to the 8FU 3-decamer
- A weaker signal near ~16 MDa corresponds to the 8FU 4-decamer
The small differences between theoretical and observed masses are likely due to experimental variation and instrument resolution.
Overall, the spectrum clearly shows multiple oligomeric states of KLH in solution, confirming the presence of different assemblies formed by combinations of its subunits.
Waters Part V — Did I make GFP?
Please fill out this table with the data you acquired from the lab work done at the Waters Immerse Lab in Cambridge, or else the data screenshots in this document if you were unable to have lab work done at Waters.
Molecular Weight Comparison (eGFP)
| Parameter | Value |
|---|---|
| Theoretical MW (kDa) | 28.0066 kDa |
| Observed MW (kDa) | 28.0341 kDa |
| PPM Mass Error | 981 ppm |