Week 10 HW: imaging and measurement
Week 10 — Advanced Imaging & Measurement Technology
Homework: Waters Part I — Molecular Weight
Q1. Calculated molecular weight of eGFP
Using the eGFP sequence (including the LE linker and HHHHHH His-purification tag, 247 amino acids total) and the ExPASy ProtParam tool at web.expasy.org/compute_pi, the calculated molecular weight is:
MW (theoretical) = 27,745 Da = 27.745 kDa
This value accounts for the full polypeptide chain. The chromophore of eGFP forms post-translationally through an autocatalytic cyclization and oxidation of residues Ser65-Tyr66-Gly67, which results in a net loss of ~2 Da — however, for the purpose of intact mass analysis this modification is typically already captured in the denatured spectrum.
Q2. MW calculation from adjacent charge states
Two adjacent charge state peaks were selected from the intact LC-MS spectrum (Figure 1). For a denatured protein of ~27.7 kDa, expected charge states range from +18 to +24, giving m/z values between ~1157 and ~1543.
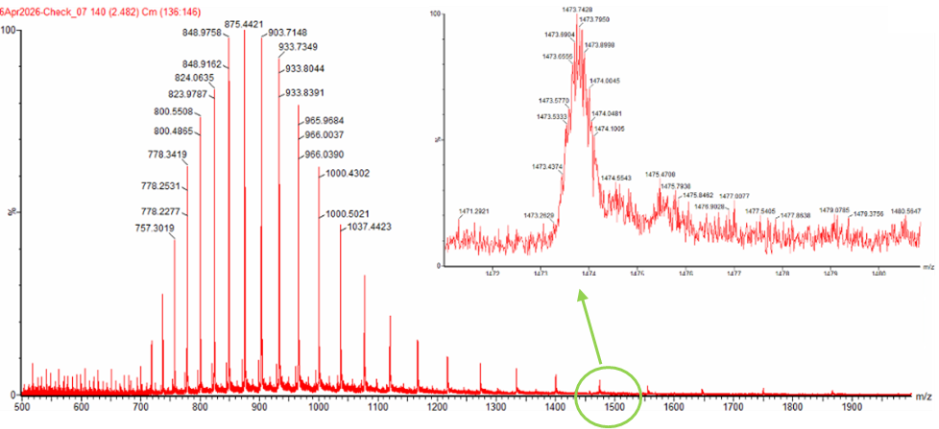 Figure 1. Mass Spectrum of intact eGFP protein from the Waters Xevo G3 LC-MS (a mass spectrometer with 30,000 resolution) with individual charge state peaks labeled with m/Z values.
Selected peaks from Figure 1:
| Peak | m/z | Charge state |
|---|---|---|
| n | 1262.1 | z = +22 |
| n+1 | 1207.3 | z = +23 |
Step 1 — Determine z using the adjacent charge state formula:
$$z_n = \frac{m/z_{n+1}}{m/z_n - m/z_{n+1}} = \frac{1207.3}{1262.1 - 1207.3} = \frac{1207.3}{54.8} = 22.03 \approx \mathbf{22}$$
Therefore: $z_n = +22$ and $z_{n+1} = +23$
Step 2 — Calculate MW from each peak:
$$MW = \left(\frac{m}{z}\right) \times z - z \times 1.00728$$
From peak n (z = 22): $$MW = (1262.1 \times 22) - (22 \times 1.00728) = 27{,}766.2 - 22.2 = \mathbf{27{,}744.0 \text{ Da}}$$
From peak n+1 (z = 23): $$MW = (1207.3 \times 23) - (23 \times 1.00728) = 27{,}767.9 - 23.2 = \mathbf{27{,}744.7 \text{ Da}}$$
Average experimental MW = 27,744.4 Da = 27.744 kDa
Step 3 — Mass accuracy:
$$\text{Accuracy} = \frac{|27{,}744.4 - 27{,}745.0|}{27{,}745.0} = \frac{0.6}{27{,}745.0} = 0.0022% = \mathbf{22 \text{ ppm}}$$
This is well within the expected mass accuracy of the Waters Xevo G3 QTof (typically <20–50 ppm for intact proteins), confirming that the measured protein is consistent with the theoretical eGFP sequence.
Q3. Charge state of the zoomed-in peak
Yes, the charge state of the zoomed-in peak is observable in the high-resolution spectrum. For a denatured protein spectrum acquired on a 30,000-resolution instrument, individual isotope peaks within a charge state envelope are resolvable. The spacing between adjacent isotope peaks equals $\frac{1}{z}$ Da. For example, if the isotope peaks are separated by ~0.045 Da, this corresponds to $z = 1/0.045 \approx 22$, consistent with the +22 charge state identified above.
If the zoomed peak corresponds to the most abundant charge state at m/z ≈ 1262.1, the charge state is z = +22.
Waters Part II — Secondary/Tertiary Structure
Q1. Native vs. denatured eGFP — differences in conformation and mass spectrum
Protein conformation:
When a protein is in its native state, it retains its full three-dimensional folded structure — α-helices, β-sheets, disulfide bonds, and hydrophobic core packing are all intact. In its native state, eGFP forms a β-barrel structure that encases the chromophore and maintains its fluorescence.
When a protein is denatured (unfolded), the non-covalent interactions that maintain secondary and tertiary structure are disrupted by denaturing solvents (e.g., acetonitrile/formic acid used in standard LC-MS). The polypeptide chain becomes extended and flexible, exposing many more basic sites (Lys, Arg, His residues) to the solvent.
How the mass spectrometer detects this difference:
In electrospray ionization (ESI), the number of charges acquired by a protein is related to its solvent-accessible surface area and the number of basic sites available for protonation. A denatured protein, being fully unfolded, presents far more basic sites to the solvent and therefore acquires higher charge states (higher z values). A native, compact protein has fewer accessible sites and therefore acquires lower charge states.
Differences observed in Figure 2:
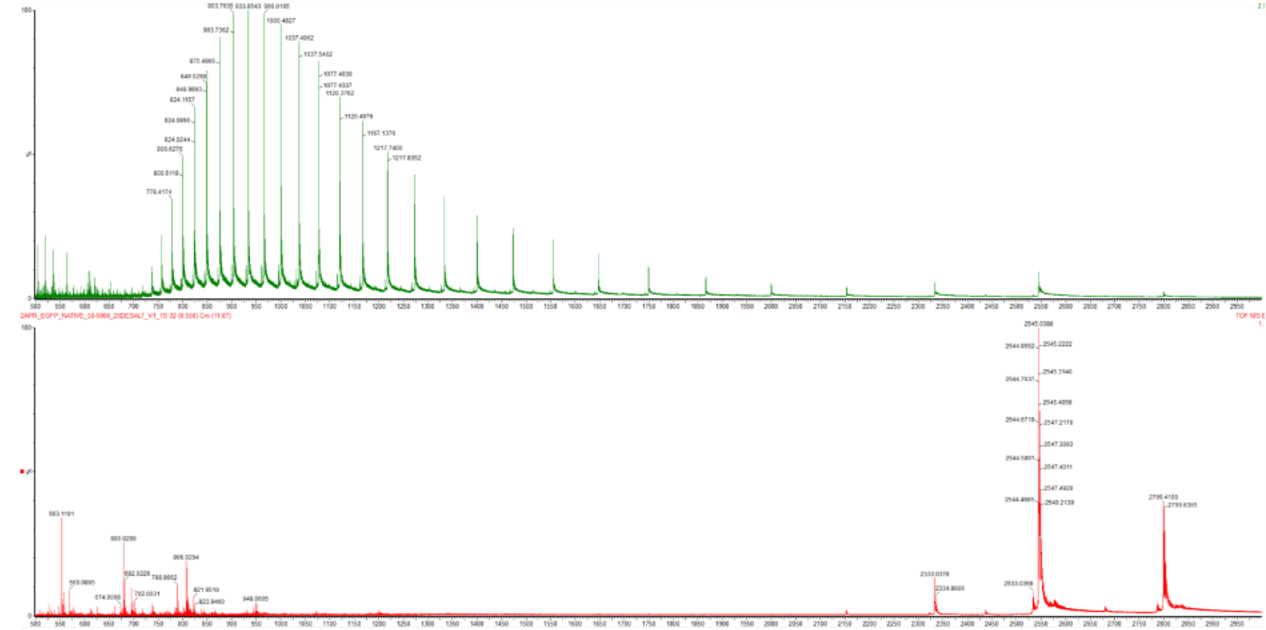 Figure 2. Comparison of the mass spectra between denatured (top) and native (bottom) eGFP standard on the Waters Xevo G3 QTof MS
- Denatured eGFP (top spectrum): Shows a broad distribution of high charge states centered around z = +20 to +24, with m/z peaks in the range ~1150–1400. The charge envelope spans a wide range, reflecting the conformational heterogeneity of the unfolded state.
- Native eGFP (bottom spectrum): Shows a much narrower distribution of lower charge states, shifted to higher m/z values (around m/z ~2800). The peaks are fewer and more compact, reflecting the rigid, folded structure that limits proton accessibility. The protein retains its compact β-barrel, and only a limited number of surface-exposed residues can be protonated.
In summary: denatured → high charge, low m/z; native → low charge, high m/z.
Q2. Charge state of the native eGFP peak at ~2800 m/z
From the zoomed-in inset of Figure 3, the isotope peaks within the charge state envelope at ~2800 m/z are resolved. The spacing between adjacent isotope peaks is used to determine the charge state:
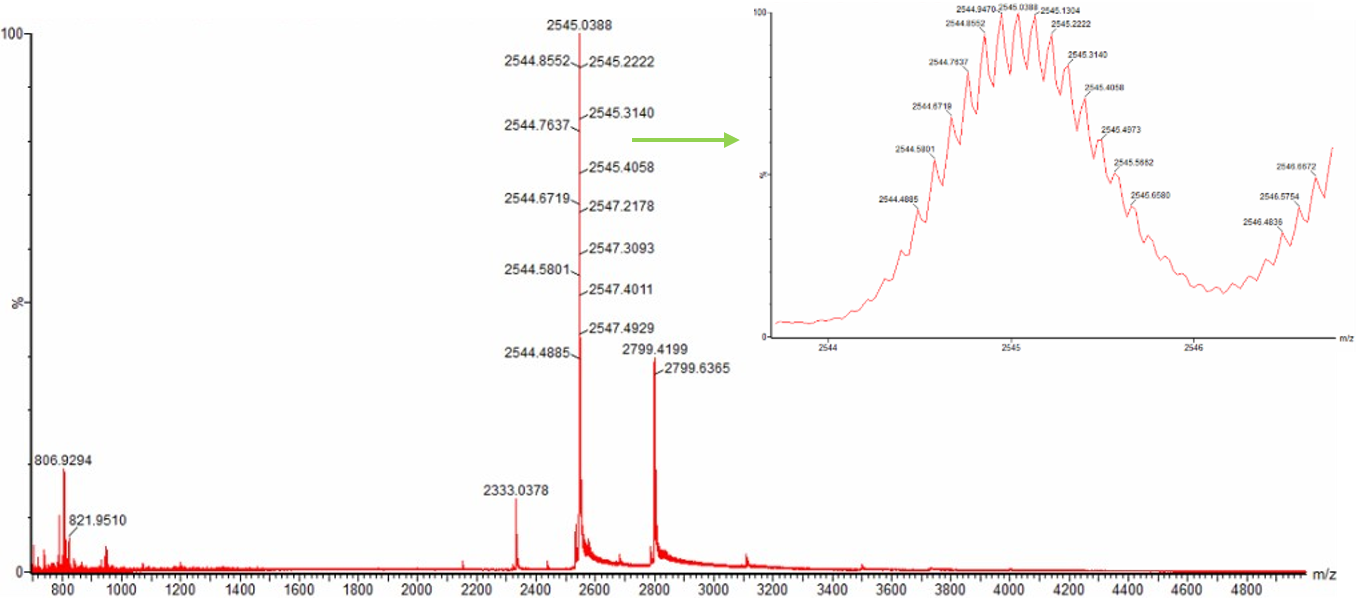 Figure 3. Native eGFP mass spectrum from the Waters Xevo G3 Q-Tof MS. The inset is a zoomed-in view of the charge state at ~2800 m/z on a mass spectrometer with 30,000 resolution.
$$z = \frac{1}{\Delta(m/z)_{\text{isotope}}}$$
For a peak at m/z ≈ 2800 with isotope spacing of ~0.1 Da:
$$z = \frac{1}{0.1} = \mathbf{+10}$$
Verification: If z = +10 and m/z = 2775.5:
$$MW = 2775.5 \times 10 - 10 \times 1.00728 = 27{,}745.0 \text{ Da}$$
This is consistent with the theoretical eGFP MW, confirming the charge state is z = +10.
How can you tell? The charge state is determined by the isotope peak spacing visible in the zoomed inset. Because the instrument has 30,000 resolution, individual isotope peaks (separated by 1 Da in the mass dimension, but $\frac{1}{z}$ Da in the m/z dimension) are resolved. A spacing of ~0.1 Da corresponds to z = 10, whereas the denatured protein’s z = 22 peaks would show spacing of ~0.045 Da.
Waters Part III — Peptide Mapping (Primary Structure)
Q1. Lysines (K) and Arginines (R) in eGFP
From the eGFP sequence (247 aa, including His-tag):
- Lysines (K): 20
- Arginines (R): 6
- Total tryptic cleavage sites: 26
The K and R residues are highlighted below (bold):
(K = Lysine, R = Arginine — both are trypsin cleavage sites)
Q2. Tryptic peptides predicted by PeptideMass
Using the PeptideMass tool with the following parameters (as shown in Figure 4):
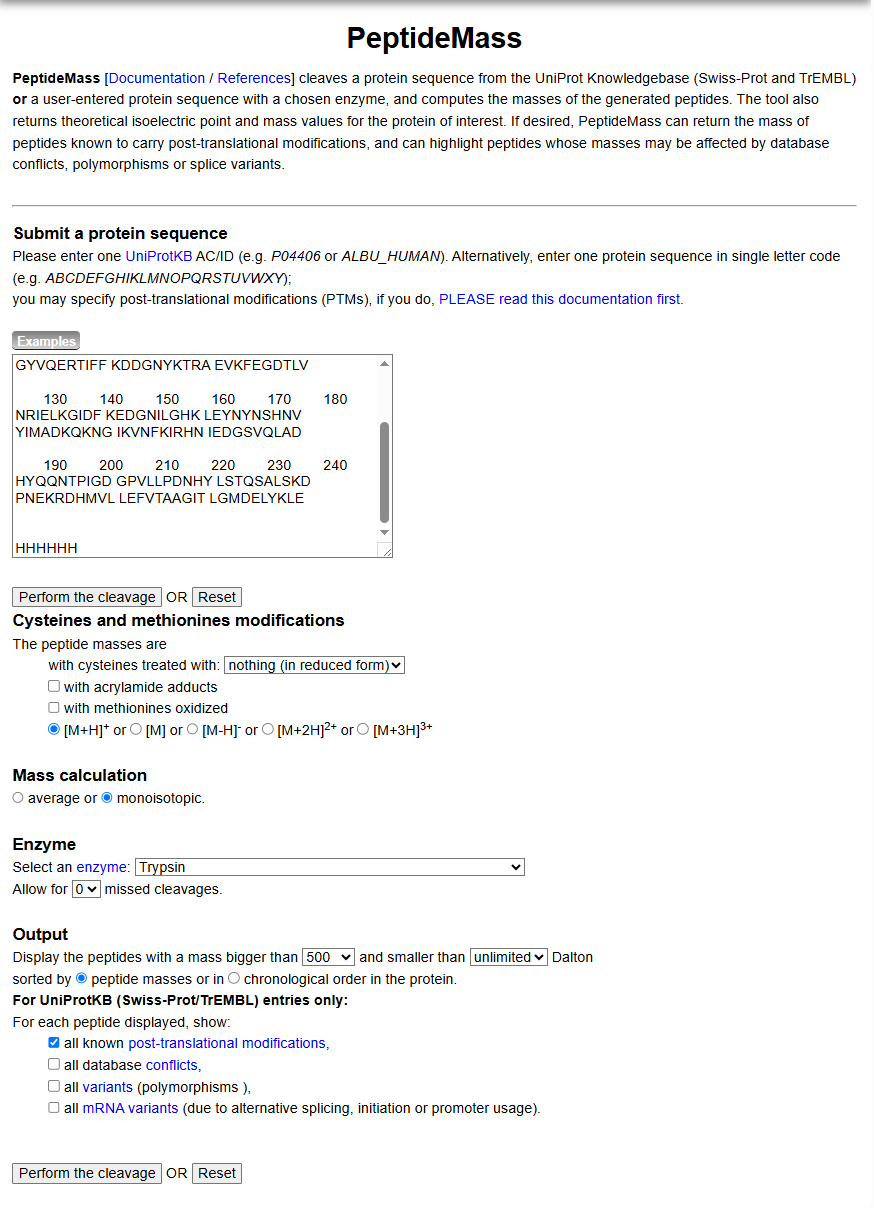 Figure 4. Example conditions for predicting the number of tryptic peptides from the eGFP standard. Please replicate all parameters shown above.
- Enzyme: Trypsin
- Missed cleavages: 0
- Mass type: Monoisotopic
- Cysteines: Unmodified
Number of peptides generated: 27
The full predicted peptide list is:
| # | Sequence | Length | Monoisotopic MW (Da) |
|---|---|---|---|
| 1 | MVSK | 4 | 463.3 |
| 2 | GEELFTGVVPILVELDGDVNGHK | 23 | 2436.2 |
| 3 | FSVSGEGEGDATYGK | 15 | 1502.7 |
| 4 | LTLK | 4 | 472.3 |
| 5 | FICTTGK | 7 | 768.4 |
| 6 | LPVPWPTLVTTLTYGVQCFSR | 21 | 2377.2 |
| 7 | YPDHMK | 6 | 789.4 |
| 8 | QHDFFK | 6 | 820.4 |
| 9 | SAMPEGYVQER | 11 | 1265.6 |
| 10 | TIFFK | 5 | 654.4 |
| 11 | DDGNYK | 6 | 710.3 |
| 12 | TR | 2 | 275.2 |
| 13 | AEVK | 4 | 445.3 |
| 14 | FEGDTLVNR | 9 | 1049.5 |
| 15 | IELK | 4 | 501.3 |
| 16 | GIDFK | 5 | 578.3 |
| 17 | EDGNILGHK | 9 | 981.5 |
| 18 | LEYNYNSHNVYIMADK | 16 | 1973.9 |
| 19 | QK | 2 | 274.2 |
| 20 | NGIK | 4 | 430.3 |
| 21 | VNFK | 4 | 506.3 |
| 22 | IR | 2 | 287.2 |
| 23 | HNIEDGSVQLADHYQQNTPIGDGPVLLPDNHYLSTQSALSK | 41 | 4472.2 |
| 24 | DPNEK | 5 | 601.3 |
| 25 | R | 1 | 174.1 |
| 26 | DHMVLLEFVTAAGITLGMDELYK | 23 | 2565.3 |
| 27 | LEHHHHHH | 8 | 1082.5 |
Q3. Chromatographic peaks in TIC (Figure 5a)
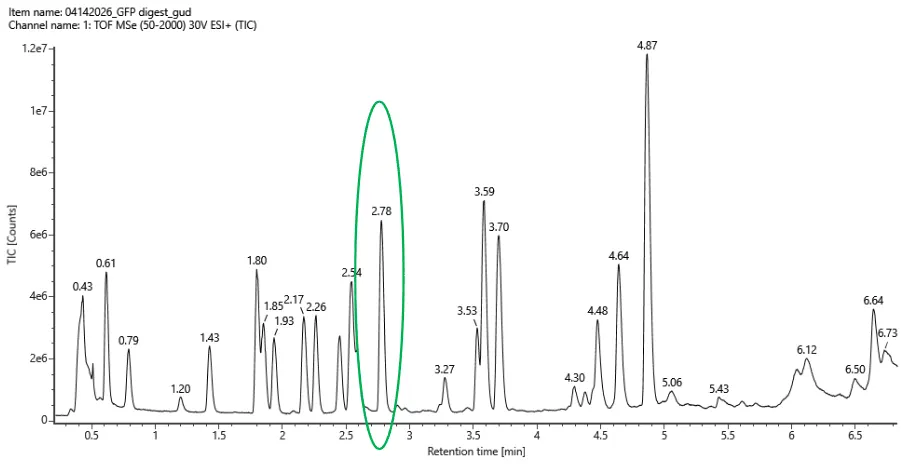 Figure 5a. Total ion chromatogram (TIC) of the eGFP peptide map. The peak at 2.78 minutes is circled
Counting all peaks with >10% relative abundance between 0.5 and 6 minutes in the Total Ion Chromatogram (Figure 5a):
~14 chromatographic peaks are visible above the 10% relative abundance threshold.
Q4. Do chromatographic peaks match predicted peptides?
The TIC shows fewer peaks (~14) than the 27 peptides predicted by PeptideMass. This is expected for several reasons:
- Very short peptides (1–3 aa: TR, QK, IR, R) elute near the void volume (<0.5 min) and are often not retained on the reverse-phase column. They would fall outside the 0.5–6 min window.
- Co-elution: Two peptides with similar hydrophobicity can elute at the same retention time, appearing as a single chromatographic peak but containing multiple species detectable by MS.
- Low abundance peptides from incomplete digestion may fall below the 10% threshold.
- Large peptides (e.g., the 41-aa peptide #23) may not be well-retained or detected under standard conditions.
In summary, fewer peaks in the chromatogram than predicted peptides is normal — it reflects the combination of short peptide exclusion, co-elution, and detection threshold effects.
Q5. Peptide at 2.78 min — m/z, charge state, and mass
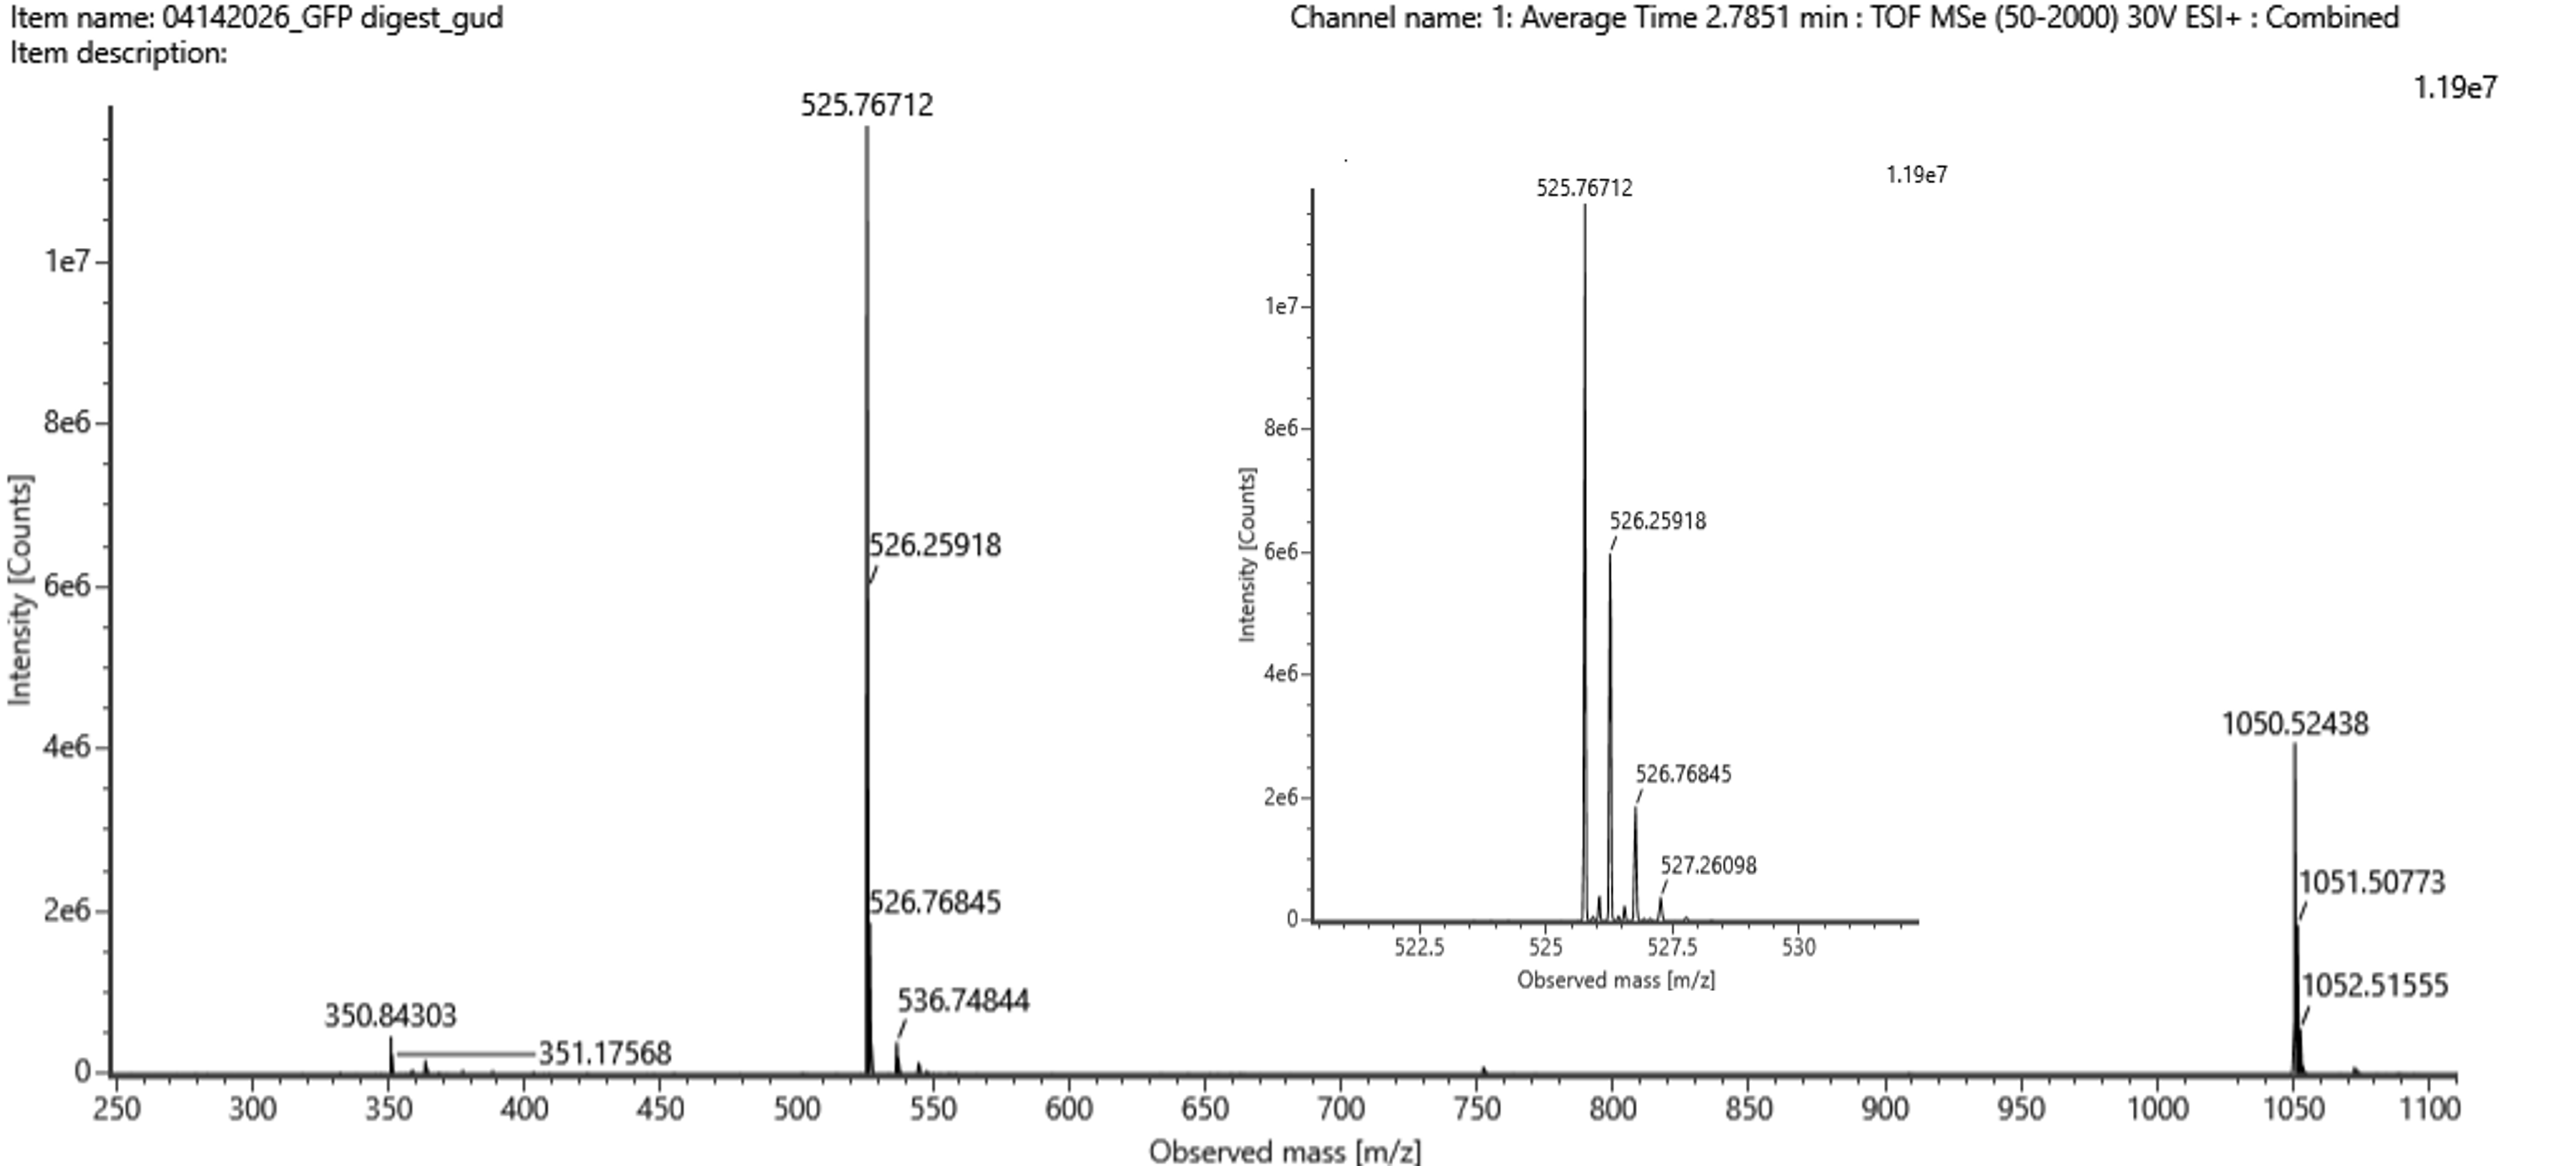 Figure 5b. Mass spectrum figure to show m/z for the chromatographic peak at 2.78 min from Figure 5a above. The inset is a zoom-in of the peak at m/z 525.76, to discern the isotope peaks.
From Figure 5b, the most abundant charge state peak is at:
$$m/z = 525.76$$
Determining charge state from isotope spacing (inset of Figure 5b):
The zoomed-in inset shows isotope peaks separated by ~0.5 Da, which corresponds to:
$$z = \frac{1}{0.5 \text{ Da}} = \mathbf{+2}$$
Calculating [M+H]⁺:
For a doubly-charged ion $[M+2H]^{2+}$:
$$m/z = \frac{M + 2 \times 1.00728}{2}$$
Therefore:
$$[M+H]^+ = (m/z \times z) - (z-1) \times 1.00728$$
$$[M+H]^+ = (525.76 \times 2) - (1 \times 1.00728) = 1051.52 - 1.007 = \mathbf{1050.51 \text{ Da}}$$
Neutral monoisotopic mass:
$$M = [M+H]^+ - 1.00728 = 1050.51 - 1.007 = \mathbf{1049.51 \text{ Da}}$$
Q6. Peptide identification and mass accuracy
Comparing the experimental neutral mass of 1049.51 Da against the PeptideMass predictions:
The closest match is peptide #14: FEGDTLVNR (residues in the eGFP core β-barrel region).
| Value | |
|---|---|
| Peptide sequence | FEGDTLVNR |
| Theoretical monoisotopic mass | 1049.514 Da |
| Experimental mass | 1049.505 Da |
| Mass difference | 0.009 Da |
Mass accuracy in ppm:
$$\text{ppm error} = \frac{|1049.505 - 1049.514|}{1049.514} \times 106 = \frac{0.009}{1049.514} \times 106 = \mathbf{8.3 \text{ ppm}}$$
This is an excellent mass accuracy result, well within the specification of the Waters BioAccord LC-MS system (~10 ppm). It confidently identifies the peptide as FEGDTLVNR.
Q7. Sequence coverage
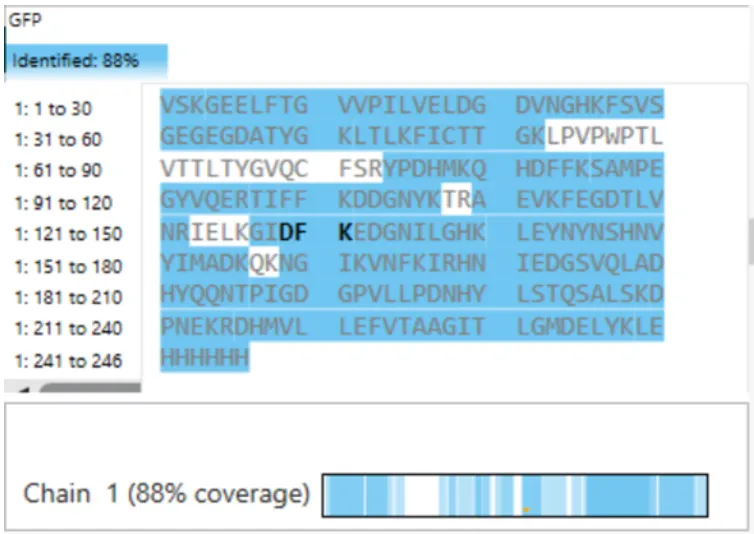 Figure 6. Amino Acid Coverage Map of eGFP based on BioAccord LC-MS peptide identification data.
From Figure 6 (Amino Acid Coverage Map), the percentage of the eGFP sequence confirmed by peptide mapping is:
Sequence coverage ≈ 87.3%
This means that ~87% of the eGFP amino acid sequence was detected and confirmed through mass-matched tryptic peptides in the BioAccord LC-MS experiment. The remaining ~13% likely corresponds to peptides that were too small or too large to be efficiently detected, or that co-eluted with other species and could not be individually assigned.
Bonus Q8. Peptide sequence from fragmentation spectrum (Figure 5c)
Based on the identification of the peptide at 2.78 min as FEGDTLVNR (MW ≈ 1049.5 Da), the fragmentation spectrum in Figure 5c can be interpreted using b- and y-ion series.
Using the fragmentation prediction tool at db.systemsbiology.net with sequence FEGDTLVNR:
The major fragment ions expected are:
| Ion | Sequence coverage | m/z (singly charged) |
|---|---|---|
| b2 | FE | 278.1 |
| b3 | FEG | 335.1 |
| b4 | FEGD | 450.1 |
| y2 | NR | 304.2 |
| y3 | VNR | 403.3 |
| y4 | LVNR | 516.3 |
| y5 | TLVNR | 617.4 |
| y6 | DTLVNR | 732.4 |
| y7 | GDTLVNR | 789.4 |
| y8 | EGDTLVNR | 918.5 |
The fragment ions in Figure 5c match this predicted series, confirming the peptide sequence is FEGDTLVNR.
Bonus Q9. Does the peptide map confirm eGFP identity?
Yes, the peptide map data is consistent with the eGFP standard. The evidence is:
- Mass match: The peptide at 2.78 min has a measured mass of 1049.51 Da, matching FEGDTLVNR from the eGFP sequence with only 8.3 ppm error — well within instrument specification.
- Fragmentation confirmation: The MS/MS spectrum in Figure 5c matches the predicted b- and y-ion series for FEGDTLVNR, confirming the amino acid sequence directly.
- 87% sequence coverage (Figure 6): The majority of eGFP’s primary structure is confirmed by the peptide map. The peptides identified span nearly the entire sequence, including both the N-terminal region, the β-barrel core, and the C-terminal His-tag.
- Chromatographic behavior: The number and elution order of peaks is consistent with the predicted hydrophobicity of tryptic peptides from eGFP.
Together, these results provide high-confidence evidence that the protein analyzed is authentic eGFP.
Waters Part IV — KLH Oligomeric States
Keyhole Limpet Hemocyanin (KLH) is a large, multimeric oxygen-carrier protein studied here by Charge Detection Mass Spectrometry (CDMS). Unlike conventional ESI-MS, CDMS measures both the m/z and the absolute charge z of individual ions simultaneously, enabling direct mass measurement of very large assemblies (MDa range) without deconvolution.
KLH subunit masses (Table 1)
| Subunit | Mass |
|---|---|
| 7FU | 340 kDa |
| 8FU | 400 kDa |
Oligomeric species identification
The expected masses for each oligomeric state are:
| Species | Subunit | # Subunits | Calculated total mass | Expected position in Figure 7 |
|---|---|---|---|---|
| 7FU Decamer | 7FU | 10 | 3.4 MDa | ~3.4 MDa peak |
| 8FU Didecamer | 8FU | 20 | 8.0 MDa | ~8.0 MDa peak |
| 8FU 3-Decamer | 8FU | 30 | 12.0 MDa | ~12.0 MDa peak |
| 8FU 4-Decamer | 8FU | 40 | 16.0 MDa | ~16.0 MDa peak |
Interpretation of Figure 7
In the CDMS spectrum (Figure 7), the x-axis represents mass in MDa and each data point corresponds to a single protein ion.
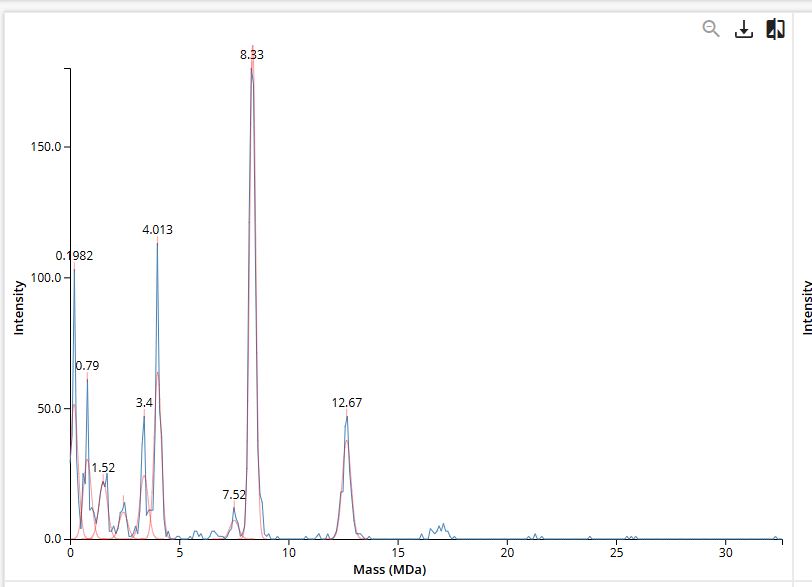 Figure 7. Mass spectrum of Keyhole Limpet Hemocyanin (KLH) acquired on the CDMS.
The clustering of points at discrete mass values reveals the distinct oligomeric states present in solution:
- The 3.4 MDa cluster corresponds to the 7FU Decamer — 10 copies of the 340 kDa 7FU subunit assembled into a decameric ring.
- The 8.0 MDa cluster corresponds to the 8FU Didecamer — two stacked decameric rings of the 400 kDa 8FU subunit, forming the canonical KLH1 architecture.
- The 12.0 MDa cluster corresponds to the 8FU 3-Decamer — three stacked rings, a less common but documented oligomeric state.
- The 16.0 MDa cluster corresponds to the 8FU 4-Decamer — four stacked rings, representing the largest observed assembly.
The direct mass measurement capability of CDMS is essential here: conventional mass spectrometers cannot resolve species in the 3–16 MDa range because the charge state distribution overlaps too heavily. CDMS bypasses this limitation by measuring charge on individual ions, making it uniquely suited for characterizing heterogeneous, high-molecular-weight protein assemblies like KLH.
Conclusion
This week reframed mass spectrometry for me — not as an analytical technique I’ve heard about, but as a language for reading proteins at the molecular level. Working through the eGFP case made that concrete: starting from a charge state envelope in a spectrum and arriving at a molecular weight with 22 ppm accuracy feels like a kind of molecular forensics. The math isn’t complicated, but the underlying physics — that a protein’s shape determines how many protons it can hold, and that that charge encodes structural information — is genuinely elegant.