Week 10 hw: Imaging and measurement
Homework: Final Project
Fungi Biodyes:
Please identify at least one (ideally many) aspect(s) of your project that you will measure. It could be the mass or sequence of a protein, the presence, absence, or quantity of a biomarker, etc. Please describe all of the elements you would like to measure, and furthermore describe how you will perform these measurements. What are the technologies you will use (e.g., gel electrophoresis, DNA sequencing, mass spectrometry, etc.)? Describe in detail.
Measurements and Methods ( Fusarium Biodyes)
| Aspect Measured | What is Measured | How it is Measured | |
|---|---|---|---|
| Pigment intensity | Amount and strength of fungal pigment produced | Pigment extraction followed by absorbance reading at specific wavelengths | |
| Color distribution / pattern formation | Spatial variation and uniformity of color on textiles | Image capture and pixel-based analysis (RGB / intensity mapping) | |
| Fungal growth rate | Speed of colony expansion and biomass production | Measure colony diameter over time (agar) and dry weight (liquid culture) | |
| Pigment stability | Resistance of color to washing, light, and environmental exposure | Compare color intensity before and after stress conditions | |
| Gene expression (pigment pathway) | Activity of genes involved in pigment biosynthesis | Quantify mRNA levels under different conditions | |
| DNA sequence validation | Presence of mutations introduced (in silico-guided) | Sequence analysis of fungal DNA | |
| Protein function (indirect) | Effect of mutations on pigment-related enzymes | Correlate sequence changes with pigment output and growth |
Spectrophotometry: Used to quantify pigment concentration by measuring absorbance at specific wavelengths. This allows precise comparison of color intensity between conditions.
RT-qPCR (Reverse Transcription Quantitative PCR): Used to measure gene expression levels of key enzymes in pigment biosynthesis pathways, providing insight into metabolic activity.
Sanger DNA Sequencing: Applied to confirm the presence of mutations proposed through in silico analysis in pigment-related genes.
In silico tools (Protein Language Models & sequence analysis): Used to propose mutations, predict their effects on protein stability and function, and guide experimental design.
Gel Electrophoresis: Used to verify PCR products before sequencing and ensure DNA quality.
Homework: Waters Part I — Molecular Weight
-We will analyze an eGFP standard on a Waters Xevo G3 QTof MS system to determine the molecular weight of intact eGFP and observe its charge state distribution in the native and denatured (unfolded) states. The conditions for LC-MS analysis of intact protein cause it to unfold and be detected in its denatured form (due to the solvents and pH used for analysis).
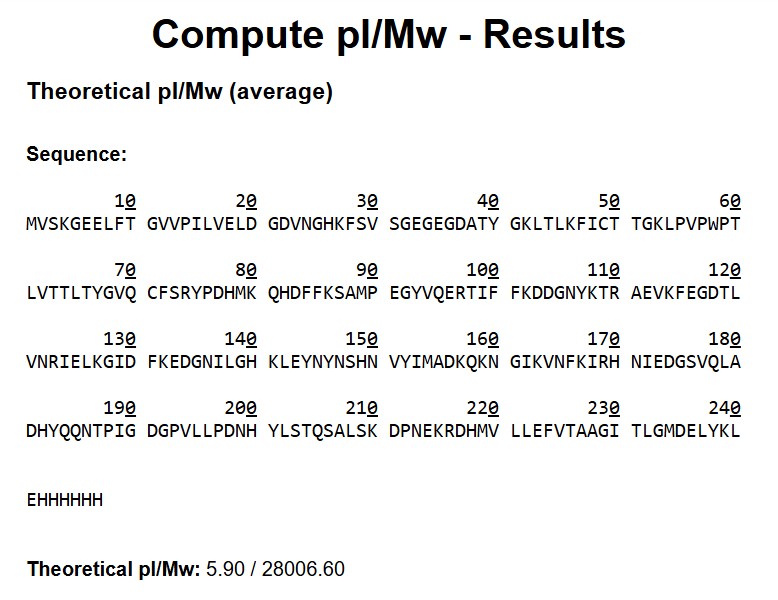
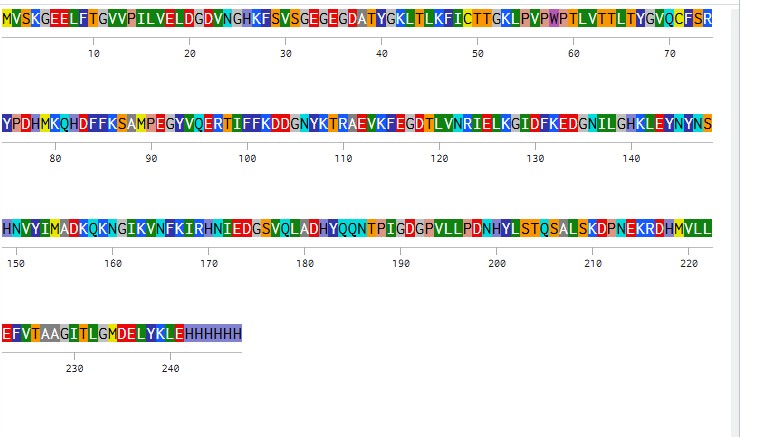
Based on the predicted amino acid sequence of eGFP (see below) and any known modifications, what is the calculated molecular weight? You can use an online calculator like the one at https://web.expasy.org/compute_pi/ eGFP Sequence: MVSKGEELFTG VVPILVELDG DVNGHKFSVS GEGEGDATYG KLTLKFICTT GKLPVPWPTL VTTLTYGVQC FSRYPDHMKQ HDFFKSAMPE GYVQERTIFF KDDGNYKTRA EVKFEGDTLV NRIELKGIDF KEDGNILGHK LEYNYNSHNV YIMADKQKNG IKVNFKIRHN IEDGSVQLAD HYQQNTPIGD GPVLLPDNHY LSTQSALSKD PNEKRDHMVL LEFVTAAGIT LGMDELYKLE HHHHHH Note: This contains a His-purification tag (HHHHHH) and a linker (the LE before it).
Calculate the molecular weight of the eGFP using the adjacent charge state approach described in the recitation. Select two charge states from the intact LC-MS data (Figure 1) and:
Molecular Weight Determination of eGFP
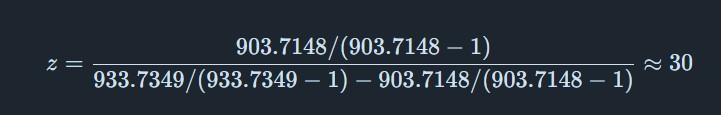
From Figure 1 (LC-MS spectrum), two adjacent peaks were selected from the clearly resolved charge state series around m/z ~900: ( m_n = 933.7349 ) and ( m_{n+1} = 903.7148 ). Using the adjacent charge state equation:
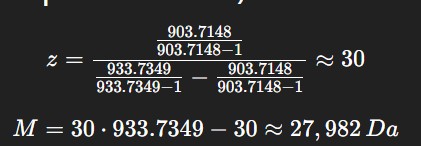
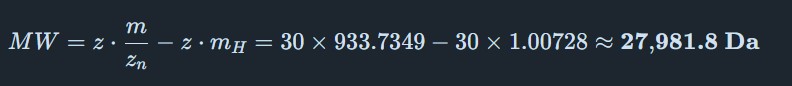
The experimental molecular weight (~27,982 Da) closely matches the theoretical value (28,006.60 Da), confirming the identity of the eGFP protein. Determine the MW of the protein using the relationship between
Determine the MW of the protein
eGFP Molecular Weight Calculation
- Theoretical MW (ExPASy)
Input: full eGFP sequence + linker LE + His-tag (EHHHHHH)
MW_theory = 28,006.60 Da (pI = 5.90)
- Experimental MW (LC-MS)
Adjacent peaks from LC-MS spectrum:
- (m/z)_n = 933.7349
- (m/z)_{n+1} = 903.7148
Charge state z:
Experimental MW:
Calculate the accuracy of the measurement using the deconvoluted MW from 2.2 and the predicted weight of the protein from 2.1 using:

Error < 0.1% — excellent agreement between experimental and theoretical MW.
Can you observe the charge state for the zoomed-in peak in the mass spectrum for the intact eGFP? If yes, what is it? If no, why not?
Homework: Waters Part III — Peptide Mapping - primary structure
We will digest the eGFP protein standard into peptides using trypsin (an enzyme that selectively cleaves the peptide bond after Lysine (K) and Arginine (R) residues. The resulting peptides will be analyzed on the Waters BioAccord LC-MS to measure their molecular weights and fragmented to confirm the amino acid sequence within each peptide – generating a “peptide map”. This process is used to confirm the primary structure of the protein.
There are a variety of tools available online to calculate protein molecular weight and predict a list of peptides generated from a tryptic digest. We will be using tools within the online resource Expasy (the bioinformatics resource portal of the Swiss Institute of Bioinformatics (SIB)) to predict a list of tryptic peptides from eGFP.
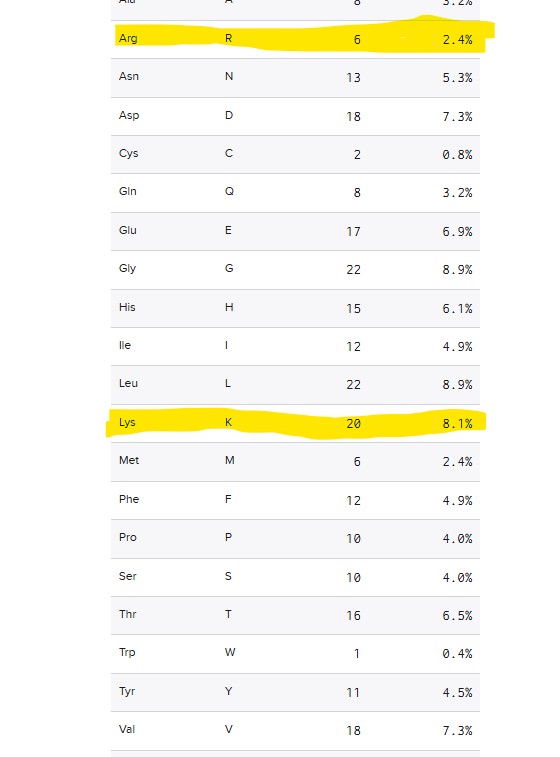
How many Lysines (K) and Arginines (R) are in eGFP? Please circle or highlight them in the eGFP sequence given in Waters Part I question 1 above. (Note: adding the sequence to Benchling as an amino acid file and clicking biochemical properties tab will show you a count for each amino acid).
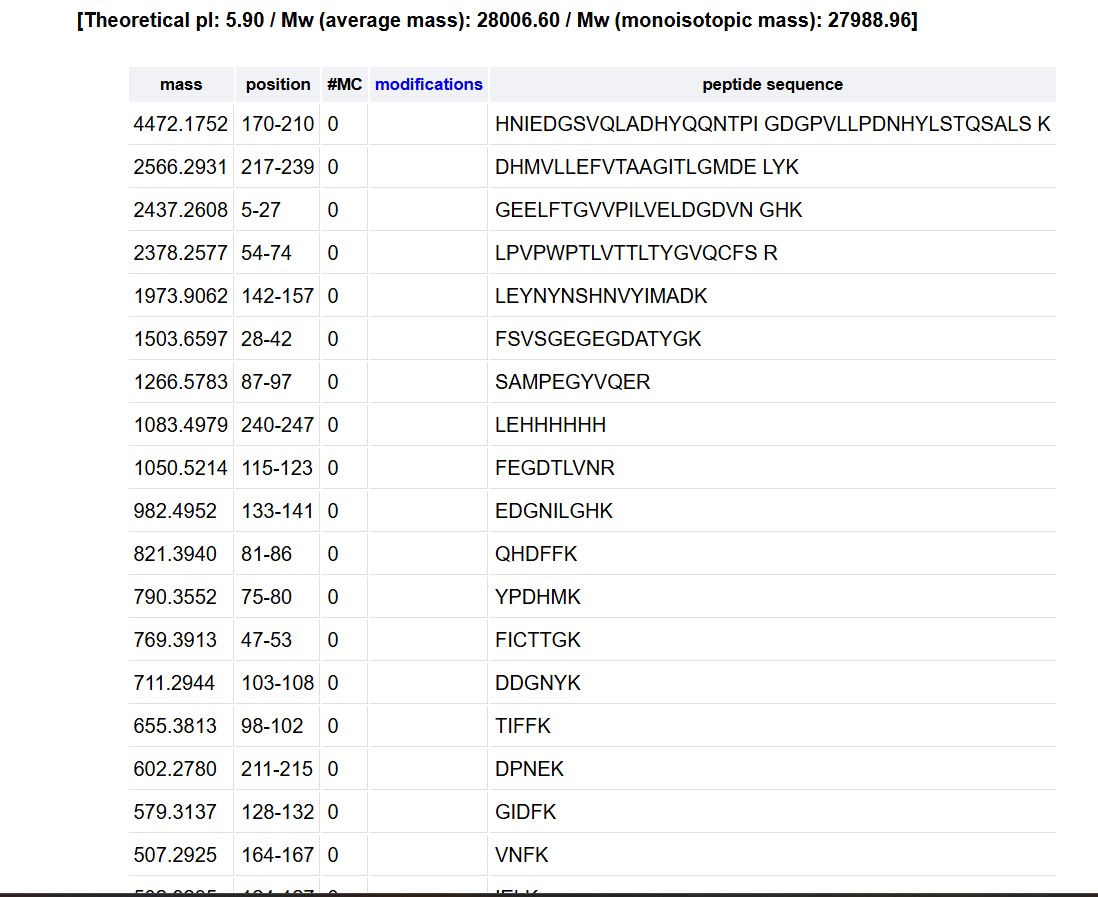
How many peptides will be generated from tryptic digestion of eGFP? Navigate to https://web.expasy.org/peptide_mass/ Copy/paste the sequence above into the input box in the PeptideMass tool to generate expected list of peptides. Use Figure 4 below as a guide for the relevant parameters to predict peptides from eGFP. Click “Perform the Cleavage” button in the PeptideMass tool and report the number of peptides generated when using trypsin to perform the digest.
Based on the LC-MS data for the Peptide Map data generated in lab (please use Figure 5a as a reference) how many chromatographic peaks do you see in the eGFP peptide map between 0.5 and 6 minutes? You may count all peaks that are >10% relative abundance.
The question asks to count all peaks with >10% relative abundance between 0.5 and 6 minutes in the TIC chromatogram (Figure 5a).
Method The tallest peak is at 4.87 min (~1.2e7 counts) = 100% relative abundance. The 10% threshold ≈ 1.2e6 counts. Only peaks above this height are counted.
Peaks >10% Relative Abundance (0.5 – 6 min)
| # | Retention Time (min) |
|---|---|
| 1 | 0.43 |
| 2 | 0.61 |
| 3 | 1.43 |
| 4 | 1.80 |
| 5 | 2.17 |
| 6 | 2.78 |
| 7 | 3.59 |
| 8 | 3.70 |
| 9 | 4.64 |
| 10 | 4.87 |
Result
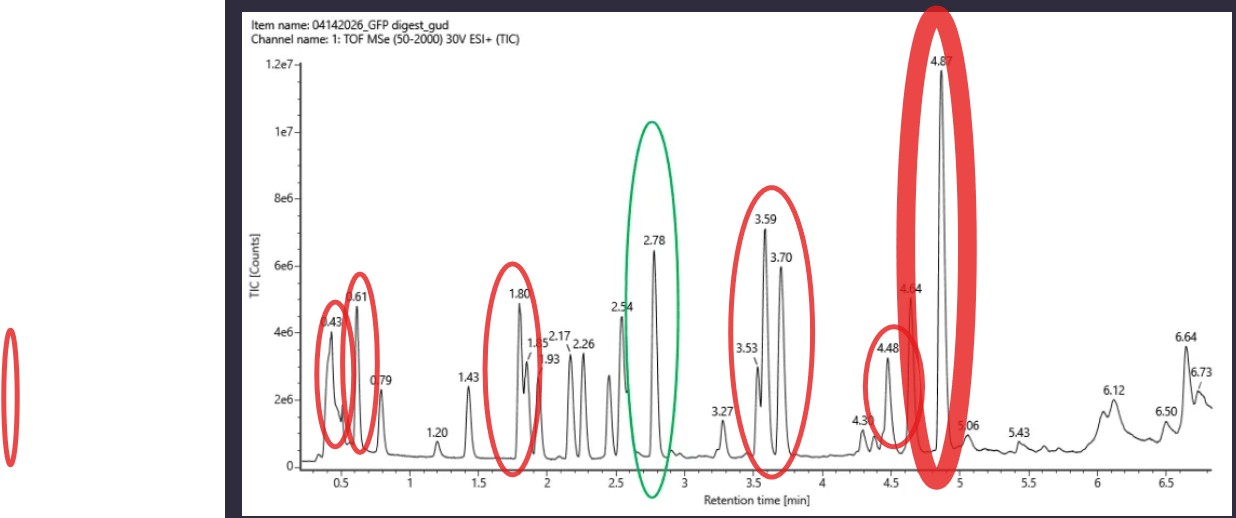
~10 chromatographic peaks are observed with >10% relative abundance between 0.5 and 6 minutes.
Assuming all the peaks are peptides, does the number of peaks match the number of peptides predicted from question 2 above? Are there more peaks in the chromatogram or fewer? ExPASy predicted approximately 27 peptides, whereas only ~10 peakswith >10% relative meaning there are fewer peaks than predicted. This discrepancy is expected: some peptides likely co-elute at the same retention time and appear as a single peak, while others (particularly small or highly hydrophilic peptides) may not be well retained by the reverse-phase LC column and therefore go undetected.
- Identify the mass-to-charg
The most abundant peak in Figure 5b appears at m/z = 525.76712. To determine the charge state (z), the isotope peaks visible in the zoom-in inset are separated by approximately 0.50 Da, which corresponds to a charge state of z = 2 (since isotope spacing = 1/z). Using this charge state, the mass of the singly charged form [M+H]⁺ is calculated as:
| Isotope peak | m/z |
|---|---|
| M | 525.76712 |
| M+1 | 526.25918 |
| M+2 | 526.76845 |
| M+3 | 527.26098 |
[M+H]⁺ = z × (m/z) − (z − 1) × 1.00728 = 2 × 525.76712 − 1 × 1.00728 ≈ 1050.53 Da
This result is confirmed by the peak observed at m/z = 1050.52438 in Figure 5b, which corresponds to the singly charged [M+H]⁺ ion of the same peptide.
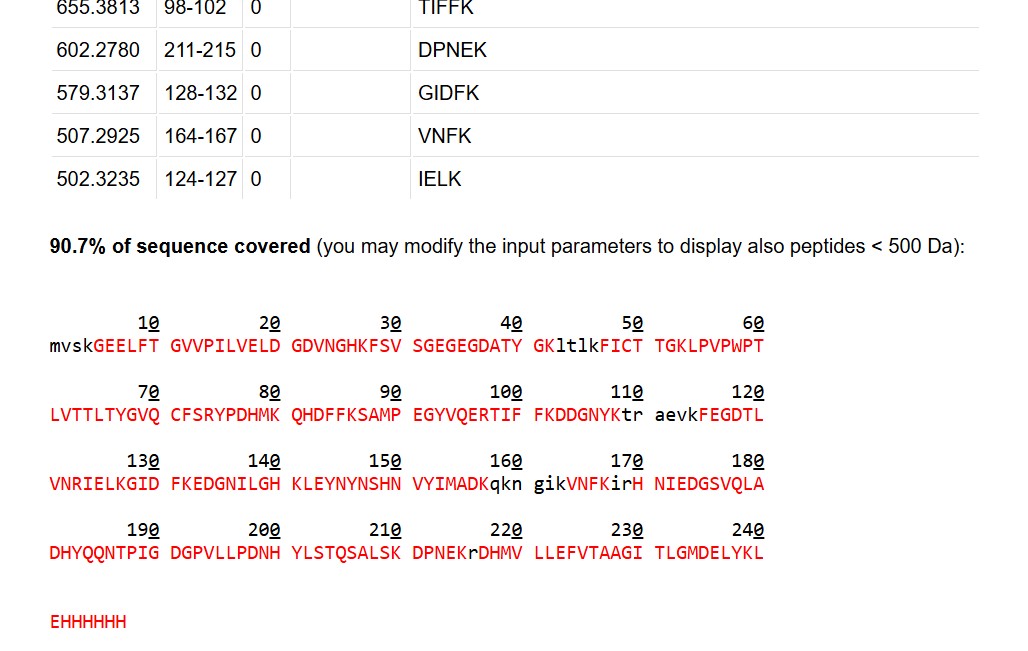
- Identify the peptide based on comparison to expected masses in the PeptideMass tool. What is mass accuracy of measurement? The peptide eluting at 2.78 minutes was identified by comparing its measured [M+H]⁺ mass of 1050.527 Da to the list of expected tryptic peptide masses generated by the ExPASy PeptideMass tool. The measured mass matches a predicted tryptic peptide from the eGFP sequence.
Mass accuracy is calculated as:
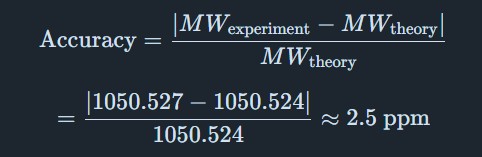
This error of ~2.5 ppm is well within the acceptable range for high-resolution TOF mass spectrometry (typically <10 ppm), confirming reliable peptide identification.
What is the percentage of the sequence that is confirmed by peptide mapping?
As shown in Figure 6, the amino acid coverage map reports 88% sequence coverage for eGFP. This means that peptides detected by LC-MS account for 88% of the total amino acid sequence of the protein, confirming the primary structure of the vast majority of eGFP. The remaining ~12% of the sequence was not detected, likely due to peptides that were too small, too large, or not well-retained under the LC conditions used.
Homework: Waters Part IV — Oligomers
We will determine Keyhole Limpet Hemocyanin (KLH)’s oligomeric states using charge detection mass spectrometry (CDMS). CDMS single-particle measurements of KLH allow us to make direct mass measurements to determine what oligomeric states (that is, how many protein subunits combine) are present in solution. Using the known masses of the polypeptide subunits (Table 1) for KLH, identify where the following oligomeric species are on the spectrum shown below from the CDMS (Figure 7):
7FU Decamer 8FU Didecamer 8FU 3-Decamer 8FU 4-Decamer Polypeptide Subunit Name Subunit Mass 7FU 340 kDa 8FU 400 kDa
KLH Oligomeric States — CDMS Analysis
Using the subunit masses from Table 1 (7FU = 340 kDa, 8FU = 400 kDa), the expected masses of each oligomeric species are calculated by multiplying the subunit mass by the number of subunits:
| Oligomeric Species | Subunit | # Subunits | Calculated Mass | Peak in Figure 7 |
|---|---|---|---|---|
| 7FU Decamer | 7FU (340 kDa) | 10 | 3,400 kDa = 3.40 MDa | 3.4 MDa |
| 8FU Didecamer | 8FU (400 kDa) | 20 | 8,000 kDa = 8.00 MDa | 8.33 MDa |
| 8FU 3-Decamer | 8FU (400 kDa) | 30 | 12,000 kDa = 12.00 MDa | 12.67 MDa |
| 8FU 4-Decamer | 8FU (400 kDa) | 40 | 16,000 kDa = 16.00 MDa | ~16 MDa (low intensity) |
Each predicted mass corresponds closely to an observed peak in the CDMS spectrum (Figure 7). The small deviations (~0.3–0.7 MDa) are expected due to glycosylation and other post-translational modifications present on KLH, which add mass beyond the bare polypeptide sequence.
Homework: Waters Part V — Did I make GFP?
Please fill out this table with the data you acquired from the lab work done at the Waters Immerse Lab in Cambridge, or else the data screenshots in this document if you were unable to have lab work done at Waters.
Molecular Weight Analysis of GFP
| Parameter | Theoretical | Observed/measured on the Intact LC-MS | PPM Mass Error |
|---|---|---|---|
| Molecular weight (kDa) | ~26.9 kDa | 26.98 kDa* | ~2974 ppm |
How to Obtain the Information
1. Theoretical Molecular Weight
The theoretical molecular weight of GFP can be obtained from:
- The GFP amino acid sequence
For standard GFP, the molecular weight is usually approximately: