Week 6 HW: Genetic Circuits Part 1: Assembly Technologies
Assignment: DNA Assembly
Question 1: What are some components in the Phusion High-Fidelity PCR Master Mix and what is their purpose?
Phusion High-Fidelity PCR Master Mix is a 2X, ready-to-use mixture where the exact formulation is partly proprietary, but the functional components are documented in the manufacturer’s manual:
| Component (Phusion 2X Master Mix) | Purpose |
|---|---|
| Phusion High-Fidelity DNA Polymerase | DNA synthesis with high fidelity + proofreading |
| dNTPs (dATP, dCTP, dGTP, dTTP) | Building blocks for new DNA strands |
| HF reaction buffer (salts + pH buffer) | Maintains optimal pH/ionic strength for enzyme function |
| Mg2+ (via buffer system; often MgCl2-derived) | Essential polymerase cofactor |
| Stabilizers / additives (partly proprietary) | Improve enzyme stability and consistency |
| Nuclease-free water | Solvent to reach correct 2X working concentrations |
Reference: Thermo Fisher Phusion High–Fidelity DNA Polymerase Product Information Sheet, standard biochemistry manuals (e.g., Sambrook & Russell).
Question 2: What are some factors that determine primer annealing temperature during PCR?
| Determinant | Effect on TA | Why |
|---|---|---|
| Primer Melting Temperature (Tm) | Increase | Higher Tm means stronger duplex stability, needs higher Ta |
| Primer length | Increase | More base pairs → higher Tm → higher Ta |
| Primer GC% | Increase | GC pairs stabilize duplex more than AT |
| Salt (Na+/K+) concentration | Increase | Screens charges, stabilizes duplex, raises Tm |
| Mg2+ concentration | Increase | Stabilizes primer-template binding; raises effective Tm |
| Primer-template mismatches (more / at 3′ end) | Decrease | Destabilizes duplex; lower Ta needed to anneal |
| Degenerate bases (more degeneracy) | Decrease | Lowers effective match/Tm; often requires lower Ta |
| GC-rich template / strong secondary structure | Decrease | Competes with primer binding; often use lower Ta + additives |
| DMSO / betaine / similar GC additives | Decrease | Reduce duplex stability (esp. GC), lowering effective Tm |
| Need for higher specificity (reduce off-targets) | Increase | Higher Ta increases stringency, reduces non-specific binding |
Question 3: There are two methods from this class that create linear fragments of DNA: PCR, and restriction enzyme digests. Compare and contrast these two methods, both in terms of protocol as well as when one may be preferable to use over the other.
| Aspect / Decision point | PCR (amplification) | Restriction enzyme (cutting) |
|---|---|---|
| What it does | Amplifies a defined region between two primers | Cuts existing DNA at specific recognition sites |
| Input | Template DNA + primers | DNA substrate (plasmid/PCR product/genomic DNA) + restriction enzyme(s) |
| Key reagents | Polymerase mix, primers, dNTPs, buffer, Mg2+ | Restriction enzyme(s), buffer, often BSA (enzyme-dependent) |
| Protocol core steps | Denature → anneal → extend (cycling) | Incubate DNA with enzyme(s) at recommended temperature/time |
| Sequence requirements | Need primer-binding sites flanking target | Need the enzyme recognition site(s) present in the DNA |
| Output fragment boundaries | Defined by primer positions (base-precise) | Defined by cut sites (exact where enzyme cleaves) |
| Can create new sequences? | Yes - primers can add overhangs/tags/sites | No - only cuts at existing sites (unless sites were engineered earlier) |
| Typical use cases | Generate a specific insert, add adapters, site-directed changes, amplify from low-abundance template | Linearize a plasmid, excise an insert, diagnostic mapping, generate compatible ends for cloning |
| Speed / setup | Moderate - requires optimization (Ta, primers) | Fast/simple if sites exist and enzyme conditions are known |
| Failure modes | Non-specific bands, primer-dimers, no amplification, PCR errors | Star activity (wrong cuts), incomplete digestion, missing sites |
| Fidelity / errors | Depends on polymerase; can introduce mutations | No replication - does not introduce point mutations |
| When preferable | When you need a specific fragment and/or to add features (overhangs, tags), or template amount is low | When the fragment is already present and flanked by useful sites; when you need clean linearization/excision without amplification |
Question 4: How can you ensure that the DNA sequences that you have digested and PCR-ed will be appropriate for Gibson cloning?
| Check / requirement | What to do (PCR + digest) | Why it matters for Gibson |
|---|---|---|
| 20–40 bp overlaps at every junction | Design primers so each fragment end has 20–40 bp homology to the adjacent fragment/backbone | Gibson assembly depends on annealing of complementary overlaps |
| Correct orientation of overlaps | Ensure the overlap sequence matches the correct neighbor (A→B, B→C, insert→vector, etc.) | Wrong overlap = wrong assembly or no assembly |
| Linearized backbone | Restriction-digest the vector to a single linear band; gel-purify if needed | Gibson requires a linear backbone (no undigested circular plasmid carryover) |
| Remove template plasmid from PCR | If PCR was from plasmid, treat with DpnI (cuts methylated template) | Prevents parental plasmid background colonies |
| Clean fragment ends (no inhibitors) | Purify PCR and digest products (spin column or gel extraction) | Salts, ethanol, detergents inhibit Gibson enzymes |
| Correct fragment sizes | Run an agarose gel to confirm expected sizes; excise/gel-purify correct bands if mixed | Verifies you’re assembling the intended pieces |
| Avoid duplicate/competing overlaps | Keep overlaps unique (no repeated identical overlap sequences across multiple junctions) | Prevents mis-assembly and rearrangements |
| Overlap doesn’t create strong hairpins/repeats | Check overlap sequences for high secondary structure/repeats | Improves annealing and reduces drop in assembly efficiency |
| Balanced fragment concentrations | Quantify DNA (Nanodrop/Qubit) and use equimolar amounts; keep total DNA in recommended range | Too much/too little of one piece reduces correct assembly |
| No internal cuts from chosen restriction enzymes | Verify your insert/parts don’t contain the restriction sites used to linearize the vector | Prevents unintended fragmentation or loss of insert |
Question 5: How does the plasmid DNA enter the E. coli cells during transformation?
The plasmid DNA enter the E. coli cells during transformation through transient permeability of the cell envelope. This can happen either via:
- Electroporation: a short electric pulse creates temporary membrane pores that let DNA pass into the cytoplasm.
- Chemical (heat-shock) transformation: divalent cations (e.g., Ca²⁺) reduce electrostatic repulsion between DNA and the membrane, and a brief heat shock promotes DNA uptake through temporary pores/defects.
Question 6: Describe another assembly method in detail (such as Golden Gate Assembly)
a) Explain the other method in 5 - 7 sentences plus diagrams (either handmade or online).
Golden Gate Assembly is a molecular cloning technique that allows multiple DNA fragments to be assembled simultaneously in a single reaction. It uses Type IIS restriction enzymes such as BsaI, BsmBI, or BbsI, which cut DNA outside their recognition sequence and generate custom sticky ends. We can control the order and orientation in which DNA fragments assemble by placing Type IIS restriction sites around each fragment and designing specific 4-bp overhangs that are complementary only to the intended neighboring fragment, the order and orientation of DNA assembly are precisely controlled.. During the reaction, the restriction enzyme digests the DNA fragments while T4 DNA ligase simultaneously ligates matching overhangs in the same tube, making the process efficient and rapid. Because the restriction sites are removed during assembly, the correctly assembled construct cannot be cut again, while incorrect products continue to be digested, driving the reaction toward the desired product. The reaction is typically performed in a thermocycler alternating between ~37 °C (optimal for digestion) and ~16 °C (optimal for ligation). This method is widely used in synthetic biology because it enables scarless assembly of many DNA parts, although internal Type IIS restriction sites must first be removed usually by silent mutation(s).
Golden Gate Assembly – Step-by-Step Diagram
Step 1: Design fragments with Type IIS sites
Vector: [BsaI]─────────────[BsaI]
Fragment A: [BsaI]──Part A──[BsaI]
Fragment B: [BsaI]──Part B──[BsaI]
Inward-facing BsaI sites. Overhangs are designed to match the next fragment.
Step 2: Type IIS cuts outside recognition sites
Vector: GCTT—–
Fragment A: —–AATG (overhang)
Fragment B: AATG—–GCTT (overhangs)
Recognition sites (BsaI) are removed on small excised pieces.
Step 3: Annealing of fragments
Vector —–GCTT
Fragment A GCTT—–AATG
Fragment B AATG—–CGAA
Overhangs anneal only to the correct partner. Orientation is fixed.
Step 4: Ligase seals fragments
Final construct:
Vector ── Fragment A ── Fragment B
Scarless assembly. BsaI sites are gone, so the construct is stable.
Step 5: Reaction drives correct assembly
- Misassembled fragments still have exposed BsaI sites → cut again
- Correct product accumulates over multiple cycles
Key Points:
- Modular → promoters, RBS, genes, terminators
- Multi-fragment assembly in one tube
- Order & orientation controlled by 4-bp overhangs
- Scarless final product
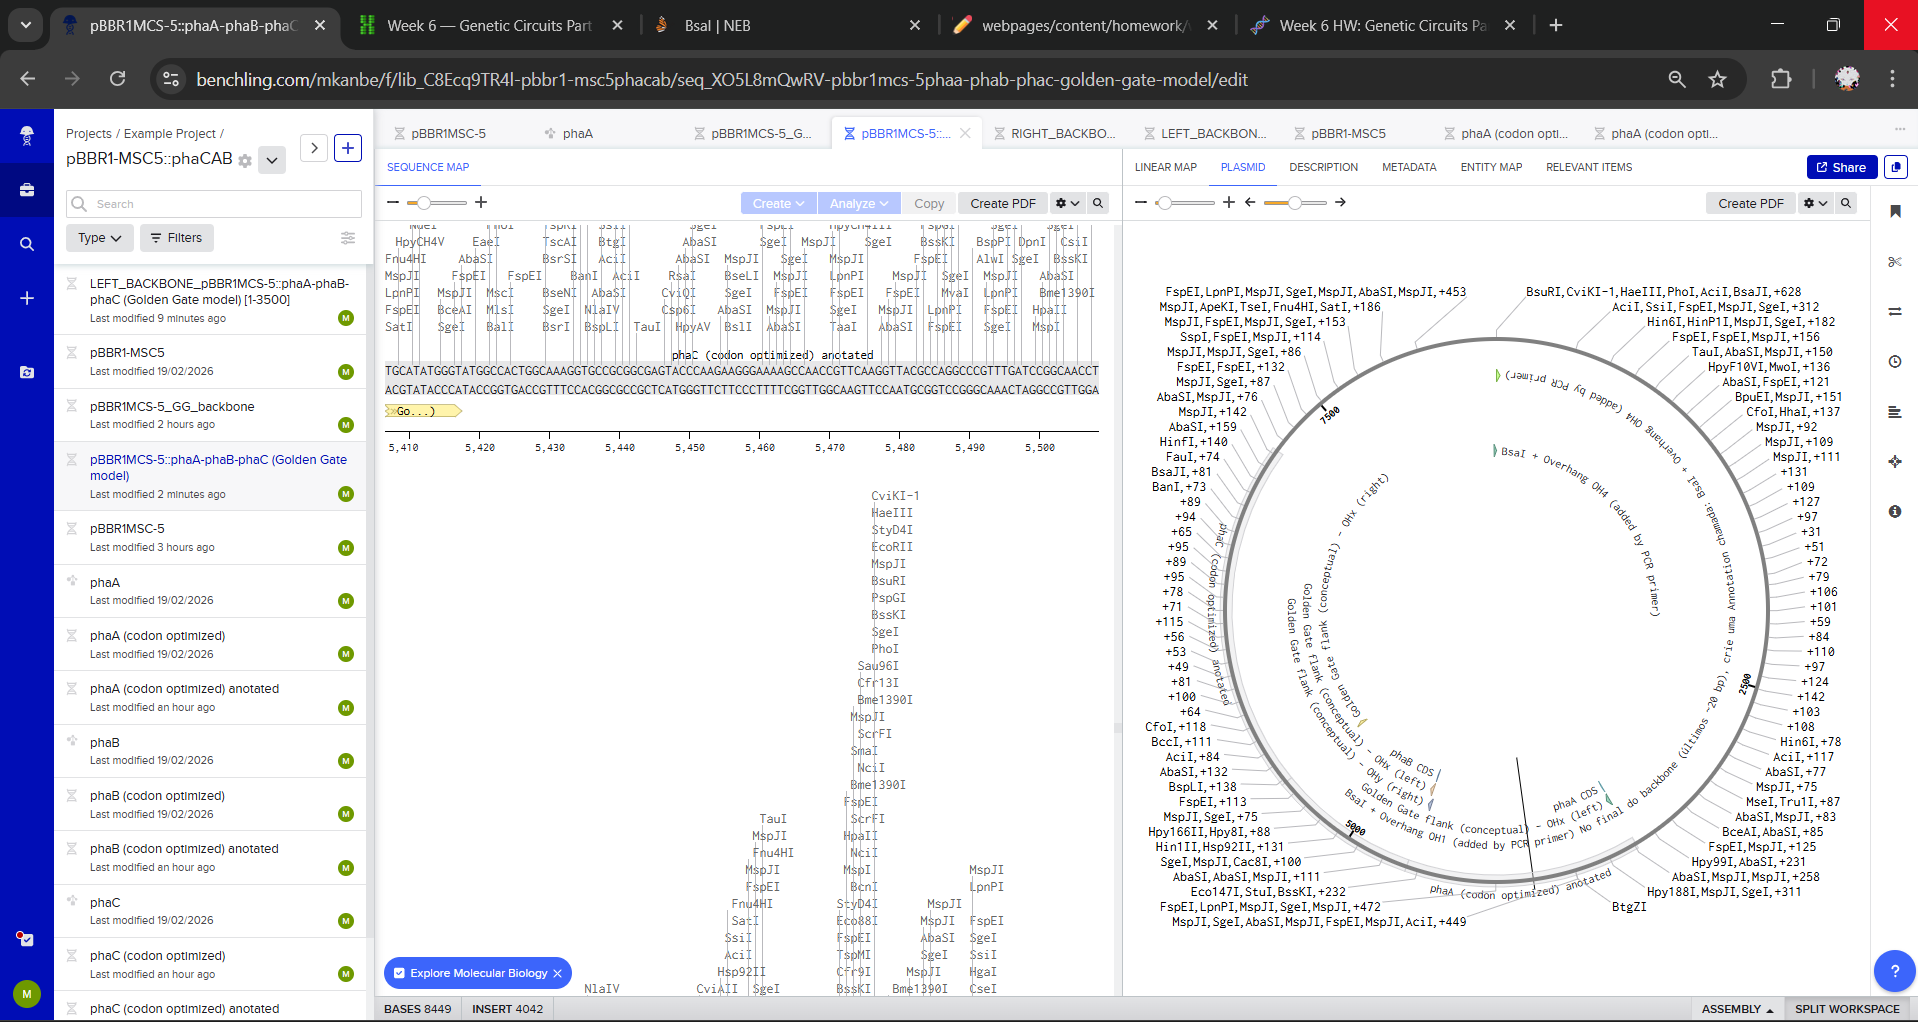
b) Model this assembly method with Benchling or a similar tool!
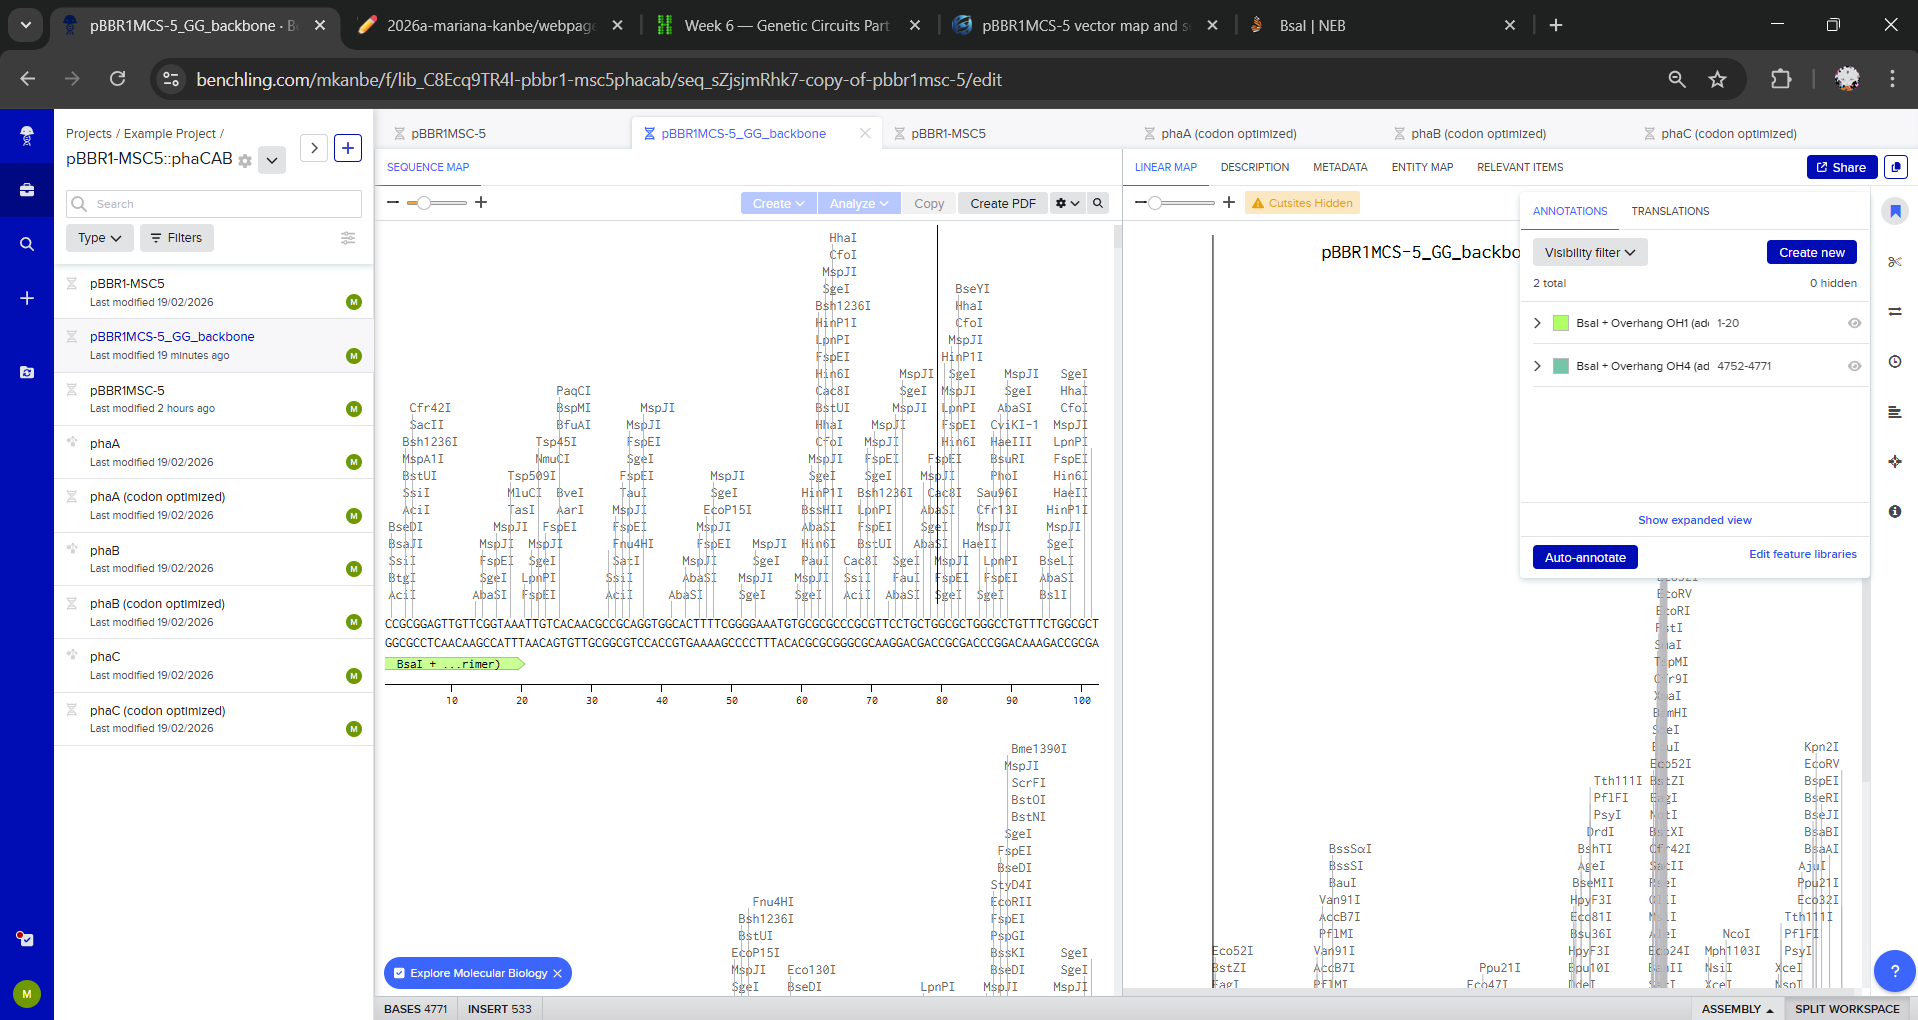
I imported the pBBR1MCS-5 sequence as circular DNA (pBBR1MCS-5 (raw)) and imported phaA, phaB, phaC as separate linear DNA sequences.
I checked for internal BsaI sites (GGTCTC) in all sequences: the genes have no BsaI sites, and pBBR1MCS-5 has a single BsaI site, so it is not a Golden Gate destination vector by direct digest. To model Golden Gate anyway, I created a PCR-linearized Golden Gate backbone: I duplicated the plasmid and saved a linear version (pBBR1MCS-5_GG_backbone).
On this linear backbone, I created two endpoint annotations (first ~20 bp and last ~20 bp) to represent that PCR primers would add inward-facing BsaI sites + 4 bp overhangs:
- start: BsaI + Overhang OH1 (added by PCR primer)
- end: BsaI + Overhang OH4 (added by PCR primer)
To simplify the Benchling model, I represented Golden Gate flanks (inward-facing BsaI sites and 4-bp overhangs) as annotations rather than explicitly adding the flanking sequences. In a real build, these flanks would be introduced via PCR primers or synthesis.
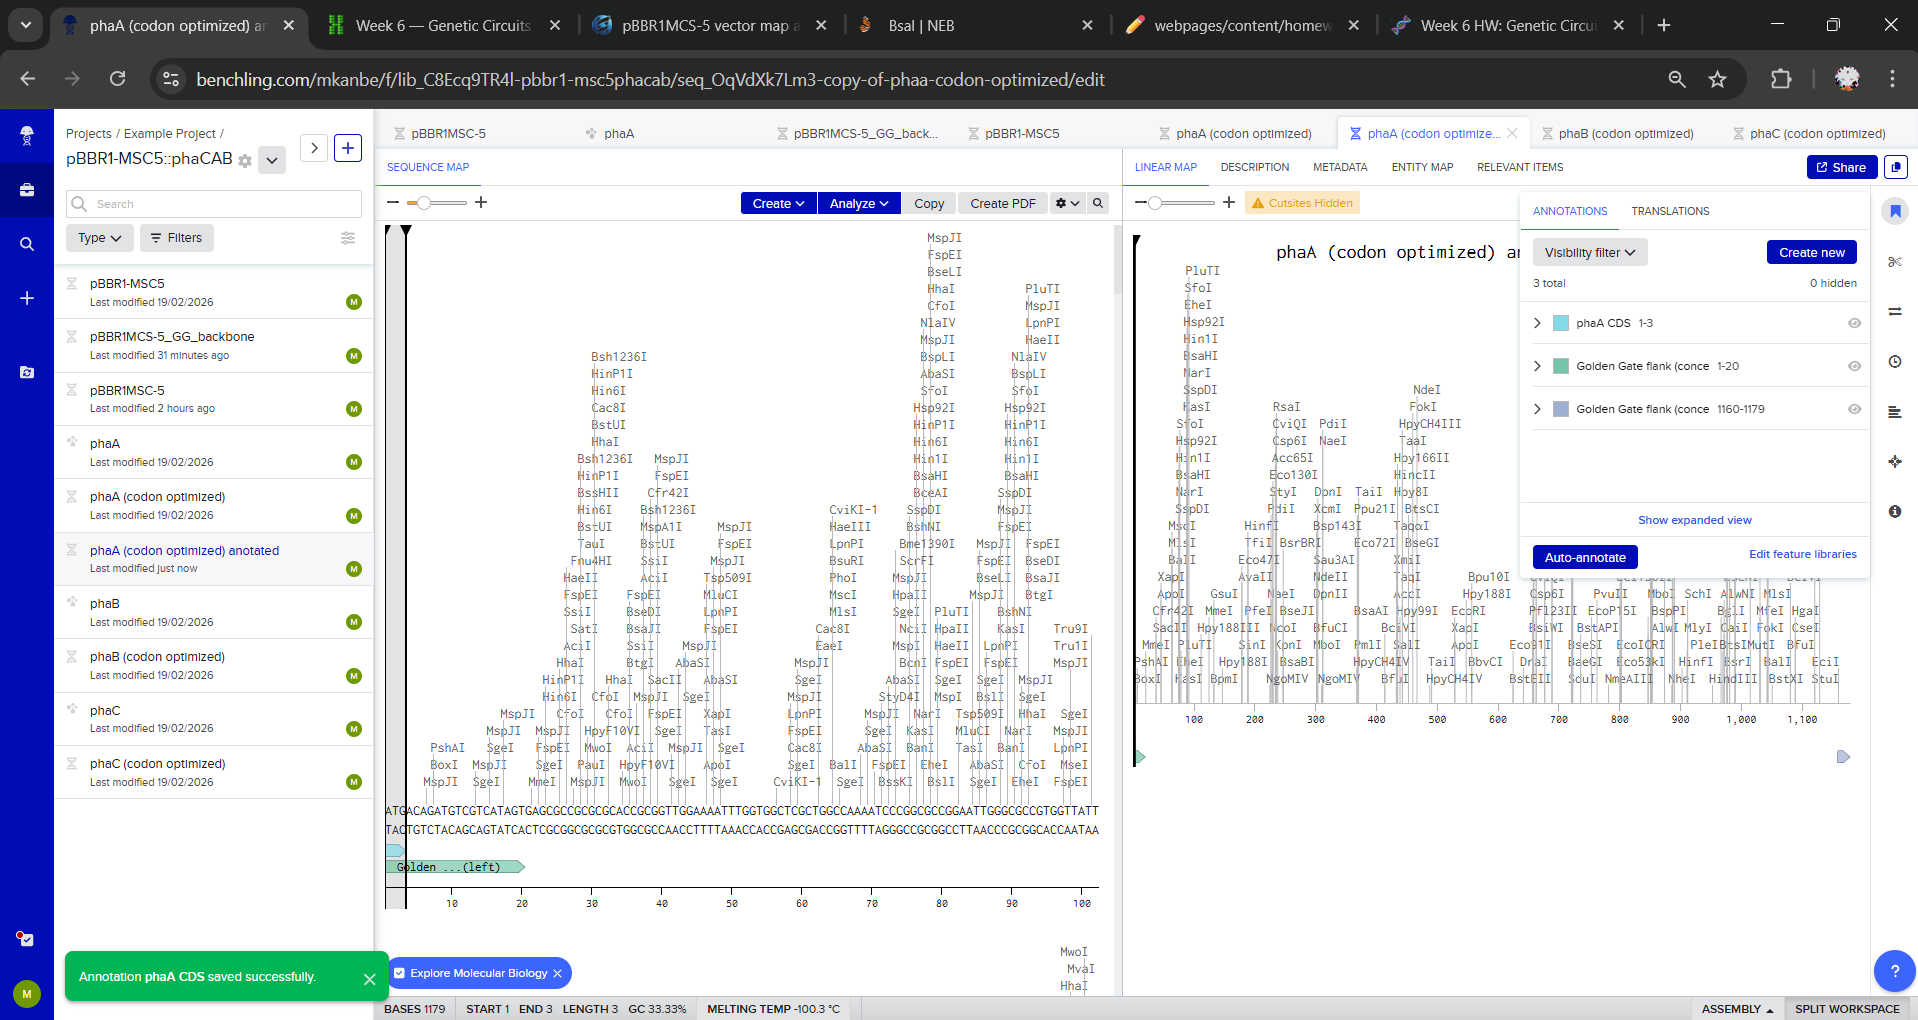
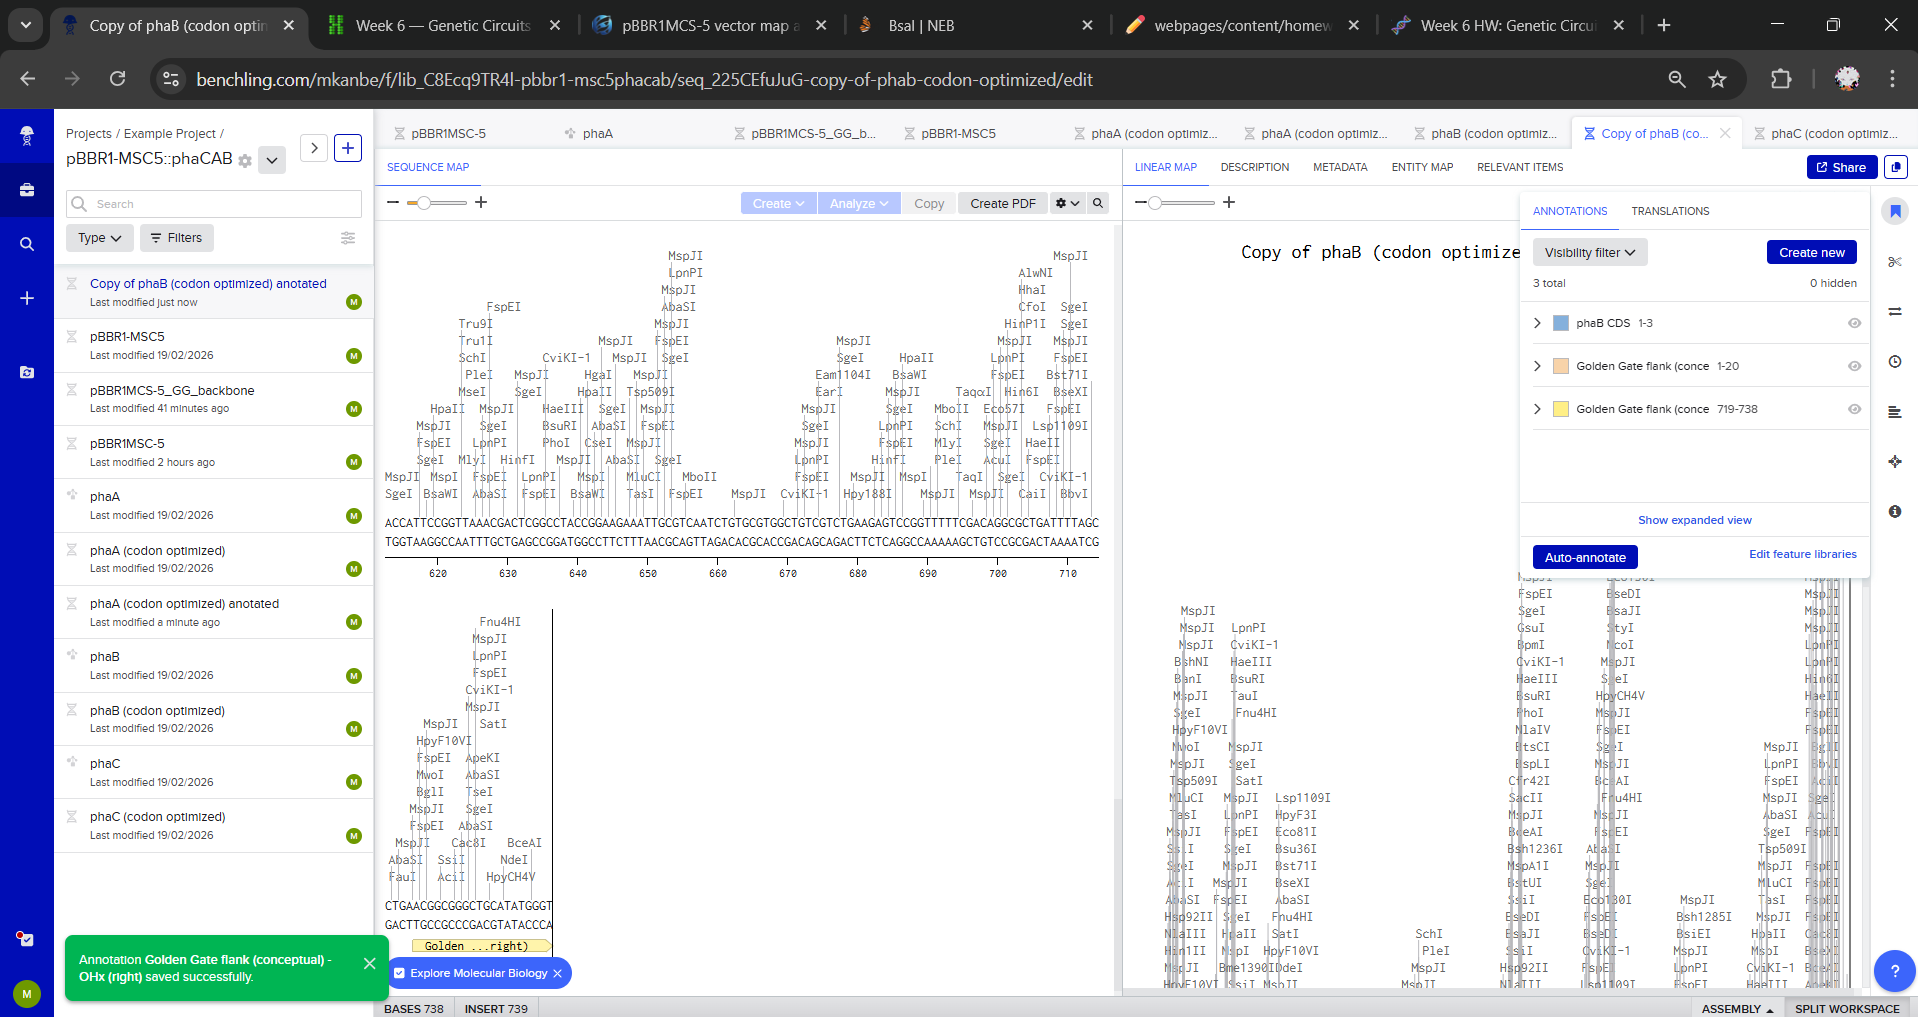
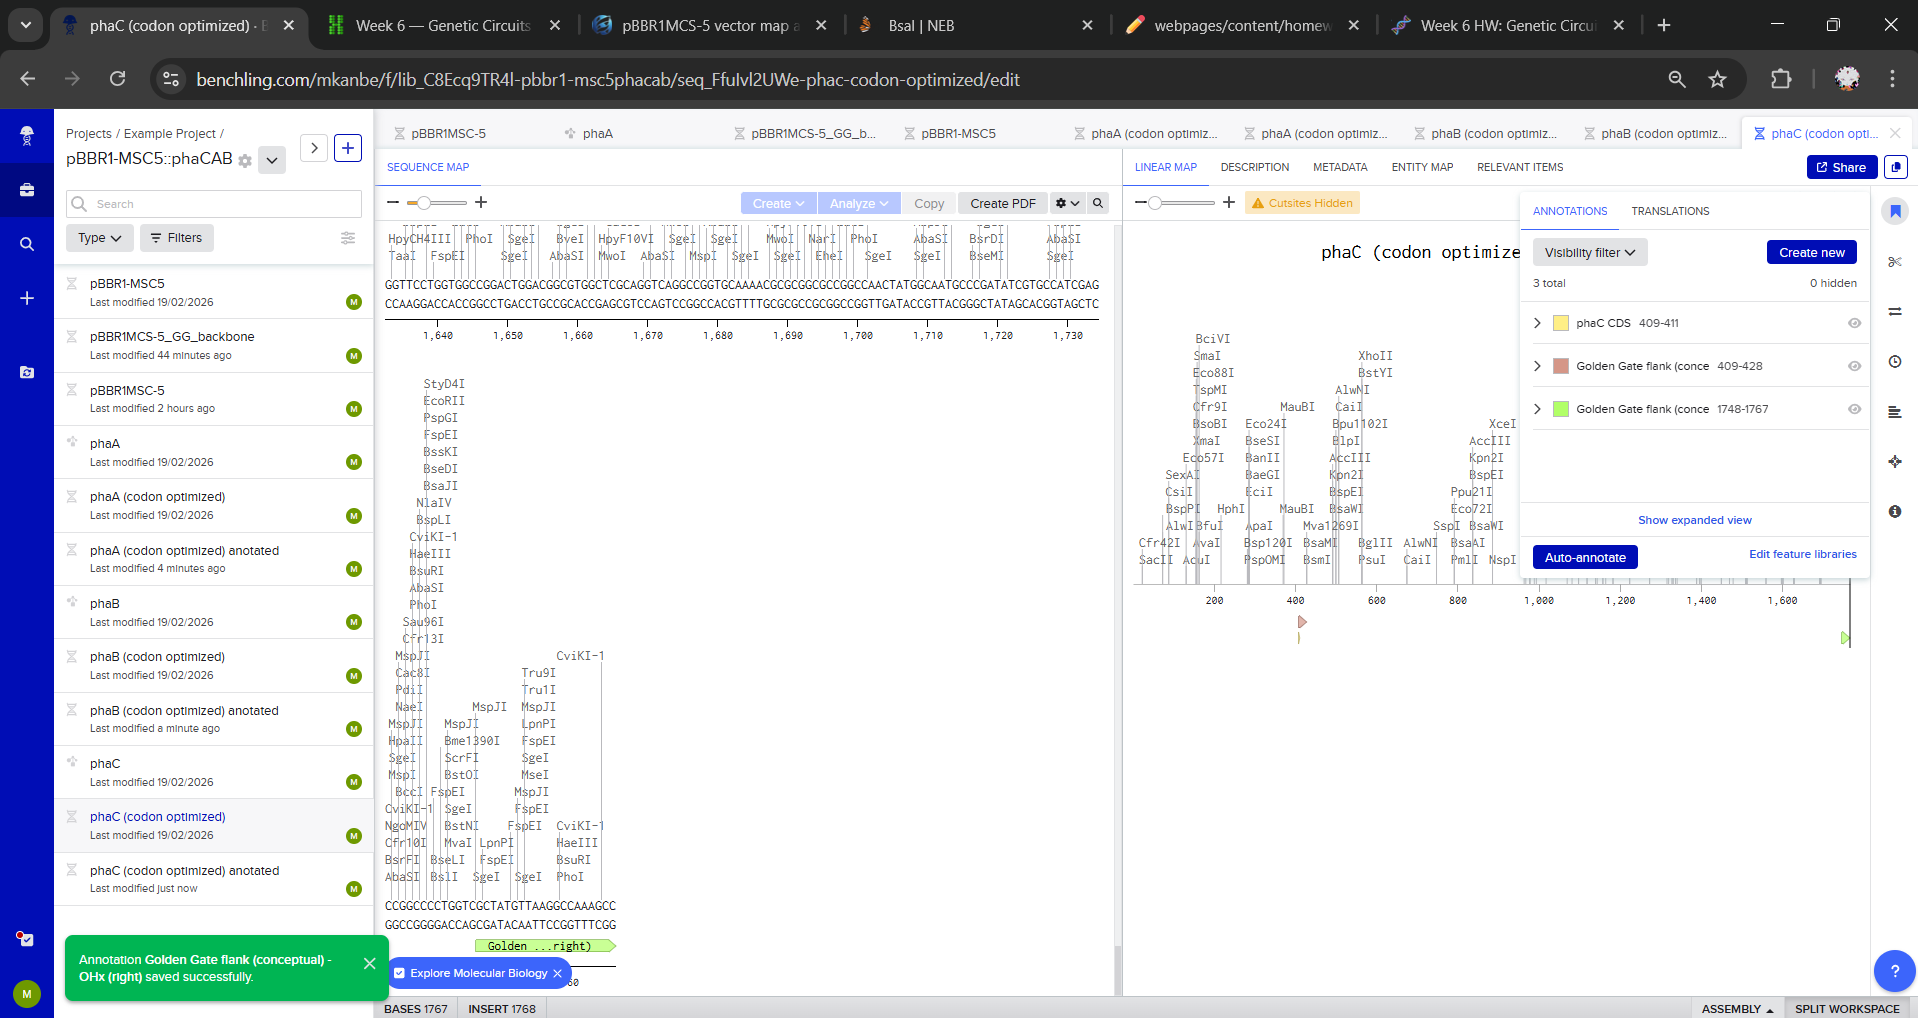
I duplicated each gene to create Golden Gate-ready parts (phaA (codon optimized) anotated, phaB (codon optimized) anotated and phaC (codon optimized) anotated) and defined the assembly overhang scheme for directional order. For each gene, I added annotations with intended Golden Gate junction overhangs:
- Left end: Intended Golden Gate overhang: OH1 (conceptual)
- Right end: Intended Golden Gate overhang: OH2 (conceptual)
Overhangs were not added as literal sequences, I only annotated the first/last 20 bp to indicate where BsaI-generated 4 bp overhangs would be introduced via primers/synthesis.
For a simplified Golden Gate model in Benchling, I manually constructed the final plasmid sequence by opening pBBR1MCS-5 at the MCS and concatenating the backbone with phaA–phaB–phaC in the intended order. Overhangs/Type IIS flanks were represented as annotations only.
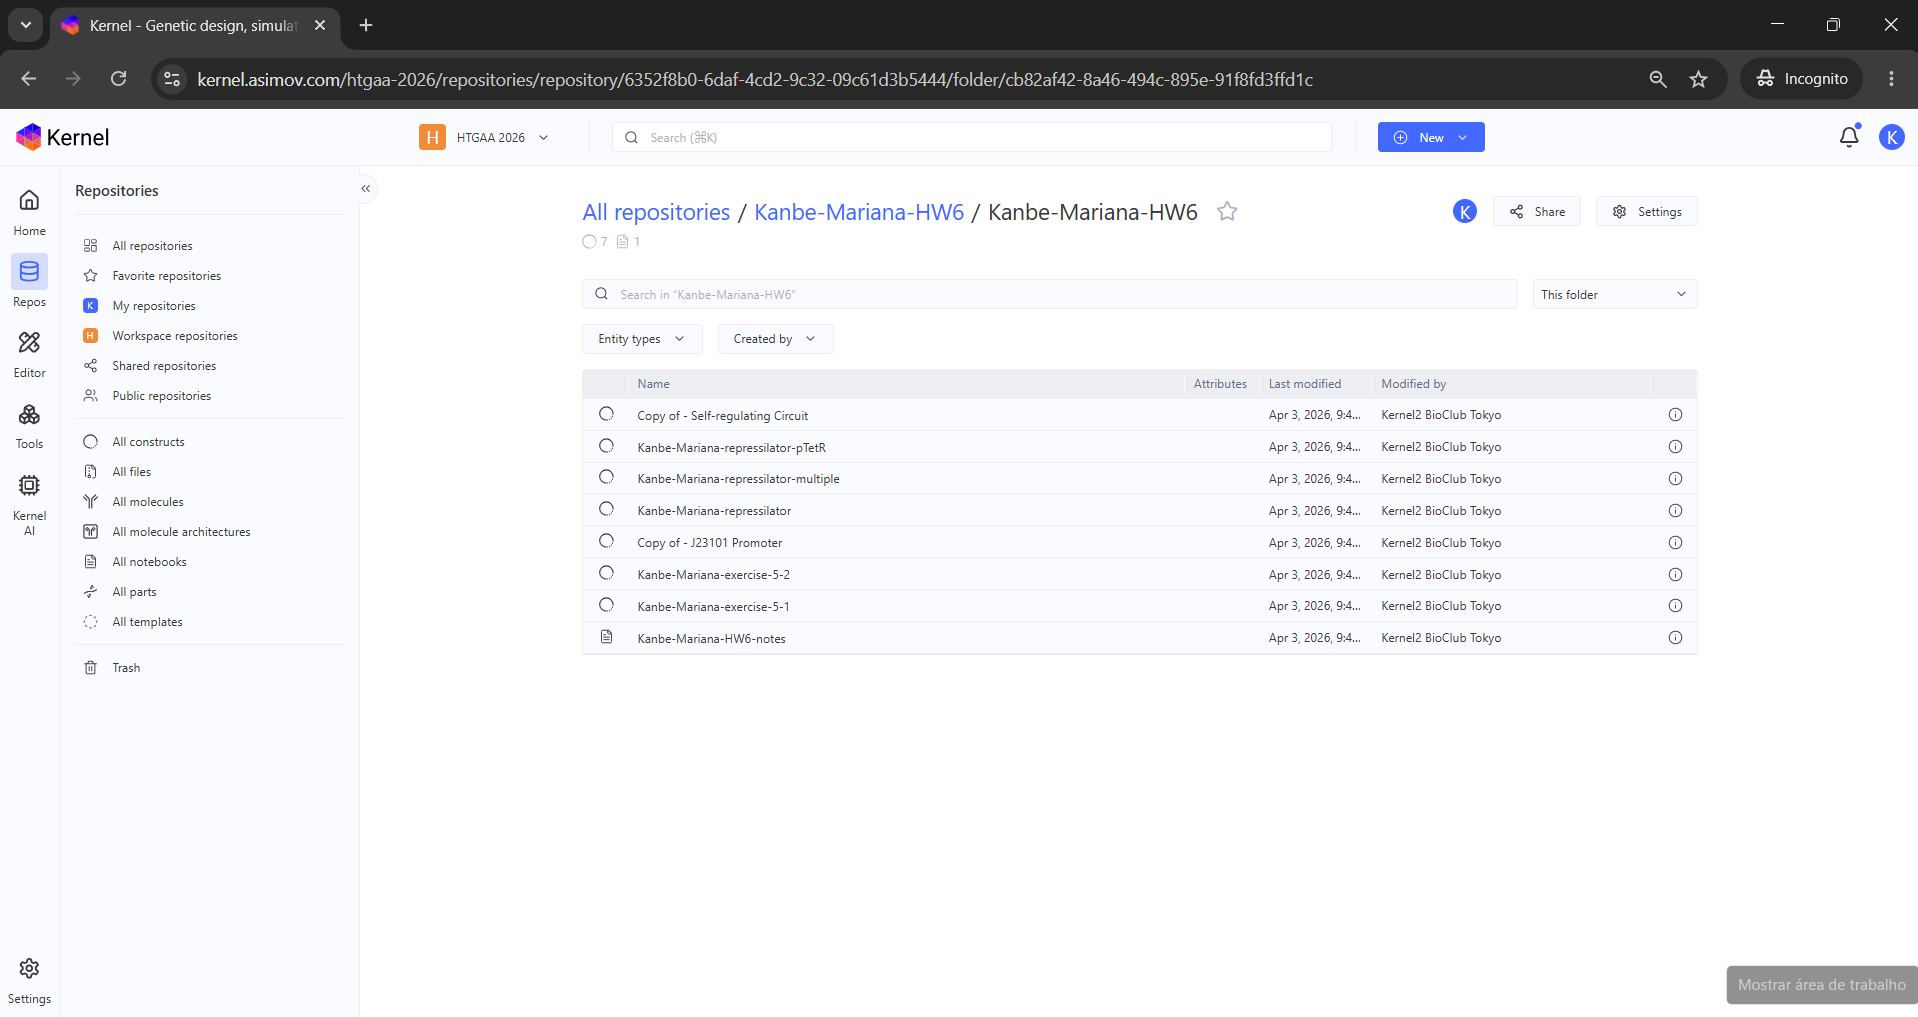
Assignment: Asimov Kernel
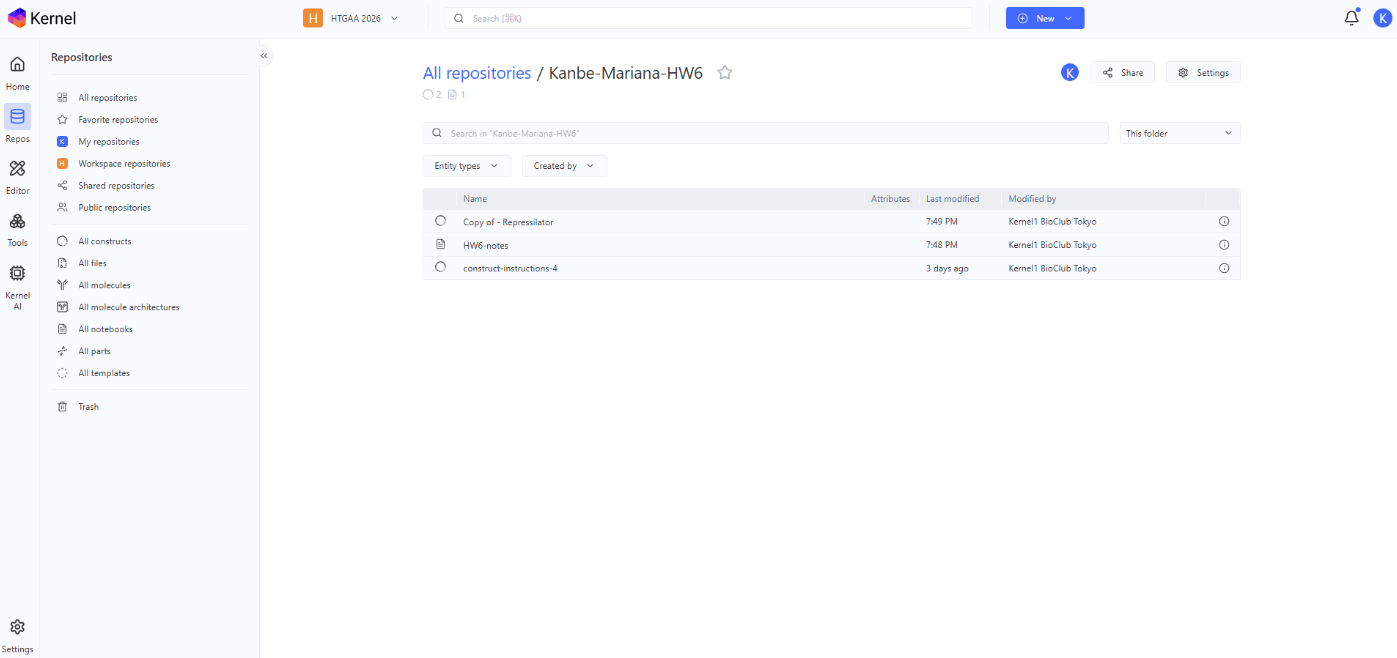
Asimov Kernel notes / all material on my repo “Kanbe-Mariana-HW6”. Below are just some of the info, but please have a look at the Kernel direcly.
HW6: Asimov Kernel Exercises 1,2:
Exercise 3:
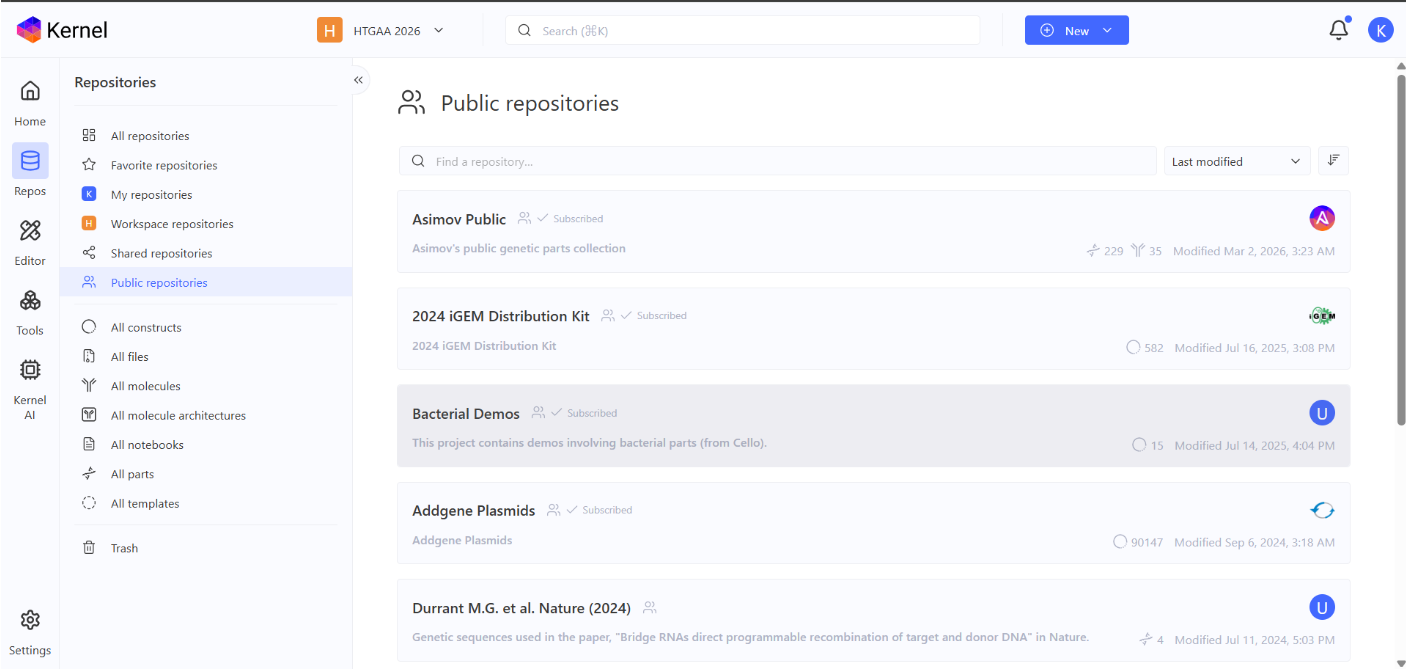
Finding the “Bacterial Demos” public repo
I started analysing the constructs with the Repressilator.
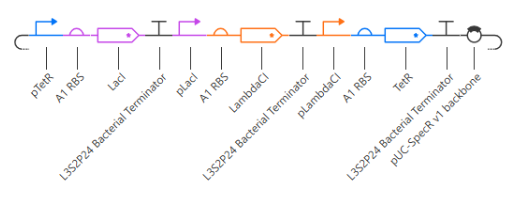
This is the description: “This is a repressilator genetic circuit. It consists of 3 transcription units, where the CDS in each is a repressor that represses the promoter in the next transcription unit. This results in an oscillation of the concentrations of the 3 proteins.”
These 3 constructs have 3 different promoters, which generates different genetic ←→ phenotipic outputs:
- J23117 Promoter: A transcription unit with a weak promoter.
- J23101 Promoter: A transcription unit with a strong promoter.
- J23106 Promoter: A transcription unit with a medium promoter.
Using Simulation feature, the repressillator was simulated using the following parameters:
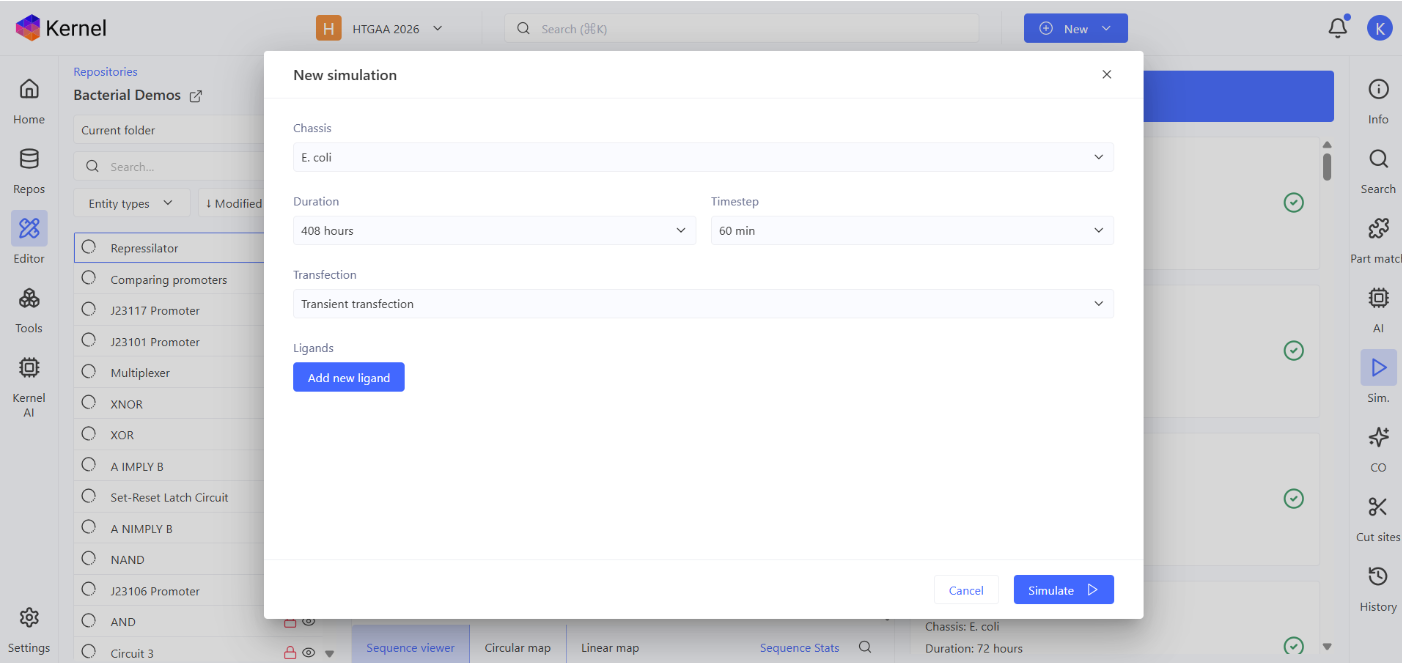
Chassis: E. coli Duration: 408 hours Timestep: 60 min Transfection: Transient transfection
These was the output:
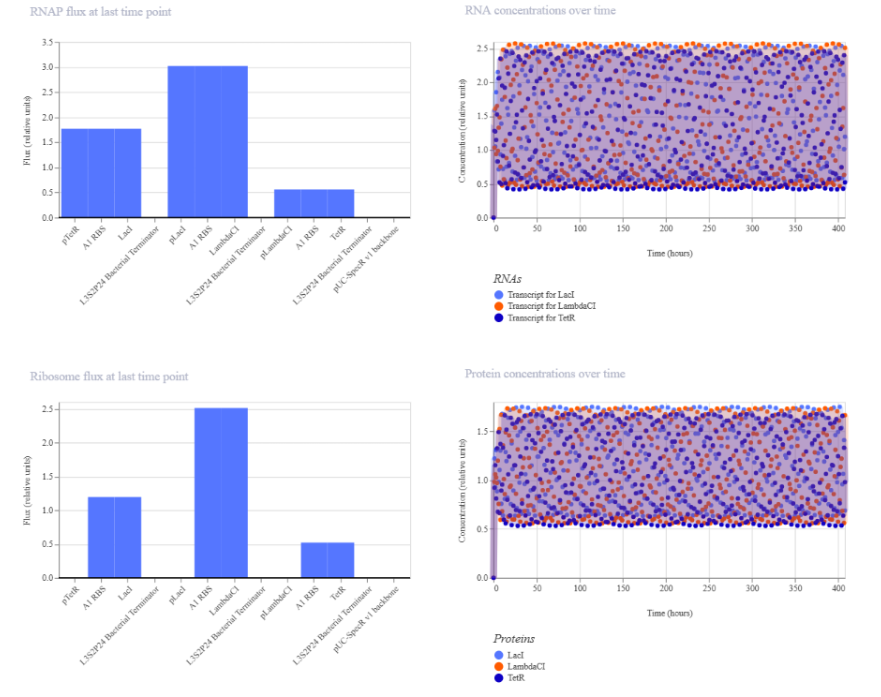
Summary of the findings:
The simulation shows rapid initial accumulation followed by relatively stable RNA and protein concentration ranges over time, while endpoint RNAP and ribosome fluxes differ substantially among the three transcription units. The construct driven by the J23101 (strong promoter) shows the highest activity, the J23106 (medium promoter) shows intermediate activity, and the J23117 (weak promoter) shows the lowest activity.
Exercise 4: Repressilator reconstructions
I recreated the Repressilator in the empty construct using parts from the Characterized Bacterial Parts repository.
First, I used the Search function in the right-hand menu to find the required bacterial parts. Then, I dragged and dropped the selected parts into the empty construct to assemble the circuit. The final design reproduced the three-transcription-unit repressilator architecture.
After building the construct, I used the Simulator by clicking the play button to test its behavior. I then compared the simulation output with the original Repressilator Construct available in the Bacterial Demos repository.
Repressillator Reconstruction 1
I replaced pLacI (regulated by LacI) with pTetR (regulated by TetR) in the first unit, while all other simulation parameters were kept the same. That means the input regulator of that node changed, but the overall loop structure is preserved.
The goal was to observe whether changing the promoter identity altered the resulting RNA concentrations, protein concentrations, RNAP flux, or ribosome flux compared with the original repressilator design.
Using Simulation feature, the new repressillator pTetR was simulated using the same parameters as before:
Chassis: E. coli Duration: 408 hours Timestep: 60 min Transfection: Transient transfection
These was the output:
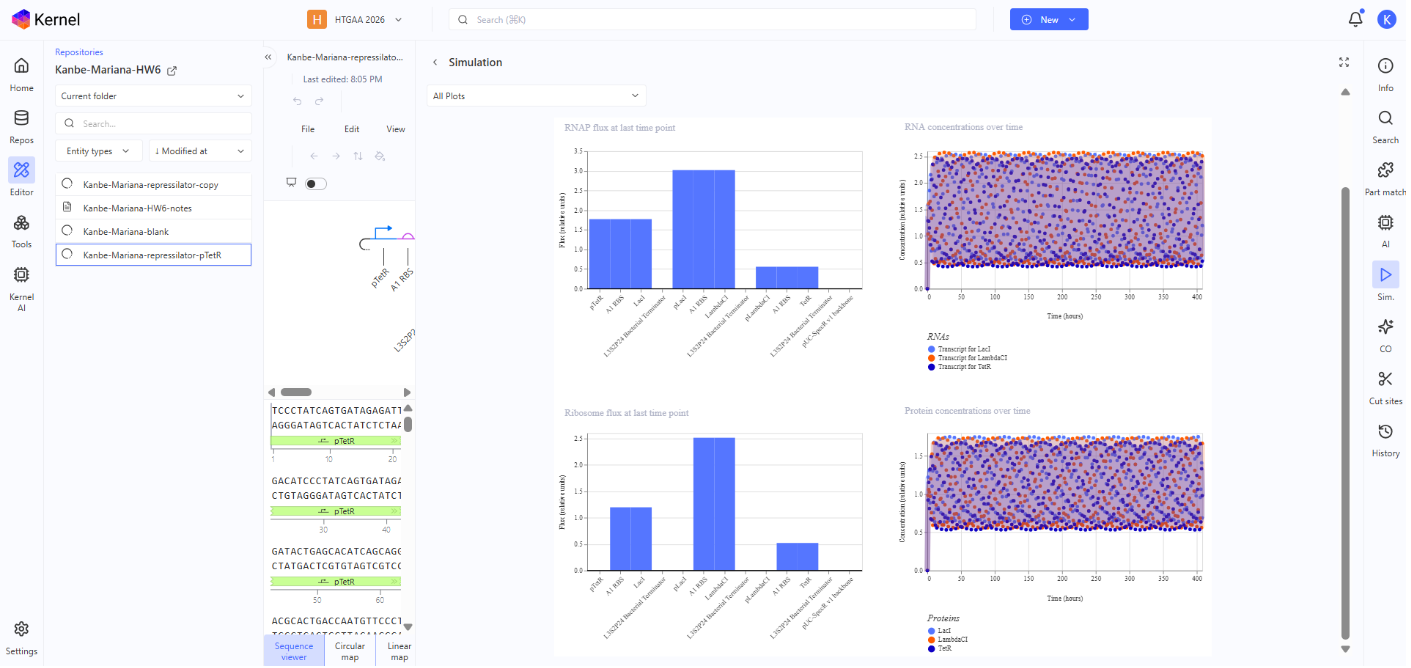
Summary of the findings:
The simulation looks the same cecause from the model’s perspective the system is still a symmetric 3-repressor cycle and each node still produces a repressor and represses the next node. So the dynamics remain qualitatively equivalent.
Repressilator Reconstruction 2:
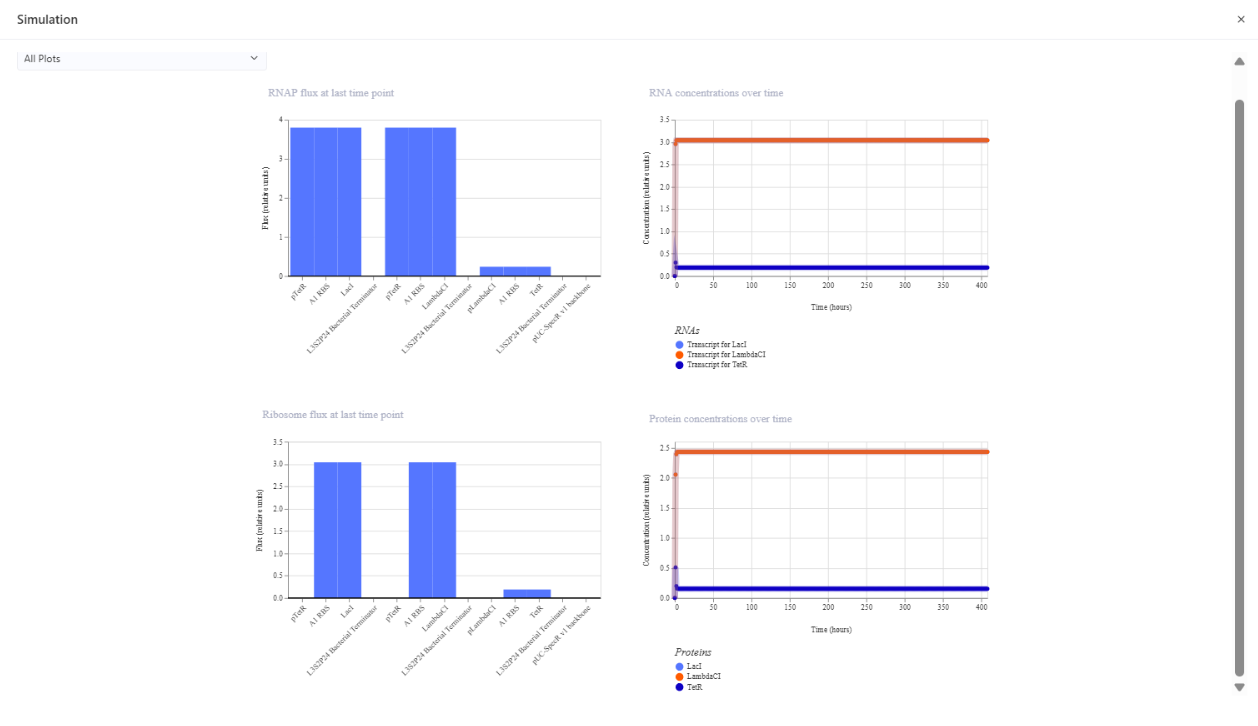
In order to try to experiment another cyclic repression topology different from TetR → LacI → LambdaCI → TetR I’ve tried these:
Replace pLambdaCI with pLacI: to make two transcription units use the same promoter and see how that would affect the circuit’s behavior. Replace pLacI with pLambdaCI: to test what happens when I switch which repressor controls that transcription unit. Replace TetR CDS with LacI CDS: to see how the simulation changes when one repressor is replaced by another and the circuit has less repressor diversity.
And so I re-runned the simmulation and these were the plots:
The modified circuit converges to a steady state dominated by LambdaCI, with LacI and TetR near zero, and no oscillatory behavior observed.
Exercise 5
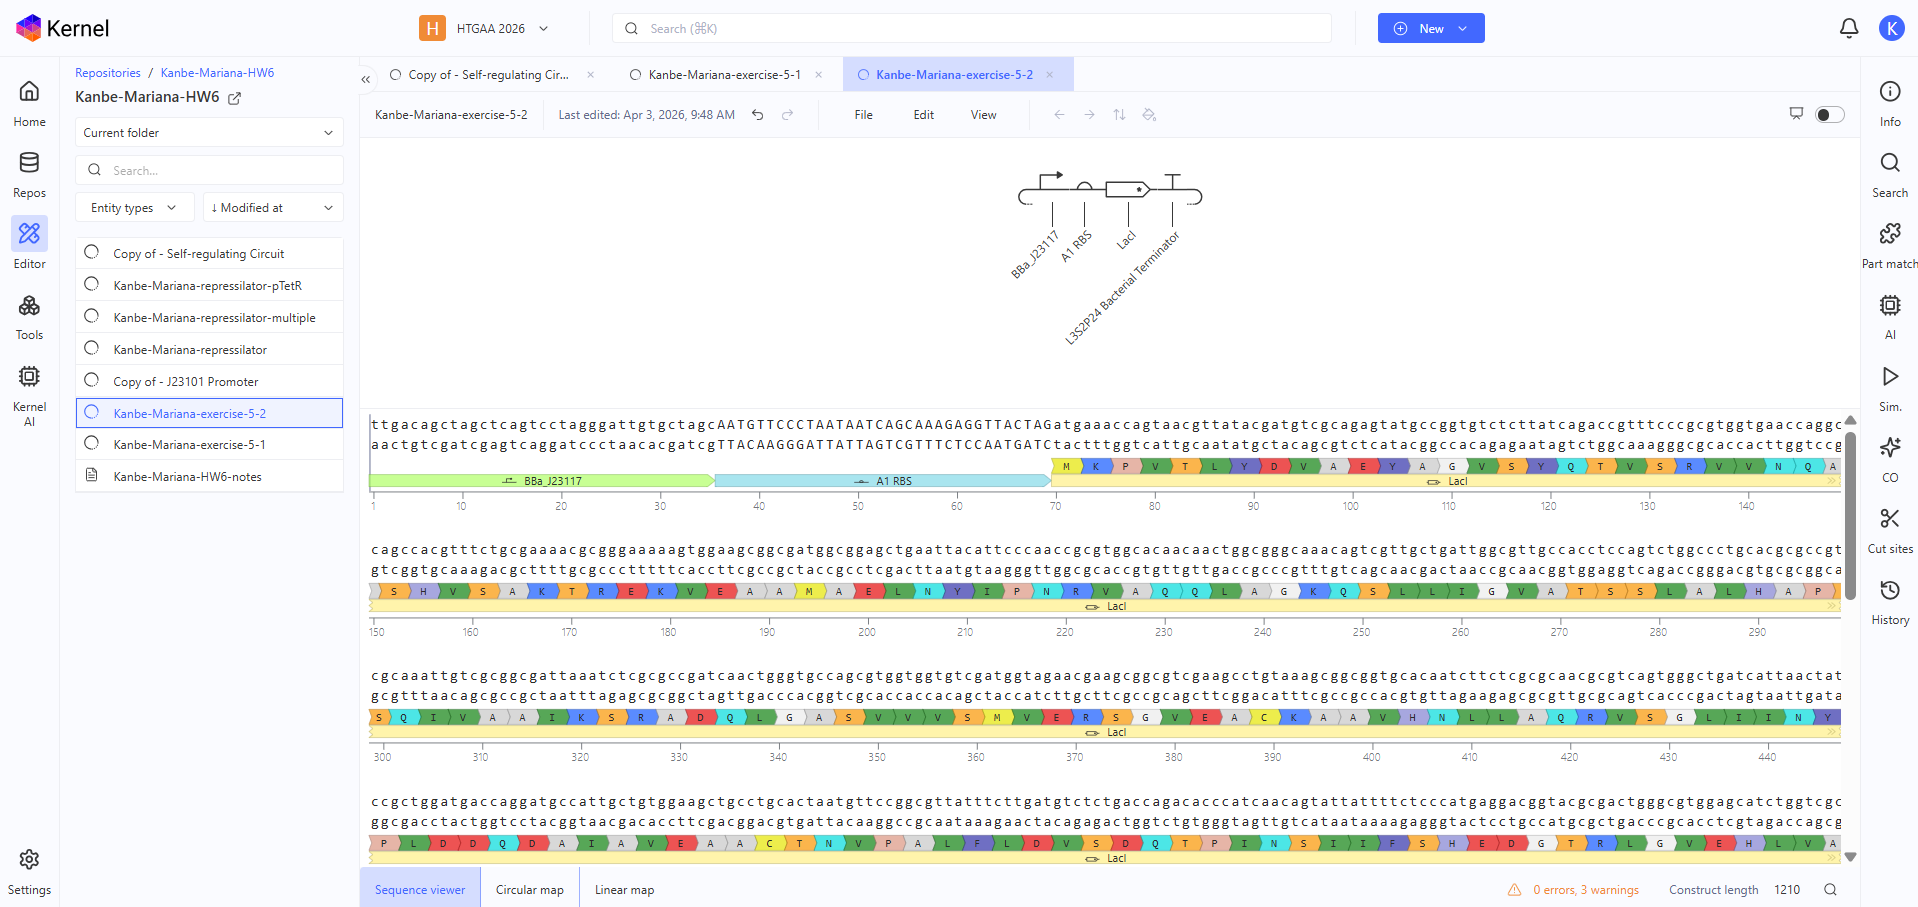
Construct 1
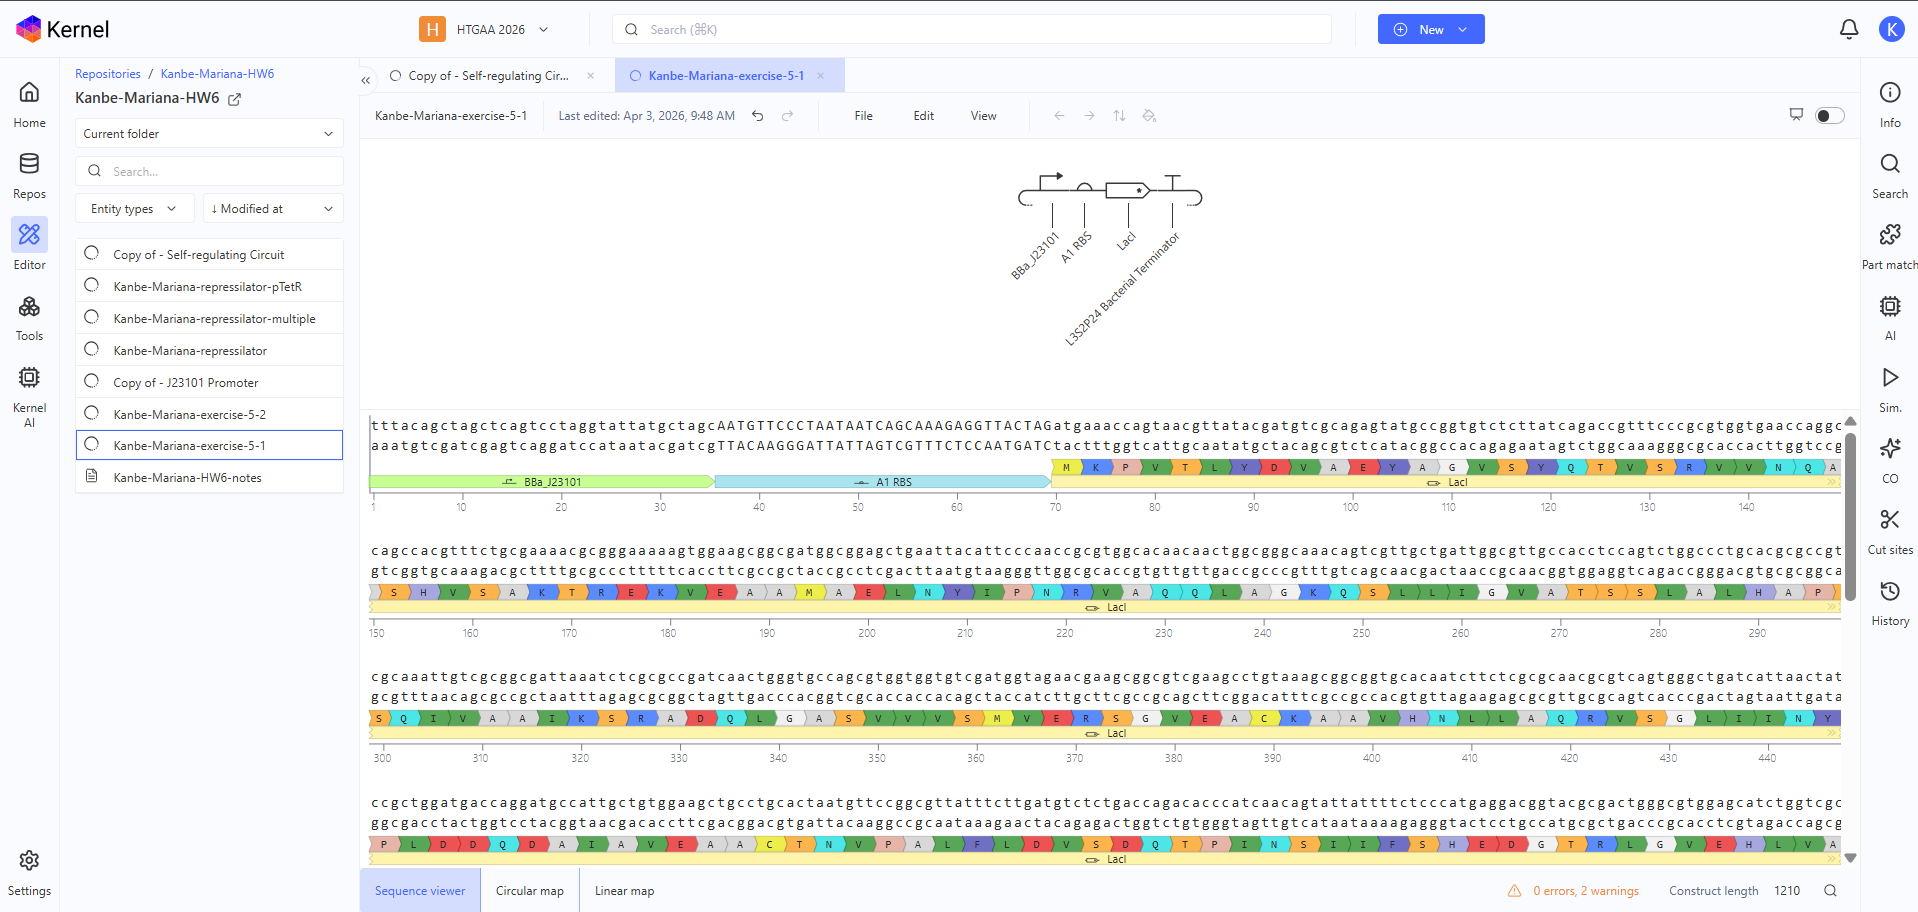
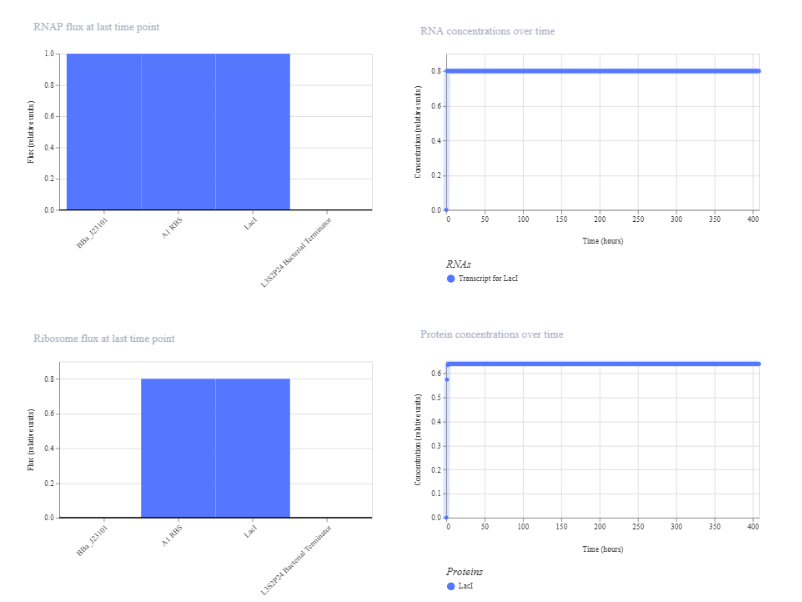
I designed this construct to test high constitutive expression using the strong J23101 promoter placed upstream of LacI, with an A1 RBS to support translation and an L3S2P24 terminator to end transcription. My rationale was to build a simple bacterial circuit with no regulatory feedback, so I would expect continuous LacI expression and relatively high, stable RNA and protein levels in the simulation.
The simulation of this first construct shows rapid initial expression followed by a stable steady state. RNA concentration increases quickly and stabilizes at approximately 0.8 relative units, while protein concentration stabilizes at approximately 0.65. RNAP and ribosome flux are constant, indicating continuous transcription and translation. This matches the expectation for a constitutive expression construct driven by the strong J23101 promoter.
Construct 2
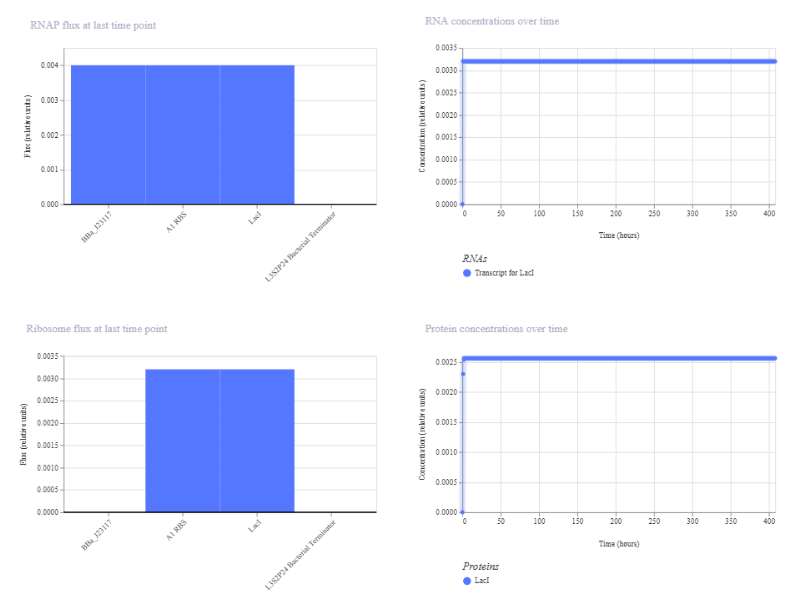
The second construct shows significantly lower expression compared to the first. RNA concentration stabilizes at approximately 0.003 relative units and protein concentration at approximately 0.0025, both much lower than in the strong promoter construct. RNAP and ribosome flux are also reduced. The system still reaches a steady state with constant expression over time, indicating that changing the promoter strength affects the magnitude of expression but not the overall behavior.
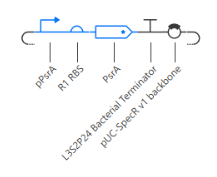
Construct 3
For the third construct, I copied the Self-regulating Circuit from the Bacterial Demos repository into my workspace and ran the simulation without modifying its structure. This allowed me to observe the behavior of a circuit with built-in feedback regulation and compare it with the constitutive expression constructs.
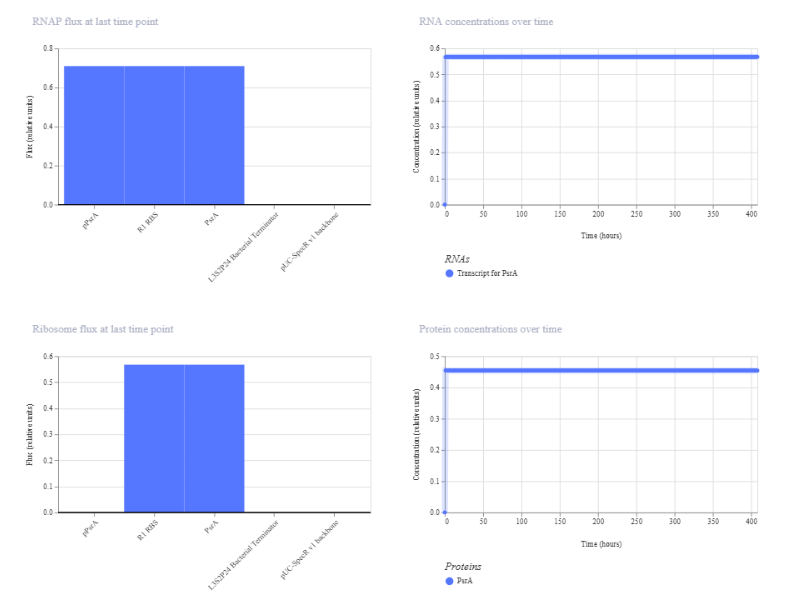
The self-regulating circuit shows stable expression over time, reaching a steady state without oscillations. RNA concentration stabilizes at approximately 0.56 relative units and protein concentration at approximately 0.45. RNAP and ribosome flux are constant, indicating continuous but regulated expression. Compared to the constitutive constructs, the expression level is intermediate, reflecting the effect of feedback regulation on maintaining controlled output.
These results show that promoter strength controls expression level, while circuit structure, such as feedback regulation, influences how expression is maintained over time.