Week 10 HW: Advanced Imaging & Measurement Technology
Homework: Final Project
What to measure?
I will measure visible melanin output in the material as the primary readout of the project.
I want to quantify:
- Degree of darkening
- Spatial distribution of pigmentation
- Stability/Persistence of the pigmentation in the bacterial cellulose / after drying or storage
These measurements are directly relevant because they indicate whether the melanin-producing system is functioning and whether the output is compatible with the intended material application.
How to measure?
a) Initial measurements: Molecular biology
First, to validate the genetic component, I would measure the presence of the designed construct by PCR and confirm the DNA sequence by DNA sequencing. I would use agarose gel electrophoresis to confirm correct DNA assembly before testing expression.
To verify whether the melanin-producing pathway is being expressed in a cell-free or microbial test system before integration into the material, I could also use gel electrophoresis to confirm DNA assembly and cell-free assay readouts to test whether the construct produces the expected visible darkening before integrating it into bacterial cellulose.
b) Material measurements:
These are the most direct indicators of whether the melanin-producing system is working and whether the output is useful as a material feature rather than only a biochemical signal.
- I would first document the material using standardized photography under controlled lighting and then quantify changes in tone by image analysis, comparing pixel intensity or color values across samples and conditions. I would also use absorbance or spectrophotometric measurements when possible to obtain a more objective estimate of pigment accumulation.
- As a secondary measurement, I would use UV-Vis absorbance or reflectance spectroscopy, if available, to quantify pigment accumulation more objectively.
Homework: Waters Part 1 — Molecular Weight
Question 1
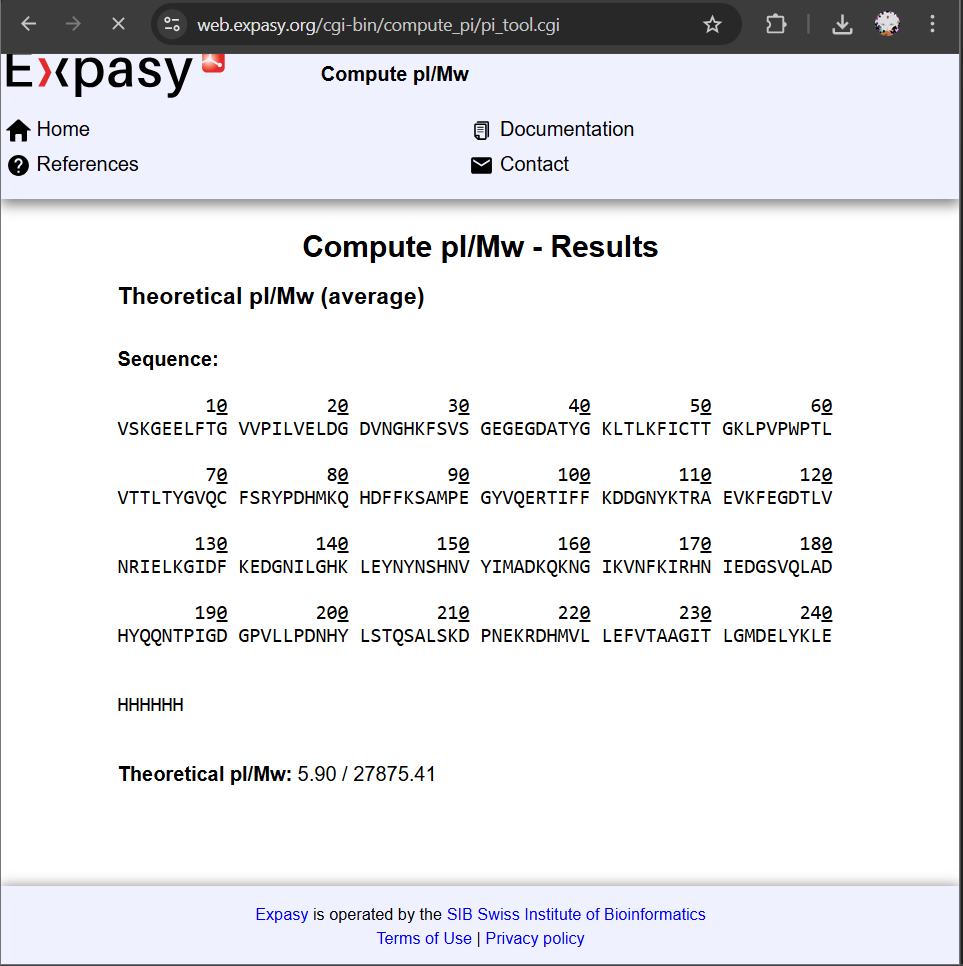
eGFP (native): ~26.9 kDa
eGFP + LEHHHHHH tag: ~27,875.41 Da
All spaces and line breaks were removed.
Question 2
To calculate the molecular weight of intact eGFP, I selected two adjacent peaks from the LC-MS spectrum at m/z 933.7349 and 965.9684.
Using the adjacent charge state equation, this gives a charge state of approximately 30 for the first peak, meaning the second adjacent peak corresponds to 29. I then used these charge states to calculate the molecular weight from each peak, using the relationship between m/z, charge, and proton mass. This gave values of 27,981.8 Da and 27,983.9 Da, respectively, with an average experimental molecular weight of 27,982.9 Da.
I then compared this experimental value with the theoretical molecular weight of the full eGFP construct, including the LE linker and His tag, which is 28,006.3 Da. The relative error was 0.084%, showing very good agreement between the experimental and predicted values. This indicates that the adjacent charge state method produced an accurate estimate of the intact protein mass.
For the zoomed-in peak near m/z 1474, the charge state can also be reasonably assigned. Based on the experimental molecular weight, a 19+ ion would appear at about m/z 1473.8, which closely matches the observed signal. So yes, the charge state of the zoomed-in peak can be observed, and it is most consistent with z = 19.
Homework: Waters Part II — Secondary/Tertiary structure
Question 1
This unfolding changes how the protein gets charged during electrospray ionization. In the native state, fewer sites are accessible for protonation, so the protein carries fewer charges and appears at higher m/z values. In the denatured state, more sites are exposed, so the protein can carry more charges, which shifts the signal to lower m/z values.
In the mass spectrum (Figure 2), this shows up clearly. The native protein has a tighter charge state distribution at higher m/z, while the denatured protein has a broader distribution shifted toward lower m/z. So basically, by looking at how the charge state envelope shifts, we can tell whether the protein is folded or unfolded.
Question 2
If we zoom into the peak around m/z ~2800 in the native spectrum, we can determine the charge state by looking at the spacing between the small peaks in the isotope pattern. At high resolution, these peaks are separated by approximately 1/z.
From the inset, the peaks are spaced by about ~0.05–0.06 m/z units. Since the spacing is equal to 1/z, this suggests:
z ≈ 1 / 0.05 ≈ 20
So the charge state is approximately 20+.
This also makes sense when compared to the protein’s mass (~28 kDa). A 20+ ion would appear around m/z ≈ 2800, which matches the observed peak. So both the isotope spacing and the overall m/z position are consistent with a charge state of 20+.
Homework: Waters Part III — Peptide Mapping - primary structure
Question 1
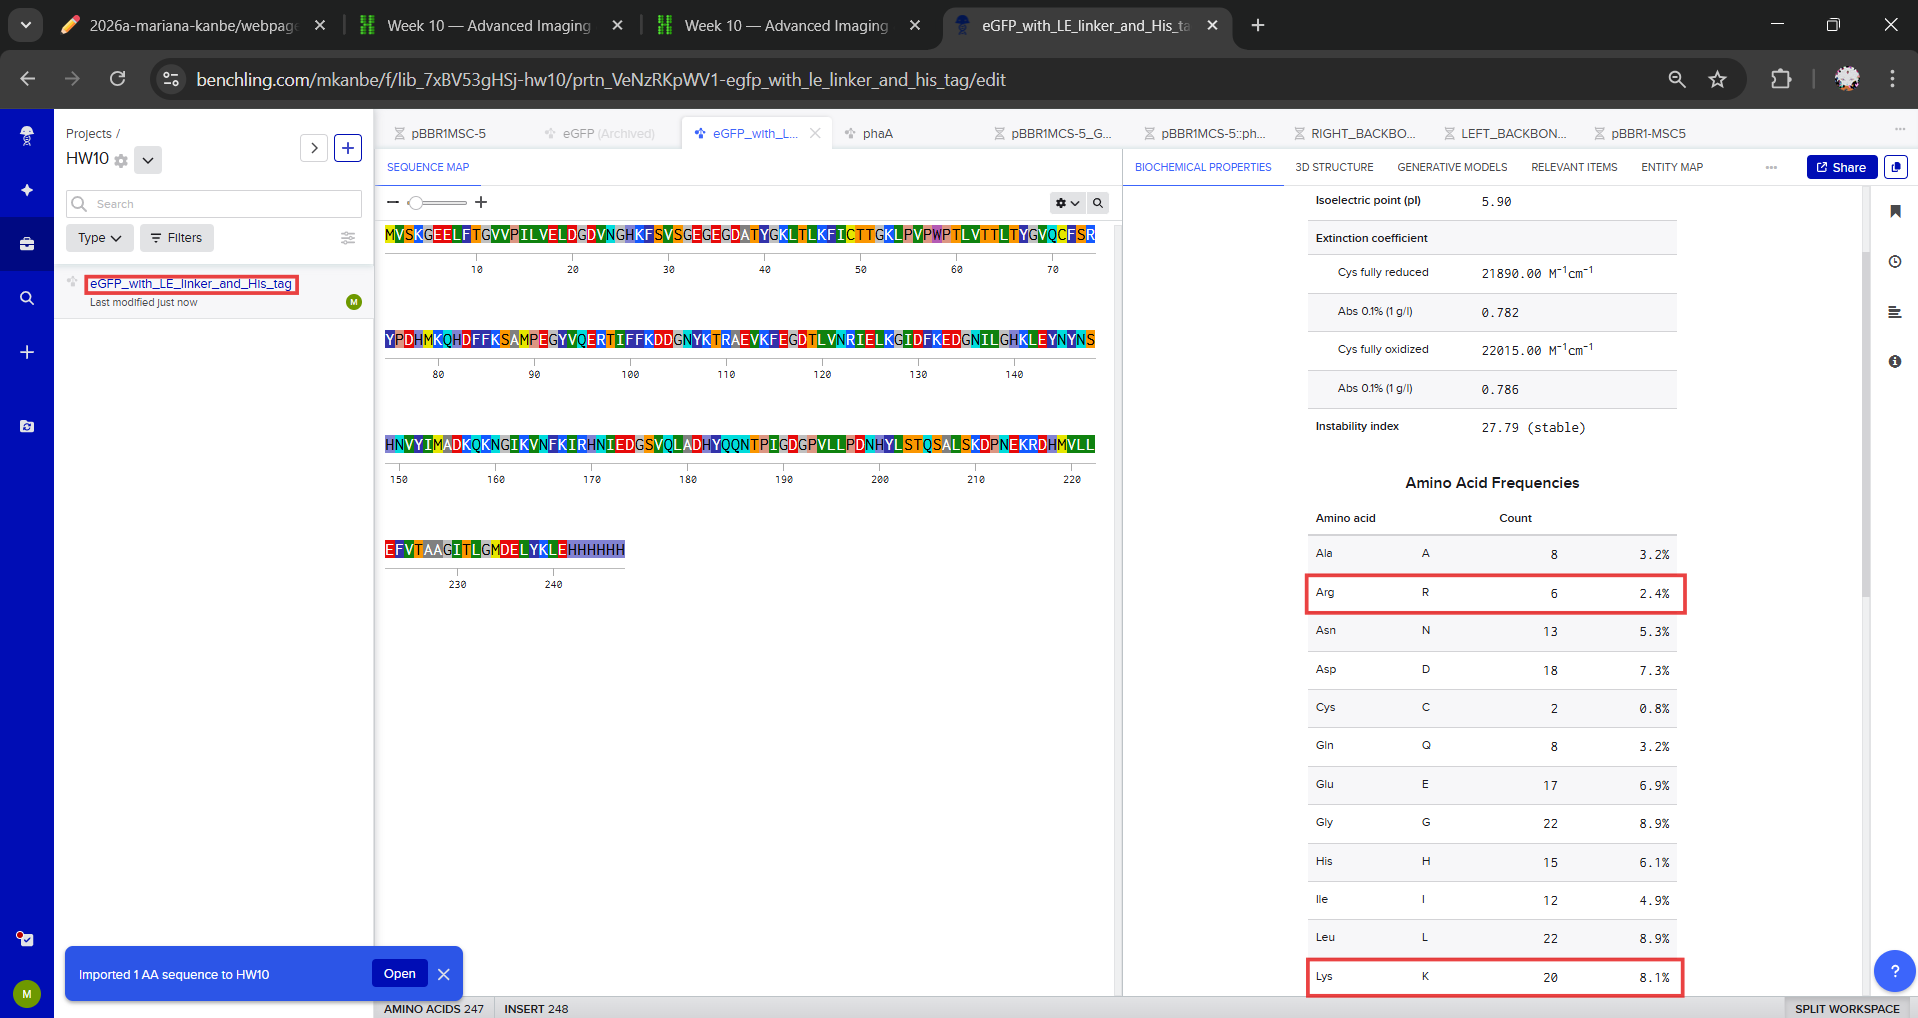
- Lysine (K): 20
- Arginine (R): 6
- Total K + R: 26
- Number of tryptic peptides generated: 27
To analyze the eGFP standard, I first reviewed the full amino acid sequence provided, including the LE linker and the C-terminal His-tag (HHHHHH). I then identified all lysine (K) and arginine (R) residues, since trypsin cleaves specifically after K and R residues unless the following amino acid is proline (P).
After counting the residues in the sequence using Benchlink, I found a total of 20 lysines (K) and 6 arginines (R), for a combined total of 26 potential trypsin cleavage residues.
Question 2
I also checked whether any of these K or R residues were followed by proline, which would block trypsin cleavage, and I found that none of them were followed by P. Therefore, all 26 sites are valid trypsin cleavage sites. Because each cleavage site divides the sequence into peptide fragments, the total number of peptides expected from complete tryptic digestion is the number of cleavage sites plus one. Based on this, the digest should generate 27 peptides in total.
To double check this, I have pasted the eGFP amino acid sequence into the ExPASy PeptideMass tool, selected trypsin as the digestion enzyme, and used the parameters shown in Figure 4, including 0 missed cleavages, monoisotopic mass, and no modifications. I then clicked “Perform the Cleavage” to generate the predicted list of tryptic peptides and determine the total number of peptides produced.
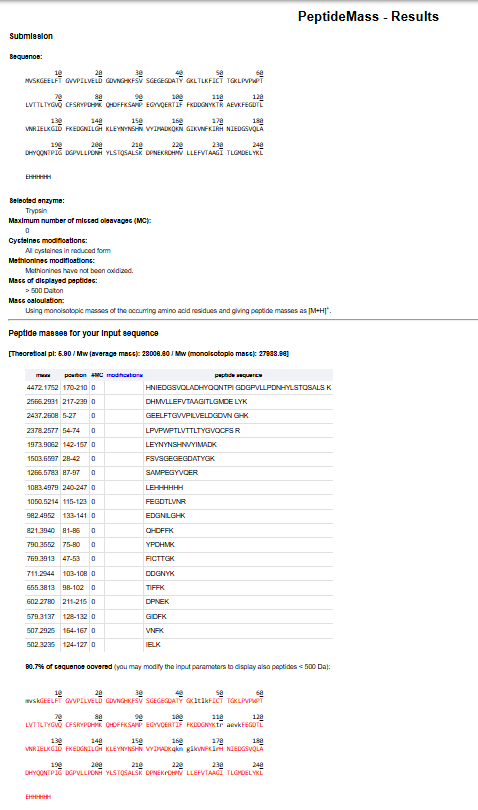
After manually counting 26 lysine and arginine residues, I expected a total of 27 tryptic peptides. When I ran the sequence in the ExPASy PeptideMass tool, the output showed fewer peptides than expected. However, this is because the tool was set to display only peptides with masses greater than 500 Da, which excludes smaller fragments.
Question 3
To analyze the peptide map, I examined the total ion chromatogram (TIC) in Figure 5a and focused on the retention time window between 0.5 and 6 minutes. I counted only peaks with a relative intensity greater than approximately 10% of the base peak, as specified. Based on this criterion, I observe approximately 18–20 chromatographic peaks between 0.5 and 6 minutes. The exact number depends slightly on how closely overlapping peaks are resolved, particularly in the region between ~2.5 and 3.5 minutes, where several peaks are closely spaced.
Question 4
The chromatogram shows fewer peaks than the number of peptides predicted from question 2. In question 2, the full tryptic digest was predicted to generate 27 peptides. In the chromatogram, counting only peaks above the 10% relative abundance threshold between 0.5 and 6 minutes gives roughly 20 peaks.So there are fewer peaks in the chromatogram than predicted peptides. This likely means that some peptides are either too low in abundance, too small, or co-elute with other peptides and therefore do not appear as separate visible chromatographic peaks.
Question 5
To analyze the peptide in Figure 5b, I first identified the most intense peak in the spectrum, which appears at m/z ≈ 525.77. I assumed this corresponds to the most abundant charge state of the peptide.
To determine the charge state, I examined the zoomed-in isotope pattern. The spacing between adjacent isotope peaks is about 0.5 m/z unit. Since isotope spacing is approximately equal to 1/z, a spacing of ~0.5 indicates that z ≈ 2. Based on this, I concluded that the most abundant charge state is z = 2+.
Next, I calculated the mass of the singly charged form of the peptide, M+H+, using the relationship:
M+H+ = z(m/z) − (z − 1)(1.0073)
Substituting the values:
M+H+ = 2(525.77) − 1.0073 ≈ 1050.53 Da
So, the peptide has:
m/z ≈ 525.77
charge state z = 2+
M+H+ ≈ 1050.53 Da
This result is consistent with the spectrum, since there is also a peak visible near m/z ≈ 1050.52, which corresponds to the singly charged form of the same peptide.
Question 6
From the previous step, I determined that the most abundant ion was at m/z 525.7671 with charge z = 2, which gives a singly charged mass of about M+H+ = 1050.53 Da. In the PeptideMass results, the closest expected peptide mass is 1050.5214 Da, which corresponds to the peptide FEGDTLVNR. Based on that match, I identified the peptide as FEGDTLVNR.
To evaluate the mass accuracy, I compared the experimental mass to the theoretical mass from PeptideMass. Using the exact value labeled in the spectrum, the experimental singly charged mass is 1050.52438 Da, and the theoretical mass is 1050.5214 Da. The mass difference is therefore:
1050.52438 - 1050.5214 = 0.00298 Da
To express the error in ppm, I used:
error (ppm) = (MW_experimental - MW_theory) / MW_theory × 10^6
Substituting the values:
error (ppm) = (0.00298 / 1050.5214) × 10^6 ≈ 2.84 ppm
So the measurement error is about 2.8 ppm, which indicates very good agreement between the measured peptide mass and the theoretical value.
Question 7
Figure 6 shows that the amino acid coverage of eGFP is 88%. This means that 88% of the eGFP sequence was confirmed by peptide mapping.
Summary
Identified peptide: FEGDTLVNR Experimental M+H+: 1050.52438 Da Theoretical M+H+: 1050.5214 Da Mass error: 2.84 ppm Sequence coverage confirmed by peptide mapping: 88%
Homework: Waters Part IV — Oligomers
I use the aid of chatgpt for comparing the theoretical and experimental subunits masses in the answering below.
To identify the Keyhole Limpet Hemocyanin (KLH)’s oligomeric states in the CDMS spectrum, I used the subunit masses given in Table 1 and multiplied them by the number of subunits expected in each assembly. I then compared those theoretical masses to the labeled peaks in Figure 7.
Here are the results summarized in a table:
| Oligomeric species | Theoretical mass | Peak in the mass spectrum of Keyhole Limpet Hemocyanin (KLH) acquired on the CDMS | Interpretation |
|---|---|---|---|
| 7FU Decamer | 3.4 MDa | ~3.4 MDa | This peak is consistent with the expected mass of a 10-subunit 7FU assembly. |
| 8FU Didecamer | 8.0 MDa | ~8.33 MDa | This is the closest and most intense peak, so it is the strongest candidate for the 8FU didecamer. |
| 8FU 3-Decamer | 12.0 MDa | ~12.67 MDa | This peak is reasonably close to the expected tridecamer mass and likely represents a higher-order 8FU assembly. |
| 8FU 4-Decamer | 16.0 MDa | ~16-17 MDa | The weak signal in this region may correspond to the 8FU 4-decamer, although this assignment is more tentative. |
Discussion
To interpret the CDMS spectrum, I compared the theoretical oligomer masses calculated from the known KLH subunit masses with the labeled peaks in Figure 7. Based on this comparison. The observed masses are not perfectly identical to the theoretical values, but they are close enough to support these assignments as working hypotheses.
Example proxy calculations:
For the 7FU decamer (10 units): 7FU subunit mass = 340 kDa
Since a decamer contains 10 subunits, the expected mass is: 10 × 340 = 3400 kDa = 3.4 MDa
In the spectrum, there is a labeled peak at about 3.4 MDa I would assign that peak to the 7FU decamer. This corresponds to a 4.5 mDa from the x axis analysis.
The slight offsets could reflect experimental uncertainty, heterogeneity in the sample, adducting, or the natural structural complexity of KLH. Overall, my interpretation is that the spectrum supports a mixture of KLH oligomeric states, with the 8FU didecamer appearing to be the predominant species and the larger 8FU assemblies likely representing less abundant higher-order associations.
The 8.33 MDa peak is by far the most intense feature in the spectrum. This suggests that the 8FU didecamer may be the dominant oligomeric state in this sample under the conditions used for CDMS.
In contrast, the peaks assigned to the 8FU 3-decamer and especially the 8FU 4-decamer are much less abundant, which may indicate that these larger assemblies are present only as minor populations or form less stably in solution.
Homework: Waters Part V — Did I make GFP?
| Measurement | Theoretical | Observed/measured on the intact LC-MS | PPM Mass Error |
|---|---|---|---|
| Molecular weight | 28.0063 kDa | 27.9829 kDa | -835.5 ppm |
I calculated the ppm mass error using:
ppm error = ((observed mass - theoretical mass) / theoretical mass) × 10⁶
Substituting the values:
ppm error = ((27.9829 - 28.0063) / 28.0063) × 10⁶ ≈ -835.5 ppm
Taking the absolute value, the mass error is approximately 836 ppm. The observed intact LC-MS mass is close to the theoretical eGFP construct mass, so the data supports that the sample is consistent with the expected GFP/eGFP construct.
I used ChatGPT as a writing and reasoning assistant to help review calculations, improve explanations, and check whether my answers addressed the homework prompts. All final interpretations, edits, and submitted content were reviewed by me.