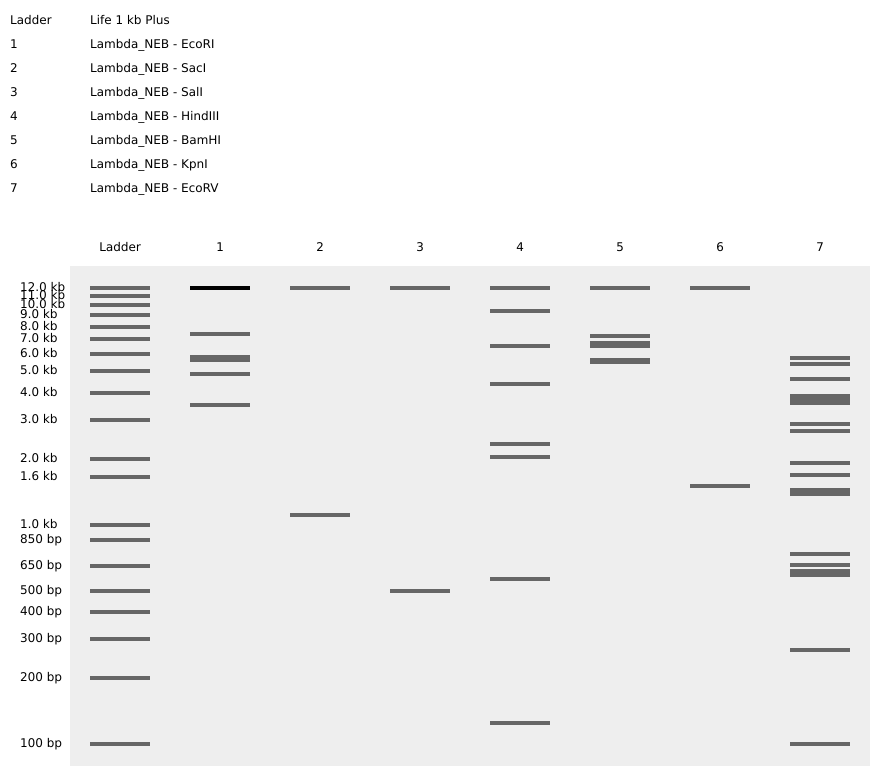
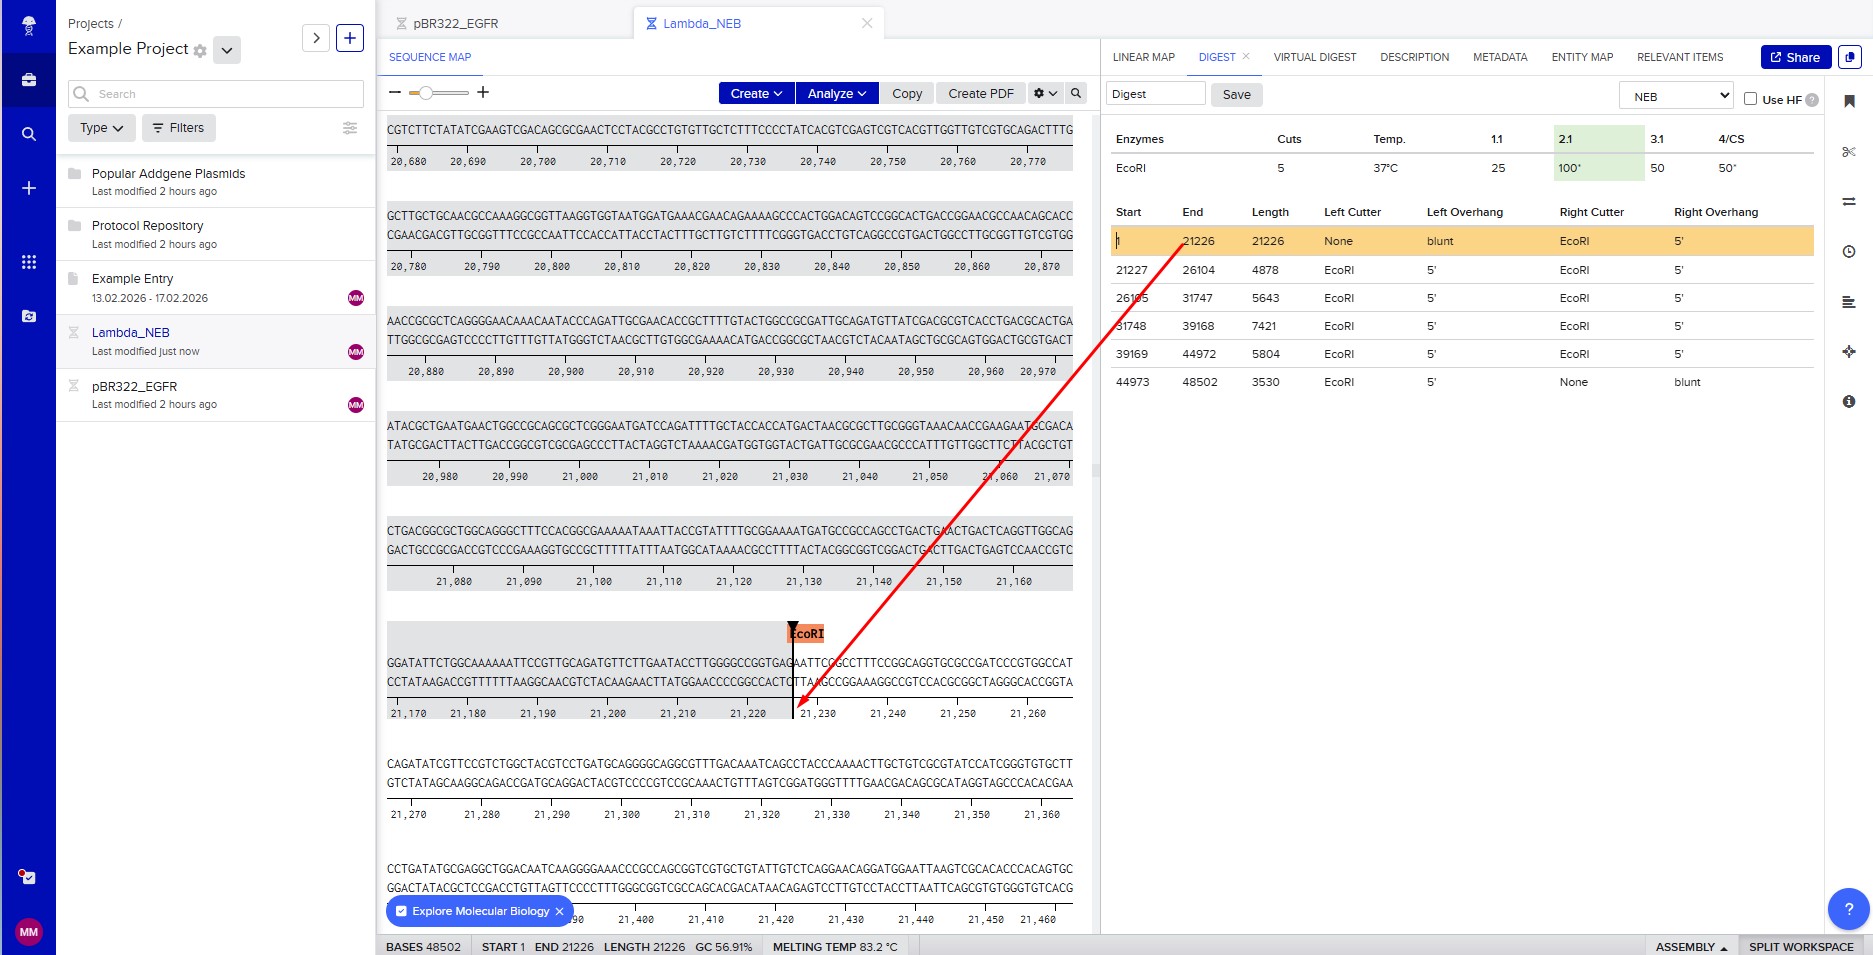
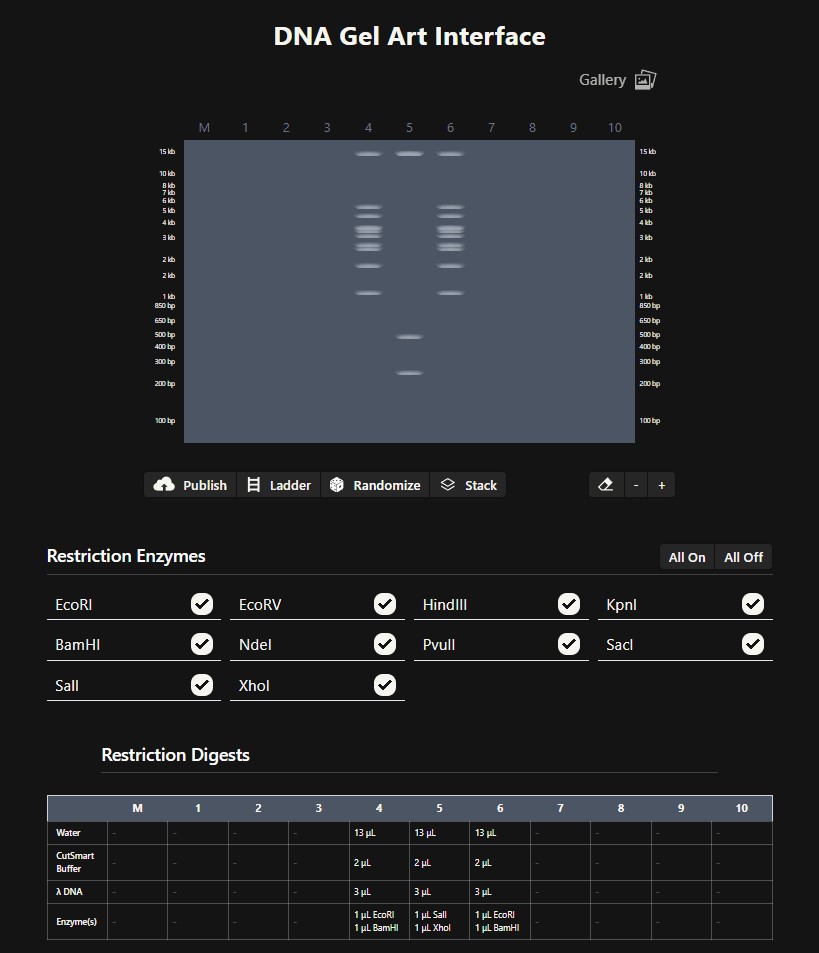
Benchling & In-silico Gel Art The lambda bacteriophage DNA sequence (Lambda_NEB) was imported into Benchling. Using the virtual restriction tool, simulated DNA digestion was performed with seven restriction enzymes: EcoRI, SacI, SalI, HindIII, BamHI, KpnI, and EcoRV. The results were visualized by agarose gel electrophoresis. Simulated gel electrophoresis of lambda DNA after restriction digestion with EcoRI, SacI, SalI, HindIII, BamHI, KpnI, and EcoRV
Protein Design I Part A. Conceptual Questions
How many molecules of amino acids do you take with a piece of 500 grams of meat? (on average an amino acid is ~100 Daltons) The average molecular weight of an amino acid is ~100 g/mol. In 500 g of meat (if we consider all meat as amino acids) there are 5 moles, which gives 5 × 6 × 10²³ = 3 × 10²⁴ molecules. However, meat is not entirely protein: protein makes up only about 20% of the mass, i.e., 100 g of protein per 500 g of meat. After protein breakdown, this corresponds to 1 mole of amino acids, that is 6 × 10²³ molecules.
Part A: SOD1 Binder Peptide Design (From Pranam)
Part 1: Generate Binders with PepMLM
The amino acid sequence of the human SOD1 protein was taken from the UniProt database (ID: P00441), and the A4V mutation was introduced. Amino acid sequence of the human SOD1 protein from UniProt (ID: P00441):
MATKAVCVLKGDGPVQGIINFEQKESNGPVKVWGSIKGLTEGLHGFHVHEFGDNTAGCTSAGPHFNPLSRKHGGPKDEERHVGDLGNVTADKDGVADVSIEDSVISLSGDHCIIGRTLVVHEKADDLGKGGNEESTKTGNAGSRLACGVIGIAQ
The A4V mutation was introduced:
MVTKAVCVLKGDGPVQGIINFEQKESNGPVKVWGSIKGLTEGLHGFHVHEFGDNTAGCTSAGPHFNPLSRKHGGPKDEERHVGDLGNVTADKDGVADVSIEDSVISLSGDHCIIGRTLVVHEKADDLGKGGNEESTKTGNAGSRLACGVIGIAQ
Four peptides of 12 amino acids in length were generated based on the mutant SOD1 gene sequence.
Assignment: DNA Assembly Components of the Phusion High‑Fidelity PCR Master Mix and their purposes
The Phusion master mix (2×) contains:
Phusion DNA polymerase – a high‑fidelity enzyme with 3′→5′ proofreading activity, minimising errors during amplification dNTPs (dATP, dTTP, dCTP, dGTP) – the building blocks for new DNA strands Optimised reaction buffer (HF or GC) – provides the correct pH and ionic conditions for the enzyme Mg²⁺ ions (MgCl₂) – an essential cofactor for polymerase activity
Homework Part A: General and Lecturer-Specific Questions
General homework questions
Advantages of cell‑free protein synthesis Direct access to the reaction environment and no constraints from cell viability. Cell‑free synthesis is preferable for producing toxic proteins and for rapid screening of many variants without maintaining live cultures.
Main components of a cell‑free system and their roles Cell extract (ribosomes, tRNAs, translation factors, polymerase), energy system (ATP plus regeneration), amino acids, DNA template, buffer and salts.
Homework: Final Project
What aspects of the project will be measured? The intensity of red fluorescence of E. coli bacteria carrying the P_rprA‑B0034‑mScarlet‑I‑B0015 construct after acoustic exposure will be measured. In addition, the area of fluorescent zones on the bioprinted image will be measured, and bacterial growth area as well as changes in the bioprinted image will be assessed.
How will these measurements be performed? Using photography and subsequent analysis with ImageJ software, the following will be quantified:
Part A: The 1,536 Pixel Artwork Canvas | Collective Artwork
Collective image
Part B: Cell-Free Protein Synthesis | Cell-Free Reagents
Roles of components in the 20‑hour cell‑free reaction (yellow box) E. coli Lysate (BL21 (DE3) Star) – provides the cellular machinery (ribosomes, tRNAs, polymerases, translation factors) required for transcription and translation. The BL21 (DE3) strain supplies T7 RNA polymerase, enabling high‑efficiency transcription from T7 promoters. Salts/Buffer – maintain optimal pH (HEPES), ionic strength, and cofactor availability. Potassium glutamate and magnesium glutamate stabilise ribosomes and enzyme activity; potassium phosphate buffers the reaction and supplies phosphate groups.
Subsections of Homework
Week 1 HW: Principles and Practices
1. Biological engineering application and tool
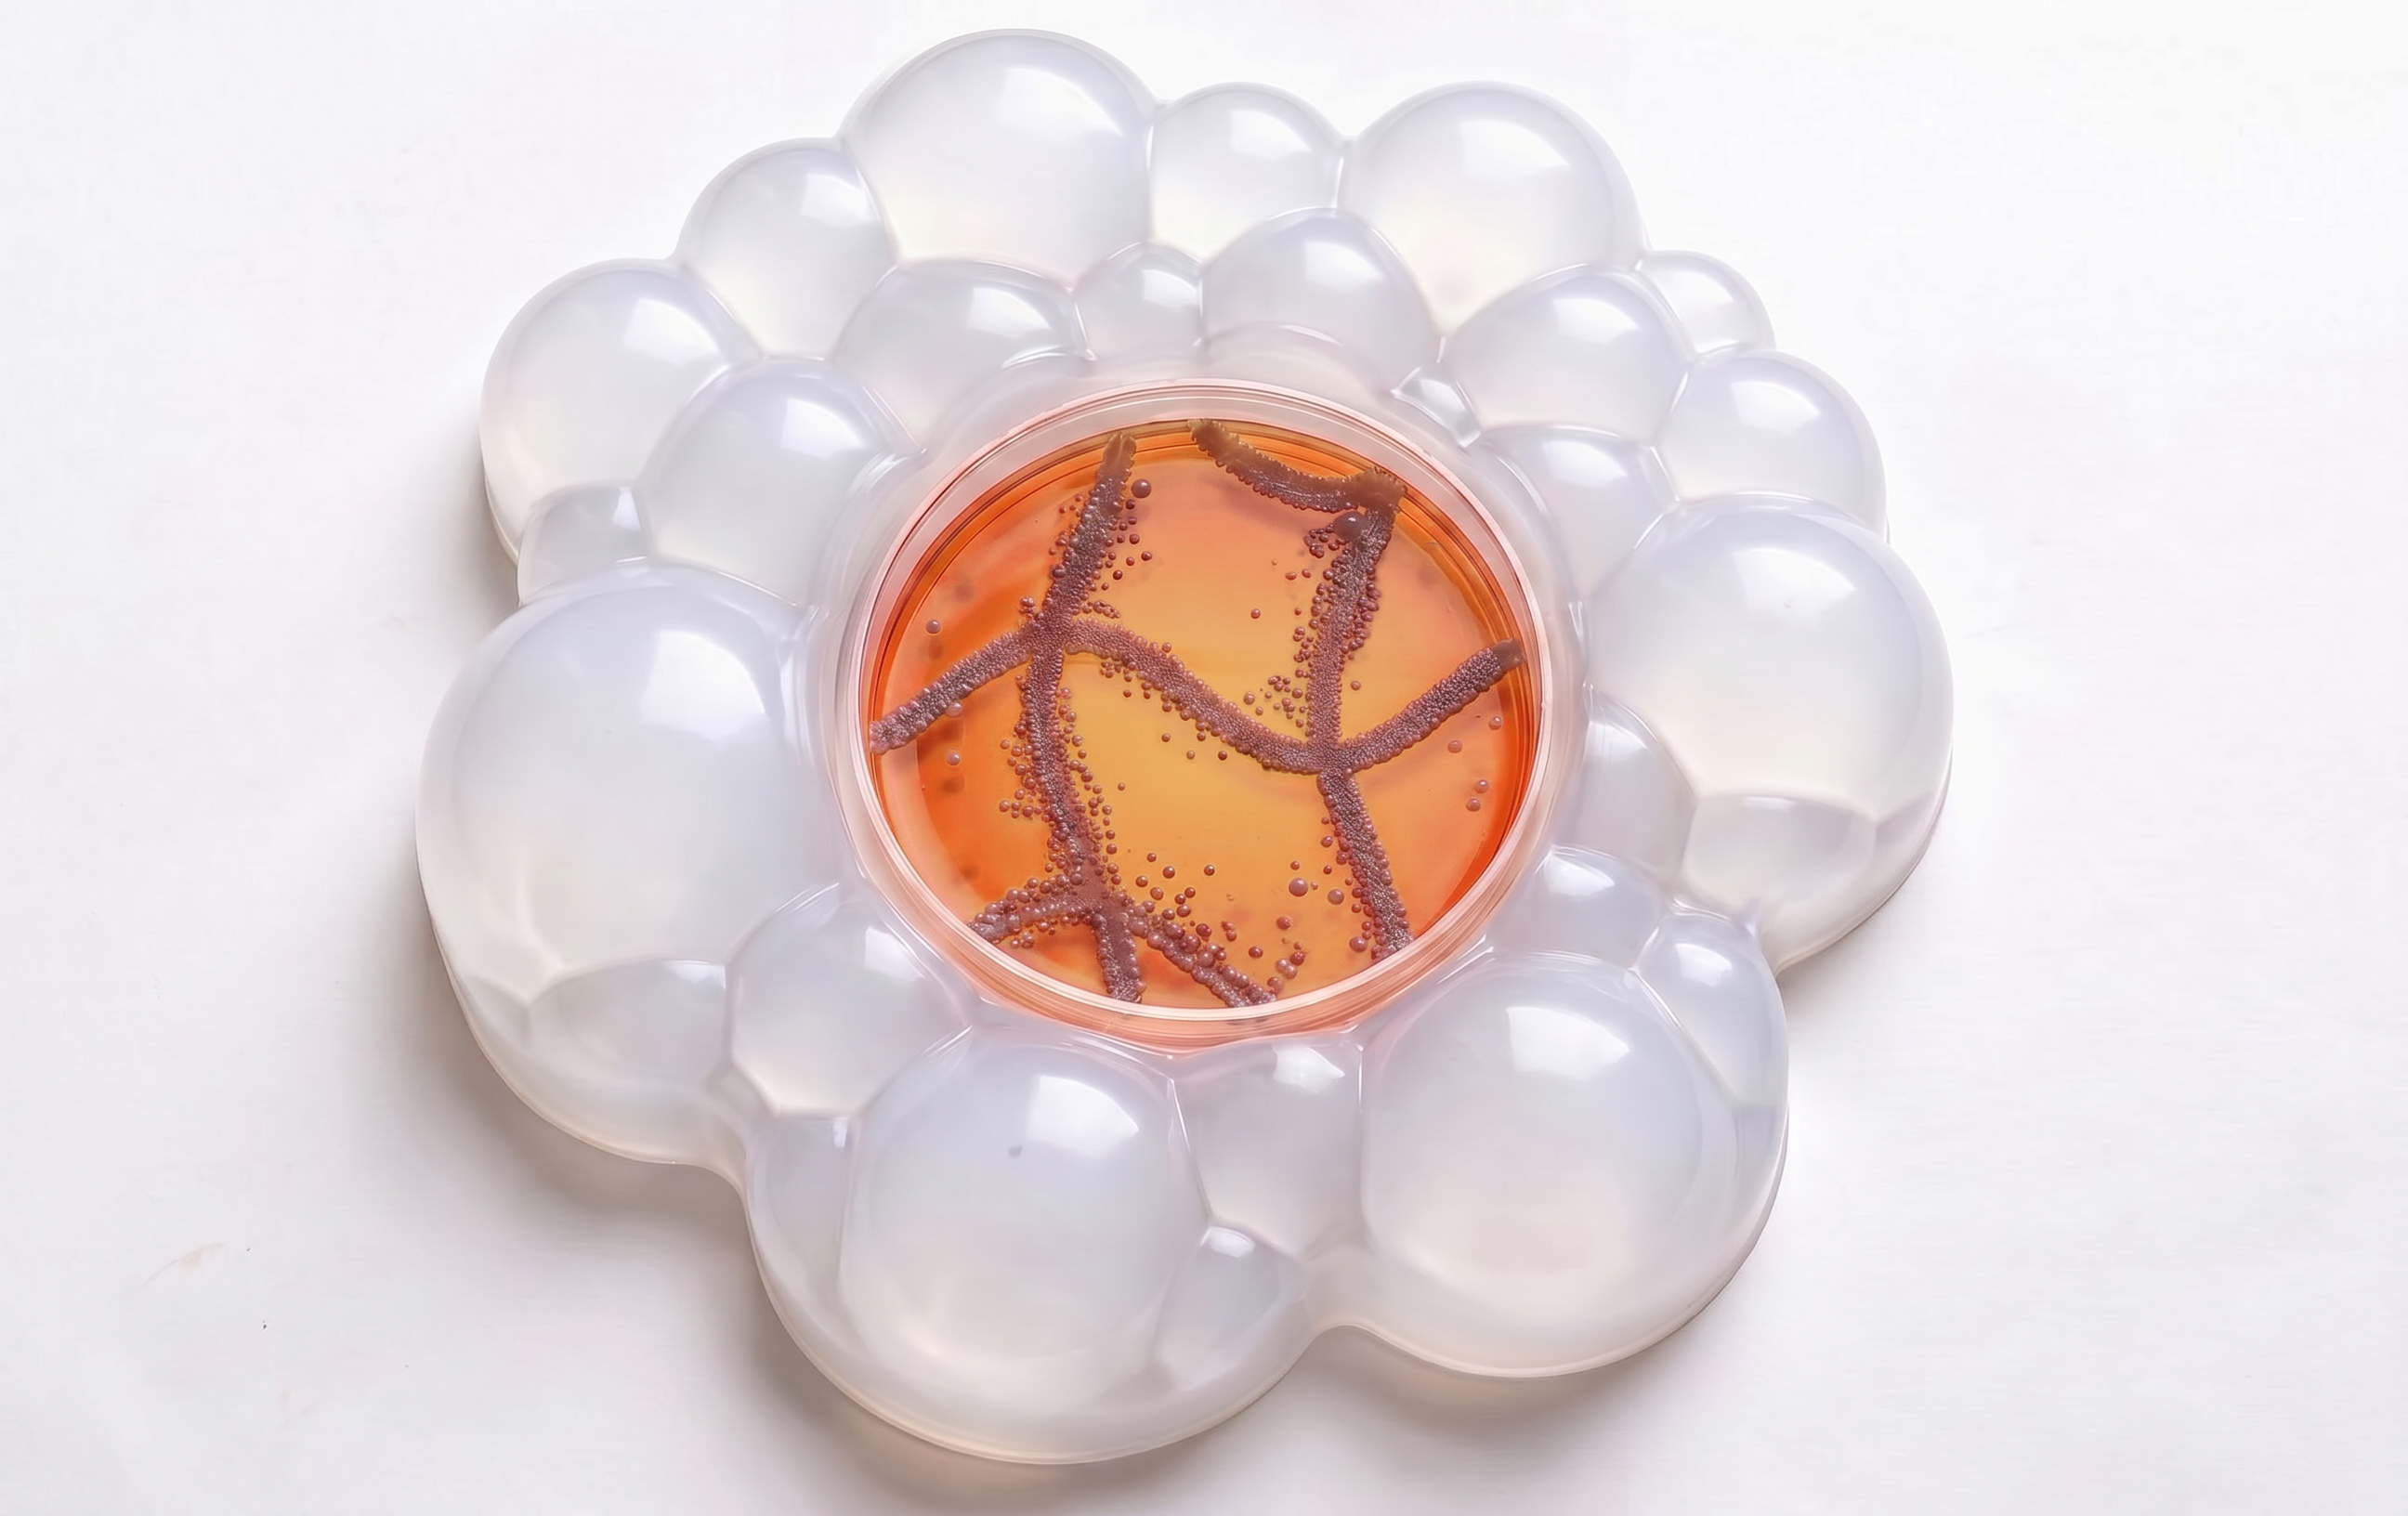
The project proposes the development of a compact experimental and artistic-scientific device for the study and artistic modulation of bacterial growth patterns on a solid (agar) nutrient medium. The device is a tabletop device in a plastic case with a built-in vibrating column and a microcontroller providing programmable control of vibration parameters, including frequency, modes, and temporal patterns. A standard Petri dish containing solid agar, onto which an image of E. coli has been pre-printed using a DIY bioprinter, is placed on top of the device. After bioprinting, the image undergoes “mechanical post-processing” in the form of vibration, allowing for the study and artistic interpretation of the influence of mechanical environmental conditions on the spatial organization of bacterial growth. This translates the digital image and digital post-processing into a physical space known as “analog biological post-processing.”
The theoretical basis for the project is based on data on the mechanosensitivity of bacteria and the mechanical nature of colony growth. According to the work of Ghodake et al. (2024) found that low-frequency mechanical vibration (1–20 Hz) in a liquid medium altered the growth rate and morphology of E. coli cells, demonstrating the bacteria’s fundamental sensitivity to external mechanical stimuli. Although this study was conducted in liquid culture, it suggests that when vibration is transmitted through solid agar, the mechanical effect will be realized not through mixing, but by creating localized mechanical stress and changing growth conditions for E. coli colonies.
Furthermore, Kochanowski et al. (2024) demonstrated that the growth and morphology of bacterial colonies on solid surfaces depend significantly on mechanical interactions between the cells and the substrate, including friction, adhesion, and mechanical resistance of the medium. This confirms that changing environmental mechanical conditions can lead to reproducible changes in colony shape and structure. The project involves using low-frequency mechanical vibration transmitted through the bottom of the Petri dish and agar during the active colony growth phase (3–8 hours after printing) to avoid simple physical image smearing at the early stage and a limited effect at later stages of growth. Thus, the image goes from a digital file through bioprinting and mechanical post-processing to a physical biological object.
2. Governance/policy goals
The project is being considered as an extension of the bioart curriculum at ITMO University. It is planned to expand the bioprinting program and develop additional approaches for manipulating printed E. coli images. The plan is to make this technology publicly accessible and expand its audience, engaging not only university students but also external audiences interested in bioart. This is an important step toward expanding the bioart community of artists and citizen science. Accessibility is also key. The images are printed using a DIY bioprinter, and the vibration device is inexpensive to assemble. Participants will also be able to print the device body using ITMO University’s fab lab.
Therefore, the primary goal is to create a device as part of the curriculum.
Subgoals: improve the course curriculum and expand its technological capabilities; make the program accessible to a wider audience; create the device as an art project for display at the Art & Science exhibition; and create a bioart community in St. Petersburg.
3. Potential governance “actions”
1_ Goal.
To conduct research and develop a technology for influencing E. coli with frequencies using a vibrating column. I am currently teaching a course for Art & Science Master’s students, where they print images using a bioprinter.
2_ Design.
To implement the course development and expand the participating audience, it is necessary to:
Expand the use of the device into the framework of institutional education and art-science projects.
Obtain formal approval from the Art & Science Center at ITMO University. The Art & Science Center already has an established practice of holding workshops for external audiences.
BioArt Lab, which is part of the Art & Science Center, has a laboratory that can host these classes. Currently, classes are held there for students, but since the Art & Science Center has its own separate entrance and hosts exhibitions, outsiders are welcome to come to the University; they only need to fill out an application.
Since the course requires the purchase of nutrient media, it can be offered for a fee, but at a minimal cost. The Art & Science Center frequently hosts exhibitions, and the practice of paying for workshops also has a well-established system.
3_ Assumptions, uncertainties.
To confirm the success of the technology for influencing E. coli growth with frequencies, a series of experiments must be conducted under controlled conditions: without frequency exposure, with varying frequency exposure, and with frequency exposure at different growth phases. The experimental results may reveal that, with low frequency exposure, dense agar will significantly minimize frequencies and, accordingly, will have an effect on E. coli growth, but not as strong.
4_ Risks of failure and success.
Even if the change in E. coli growth through frequency exposure is not significant, it will still be a research result, given that similar experiments were previously conducted in a liquid medium, not on solidified agar. This device could, in any case, be exhibited as an art piece at technology art exhibitions.
4. Options
| Users and Partnerships:
Creation of a bioart community
Engaging this community through course participation
Funding acquisition
| Development of DIY devices
Research into DIY and local opportunities
Affordable device
Low barrier to entry
| Institution and Educationt
Accessible education not only for students
Supporting accessibility at the local level
Implementation of new, modern technological solutions in the educational program
5. Conclusion
Based on the above assessment, the most desirable action is to develop a bioart community by offering an affordable, paid course accessible to external audiences at ITMO University. This low entry barrier and accessible DIY projects will foster interest in bioart technologies.
Answers to questions:
Homework Questions from Professor Jacobson.
What is the error rate of polymerase? 1:106
How does this compare to the length of the human genome? HThe human genome is 3–3.2 × 10⁹ bp, hence 3000 bp of the human genome could be wrong.
How does biology deal with that discrepancy? There are DNA repair systems: MutS, MutL, and MutH in prokaryotes, and MSH and MLH in eukaryotes.
How many different ways are there to code (DNA nucleotide code) for an average human protein? An average human protein consists of 300–400 amino acids. There are 20 types of proteinogenic amino acids, which are encoded by 61 codons in total. Due to codon degeneracy, some amino acids can have up to 6 synonymous codons, leading to up to 10200 possible theoretical sequences.
In practice what are some of the reasons that all of these different codes don’t work to code for the protein of interest? There are conserved domains that provide mRNA stability and/or folding stability, functional motifs, and regions marking exons/introns, translation start/termination sites, etc. Therefore, some sequences will not yield chemically stable, functional, or translation-appropriate proteins.
Homework Questions from Dr. LeProust:
What’s the most commonly used method for oligo synthesis currently? Next Generation (Chip Based) Oligo Nucleotide Synthesis.
Why is it difficult to make oligos longer than 200nt via direct synthesis? Yield decreases with further synthesis steps due to lower fidelity, error accumulation, and formation of hairpins, dimers, and clogs.
Why can’t you make a 2000bp gene via direct oligo synthesis? Direct oligo synthesis involves step-by-step addition of bases to the chain. With this technology, the yield of the full-length product decreases exponentially with each added base. Even if an exact 2000 bp oligo is synthesized, it would be difficult to purify it from, for instance, a 1990 bp oligo using gel electrophoresis.
Homework Question from George Church:
What are the 10 essential amino acids in all animals and how does this affect your view of the “Lysine Contingency”? There are 9 essential amino acids: histidine, isoleucine, leucine, lysine, methionine, phenylalanine, threonine, tryptophan, and valine. Pyrrolysine also exists, occurring only in certain organisms, so it could be considered a 10th essential amino acid. The “Lysine Contingency” in the movie Jurassic Park was presented as an engineered inability of dinosaurs to produce lysine, aimed at tying them to the park territory where they could receive necessary supplements. As we can see, almost all vertebrates share this inability naturally, so the movie creators might have chosen a different amino acid, such as alanine, for dramatic effect.
Week 2 HW: DNA Read, Write, & Edit
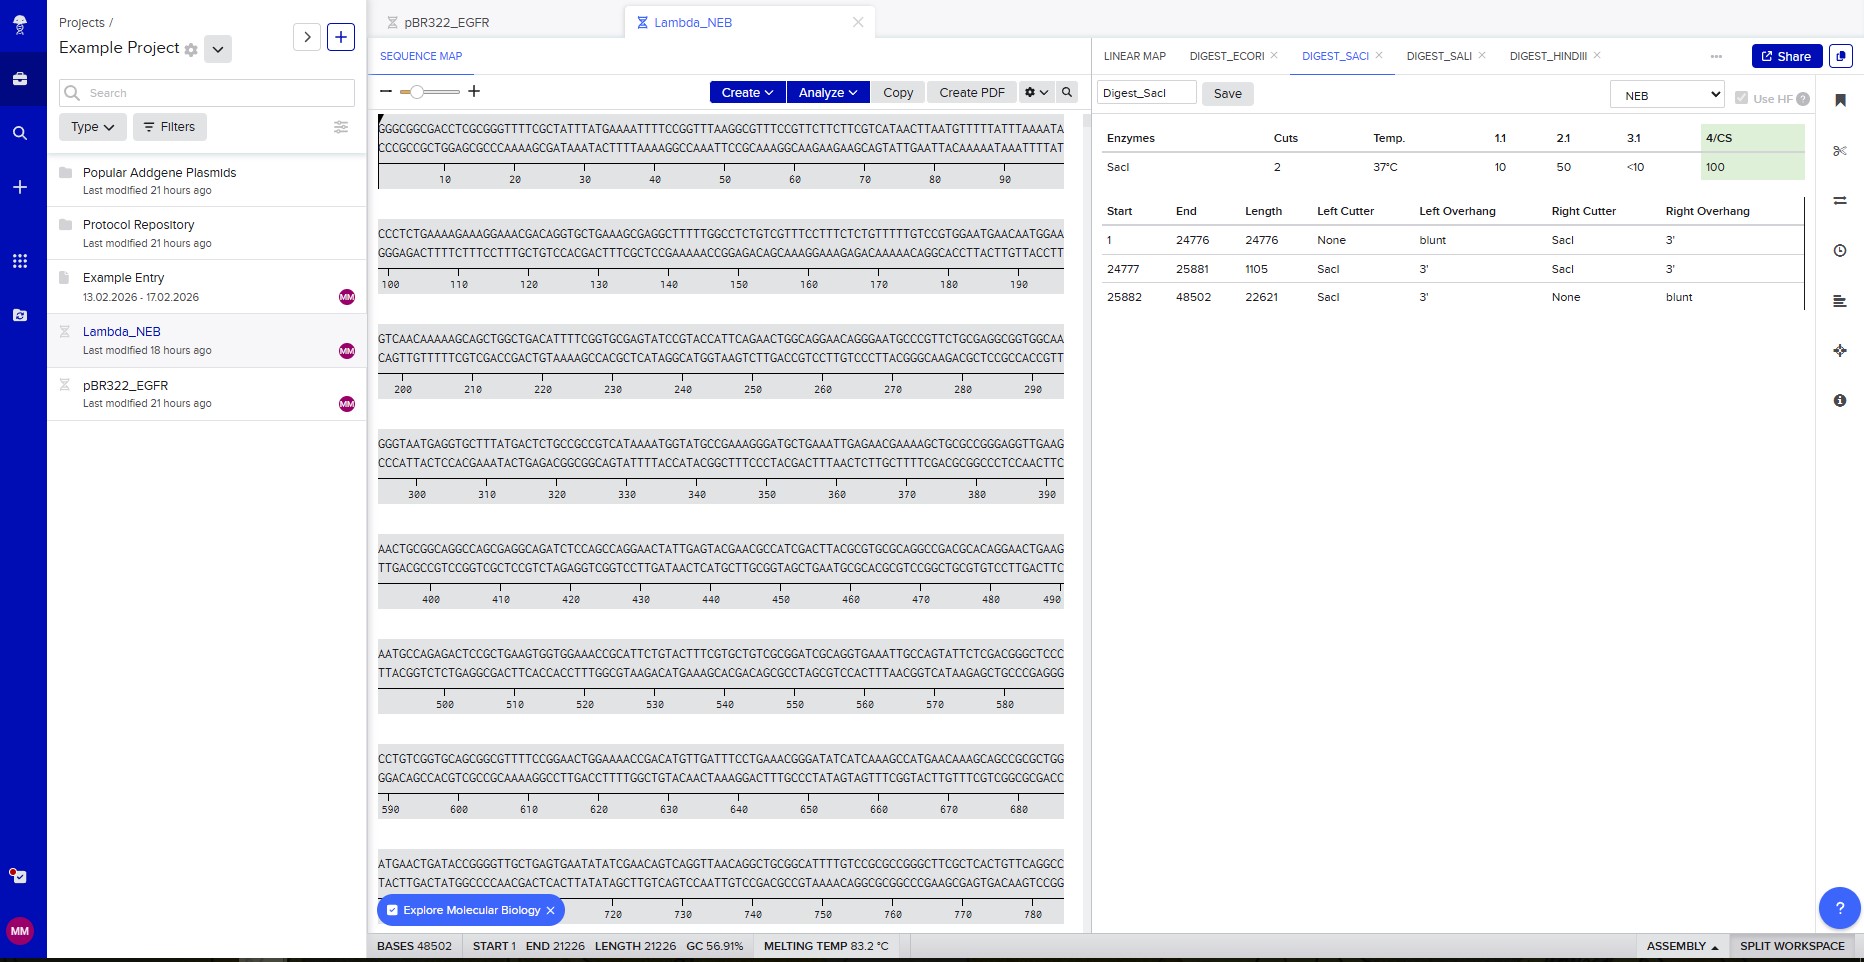
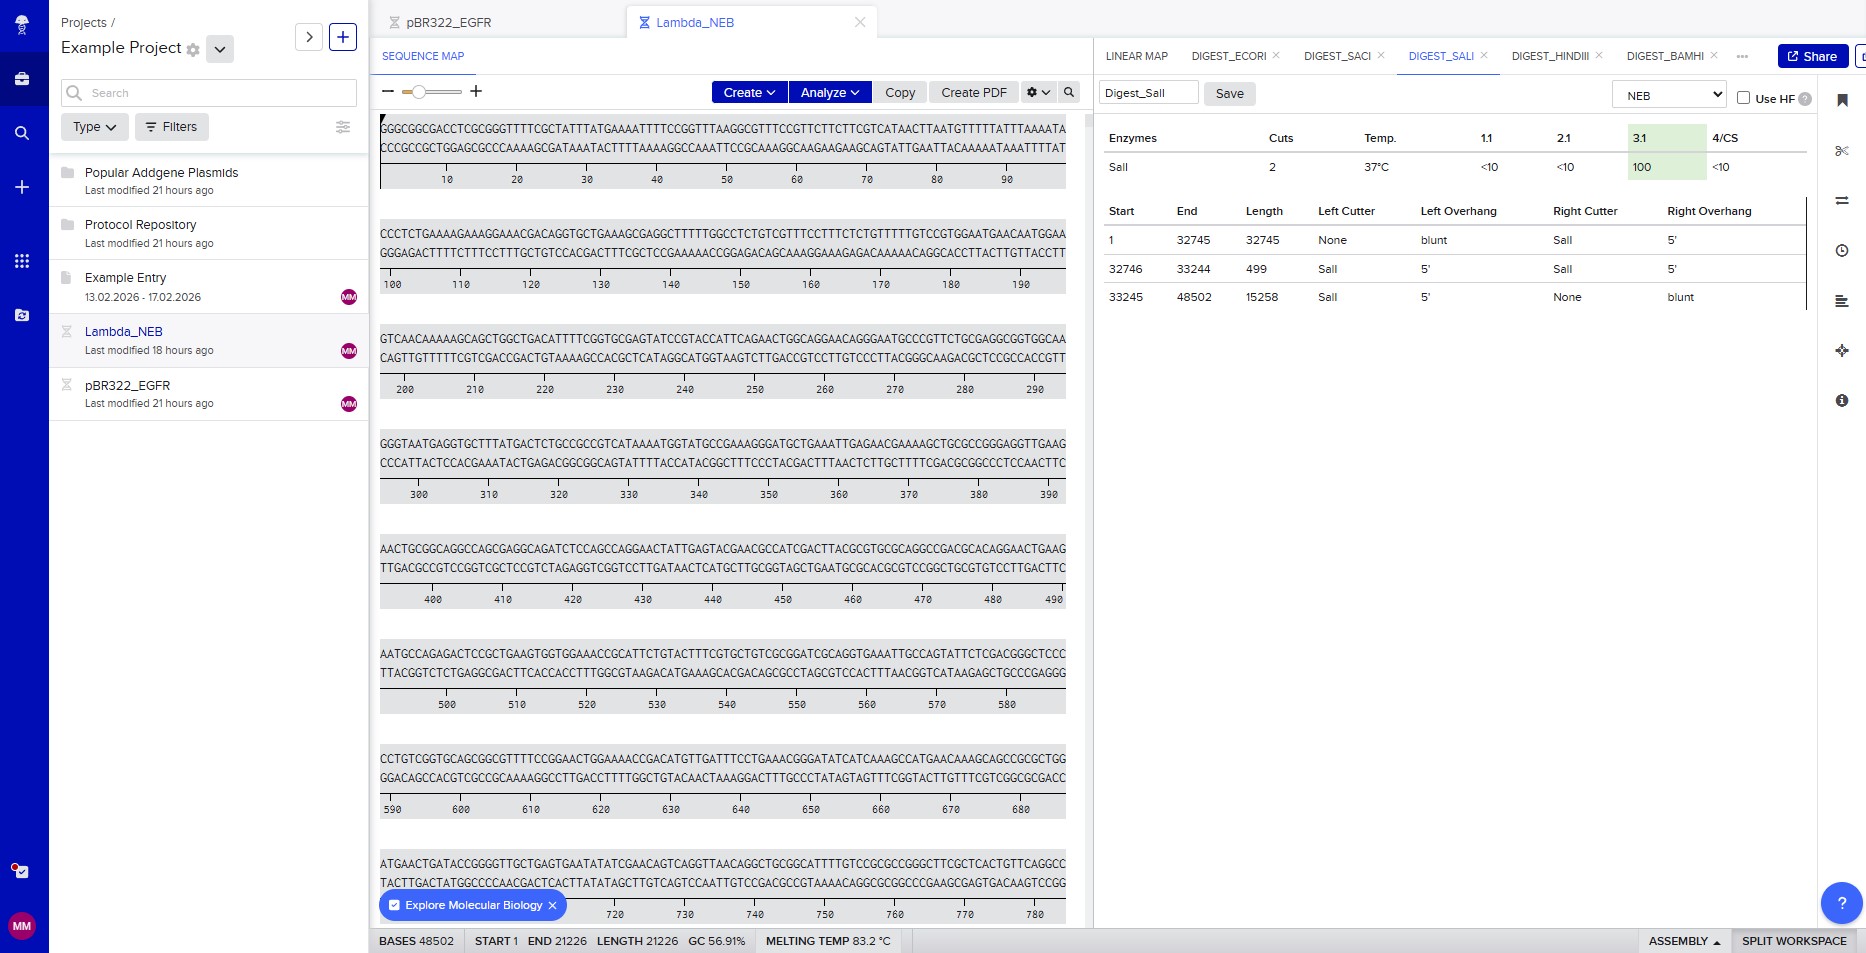
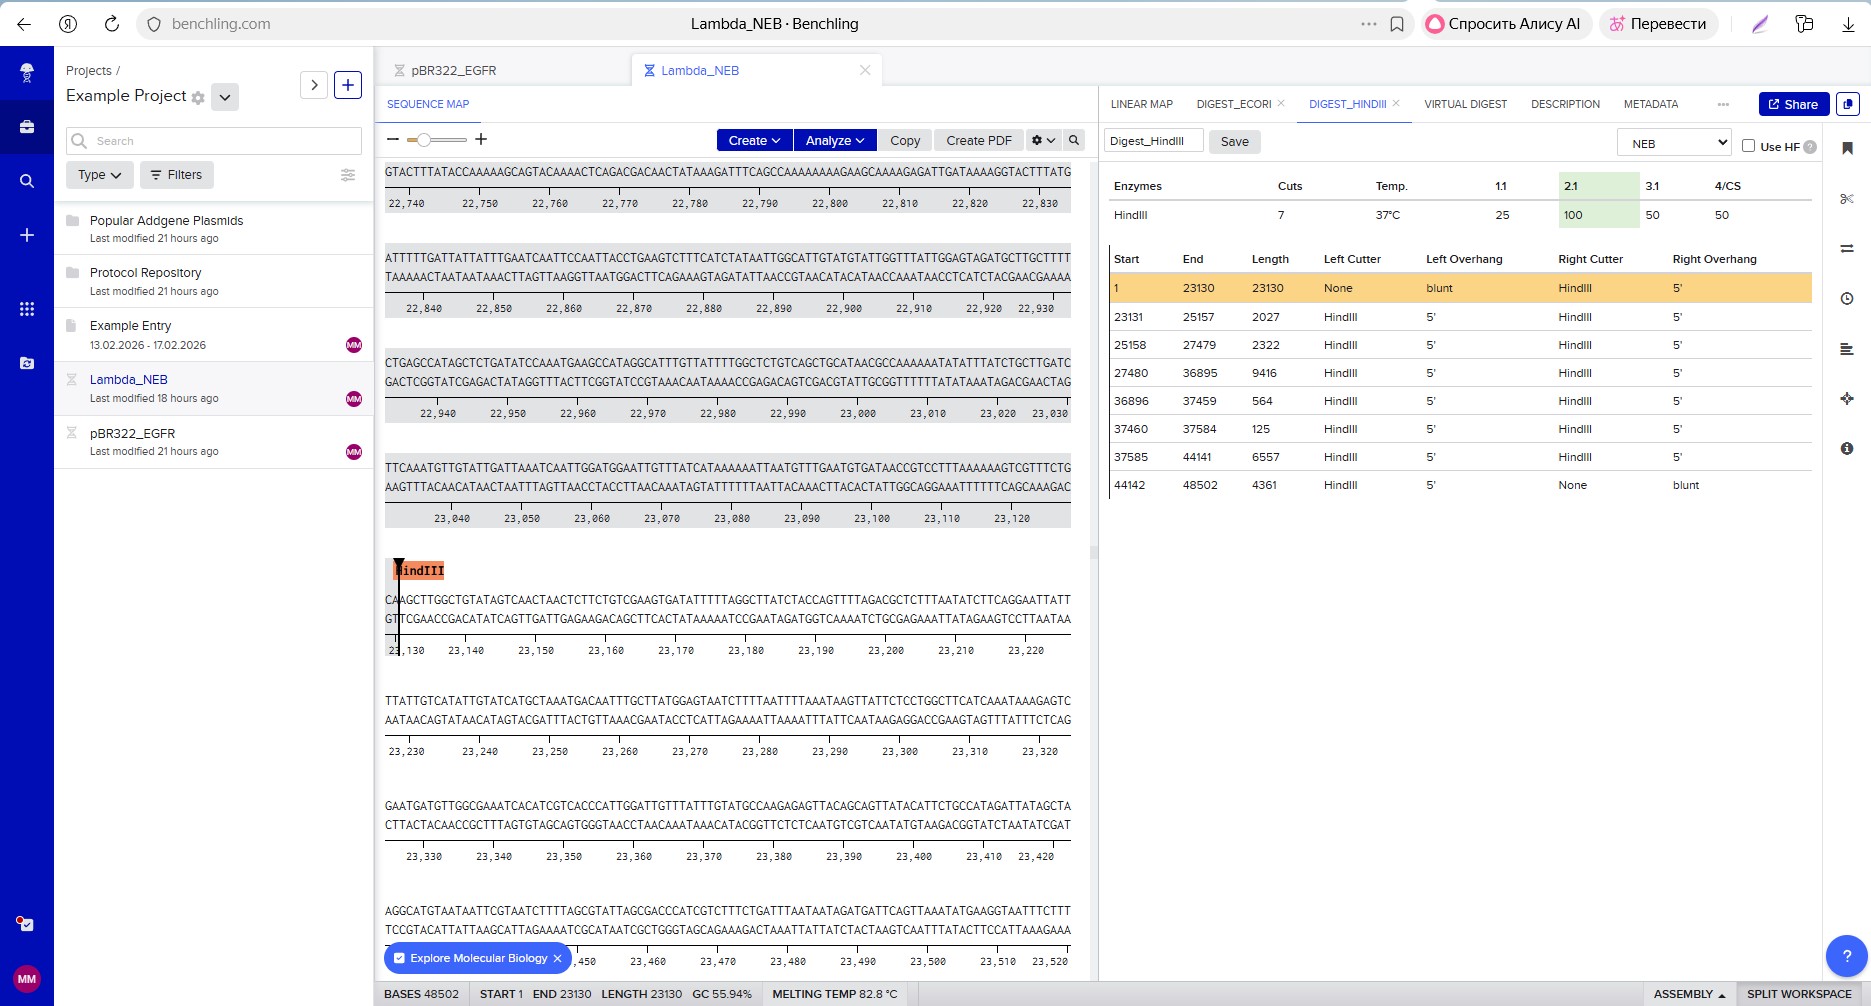
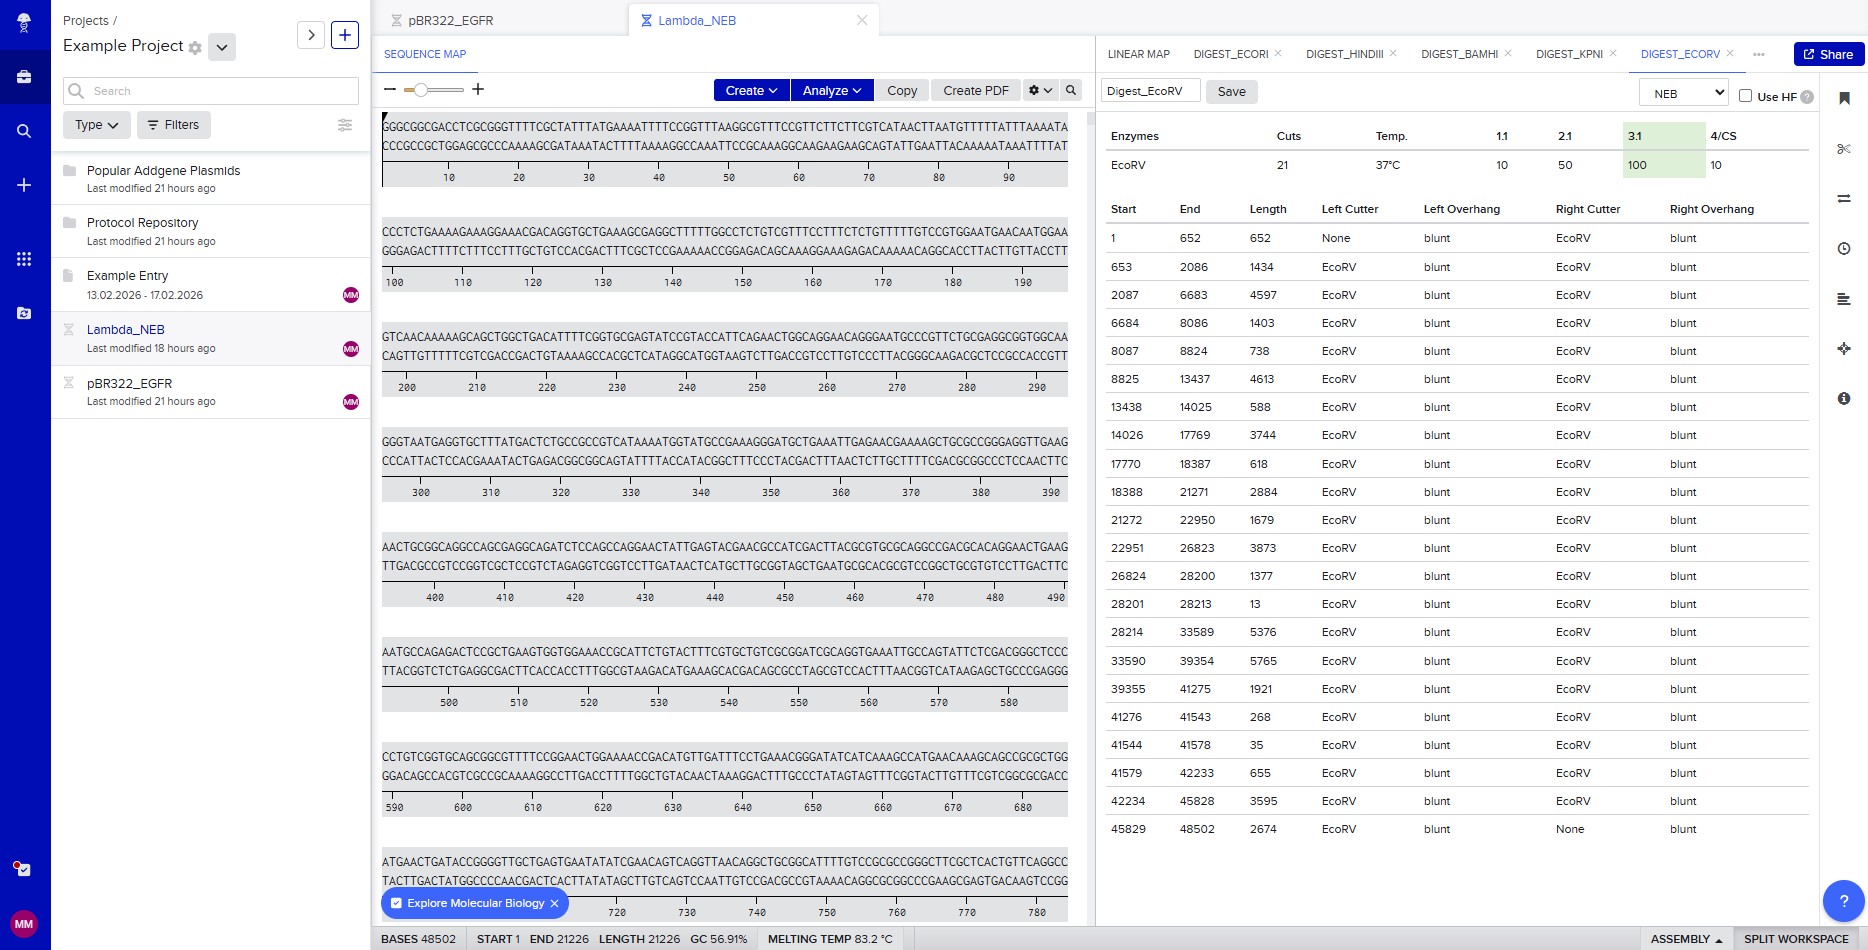
Benchling & In-silico Gel Art
The lambda bacteriophage DNA sequence (Lambda_NEB) was imported into Benchling. Using the virtual restriction tool, simulated DNA digestion was performed with seven restriction enzymes: EcoRI, SacI, SalI, HindIII, BamHI, KpnI, and EcoRV. The results were visualized by agarose gel electrophoresis.
Simulated gel electrophoresis of lambda DNA after restriction digestion with EcoRI, SacI, SalI, HindIII, BamHI, KpnI, and EcoRV
Restriction enzyme digestion with EcoRI
Restriction enzyme digestion with SacI
Restriction enzyme digestion with SalI
Restriction enzyme digestion with HindIII
Restriction enzyme digestion with EcoRV
Gel art pattern resembling a face created using the Ronan Donovan interface
DNA Design Challenge
Choose your protein
I have chosen the protein mScarlet-I. This is a bright red fluorescent protein derived from mCherry and optimized for fast maturation and high photostability. It is widely used as a reporter in bacterial systems because its fluorescence can be easily detected and quantified. In my construct, mScarlet-I is expressed under the control of the RcsB‑dependent promoter P_rprA, allowing me to monitor the activation of the Rcs phosphorelay pathway in Escherichia coli by detecting red fluorescence.
The protein sequence of mScarlet-I was obtained from the FPbase database (FPbase ID: 6VVTK), which specializes in fluorescent proteins. The sequence is as follows:
Reverse Translate: Protein (amino acid) sequence to DNA (nucleotide) sequence
Using the NCBI Nucleotide database, I searched for the mScarlet-I gene and found entry KY021424.1. This entry contains the coding DNA sequence (CDS) for the mScarlet-I protein. The nucleotide sequence is:
ATGGTGAGCAAGGGCGAGGCAGTGATCAAGGAGTTCATGCGGTTCAAGGTGCACATGGAGGGCTCCATGAACGGCCACGAGTTCGAGATCGAGGGCGAGGGCGAGGGCCGCCCCTACGAGGGCACCCAGACCGCCAAGCTGAAGGTGACCAAGGGTGGCCCCCTGCCCTTCTCCTGGGACATCCTGTCCCCTCAGTTCATGTACGGCTCCAGGGCCTTCATCAAGCACCCCGCCGACATCCCCGACTACTATAAGCAGTCCTTCCCCGAGGGCTTCAAGTGGGAGCGCGTGATGAACTTCGAGGACGGCGGCGCCGTGACCGTGACCCAGGACACCTCCCTGGAGGACGGCACCCTGATCTACAAGGTGAAGCTCCGCGGCACCAACTTCCCTCCTGACGGCCCCGTAATGCAGAAGAAGACAATGGGCTGGGAAGCGTCCACCGAGCGGTTGTACCCCGAGGACGGCGTGCTGAAGGGCGACATTAAGATGGCCCTGCGCCTGAAGGACGGCGGCCGCTACCTGGCGGACTTCAAGACCACCTACAAGGCCAAGAAGCCCGTGCAGATGCCCGGCGCCTACAACGTCGACCGCAAGTTGGACATCACCTCCCACAACGAGGACTACACCGTGGTGGAACAGTACGAACGCTCCGAGGGCCGCCACTCCACCGGCGGCATGGACGAGCTGTACAAG
Codon optimization
I optimized the mScarlet-I gene for expression in E. coli using the E. coli Codon Optimizer tool (efbpublic.org). Codon optimization is necessary because E. coli prefers specific codons over others; using rare codons slows down translation and reduces protein yield. I chose E. coli as the host because it is the standard organism for protein expression in my project. The optimized sequence has a GC content of 42.4% (down from 63.1%), which is ideal for E. coli.
To produce the mScarlet-I protein from my DNA sequence, I will use a cell-dependent method: expression in Escherichia coli.
My DNA construct contains the following elements:
P_rprA: an inducible promoter that is activated by the RcsB protein. It initiates transcription of the downstream gene.
B0034: a strong ribosome binding site (RBS) that recruits ribosomes to start translation.
mScarlet-I: the coding sequence (CDS) for the red fluorescent protein.
B0015: a strong terminator that stops transcription.
How the DNA sequence is transcribed and translated into protein:
First, the DNA is transcribed into mRNA. RNA polymerase binds to the P_rprA promoter and synthesizes a complementary RNA copy of the mScarlet-I coding sequence. Transcription continues until the terminator B0015 is reached, which causes RNA polymerase to detach from the DNA.
Second, the mRNA is translated into protein. The ribosome binds to the B0034 RBS on the mRNA and begins scanning for the start codon (ATG). Once it finds the start codon, it reads the mRNA in groups of three nucleotides (codons). Each codon specifies one amino acid. The ribosome links these amino acids together to form the mScarlet-I polypeptide chain, which then folds into a functional red fluorescent protein.
Prepare a Twist DNA Synthesis Order
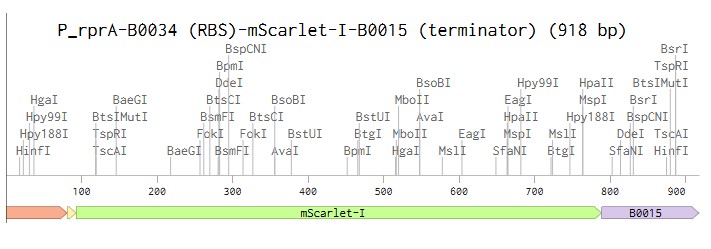
Linear map DNA design in Benchling
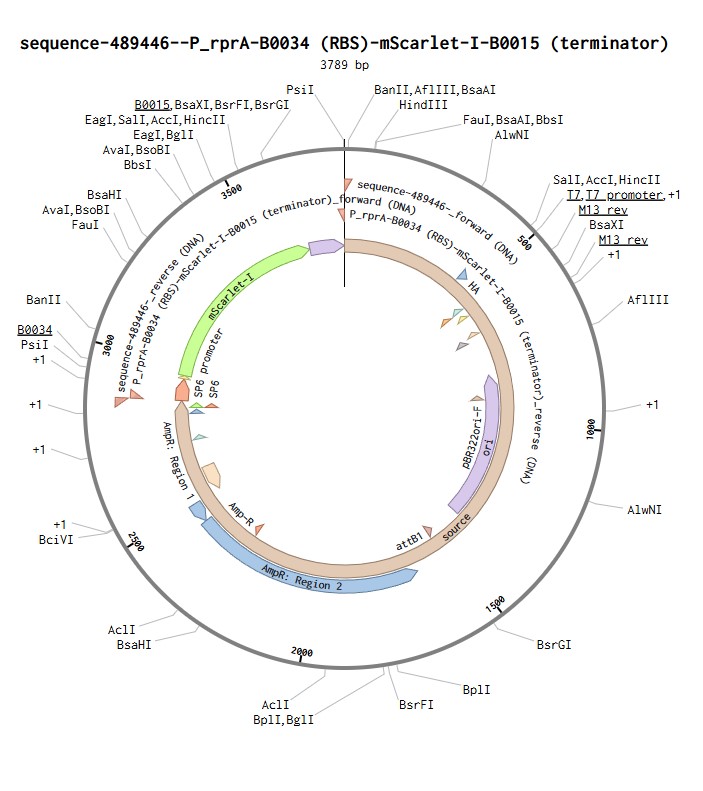
Linear map of the P_rprA-B0034-mScarlet-I-B0015 expression cassette (918 bp)
Gene design, vector selection and plasmid assembly
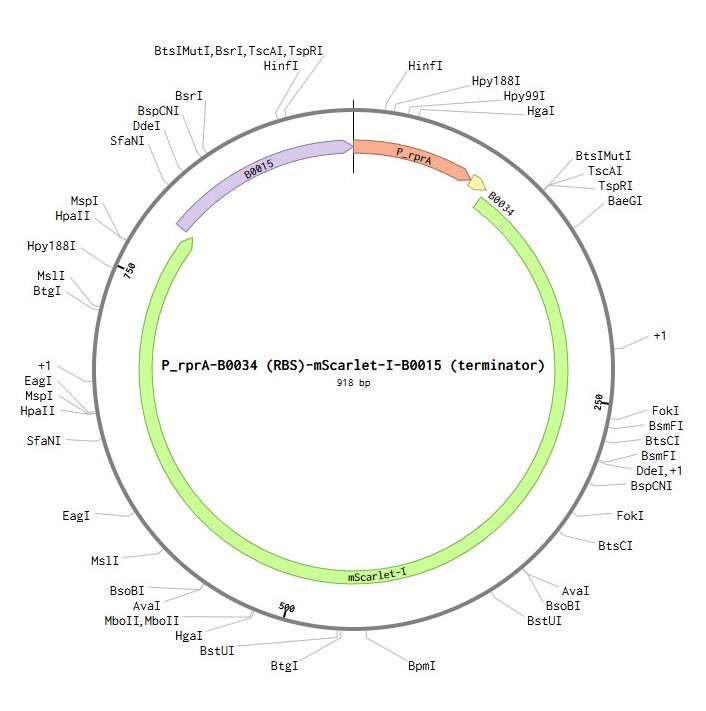
I selected the high-copy vector pTwist Amp High Copy with ampicillin resistance. After importing its GenBank file into Benchling, I assembled the final plasmid by inserting my construct P_rprA-B0034-mScarlet-I-B0015 into the vector using Gibson Assembly. The resulting circular plasmid pTwist_Amp_P_rprA-mScarlet-I_final (3139 bp) is ready for transformation into E. coli and expression of the red fluorescent protein under the control of the RcsB-dependent promoter.
Circular map of the assembled expression plasmid pTwist_Amp_P_rprA-mScarlet-I_final (3139 bp)
DNA Read/Write/Edit
(i) What DNA would you want to sequence (e.g., read) and why?
I would like to sequence DNA reverse‑transcribed from mRNA (cDNA) of E. coli bacteria carrying my reporter construct P_rprA — B0034 — mScarlet‑I — B0015, before and after exposure to sound vibration. This would help me understand how mechanical oscillations affect gene expression, including activation of the RcsB pathway, and use sound as a non‑invasive tool to control recombinant protein expression in biotechnology, for example by optimizing bacterial growth conditions based on the fluorescence signal.
(ii) In lecture, a variety of sequencing technologies were mentioned. What technology or technologies would you use to perform sequencing on your DNA and why?
Technology: I would use Sanger sequencing to verify my assembled plasmid.
Is your method first-, second- or third-generation or other? How so?
Sanger sequencing is a first‑generation method. It is defined by sequencing one DNA fragment at a time using chain termination (dideoxynucleotides), unlike massively parallel sequencing used in second‑ and third‑generation methods.
What is your input? How do you prepare your input (e.g. fragmentation, adapter ligation, PCR)? List the essential steps.
The input is purified plasmid DNA and a specific primer that binds to the vector next to my insert. Preparation consists of mixing the DNA, primer, DNA polymerase, regular nucleotides (dNTPs) and fluorescently labelled terminators (ddNTPs).
What are the essential steps of your chosen sequencing technology, how does it decode the bases of your DNA sample (base calling)?
Denature double‑stranded DNA by heating.
Anneal the primer to the single‑stranded template.
Chain elongation: polymerase adds nucleotides. When a terminator (ddNTP) is incorporated, synthesis stops on that strand.
This produces a set of fragments of different lengths, each ending with a known fluorescent terminator.
Fragments are separated by size using capillary electrophoresis.
A laser excites fluorescence and a detector records the colour of each fragment.
A computer converts the colour into a nucleotide (A, T, G or C). This is called base calling.
What is the output of your chosen sequencing technology?
The output is a chromatogram (a graph with peaks for each nucleotide) and a text file containing the DNA sequence (.ab1 or .fasta). This sequence can be aligned to the expected sequence in Benchling to confirm that the construct has no mutations.
DNA Write
(i) What DNA would you want to synthesize (e.g., write) and why?
I would like to synthesise my reporter construct P_rprA — B0034 — mScarlet-I — B0015 (918 bp). It contains the RcsB‑dependent promoter P_rprA, the strong ribosome binding site B0034, the mScarlet‑I red fluorescent protein gene and the B0015 terminator. This construct will make E. coli bacteria sensitive to sound vibration – when the RcsB pathway is activated, the bacteria will glow red. In the future, such a biosensor could be used for non‑invasive monitoring of bioreactors or for studying bacterial mechanosensitivity.
(ii) What technology or technologies would you use to perform this DNA synthesis and why?
To synthesise my construct, I would use a combination of solid‑phase chemical synthesis (phosphoramidite method) to make short oligonucleotides and Gibson assembly to build the full gene.
What are the essential steps of your chosen sequencing methods?
Sequence design and codon optimization
Split the gene into short oligonucleotides (40–60 nt)
Chemical oligonucleotide synthesis (cycles: deprotection, coupling, capping, oxidation)
Assemble oligonucleotides into double‑stranded DNA by PCR
Assemble fragments into a plasmid using Gibson assembly (exonuclease, polymerase, ligase)
Clone into a vector and verify by sequencing
What are the limitations of your synthesis method in terms of speed, accuracy, scalability?
Accuracy: Error rate increases with gene length; GC‑rich and repetitive sequences are difficult to synthesise
Speed: A full synthesis and assembly cycle takes 2–4 weeks
Scalability: Thousands of genes can be ordered at once, but synthesising a whole genome (millions of bp) is very expensive and requires a library approach
DNA Edit
(i) What DNA would you want to edit and why?
Within my project, I would like to edit my own construct P_rprA — B0034 — mScarlet-I — B0015 in two ways:
Replace the P_rprA promoter with a stronger or differently inducible promoter (e.g., a promoter that responds to a different signal instead of only the RcsB pathway). This would allow me to use the same reporter system to study different stress pathways in bacteria.
Edit the mScarlet-I gene to obtain variants with different fluorescence colours (e.g., change a few key amino acids to shift the spectrum from red to yellow or blue). This would enable the creation of multicolour reporters for simultaneously monitoring several promoters.
Why this is useful:
Create a toolkit for multiplex analysis (different colours for different signals).
Adapt the construct for other organisms or conditions.
(ii) What technology or technologies would you use to perform these DNA edits and why?
I would use PCR‑based site‑directed mutagenesis because it is suitable for introducing point mutations or small changes into an already assembled plasmid.
How does your technology of choice edit DNA? What are the essential steps?
Design two primers containing the desired mutation
PCR that amplifies the entire plasmid
DpnI treatment to digest the original template plasmid
Transform bacteria and isolate the edited plasmid
What preparation do you need to do (e.g. design steps) and what is the input (e.g. DNA template, enzymes, plasmids, primers, guides, cells) for the editing?
Plasmid DNA (template)
Two mutagenic primers
High‑fidelity DNA polymerase
DpnI enzyme
Competent E. coli cells
What are the limitations of your editing methods (if any) in terms of efficiency or precision?
Efficiency is 50–80%, depending on primer quality
Works only for short changes (up to 20–30 bp)
GC‑rich regions and long repeats are difficult to amplify
Week 3 HW: Lab Automation
Python Script for Opentrons Artwork
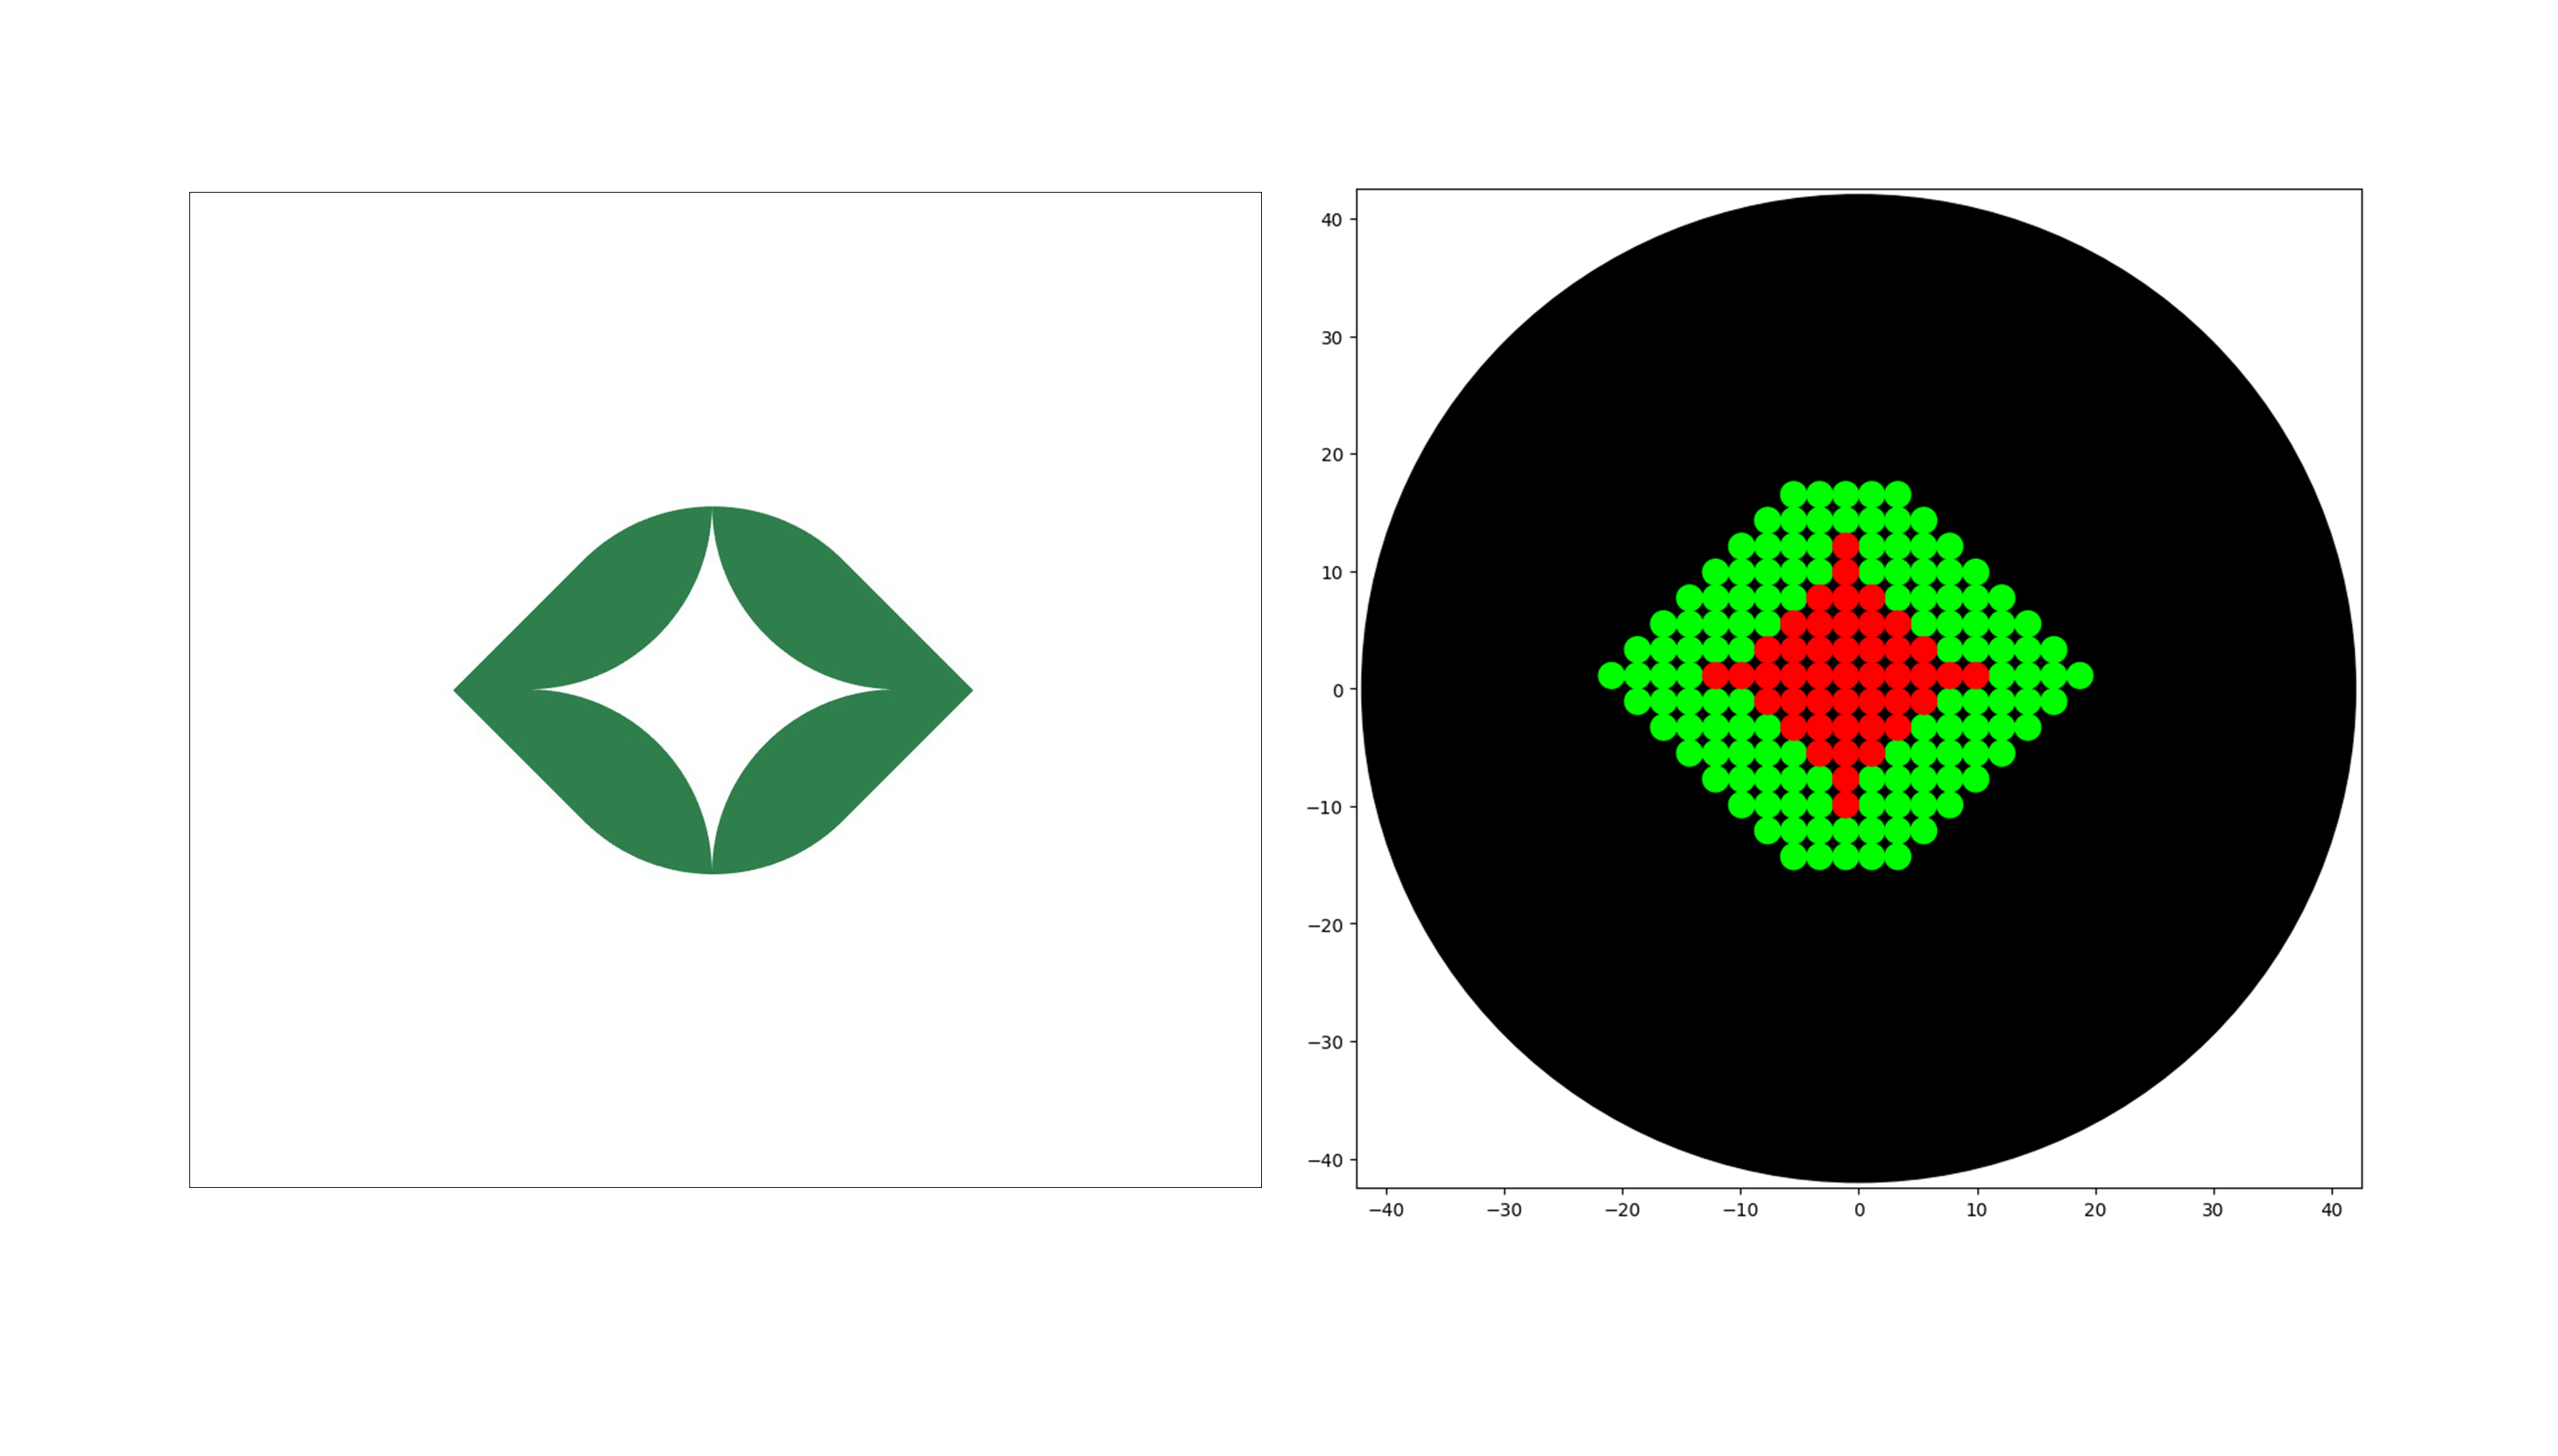
I made an image for Opentrons Artwork based on the eye symbol from the Plantoverse project I’m involved with.
The bioprinter can automatically deposit a bacterial suspension onto the surface of an agar nutrient medium. It allows printing of images, patterns or text using living microorganisms. The main parts of the project are:
Arduino code that is responsible for parsing image data (in bytes), moving the motors, and activating the printhead via the InkShield board
Python code to adapt a low‑resolution black‑and‑white image and send it through the serial port
The BioArt Team aims to develop the bioart community and make these technologies accessible. The code for this project is open source and available on GitHub at: github.com/strangerest/bioprinter_simple
Thus, this work shows how relatively simple and affordable automation tools can be used to solve complex problems at the intersection of biology, engineering and art.
Automation in my final project
As part of my final project, I plan to use this bioprinter to print images with E. coli bacteria.
Steps:
As part of my final project, I plan to use this bioprinter to print images with E. coli bacteria
Generate a raster image
Prepare the printing suspension: E. coli in liquid LB medium for the cartridge
Ensure sterility of the bioprinter work area and the cartridge
Calibrate the bioprinter for the Petri dish and run test prints
Run the code
Print the image with E. coli bacteria on solid agar nutrient medium in a Petri dish
Close the Petri dish and place it in an incubator for 24 hours at 37°C
Week 4 HW:Protein Design Part I
Protein Design I
Part A. Conceptual Questions
How many molecules of amino acids do you take with a piece of 500 grams of meat? (on average an amino acid is ~100 Daltons)
The average molecular weight of an amino acid is ~100 g/mol. In 500 g of meat (if we consider all meat as amino acids) there are 5 moles, which gives 5 × 6 × 10²³ = 3 × 10²⁴ molecules. However, meat is not entirely protein: protein makes up only about 20% of the mass, i.e., 100 g of protein per 500 g of meat. After protein breakdown, this corresponds to 1 mole of amino acids, that is 6 × 10²³ molecules.
Why do humans eat beef but do not become a cow, eat fish but do not become fish?
Because meat proteins are broken down into individual amino acids in the stomach and intestines. These amino acids are absorbed into the bloodstream and used by the body to synthesize human proteins according to the instructions encoded in human DNA. Foreign DNA is not integrated into our genome during digestion.
Why are there only 20 natural amino acids?
20 amino acids are an evolutionarily fixed optimum between chemical diversity, translational fidelity and mutational robustness, realised within the 64 codons of the genetic code.
Where did amino acids come from before enzymes that make them, and before life started?
Amino acids were synthesised abiotically from simple molecules under the action of energy (electrical discharges, UV radiation, heat from hydrothermal vents), and were also delivered to Earth by meteorites — long before enzymes and life appeared.
If you make an α-helix using D-amino acids, what handedness (right or left) would you expect?
An α-helix made of D-amino acids would be left-handed. Natural proteins made of L-amino acids form right-handed α-helices. D-amino acids are the mirror image of L-forms, so the helix will also be the mirror image and therefore left-handed.
Can you discover additional helices in proteins?
Yes, proteins contain other types of helices besides the α-helix.
Why are most molecular helices right-handed?
Most molecular helices are right-handed because they are built from L-amino acids. The chirality of L-amino acids makes the right-handed helix energetically more favourable.
Why do β-sheets tend to aggregate? What is the driving force for β-sheet aggregation?
β-sheets tend to aggregate because their edges have unpaired hydrogen bonds that seek to form bonds with other β-sheets. The main driving force is the hydrophobic effect: the side chains of amino acids (especially hydrophobic ones such as valine, leucine, isoleucine, phenylalanine) are exposed on the sheet surface and, to avoid water, tend to stick to the hydrophobic surfaces of other sheets. Inter‑sheet backbone hydrogen bonds also contribute.
Why do many amyloid diseases form β-sheets? Can you use amyloid β-sheets as materials?
Misfolded proteins easily form β-sheets, which stick together into strong fibres (fibrils). These fibres are not broken down in the body and accumulate in tissues, causing disease.
Amyloid β‑sheets can be used as materials due to their strength, stability, and biocompatibility.
Part B: Protein Analysis and Visualization
Briefly describe the protein you selected and why you selected it.
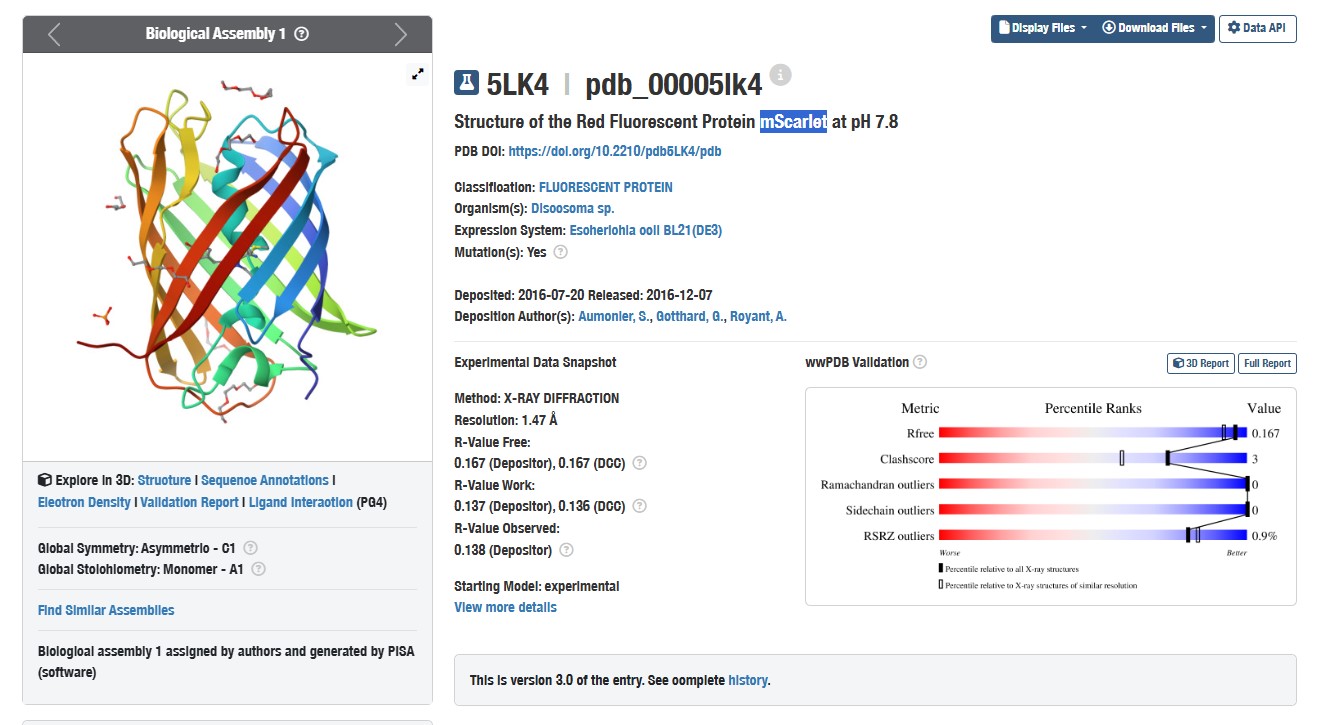
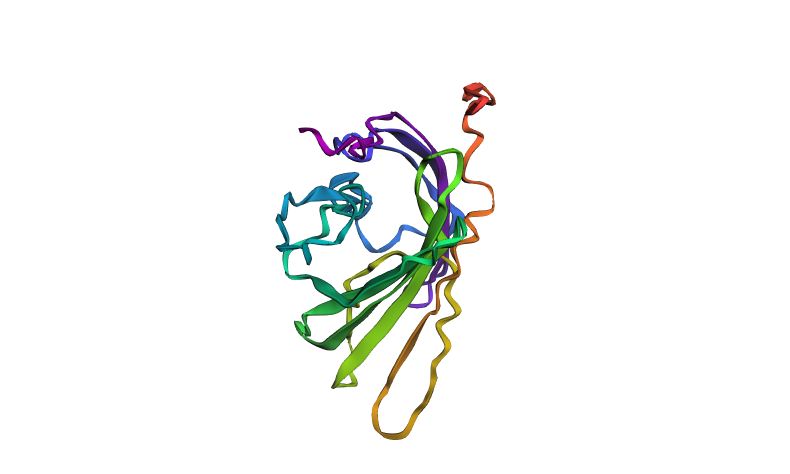
I chose the mScarlet protein (a red fluorescent protein), because its mutant form mScarlet-I is directly used in my project as a reporter in the construct P_rprA — B0034 — mScarlet-I — B0015. This protein matures quickly, has high brightness and stability, making it convenient for imaging. For 3D structure analysis, I will use the mScarlet structure (PDB ID 5LK4), since mScarlet-I differs from it by only one amino acid (T74I) and has an almost identical fold.
Structure of mScarlet (PDB 5LK4)
Identify the amino acid sequence of your protein.
How long is it? What is the most frequent amino acid?
The mScarlet protein has a chain length of 219 amino acids (in the structural model PDB 5LK4). The most frequent amino acid is leucine (Leu, L).
How many protein sequence homologs are there for your protein?
According to the BLAST search against the UniProtKB database, the mScarlet protein has 225 homologs. This includes natural fluorescent proteins as well as engineered variants.
Does your protein belong to any protein family?
mScarlet belongs to the GFP‑like fluorescent protein family (Pfam: PF01353). This family includes proteins that share a similar β‑barrel fold and chromophore formation mechanism. Within this family, it is classified as a red fluorescent protein (RFP) subfamily member.
Identify the structure page of your protein in RCSB
When was the structure solved? Is it a good quality structure? Good quality structure is the one with good resolution. Smaller the better (Resolution: 2.70 Å)
The structure was determined in 2016. The resolution of 1.47 Å is good quality
Are there any other molecules in the solved structure apart from protein?
Yes, the structure contains PEG molecules and phosphate ions, which were used during crystallisation.
Does your protein belong to any structure classification family?
Yes. Structurally, mScarlet belongs to the GFP‑like fluorescent protein family (characteristic β‑barrel fold).
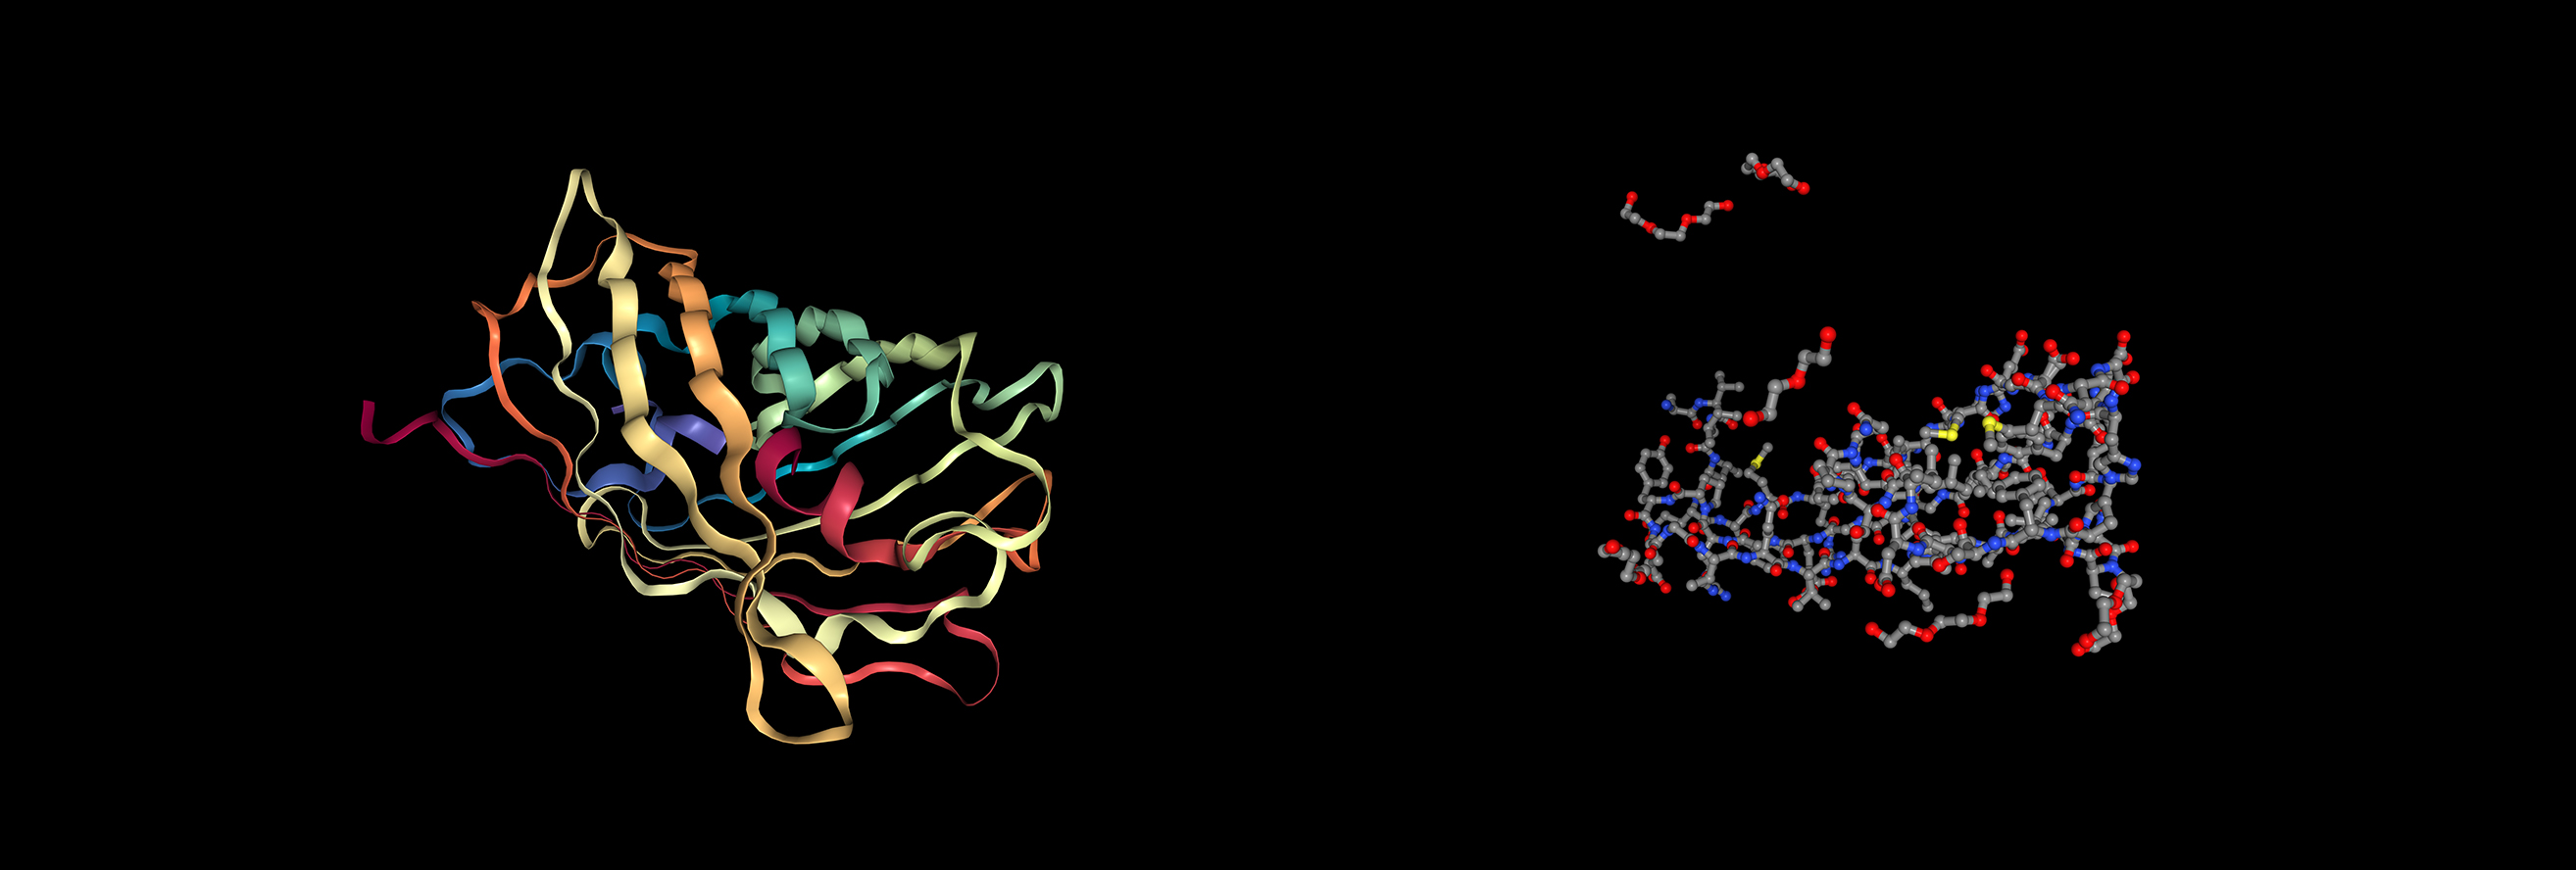
Open the structure of your protein in any 3D molecule visualization software
Visualization of the protein as “cartoon”, “ribbon” and “ball and stick”
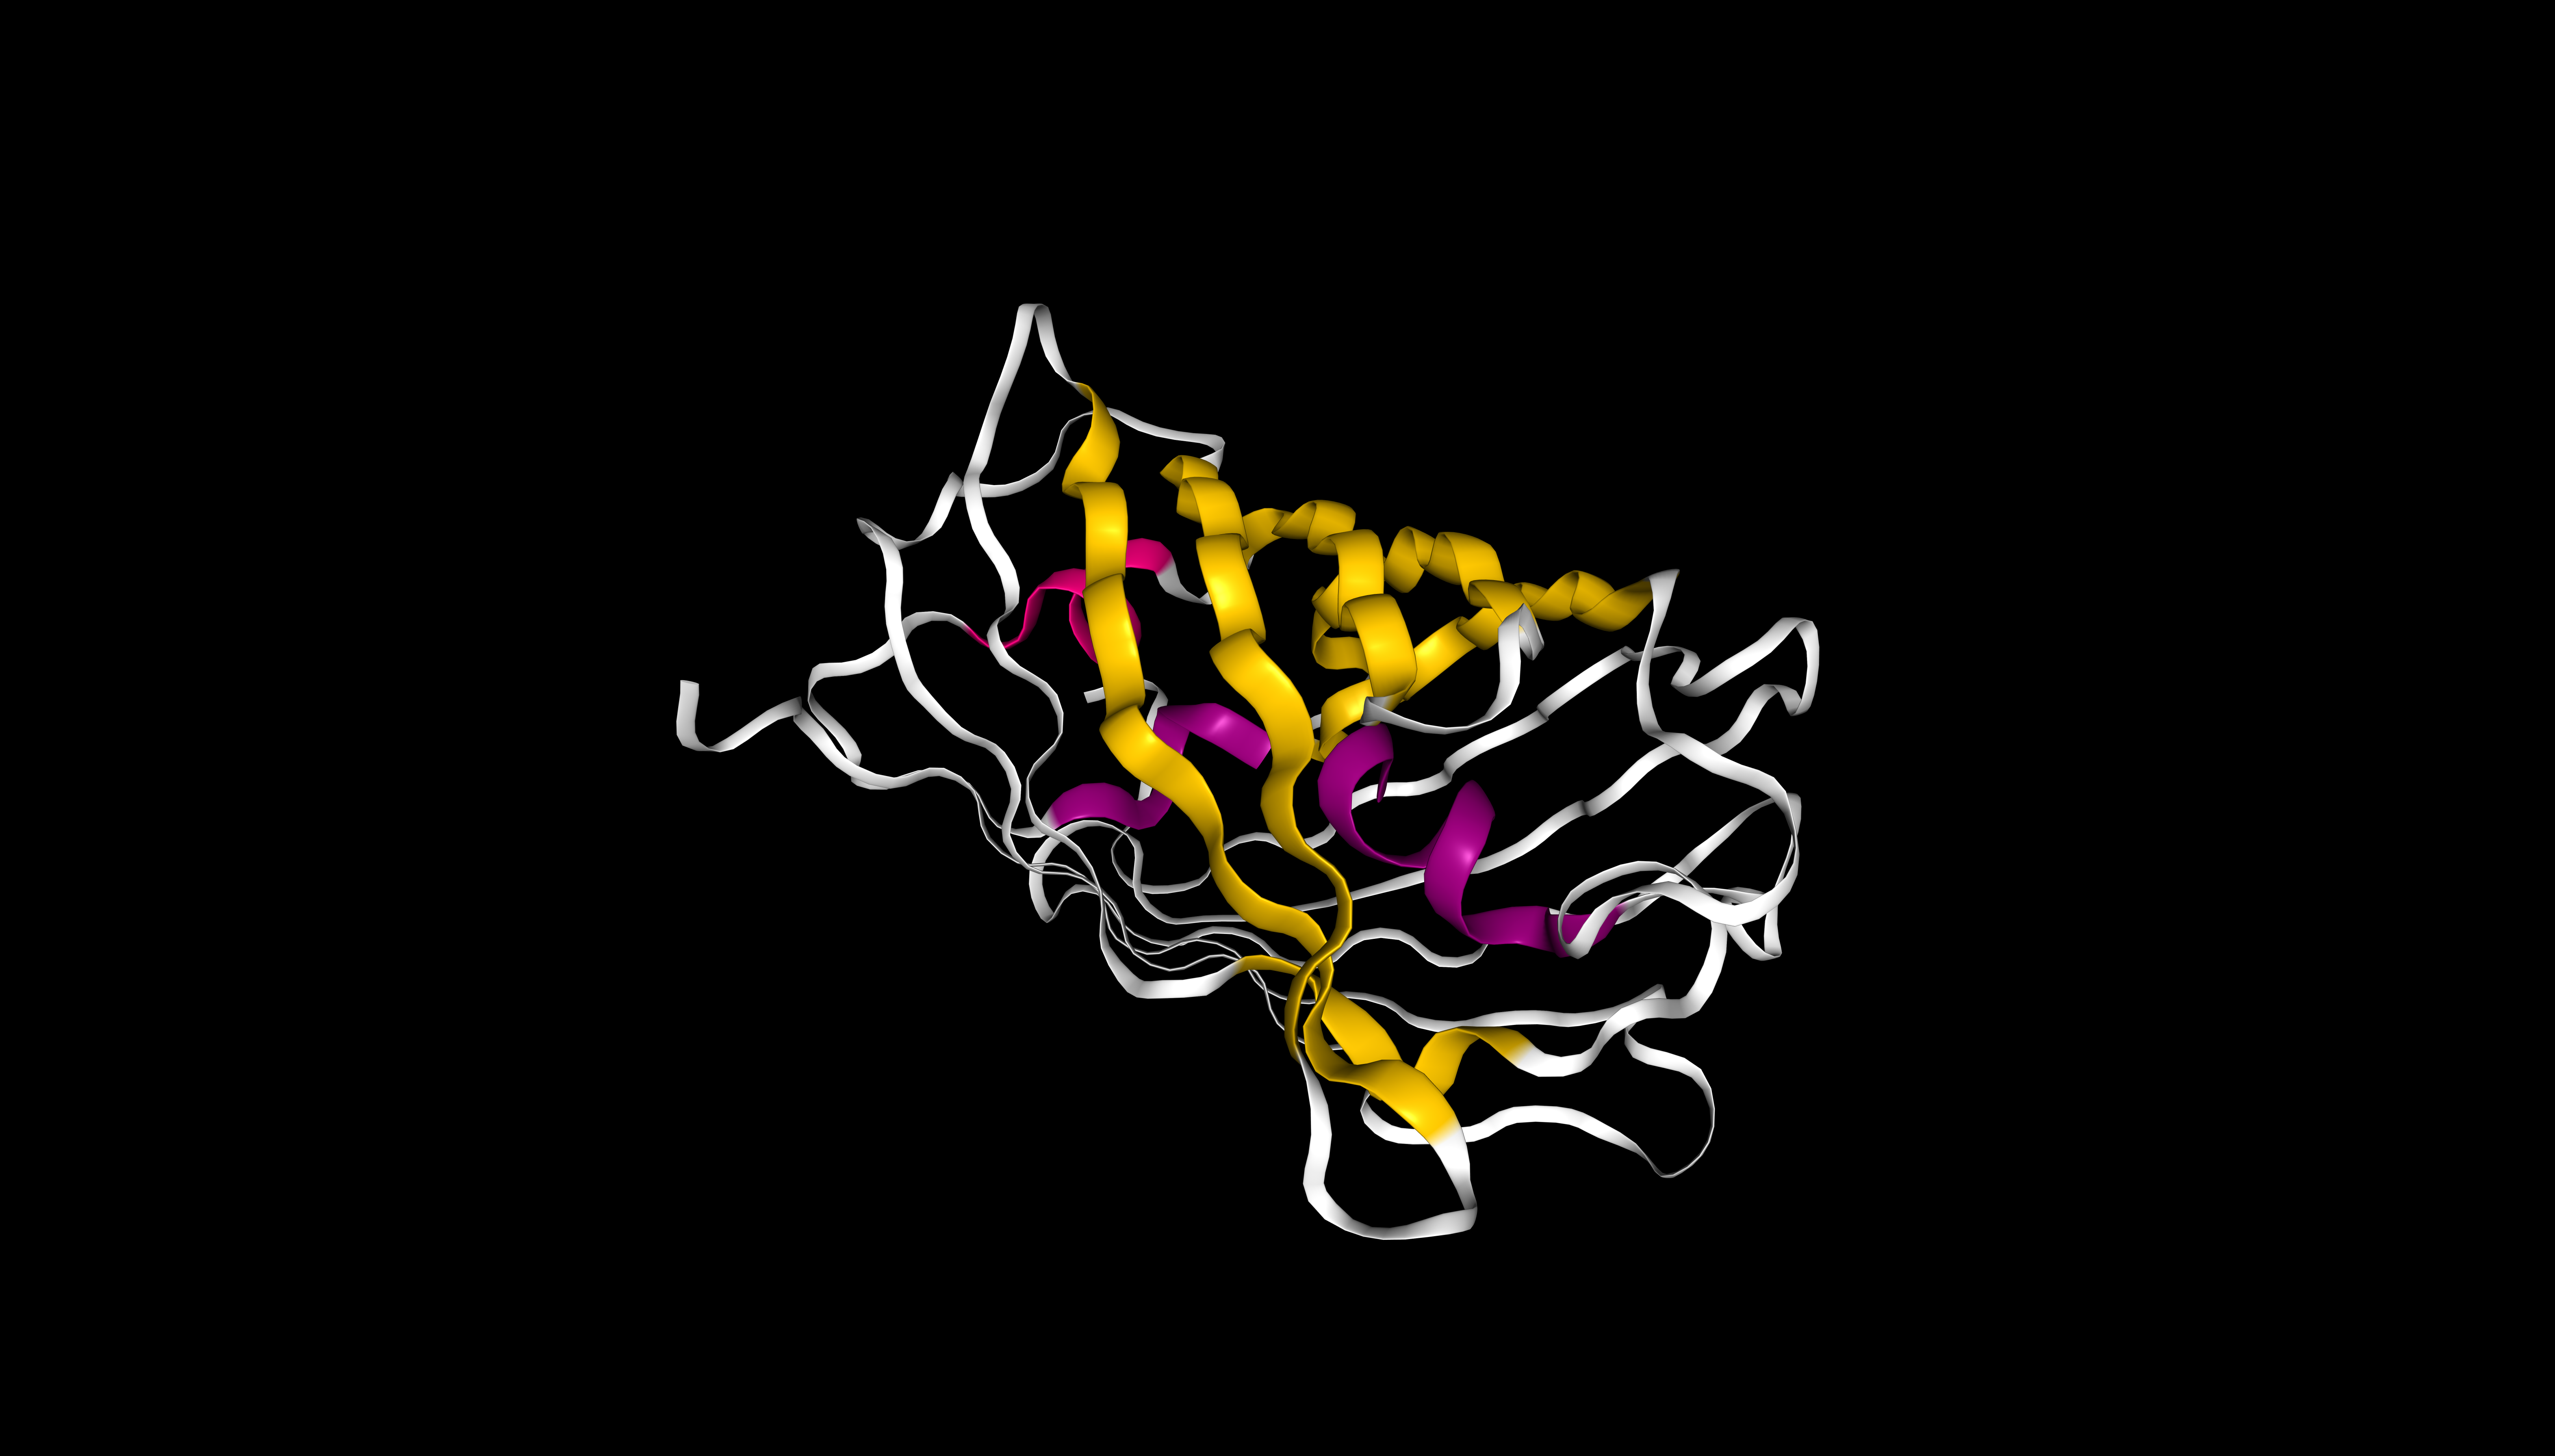
The protein has more β-sheets (β-sheets dominate over α-helices), which is typical for the GFP‑like family with a β‑barrel fold.
mScarlet coloured by secondary structure (sstruc). β-sheets are shown in yellow, α-helices in pink. β-sheets visually dominate, consistent with the β-barrel fold of this protein
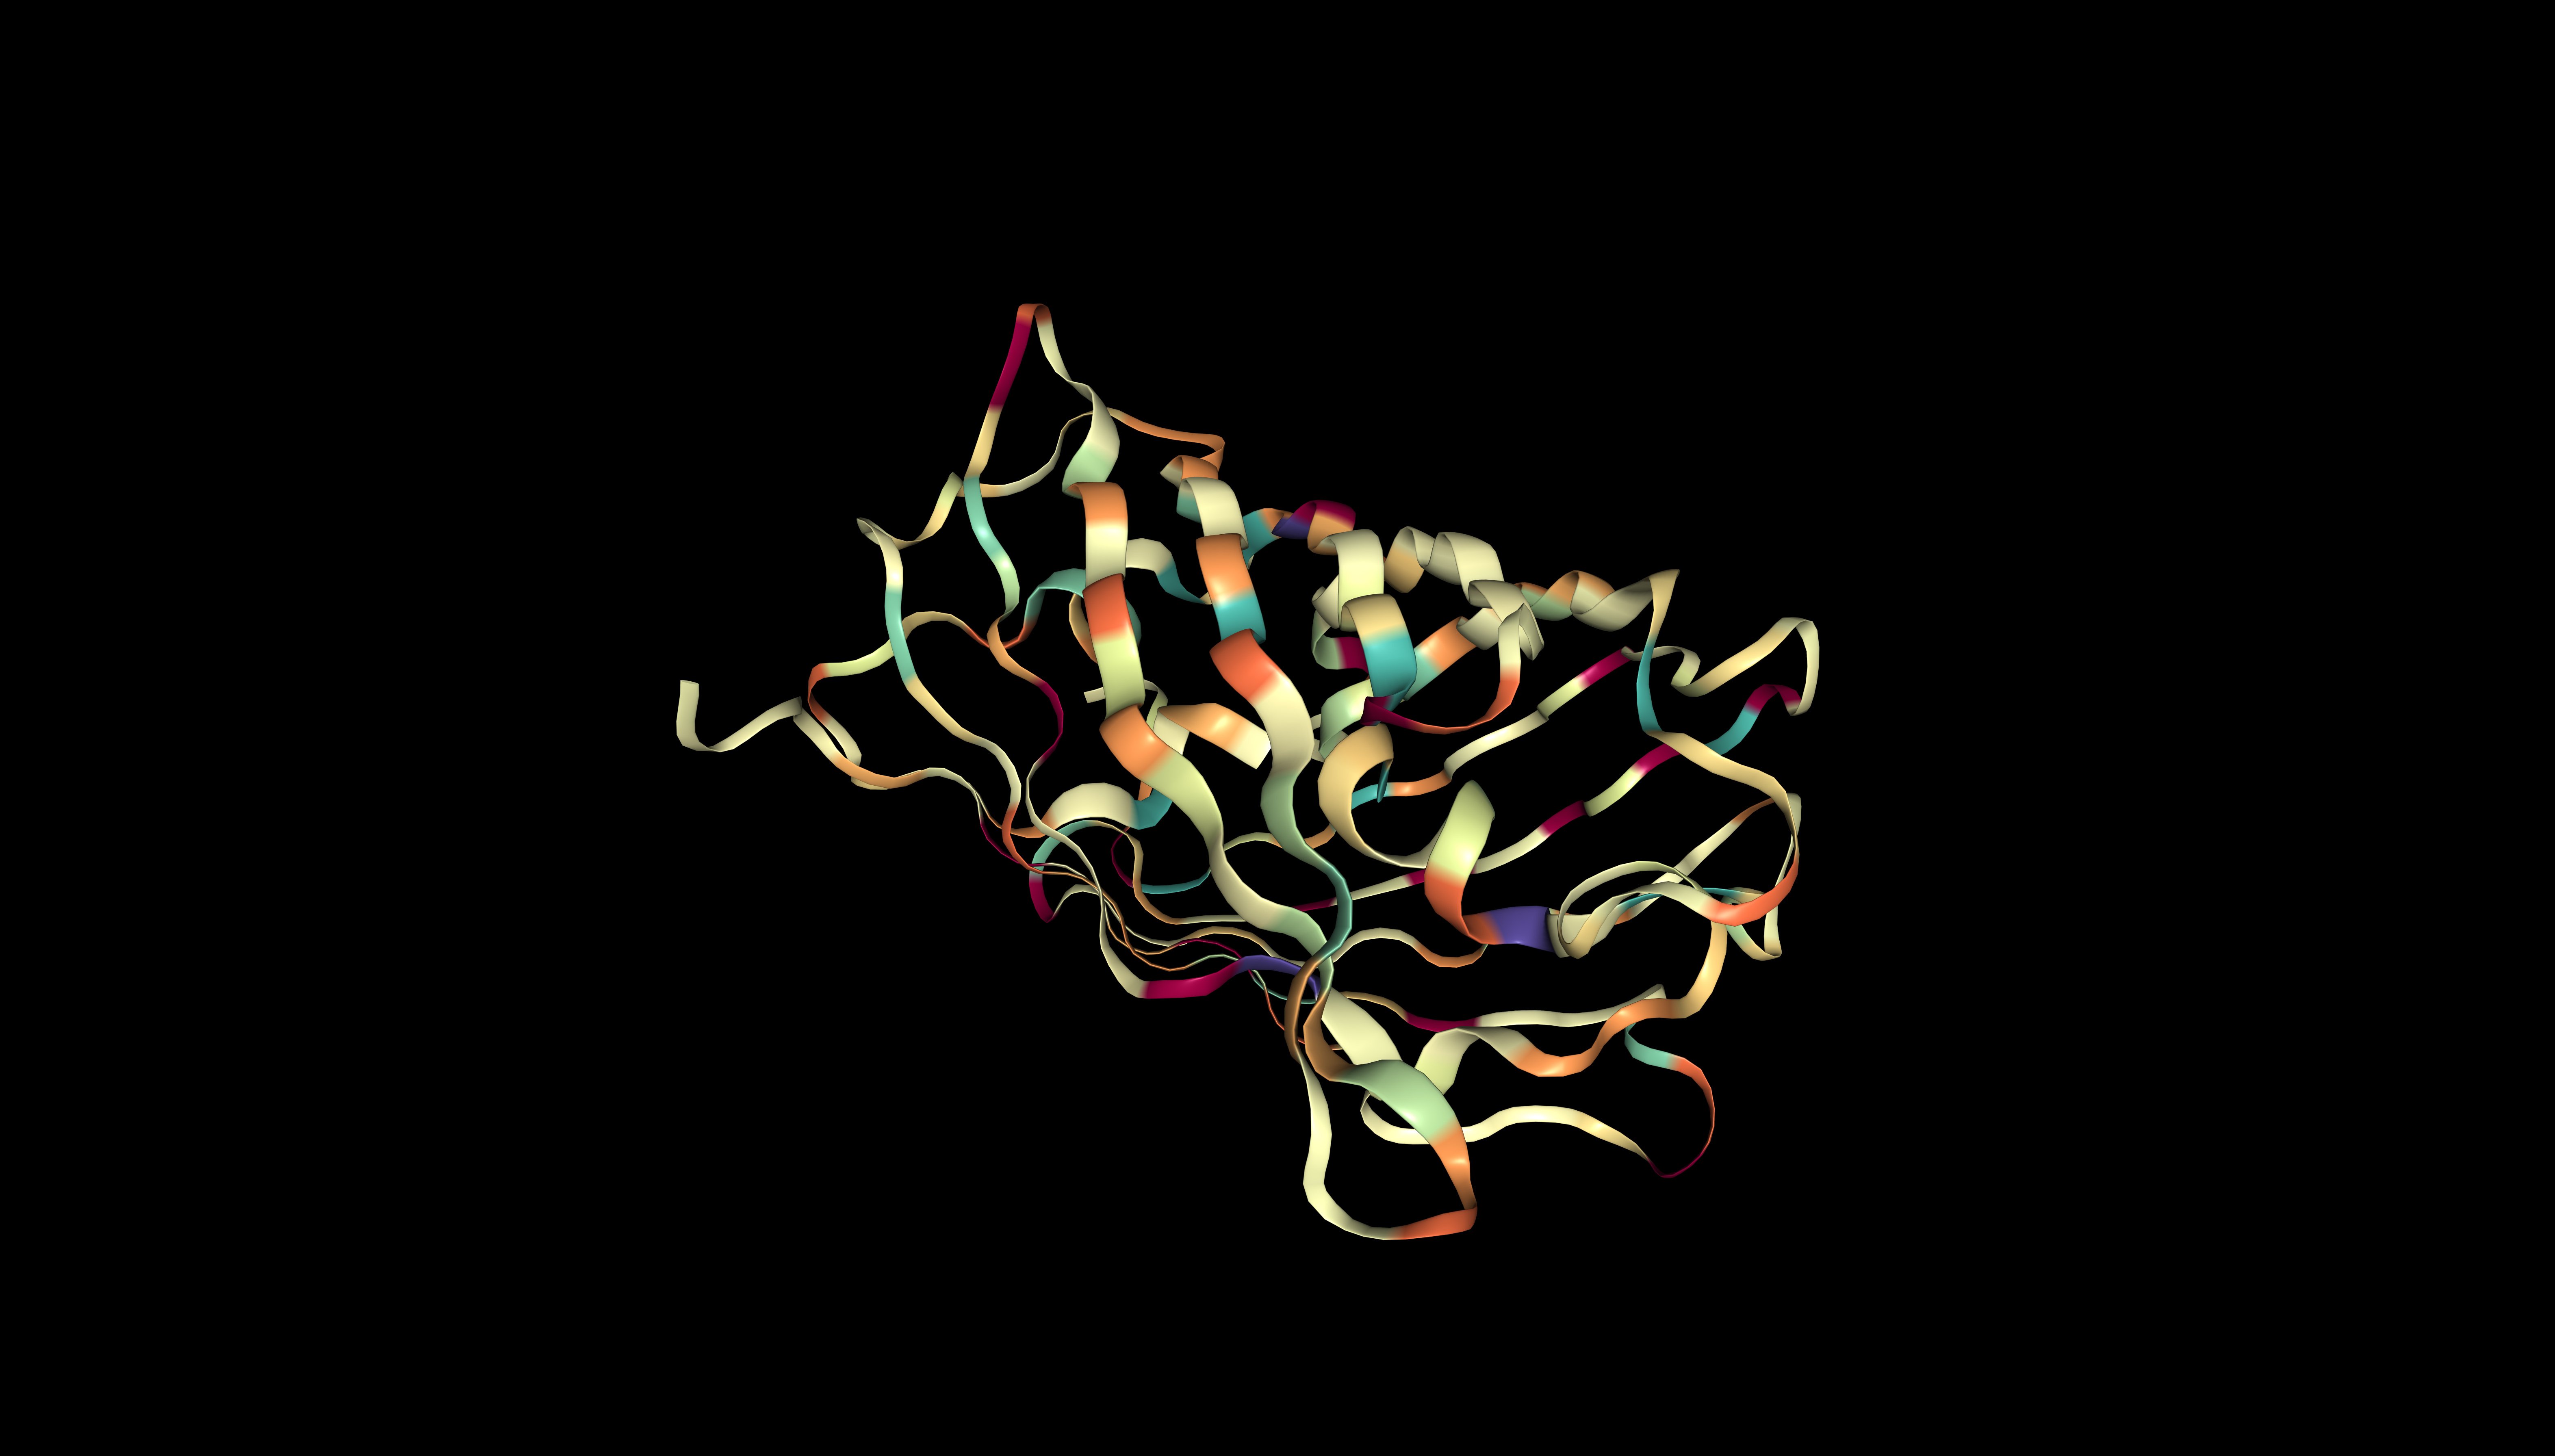
The protein contains predominantly hydrophobic residues (beige/orange), which form the hydrophobic core. Hydrophilic residues (purple, magenta, turquoise) are scarce and are likely located on the surface, ensuring the protein’s solubility.
mScarlet coloured by hydrophobicity
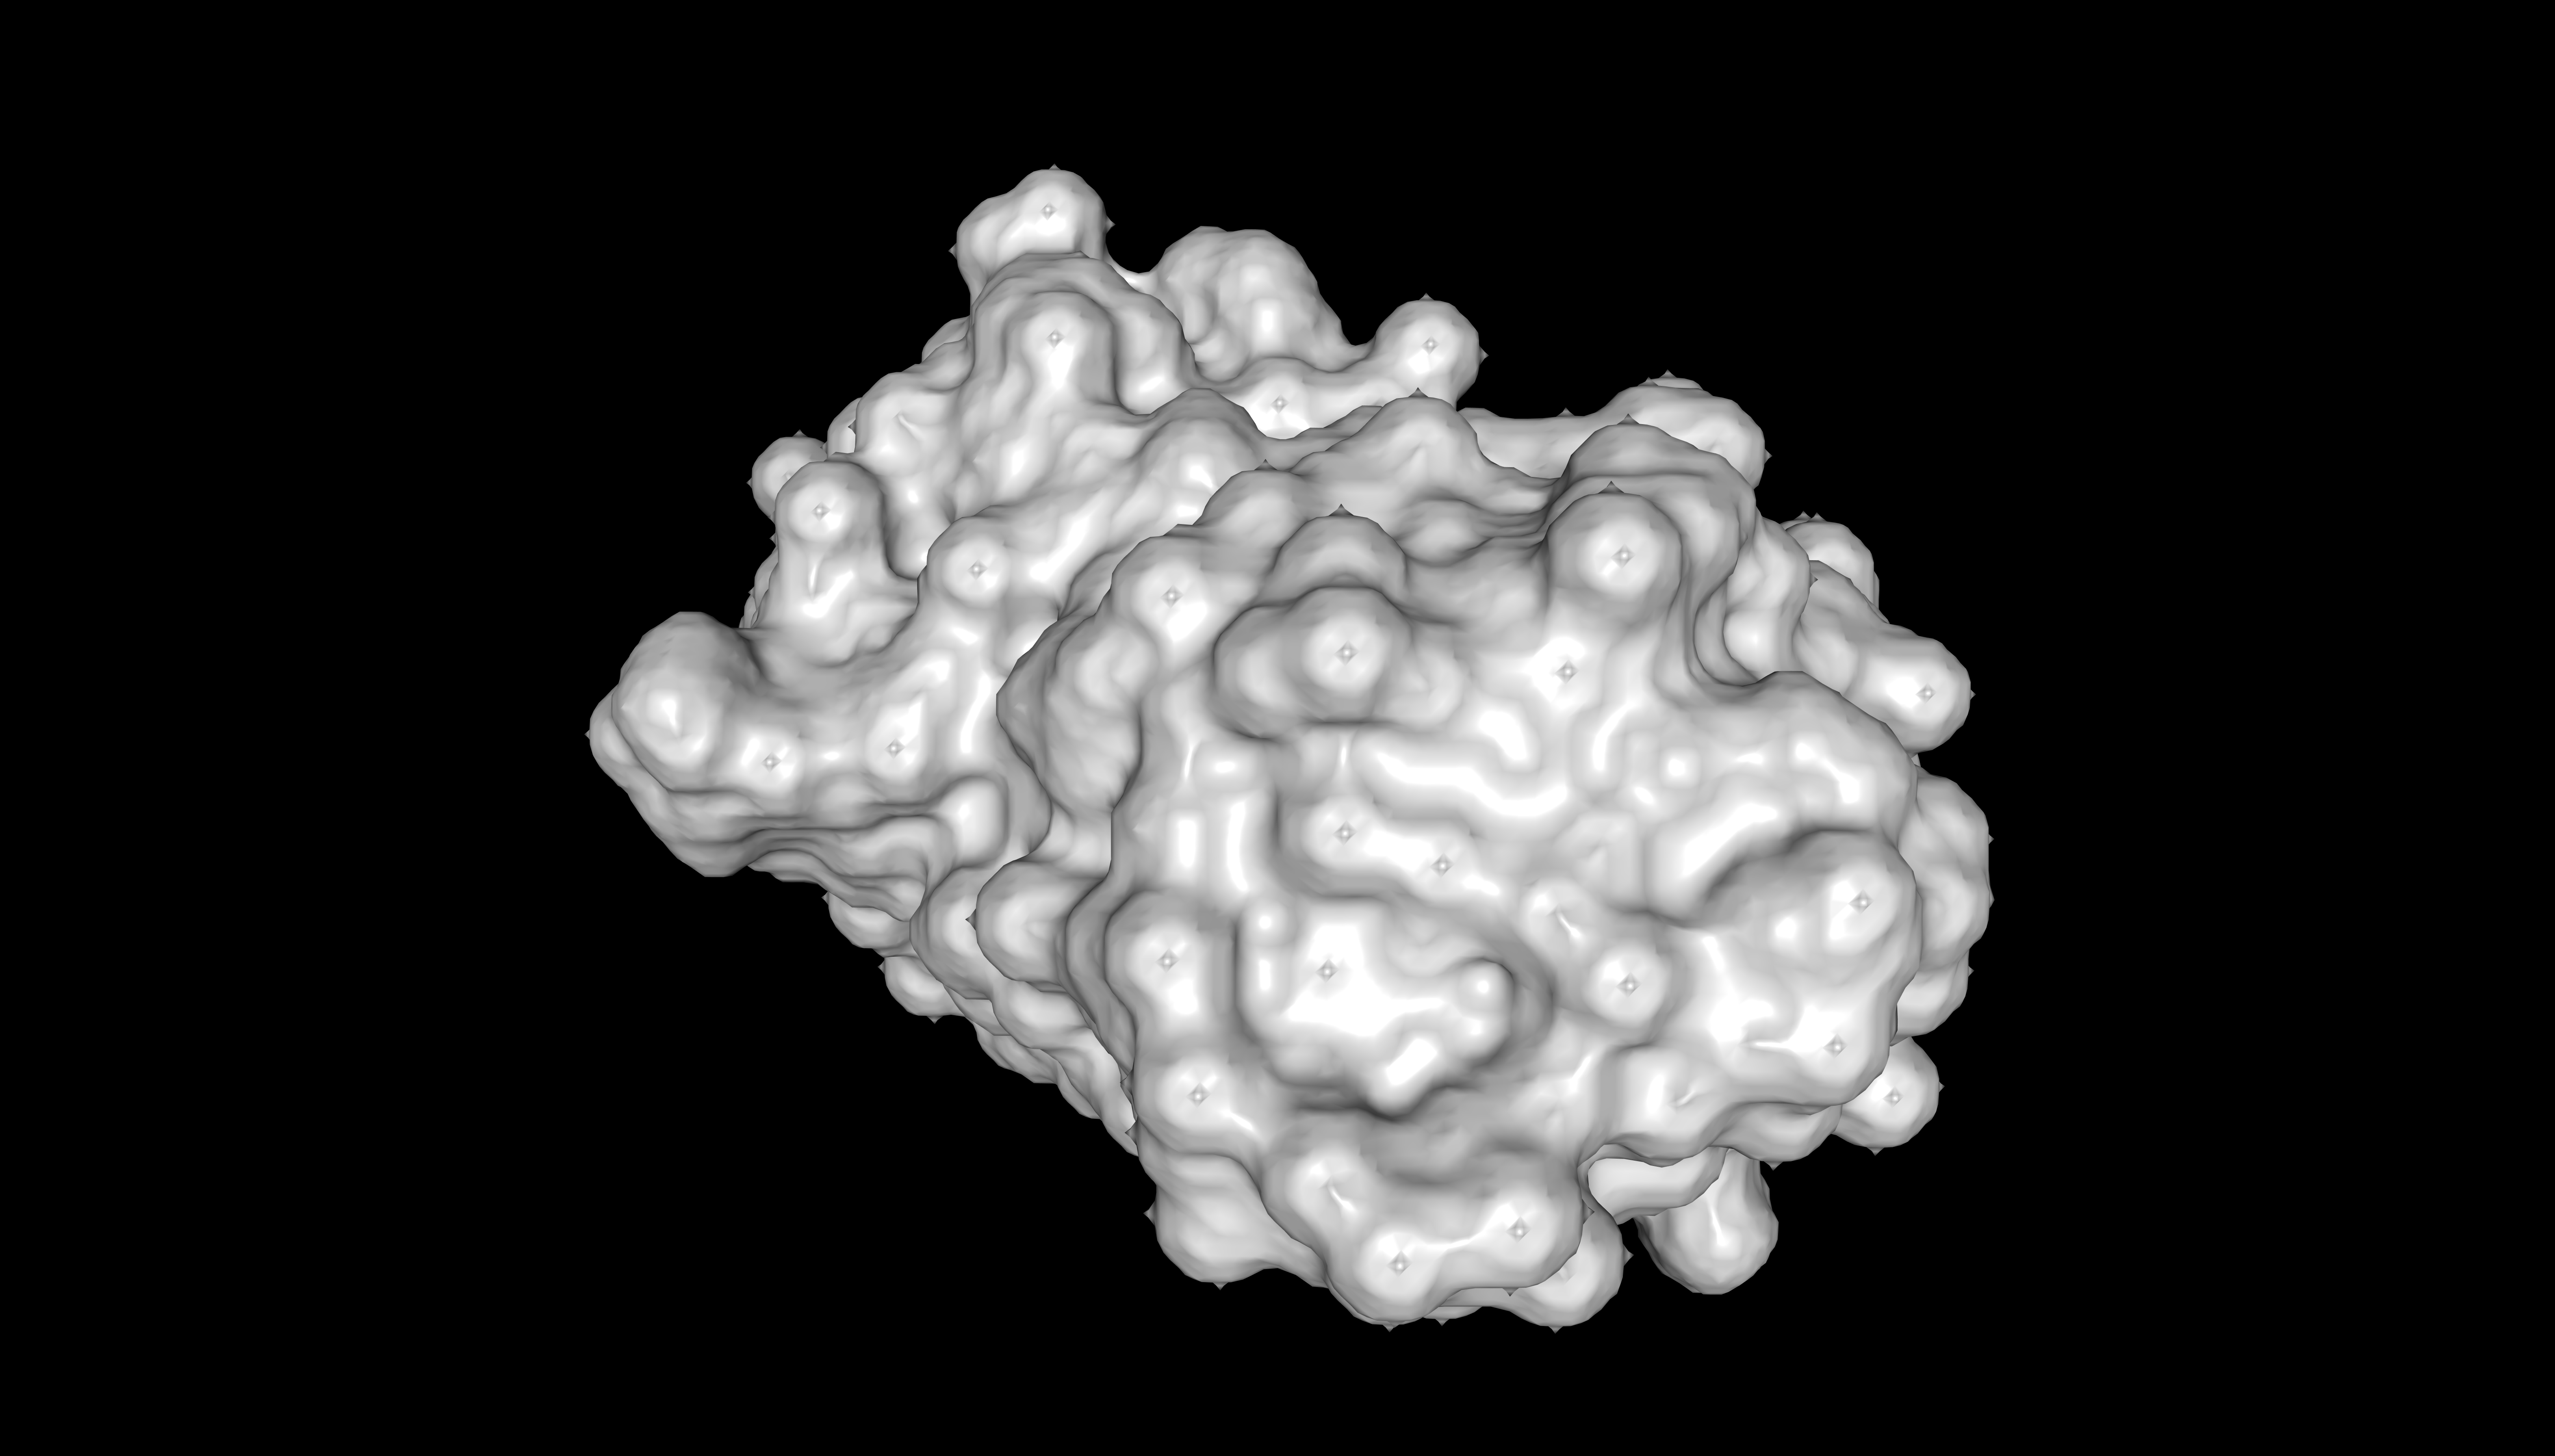
The surface of mScarlet does not contain deep holes (binding pockets). Only minor irregularities are visible.
Surface representation of mScarlet (PDB 5LK4)
Part C. Using ML-Based Protein Design Tools
C1. Protein Language Modeling
Deep Mutational Scans
a) Use ESM2 to generate an unsupervised deep mutational scan of your protein based on language model likelihoods.
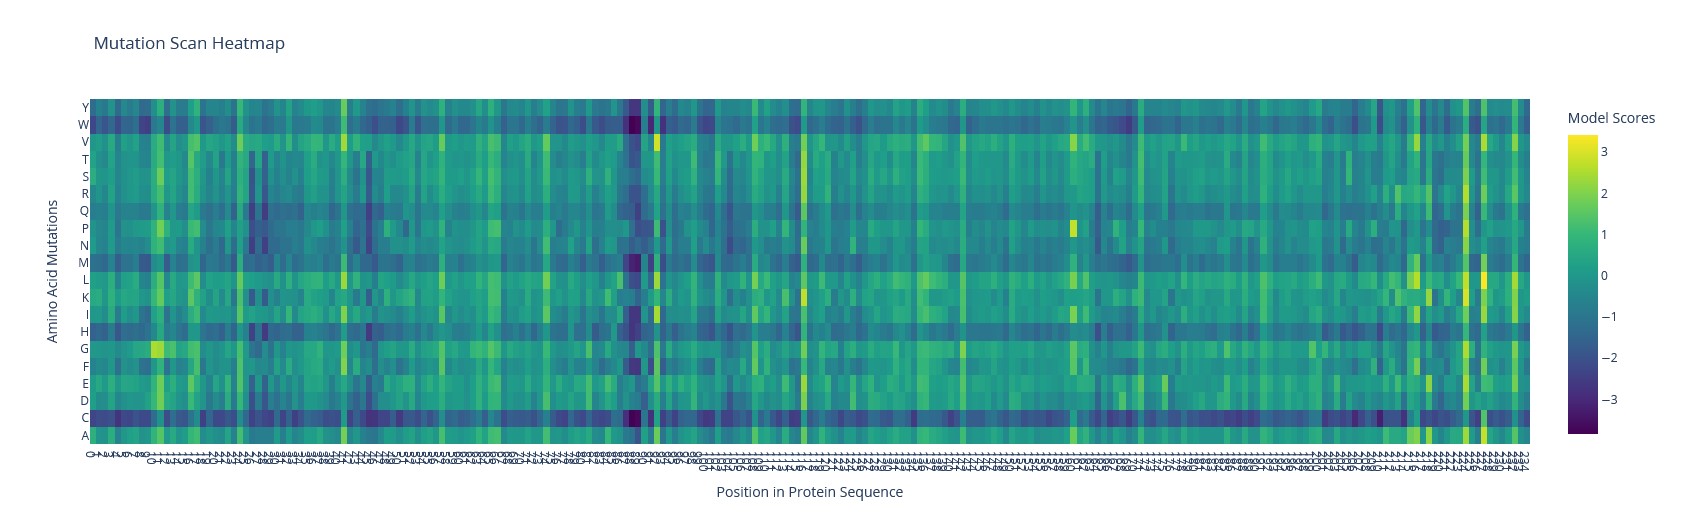
Using ESM2, I generated a mutation tolerance heatmap for mScarlet.
The brightest spot is the T74I substitution (threonine → isoleucine) – a known mutation that accelerates maturation of mScarlet-I.
Latent Space Analysis
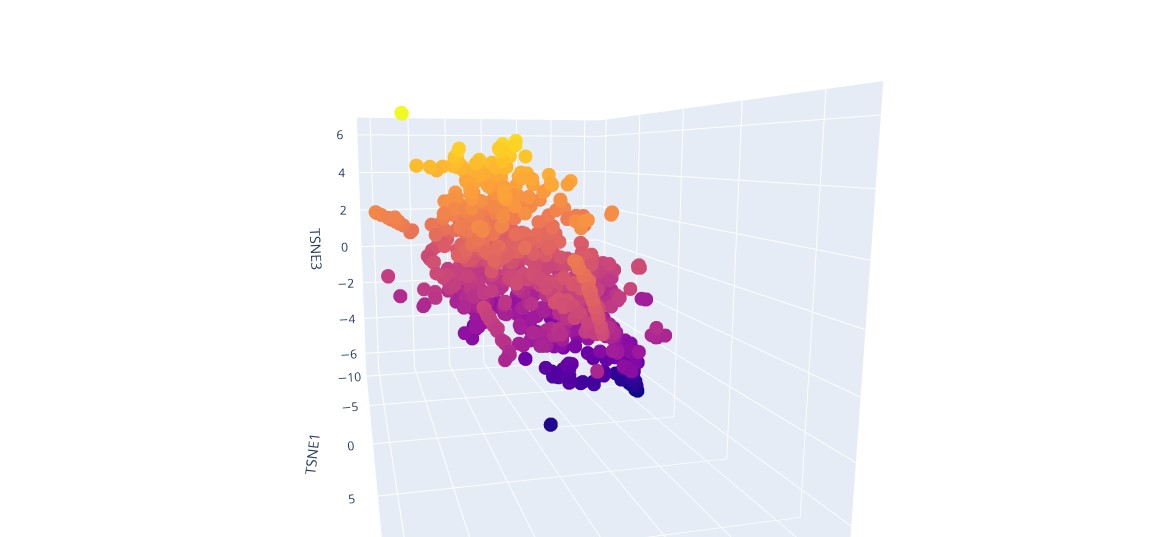
a) I built a 3D protein map using t‑SNE.
t‑SNE visualisation of proteins
b) Analyze the different formed neighborhoods: do they approximate similar proteins?
In latent space, proteins with similar sequences and structures form clusters.
c) Place your protein in the resulting map and explain its position and similarity to its neighbors.
The protein is located in the region corresponding to its structural family and clusters with homologous proteins that share similar sequence and three‑dimensional fold.
C2. Protein Folding
Folding a protein
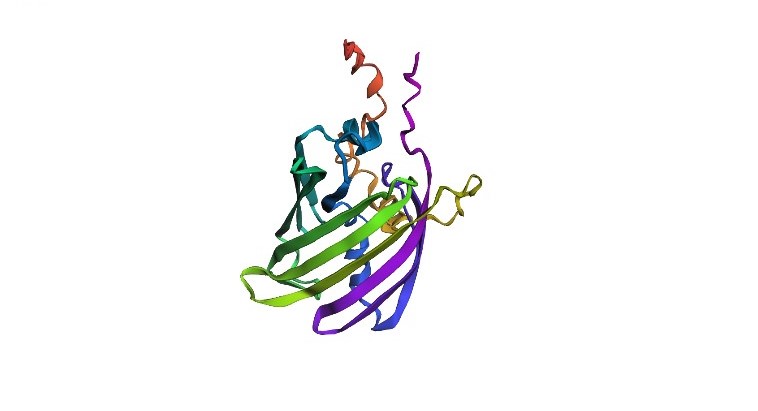
Fold your protein with ESMFold. Do the predicted coordinates match your original structure?
Using ESMFold, a structure of a 237 amino acid protein was predicted. The quality metrics are: plddt = 41.5, ptm = 0.376. These values indicate low confidence in the predicted folding: for plddt values below 70 the structure is considered unreliable. The color scheme of the structure is as follows: blue and green regions correspond to high confidence, while yellow and red regions indicate low confidence. The image shows a predominance of warm colors (orange, red), confirming low model confidence in these protein regions. The predicted coordinates are therefore unlikely to match the original (experimental) structure.
ESMFold‑predicted structure of mScarlet protein
Try changing the sequence, first try some mutations, then large segments. Is your protein structure resilient to mutations?
To test the stability of the protein structure to mutations, a segment was deleted from positions 80 to 100 in the middle of the sequence, which is likely functionally important. The pLDDT and ptm values further decreased (pLDDT = 40.9, ptm = 0.326), indicating an additional decline in model confidence and reduced structural stability. After this large mutation, the model predicted significant structural changes: there was an increase in regions with low confidence (yellow and red), and the overall structure became less stable. This indicates that the protein structure is not stable to major mutations—removing a central segment seriously affects proper folding.
Predicted structure of the mutant mScarlet protein after central segment deletion (positions 80–100)
C3. Protein Generation
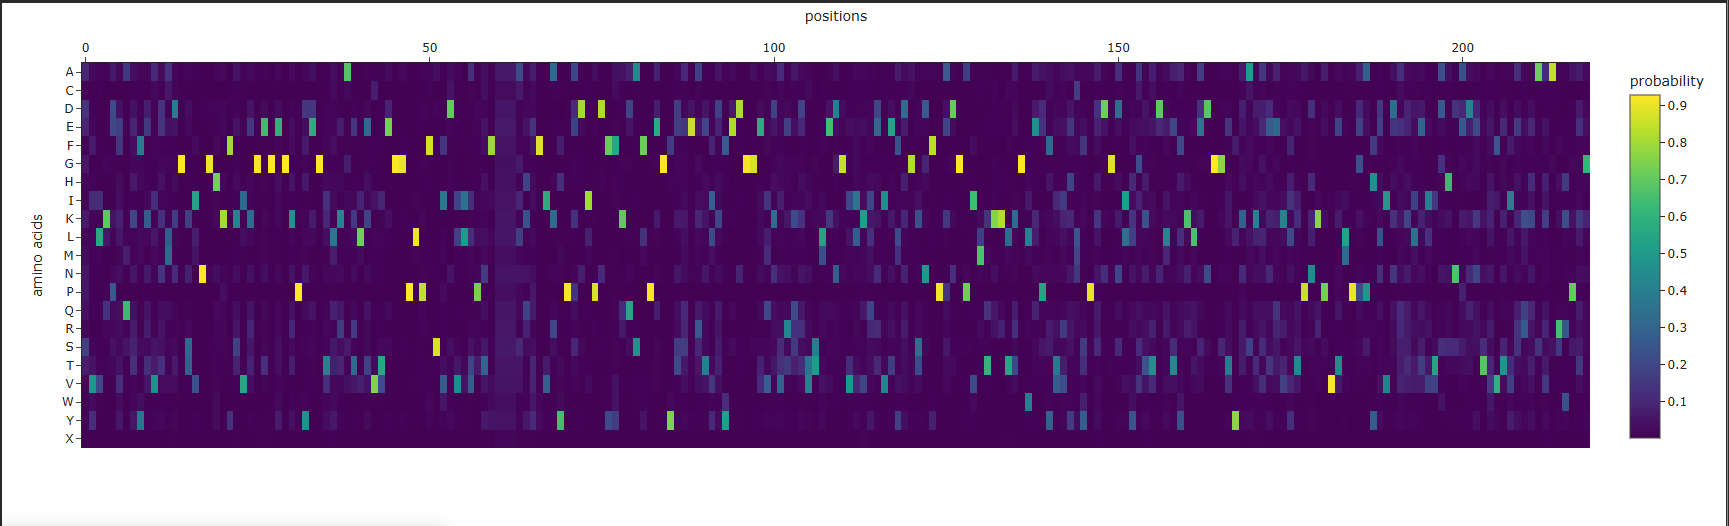
Analysis of the predicted sequence probabilities shows that, for most positions, ProteinMPNN displays a clear preference for a single amino acid (high probability), indicating structural constraints. At some positions, the probabilities are more evenly distributed among different amino acids, reflecting variability. The predicted sequence generally matches the original in high-confidence regions, but there are differences at positions with lower confidence.
Amino acid probability map for mScarlet
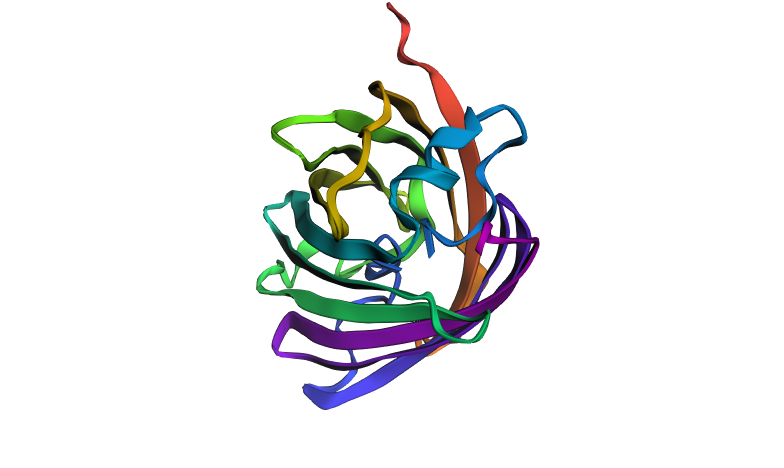
As a result of inputting the ProteinMPNN-designed sequence into ESMFold, a structure of 219 amino acids was predicted with pLDDT = 71.5 and ptm = 0.734, which is significantly higher than the original (pLDDT ~41). However, the predicted structure appears visually quite different from the original: the arrangement of secondary structure elements and the overall spatial organization have changed noticeably. This suggests that changes in the sequence led to a new fold, despite the model’s high confidence in the predicted structure.
Predicted structure of the ProteinMPNN-designed sequence using ESMFold
Part D. Group Brainstorm on Bacteriophage Engineering
Goal
Improve the thermal stability and proper folding of the MS2 phage lysis protein L, with the aim of increasing phage burst size and overall production titer. A more stable lysis protein will function more efficiently, leading to synchronized and effective bacterial lysis, and thus higher phage yield.
Tools
Protein Language Models (pLMs) for in silico mutagenesis, specifically ESM2 (as used in the previous assignment) to perform deep mutational scanning of the L protein.
AlphaFold‑Multimer to validate that the selected mutations do not disrupt the L‑DnaJ chaperone complex, which is essential for the lysis function.
Yeast surface display for high‑throughput experimental screening of the most promising variants from the computational library.
Why these tools can help solve the chosen task
ESM2 learns evolutionary constraints from millions of protein sequences. It can predict which single‑amino‑acid substitutions are likely tolerated or even beneficial for stability without any experimental data. This allows us to rapidly filter thousands of mutations in silico.
AlphaFold‑Multimer can model the 3D structure of the L‑DnaJ complex. Even if direct interaction evidence is not fully established, the model can flag mutations that would disrupt binding, saving us from testing non‑functional variants experimentally.
Yeast display is a powerful, established method to screen libraries of protein variants (100 to 10⁶ members) for increased stability. It directly couples protein stability to a fluorescence readout, enabling selection of the best designs.
Potential challenges
Lack of training data for phage‑bacteria interactions. AlphaFold‑Multimer may give unreliable predictions for the L‑DnaJ complex if no similar complexes are present in its training set. The direct interaction between L and DnaJ has not been strictly proven, adding uncertainty.
Unpredicted in vivo behaviour. Mutations that stabilise the protein in a test tube (e.g., on the yeast surface) might not translate to the complex intracellular environment of E. coli. For example, the protein might become too stable and resist timely degradation, disrupting the delicate timing of lysis.
Workflow of L‑protein design
Week 5 HW: Protein Design Part II
Part A: SOD1 Binder Peptide Design (From Pranam)
Part 1: Generate Binders with PepMLM
The amino acid sequence of the human SOD1 protein was taken from the UniProt database (ID: P00441), and the A4V mutation was introduced.
Amino acid sequence of the human SOD1 protein from UniProt (ID: P00441):
Four peptides of 12 amino acids in length were generated based on the mutant SOD1 gene sequence.
The SOD1‑binding peptide FLYRWLPSRRGG was added to the generated list.
PepMLM successfully generated four candidate peptides for binding to the SOD1 A4V mutant.
index
Binder
Pseudo Perplexity
1
HLYYPAALRHKX
13.094736350750331
2
HRYVAAXLRWKE
21.045882766316033
3
HLYPAAAIELKX
11.060795760122568
4
WLYPVVXVEWKX
17.854789099765938
5
FLYWRLPSRRGG
19.011551773463413
The pseudo‑perplexity values (from 11.06 to 21.05) are comparable to the known peptide FLYWRLPSRRGG (19.01), and the best candidate, HLYPAAAIELKX, shows the highest predicted affinity (11.06).
Part 2: Evaluate Binders with AlphaFold3
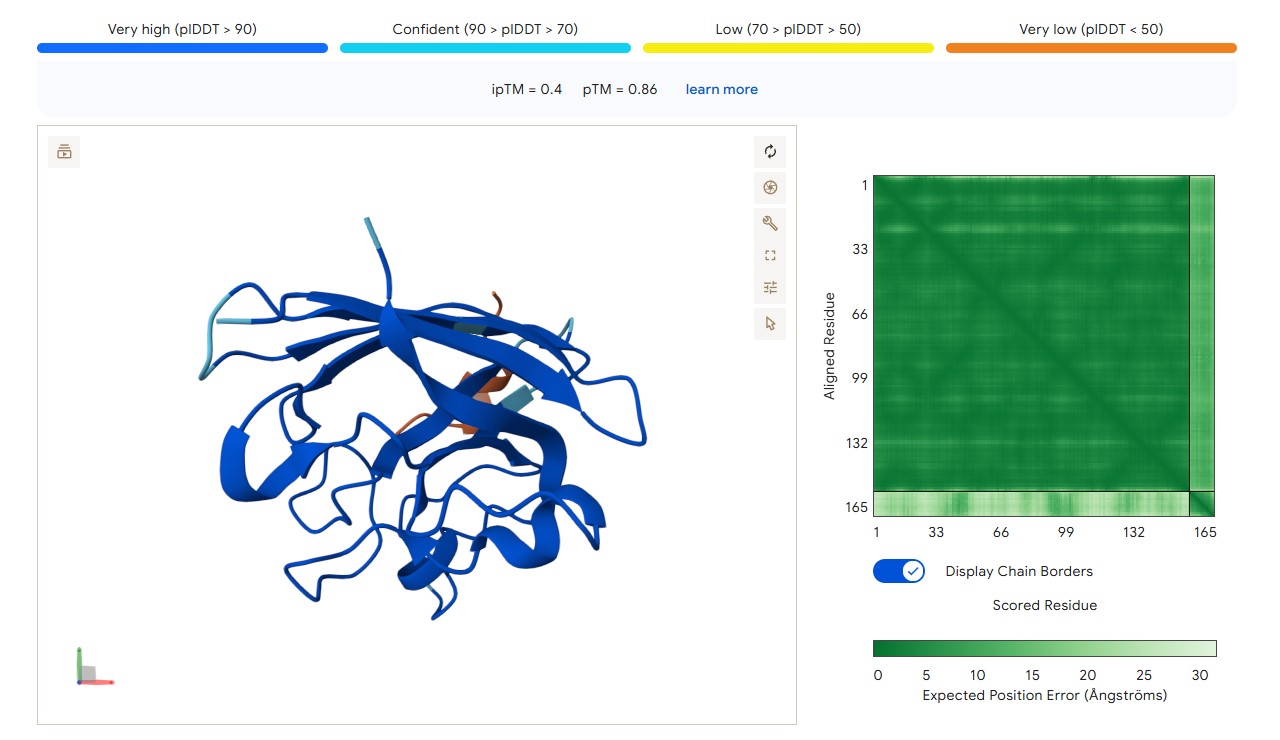
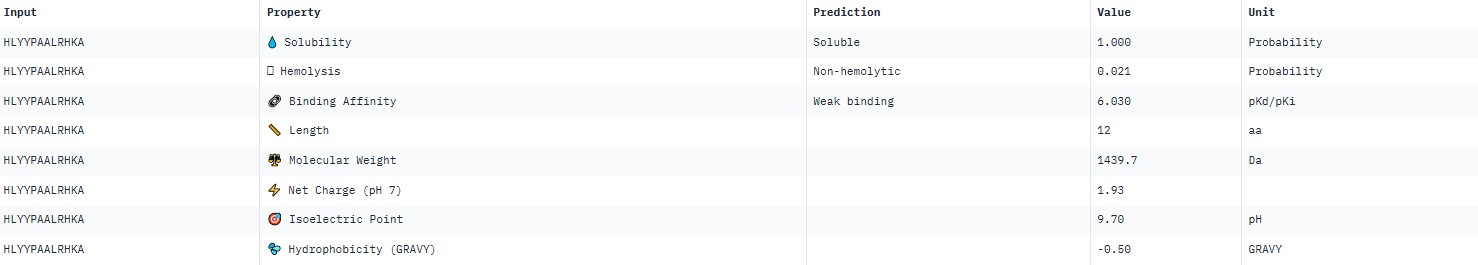
For peptide HLYYPAALRHKA (where the undefined position X was replaced by alanine), AlphaFold predicted a complex with SOD1 A4V giving ipTM = 0.4, which indicates low prediction confidence. The peptide likely does not bind specifically; visually it appears to be located on the protein surface, without interacting with the N‑terminal region containing the A4V mutation, the dimer interface or the β‑barrel region. This candidate underperforms expectations and does not surpass the known peptide (modelling of the latter is needed for direct comparison).
protein-peptide complex SOD1 A4V + HLYYPAALRHKA
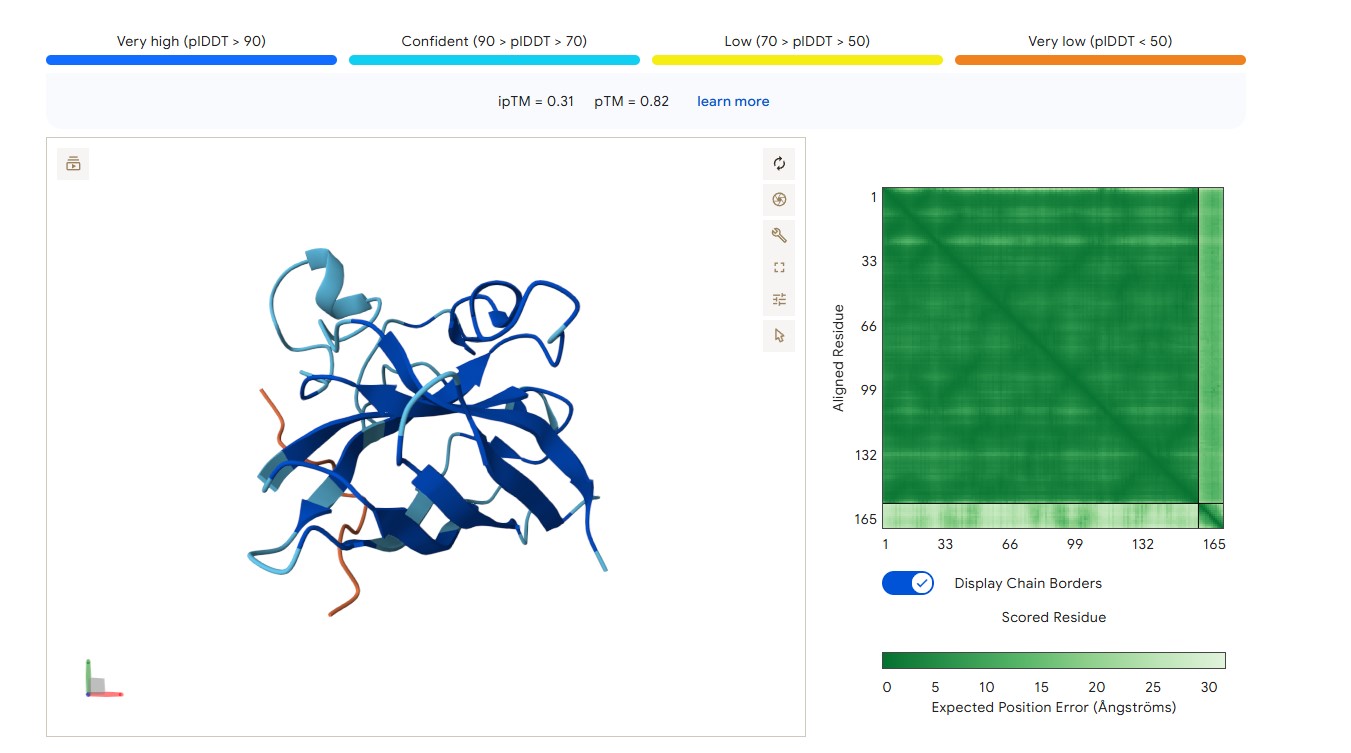
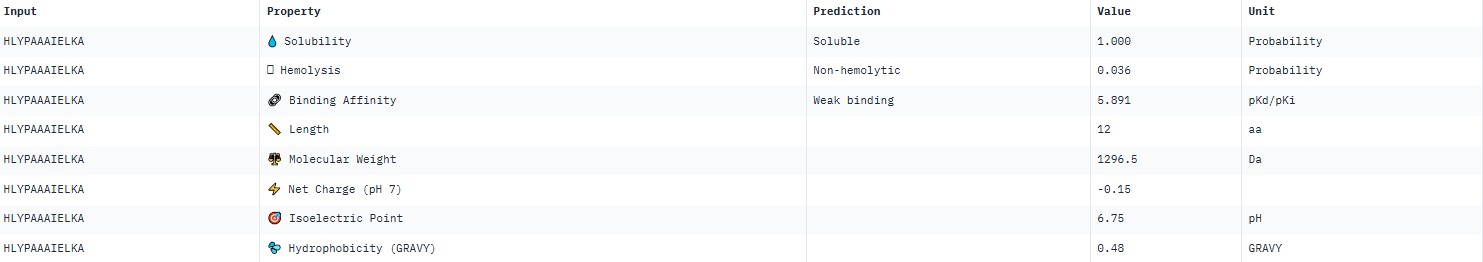
For peptide HLYPAAAIELKA (where the undefined position X was replaced by alanine), AlphaFold predicted a complex with SOD1 A4V giving ipTM = 0.31, which indicates very low prediction confidence (well below the 0.7 threshold). The peptide likely does not bind specifically; visually it appears to be located on the protein surface, without interacting with the N‑terminal region (where the A4V mutation resides), the dimer interface or the β‑barrel region.
protein-peptide complex SOD1 A4V + HLYPAAAIELKA
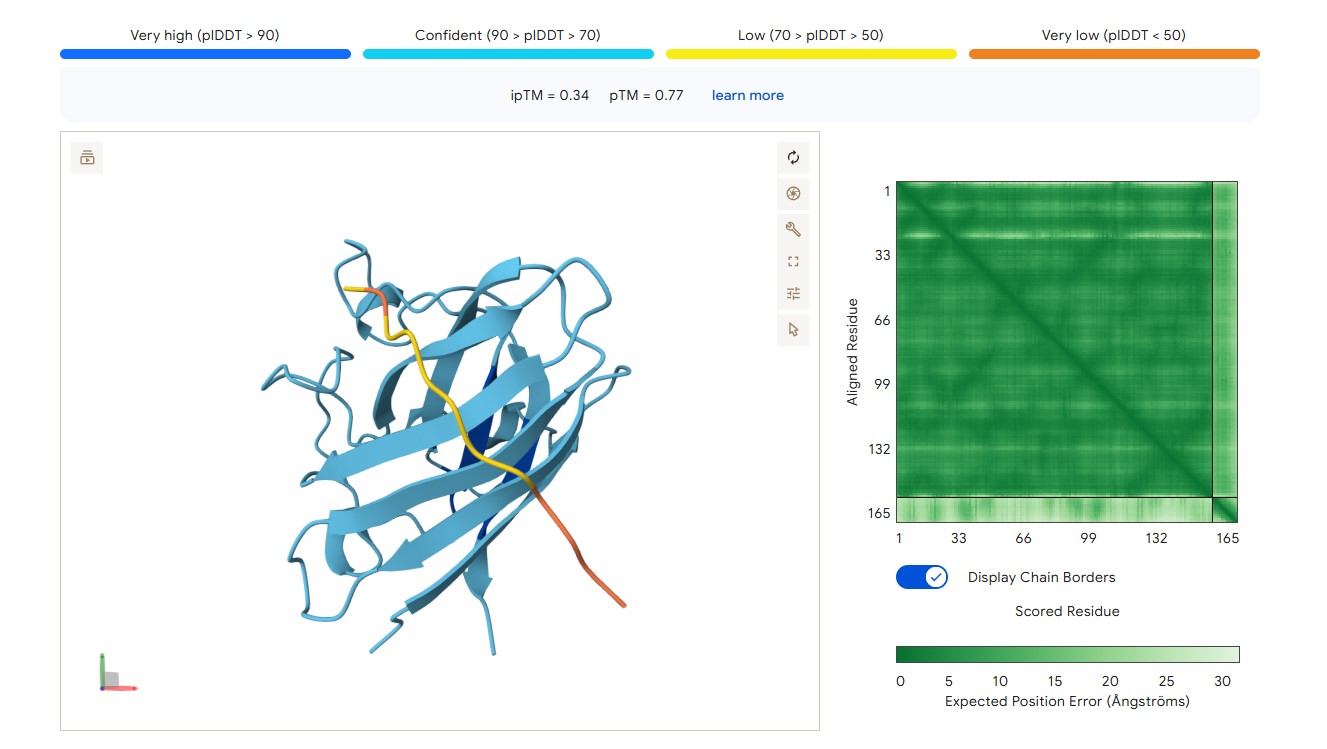
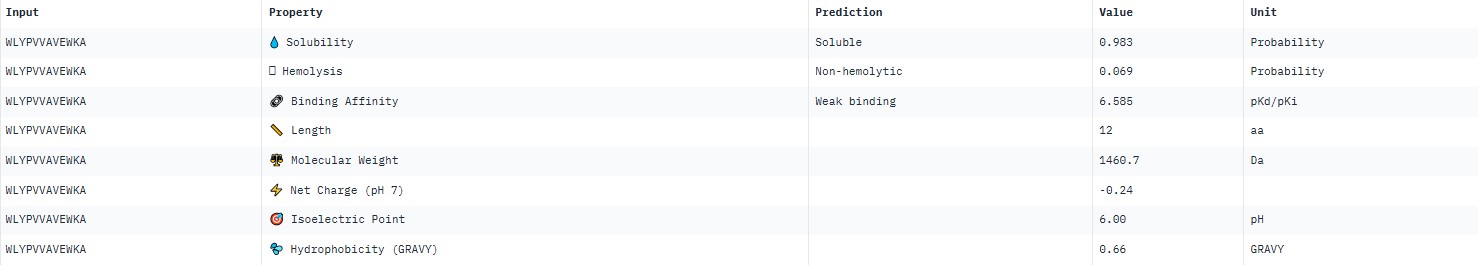
For peptide WLYPVVAVEWKA (where the undefined position X was replaced by alanine), AlphaFold predicted a complex with SOD1 A4V giving ipTM = 0.34, which indicates very low prediction confidence (well below the 0.7 threshold). The peptide likely does not bind specifically; visually it appears to be located on the protein surface, without interacting with the N‑terminal region (where the A4V mutation resides), the dimer interface or the β‑barrel region.
protein-peptide complex SOD1 A4V + WLYPVVAVEWKA
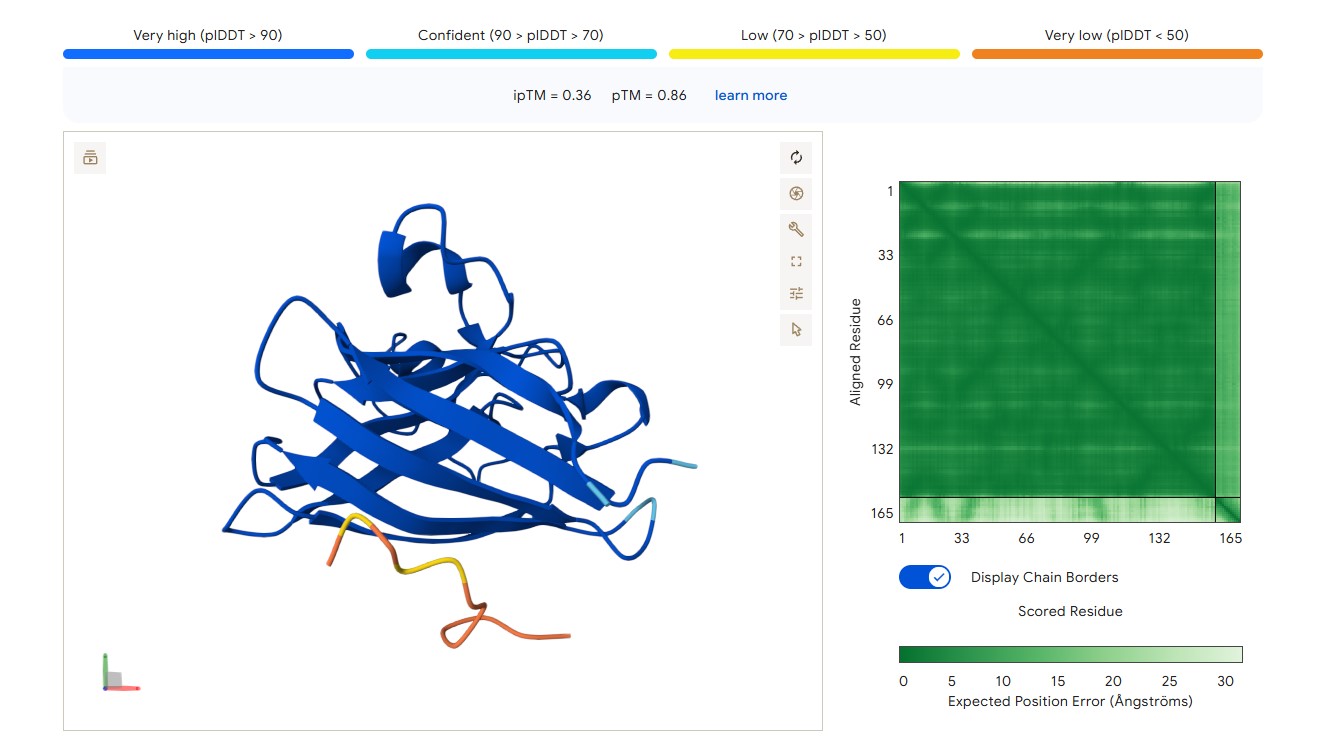
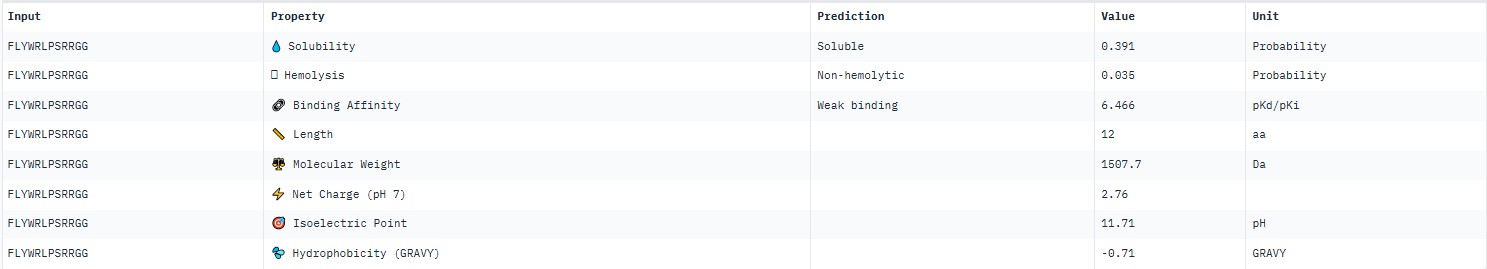
For the known peptide FLYWRLPSRRGG, AlphaFold predicted a complex with the SOD1 A4V mutant giving ipTM = 0.36, which indicates very low prediction confidence (well below the 0.7 threshold). The peptide likely does not bind specifically; visually it appears to be located on the protein surface, without interacting with the N‑terminal region (where the A4V mutation resides), the dimer interface or the β‑barrel region.
protein-peptide complex SOD1 A4V + FLYWRLPSRRGG
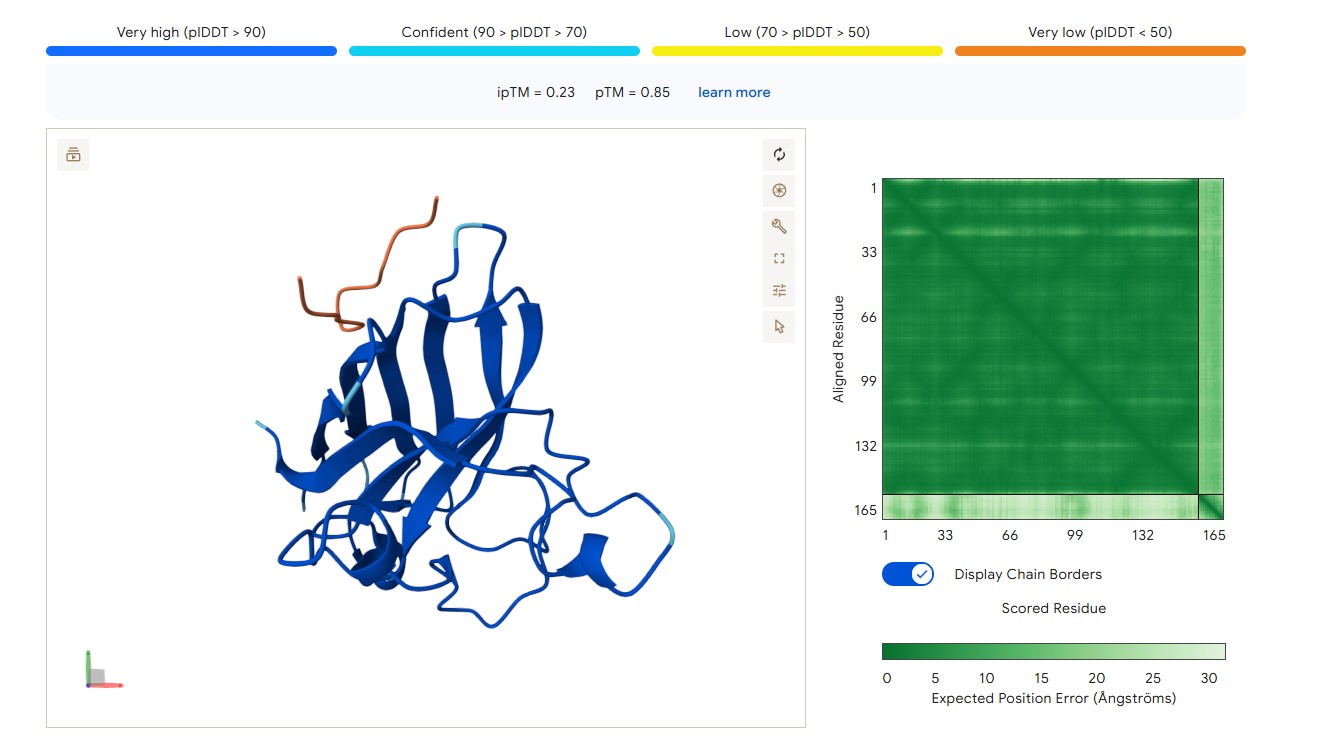
For peptide HRYVAAALRWKE (where the undefined position X was replaced by alanine), AlphaFold predicted a complex with SOD1 A4V giving ipTM = 0.23, which indicates very low prediction confidence (well below the 0.7 threshold). The peptide likely does not bind specifically; visually it appears to be located on the protein surface, without interacting with the N‑terminal region (where the A4V mutation resides), the dimer interface or the β‑barrel region.
protein-peptide complex SOD1 A4V + HRYVAAALRWKE
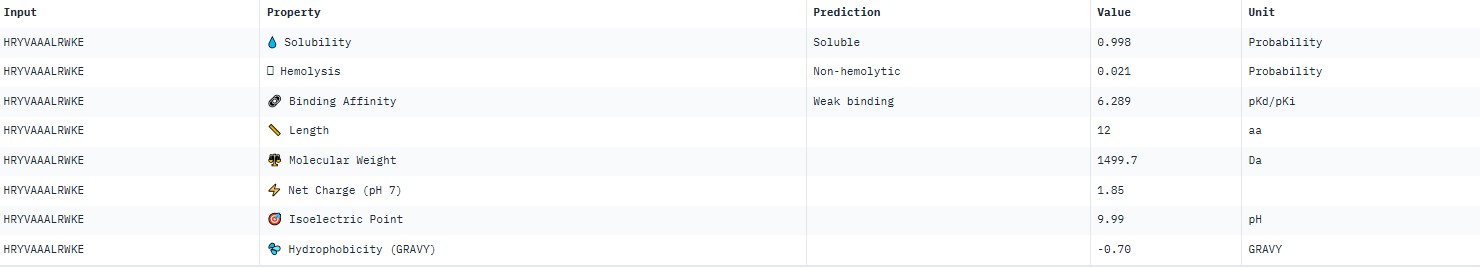
Part 3: Evaluate Properties of Generated Peptides in the PeptiVerse
AlphaFold3 gave very low ipTM values (<0.7) for all peptides, indicating a lack of confidence in specific binding. The highest ipTM (0.40) was for peptide HLYYPAALRHKA, and the lowest (0.23) for HRYVAAALRWKE.
PeptiVerse predicted “weak binding” for all peptides, with pKd values in a narrow range of 5.89–6.59. The highest affinity (6.585) was for WLYPVVAVEWKA, and the lowest (5.891) for HLYPAAAIELKA.
Hemolysis and solubility: all peptides were predicted to be non-hemolytic (probability <0.07) and soluble (probability >0.39). Even the lowest solubility value for FLYWRLPSRRGG (0.391) still falls into the “soluble” category. Thus, among these weak binders, there are neither hemolytic nor poorly soluble peptides – all of them have good therapeutic profiles in these parameters.
Although all peptides bind weakly, WLYPVVAVEWKA shows the highest predicted affinity (6.585) together with excellent solubility (0.993) and low hemolysis (0.069). According to the PeptiVerse data, it is the best candidate. However, AlphaFold3 does not confirm specific binding (ipTM=0.34). If relying on PeptiVerse, this peptide is the best.
Part 4: Generate Optimized Peptides with moPPIt
In moPPIt, the mutant SOD1 A4V sequence was pasted, the motif (residues 1–10, the N‑terminus containing the A4V mutation) was selected, peptide length was set to 12 amino acids, and guidance for motif, affinity, solubility and hemolysis was enabled. Five candidate peptides were generated.
№
Peptide
Hemolysis
Solubility
Affinity
Motif
1
CTGGLPVGVGAA
0.0445
0.9808
6.2601
0.5489
2
ADPEFAAPSCTH
0.0279
1.0000
5.9598
0.5326
3
ESEKQCVKTHFT
0.0483
1.0000
6.0218
0.5422
4
MAAGIFKKQKQK
0.0145
1.0000
5.5228
0.6357
5
QEPCEELQFNHF
0.0245
1.0000
6.2746
0.5575
All candidates show low hemolysis (<0.05) and high solubility (>0.98). The best affinity is observed for QEPCEELQFNHF (6.27) and CTGGLPVGVGAA (6.26). Compared to PepMLM, moPPIt peptides are preferable for further development due to their targeted design and consideration of safety.
Part C: Final Project: L-Protein Mutants
Mu2 (F60W, L64I)
The mutation was selected to accelerate lysis: replacing phenylalanine with tryptophan (F60W) increases the hydrophobicity of the transmembrane helix, while replacing leucine with isoleucine (L64I) increases helix rigidity, promoting faster oligomerization and pore formation. This shortens the window for bacteria to develop resistance.
Rationale: Tryptophan increases hydrophobicity and membrane stability; replacing leucine with isoleucine makes the alpha helix more rigid, accelerating oligomerization and pore formation. Faster lysis leaves less time for resistance to emerge.
Full sequence:
METRFPQQSQQTPASTNRRRPFKHEDYPCRRQQRSSTLYVLIFLAIFLSKWNQILILLSLLEAVIRTVTLLQLLT
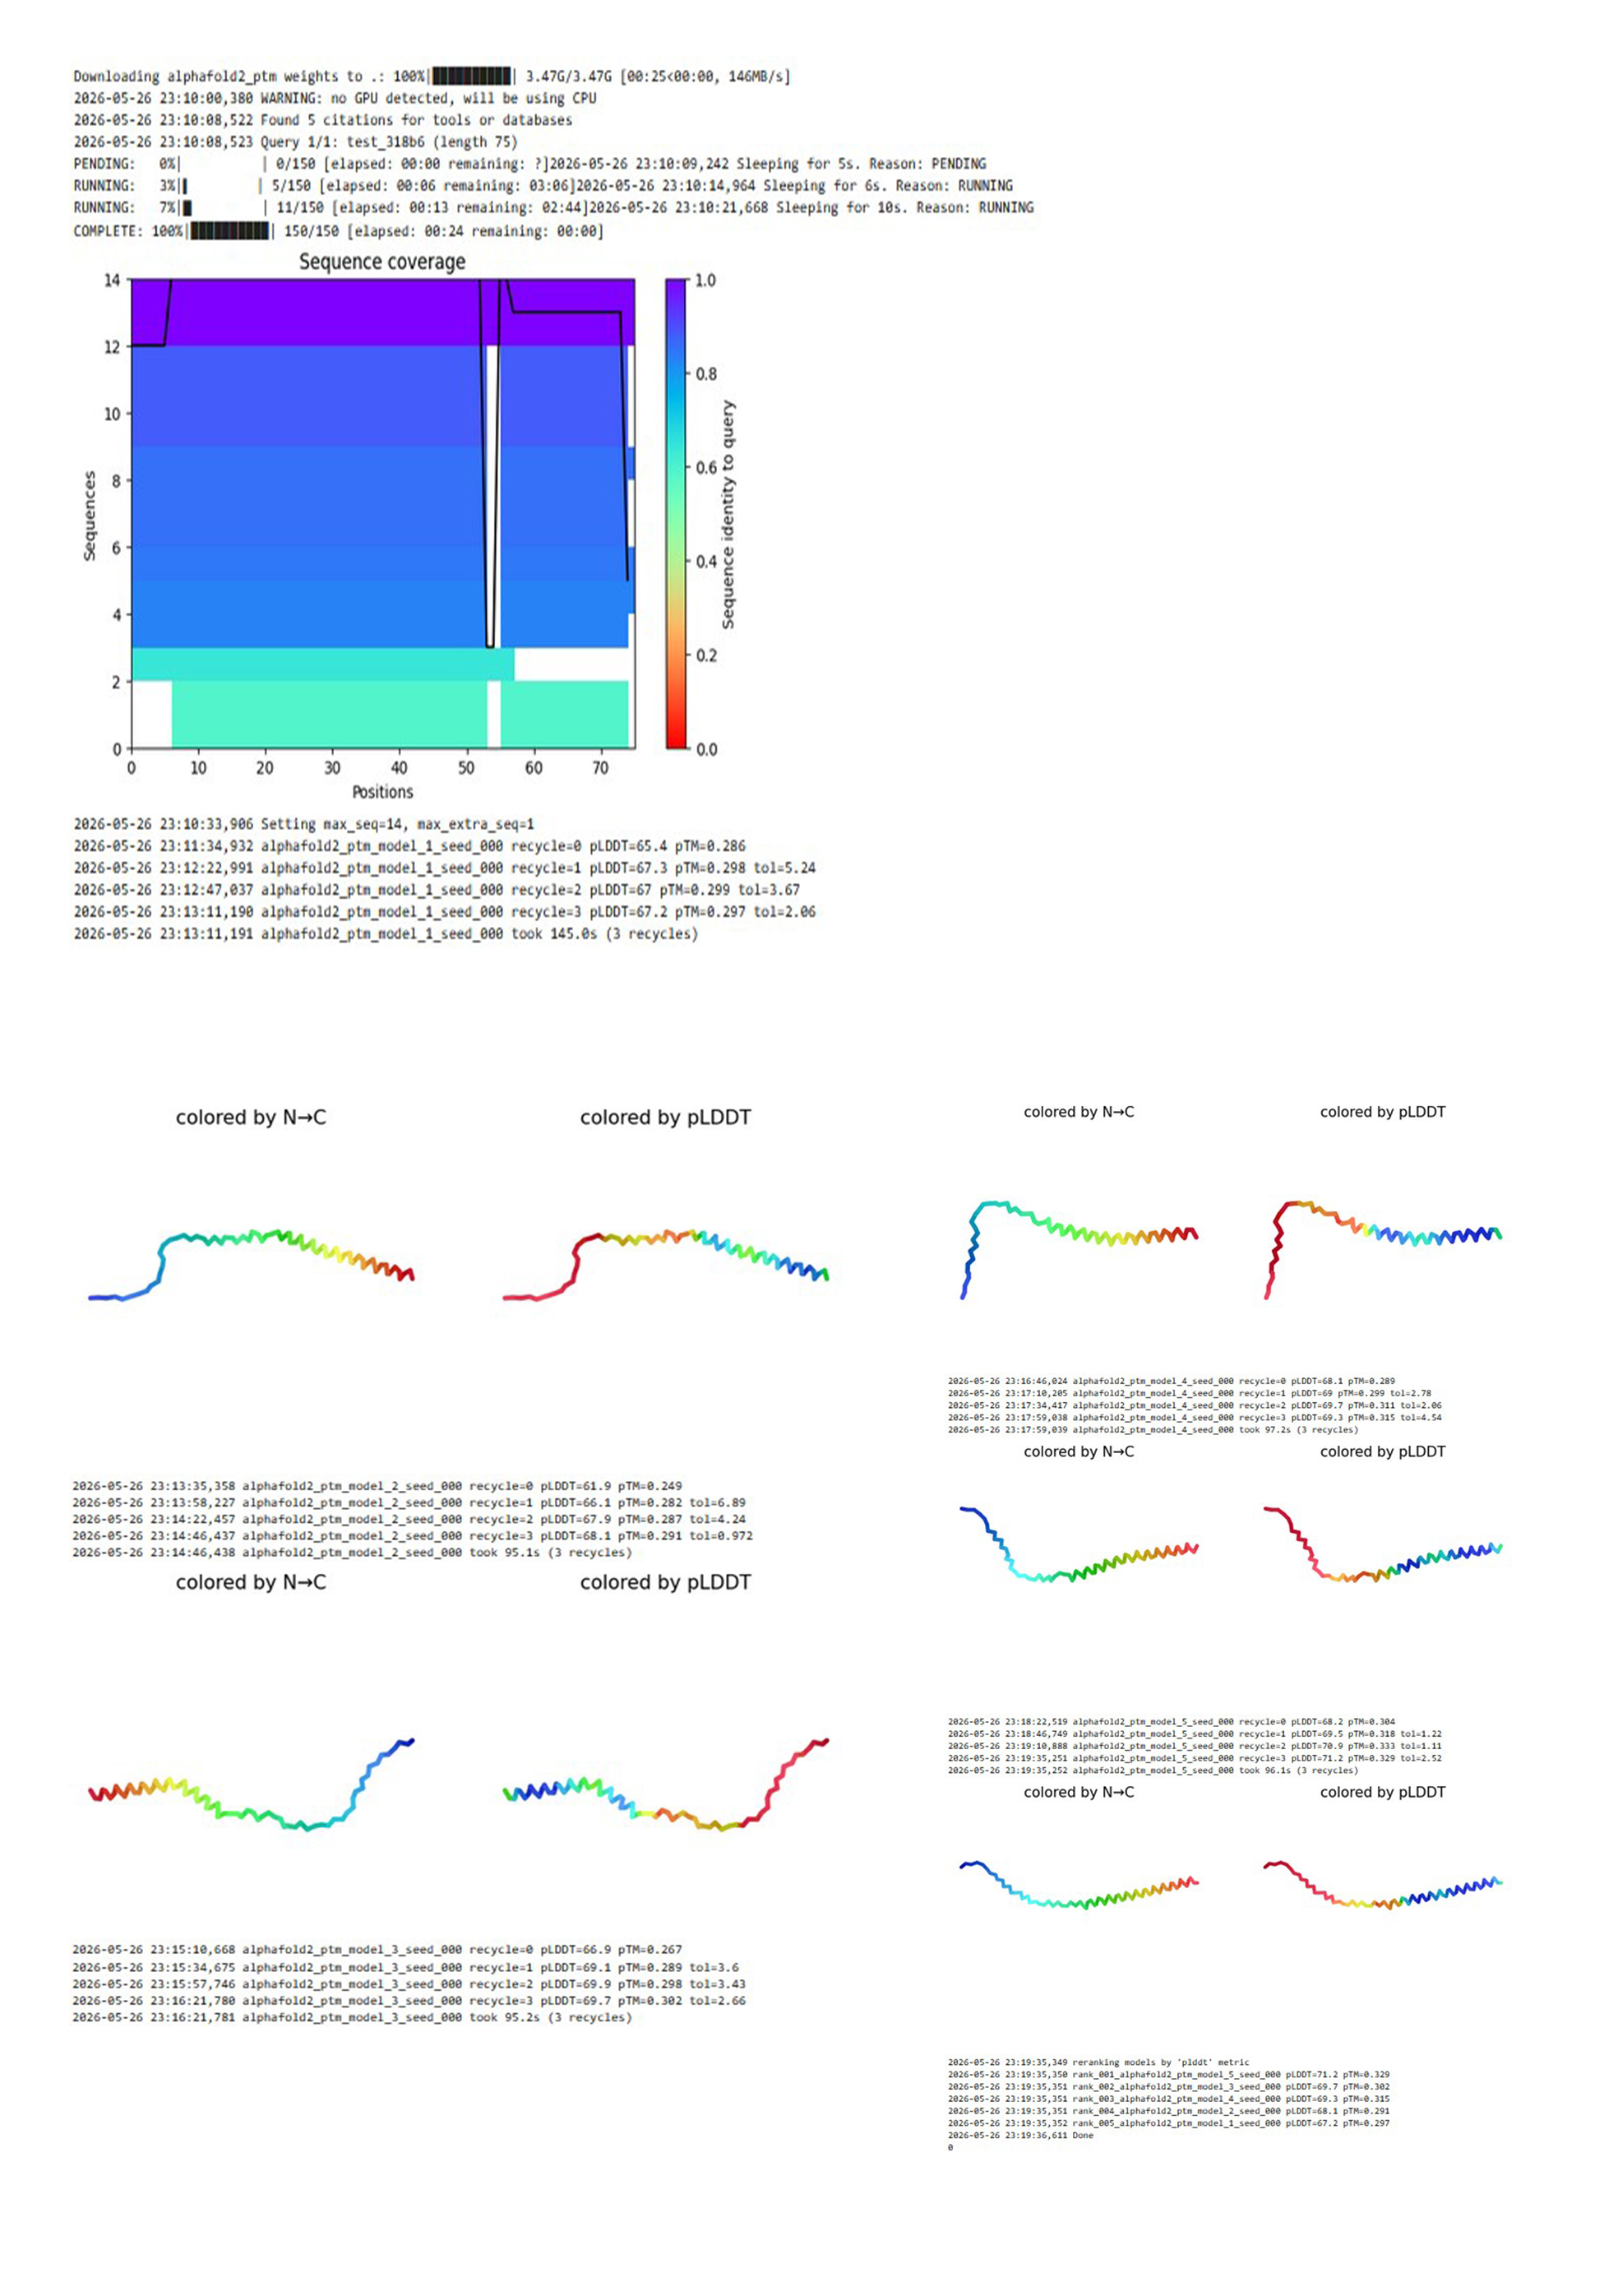
The mutant Mu2 sequence was submitted to ColabFold (AlphaFold2). The program performed homology search (MMseqs2), predicted 5 structural models, and ranked them by pLDDT.
ColabFold results for the Mu2 mutant (F60W, L64I)
AlphaFold2 predicted 5 independent models of the protein structure. After ranking by confidence (pLDDT), the best model, model_5, showed pLDDT = 71.2 and pTM = 0.329.
A low pTM (<0.5) indicates poor global reliability of the prediction. This is typical for small membrane proteins. Nevertheless, the pLDDT value of 71.2 suggests acceptable local confidence (e.g., for the transmembrane helix). The model does not show complete disruption of the structure.
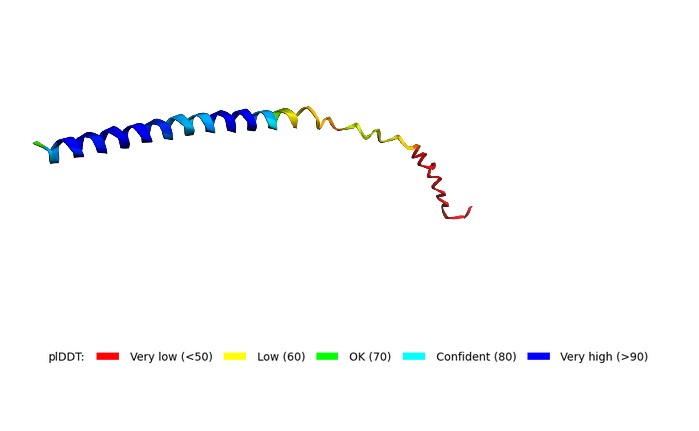
Predicted structure of the Mu2 mutant (F60W, L64I) of MS2 lysis protein
Display 3D structure
The model has acceptable local confidence for the central part of the protein, but the global fold (pTM = 0.329) is unreliable. This is typical for membrane lytic proteins. The F60W and L64I mutations did not lead to complete structural degradation.
3D structure of the Mu2 mutant (F60W, L64I) of MS2 lysis protein predicted by ColabFold
Week 6 HW: Genetic Circuits Part I: Assembly Technologies
Assignment: DNA Assembly
Components of the Phusion High‑Fidelity PCR Master Mix and their purposes
The Phusion master mix (2×) contains:
Phusion DNA polymerase – a high‑fidelity enzyme with 3′→5′ proofreading activity, minimising errors during amplification
dNTPs (dATP, dTTP, dCTP, dGTP) – the building blocks for new DNA strands
Optimised reaction buffer (HF or GC) – provides the correct pH and ionic conditions for the enzyme
Mg²⁺ ions (MgCl₂) – an essential cofactor for polymerase activity
Factors determining primer annealing temperature during PCR
The optimal annealing temperature (Ta) depends on:
Primer length – longer primers generally require higher Ta
GC content – higher GC content increases the melting temperature (Tm, the temperature at which half of the DNA duplex dissociates) and thus Ta
Primer sequence – certain bases or secondary structures can affect binding stability
Salt concentration – higher salt stabilises the DNA duplex, raising the effective Tm
A common rule of thumb is to set Ta about 3–5 °C below the calculated Tm of the primer
Comparison of PCR and restriction enzyme digests for generating linear DNA fragments
Feature
PCR
Restriction digest
Protocol
Amplifies a specific DNA region using primers and a DNA polymerase.
Cuts DNA at specific recognition sites using restriction enzymes.
Advantages
Flexible; does not require specific restriction sites; allows mutagenesis via primers.
Highly predictable; produces defined sticky or blunt ends.
Disadvantages
Risk of polymerase errors (even with proofreading); limited product length (~10 kb).
Requires suitable restriction sites in the DNA; may leave “scars” in the sequence.
When preferable
When you need to amplify from complex mixtures, introduce mutations, or when no convenient restriction sites exist.
When you have a known vector with unique sites and want straightforward cut‑and‑ligate cloning.
Ensuring DNA sequences are suitable for Gibson cloning
To be compatible with Gibson assembly:
Design overlapping ends (20–40 bp) between adjacent fragments. These overlaps are added via PCR primers (the forward primer of one fragment contains a tail complementary to the previous fragment, etc.)
Ensure the overlaps are complementary and free of strong secondary structures
Maintain correct reading frame when assembling coding sequences
Verify the absence of unintended mutations by sequencing or by using high‑fidelity polymerases
Purify the fragments (e.g., gel extraction) to remove enzymes and primers before the assembly reaction
Entry of plasmid DNA into E. coli cells during transformation
Plasmid DNA enters competent E. coli through transient pores in the cell membrane:
Heat‑shock transformation: Cells are treated with cold CaCl₂ to neutralise membrane charges. A sudden temperature increase (0 °C → 42 °C) creates pores through which DNA diffuses into the cytoplasm
Electroporation: A short high‑voltage pulse generates temporary nanopores in the membrane, allowing DNA to enter
After transformation, cells are recovered in SOC medium and plated on selective antibiotics; only transformed cells survive.
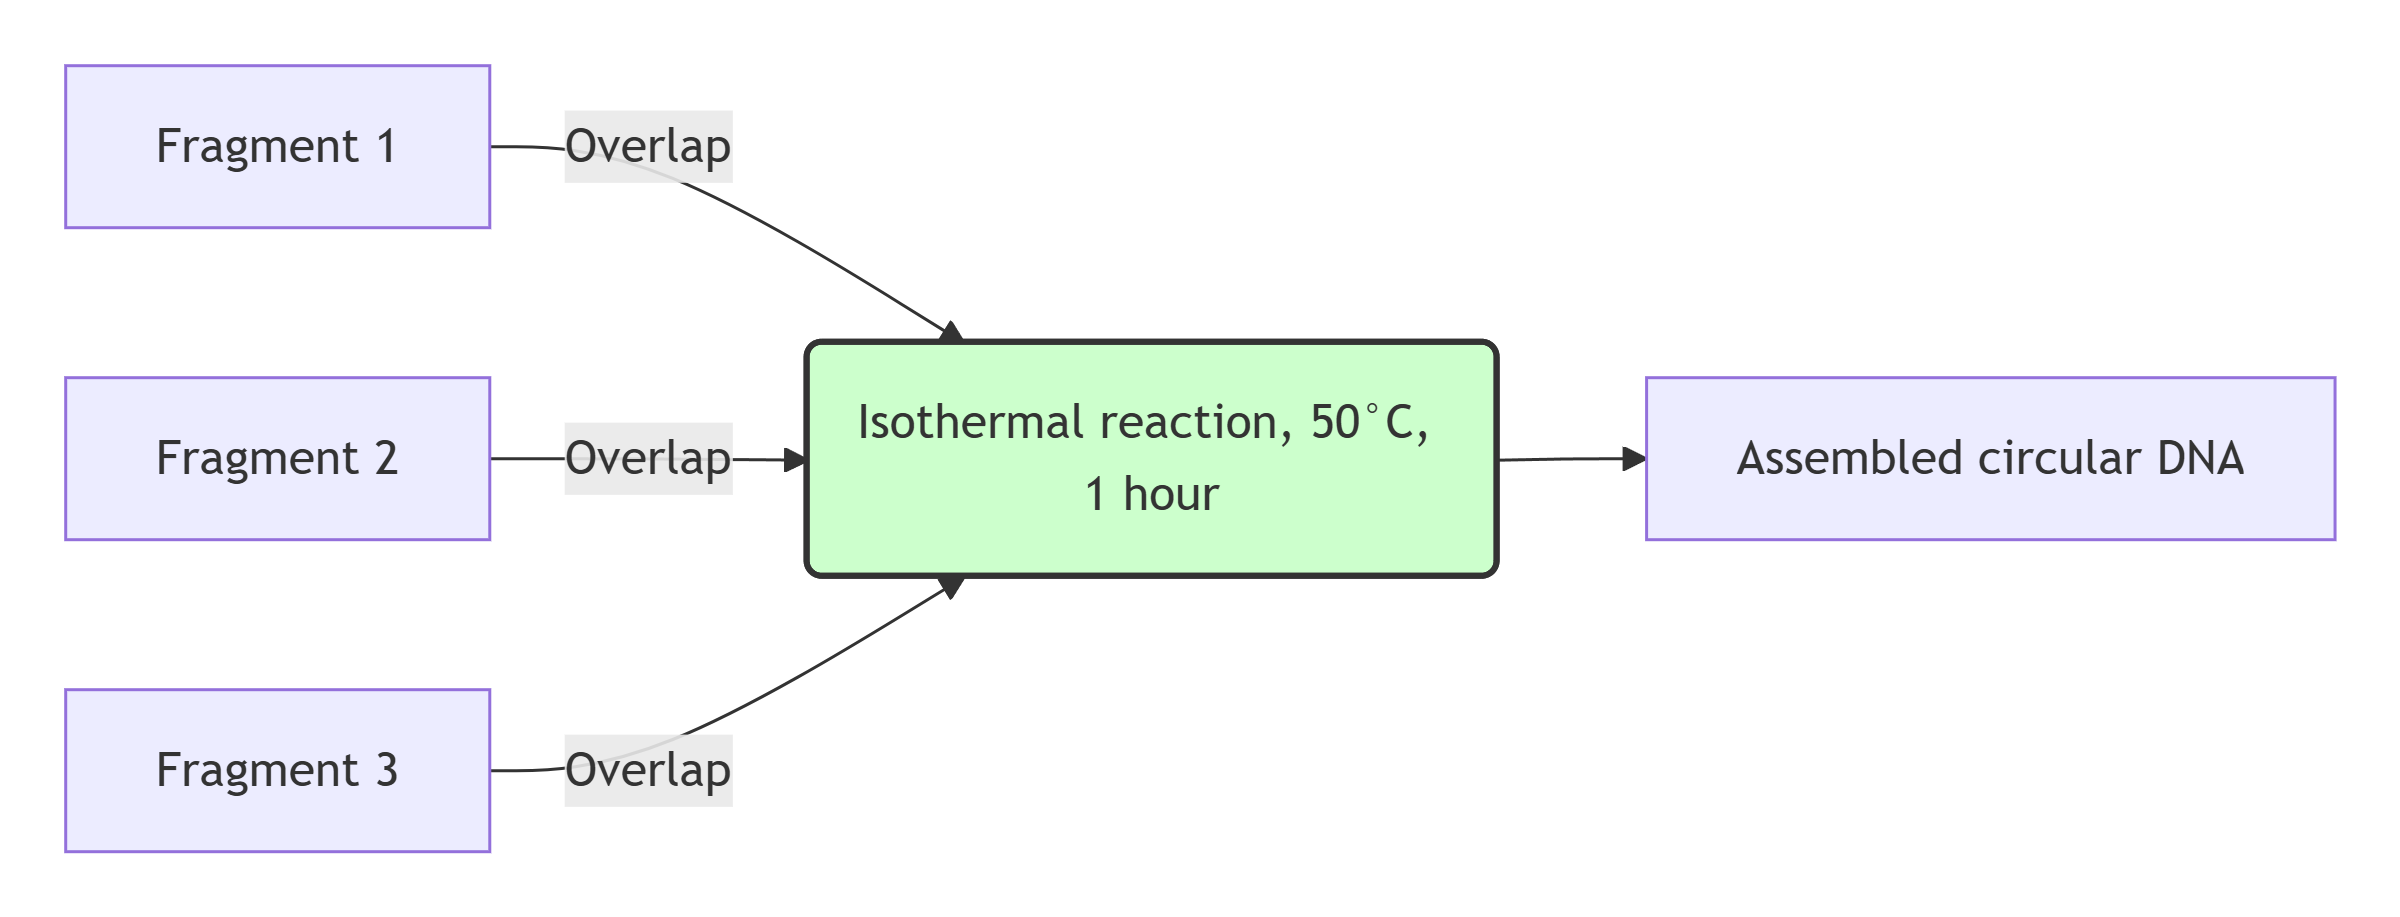
Gibson Assembly method description
Gibson Assembly is a seamless cloning method that joins multiple DNA fragments with overlapping ends in a single isothermal reaction. The master mix contains three enzymes: a 5′ exonuclease, a DNA polymerase, and a DNA ligase. First, the exonuclease chews back the 5′ ends to create single‑stranded overhangs. Complementary overhangs of adjacent fragments anneal. Then the DNA polymerase fills the gaps, and the ligase seals the nicks in the sugar‑phosphate backbone. The result is a circular plasmid without extra sequences. Gibson Assembly is especially convenient for assembling 2‑6 fragments and does not require specific restriction sites.
Gibson Assembly workflow
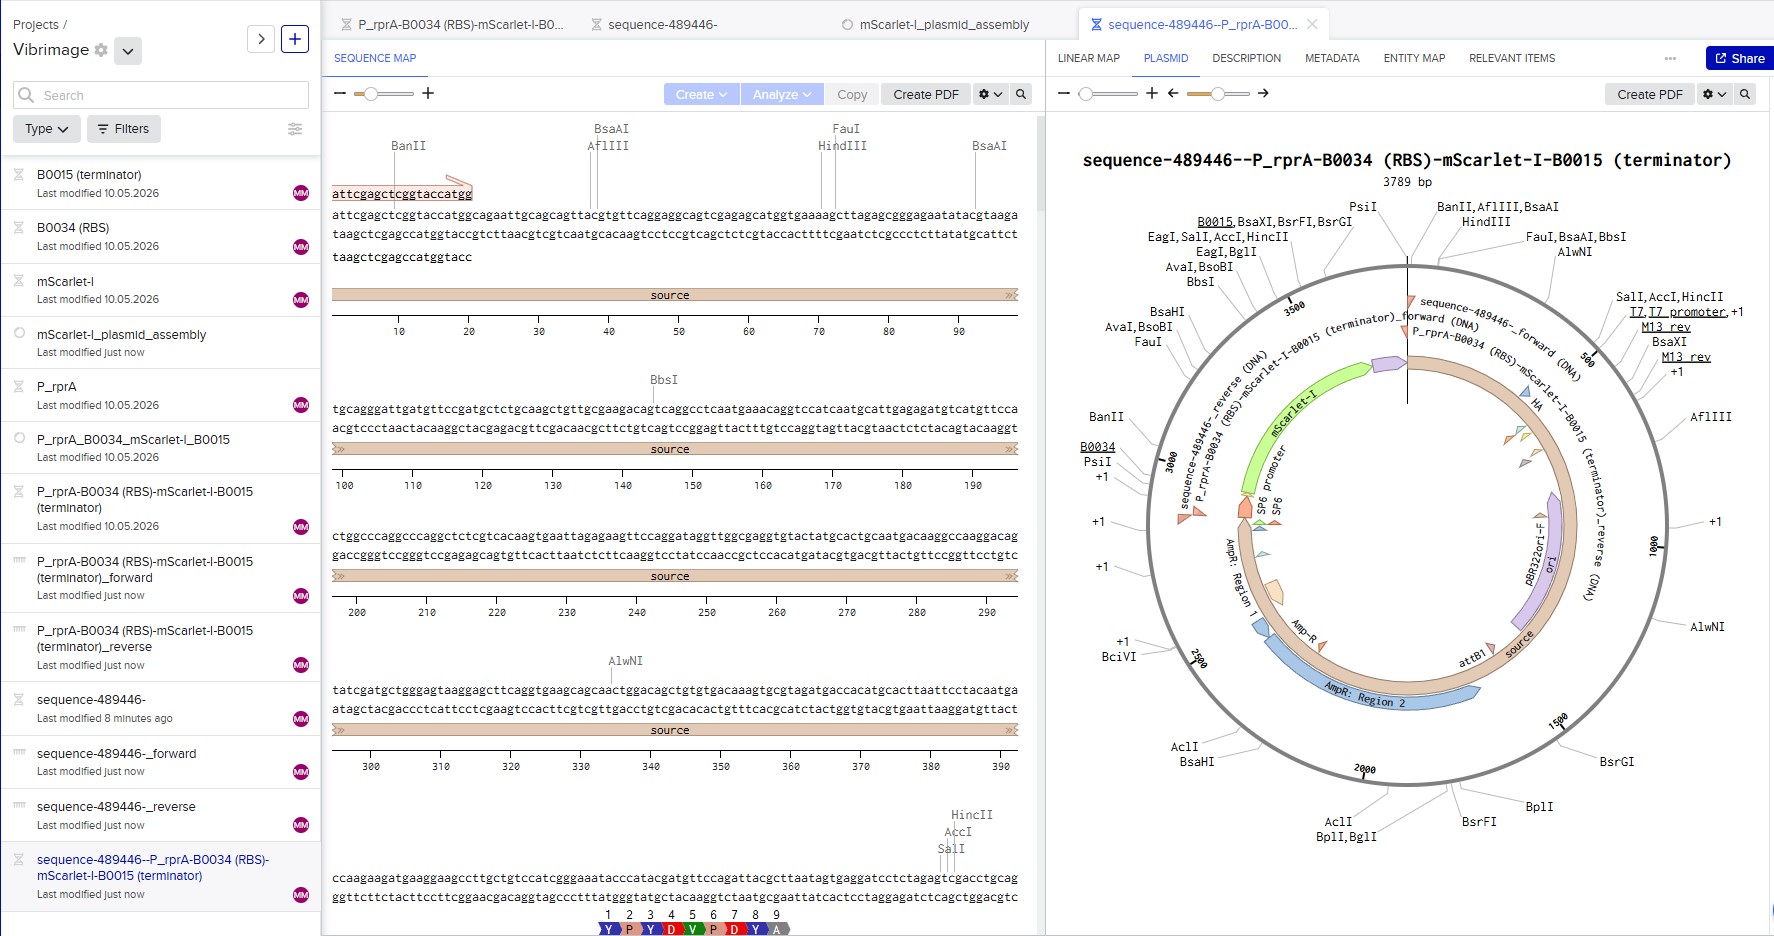
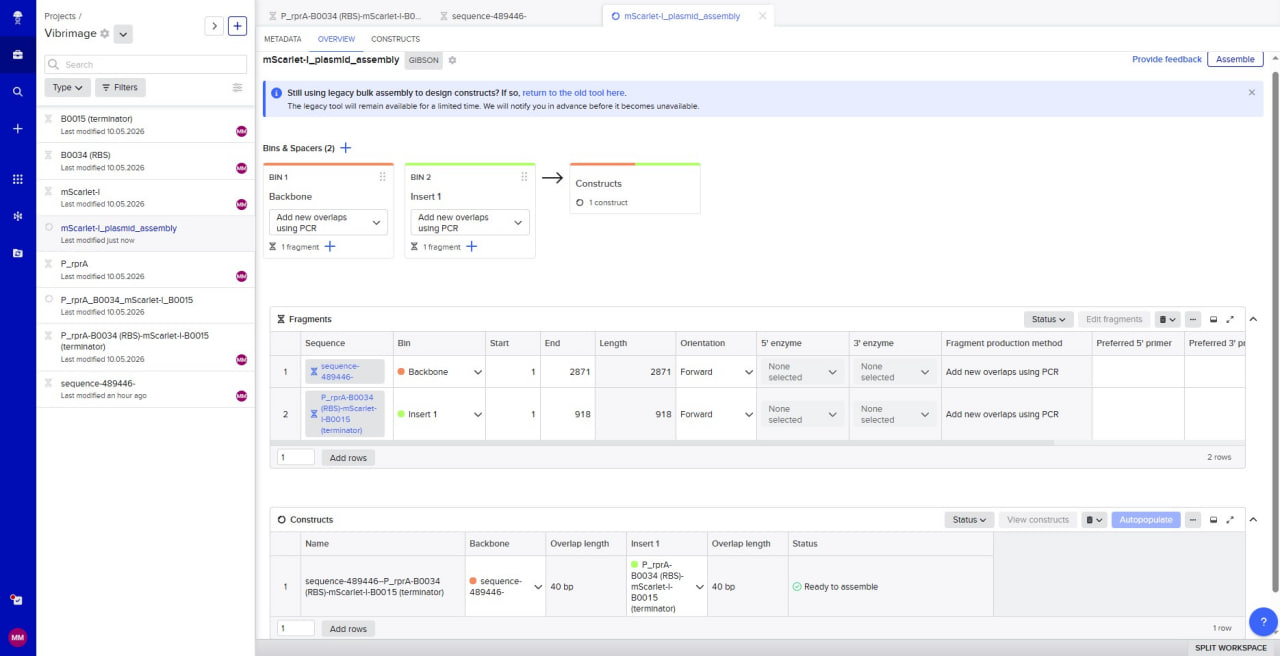
Simulation of the Gibson Assembly method in Benchling
In Benchling, a Gibson Assembly wizard was created. The backbone (sequence-489446, 2871 bp) and the insert (P_rprA-B0034-mScarlet-I-B0015, 918 bp) were added with 40 bp overlaps. The status “Ready to assemble” confirms that the assembly is possible. The screenshot illustrates the simulation process.
Simulation of Gibson Assembly in Benchling
Assignment: Asimov Kernel
Strong GFP expression - BBa_J23101
I examined the Strong GFP expression – BBa_J23101 construct. It consists of a constitutive promoter BBa_J23101, a ribosome binding site (RBS), a green fluorescent protein (GFP) gene, and a terminator. By design, this construct should provide constant, unregulated GFP expression.
Inducible GFP system
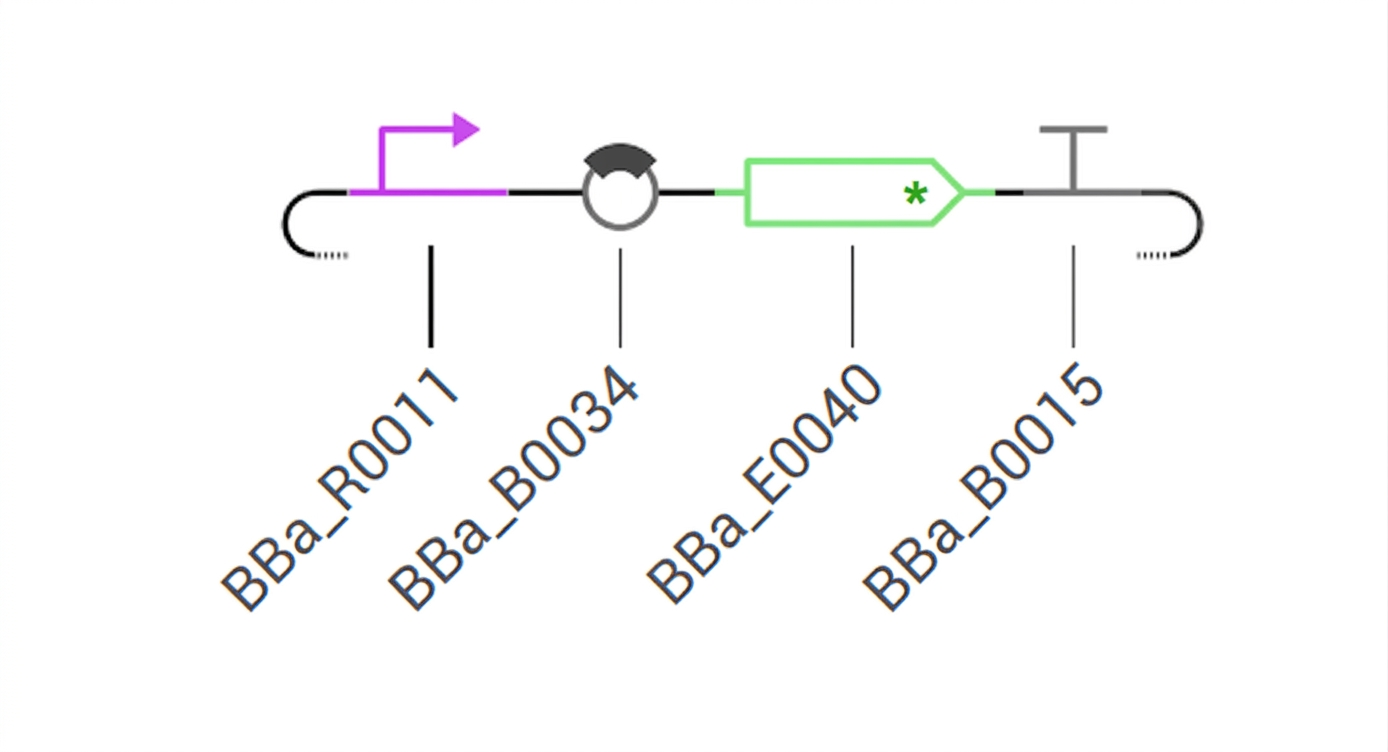
My construct consists of the pLac promoter (BBa_R0011), B0034 RBS (BBa_B0034), GFP gene (BBa_E0040), and B0015 terminator (BBa_B0015). The pLac promoter is activated only in the presence of the inducer IPTG. Without IPTG, GFP expression is repressed (LacI repressor binds the operator). Upon IPTG addition, the repressor is inactivated, and GFP synthesis begins. Fluorescence is expected to rise from zero to a high plateau within about 60 minutes.
Week 7 HW: Genetic Circuits Part II: Neuromorphic Circuits
Assignment Part 1: Intracellular Artificial Neural Networks (IANNs)
Advantages of IANNs over Boolean genetic circuits
Analog computation (continuous molecular concentrations)
Weighted summation of multiple inputs
Nonlinear activation (sigmoid via cooperativity)
More compact (one neuron replaces many logic gates)
Tunable weights (promoter/RBS strength)
Application: cancer biomarker detection
Inputs: concentrations of miRNAs (e.g., miR‑21, miR‑155)
Output: therapeutic protein or fluorescent reporter
Limitations: noise, difficulty of weight tuning, latency (minutes to hours), metabolic load
Intracellular multilayer perceptron
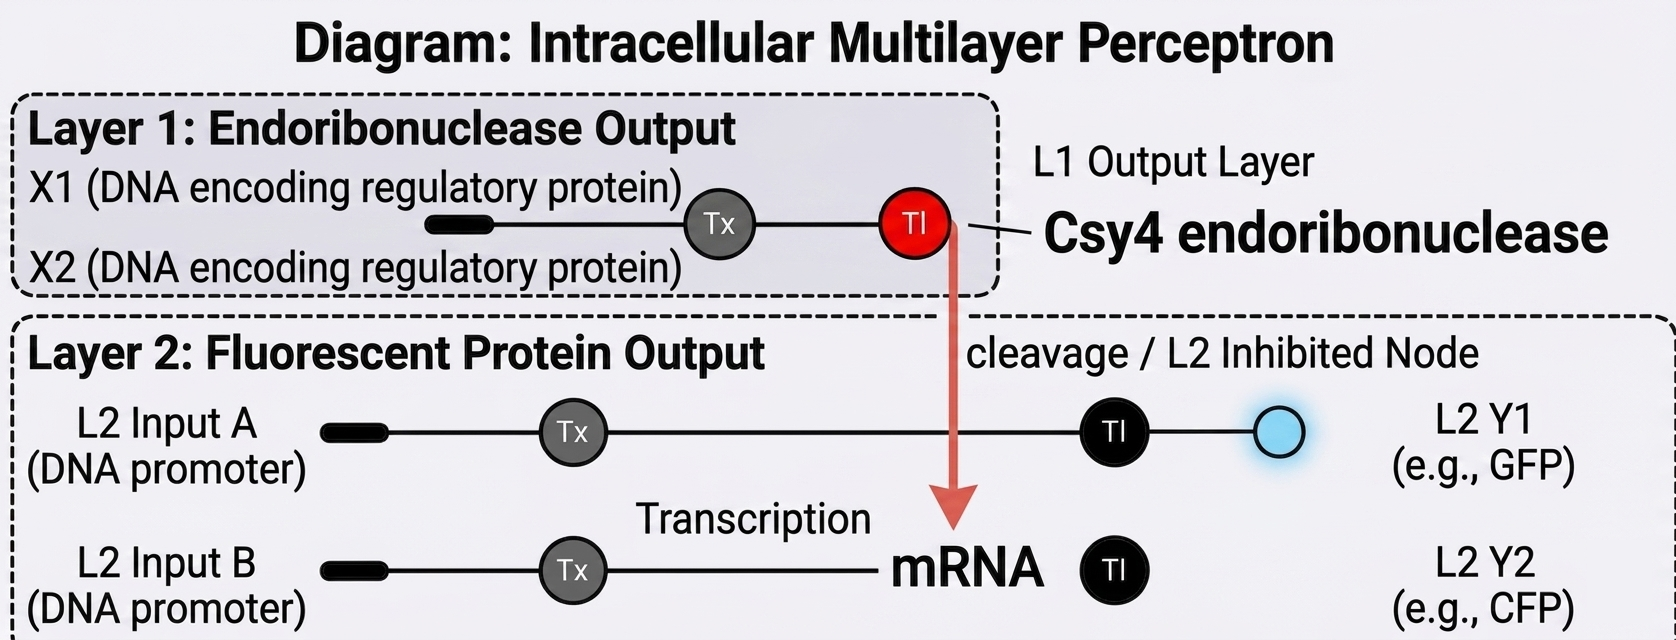
In Layer 1, input signals X1 and X2 (DNA encoding regulatory proteins) lead to the production of the endoribonuclease Csy4. In Layer 2, constitutive promoters drive transcription of mRNAs for fluorescent proteins (GFP, CFP). Csy4 cleaves these mRNAs, preventing the synthesis of the fluorescent proteins. Thus, the output of Layer 2 (fluorescence) is a function (logical NOT) of Csy4 activity.
Layer 1 converts inputs X₁, X₂ into Csy4 endoribonuclease; layer 2 expresses fluorescent proteins whose mRNAs are cleaved by Csy4
Assignment Part 2: Fungal Materials
Examples of Existing Fungal Materials
The most widespread fungal materials include mycelium-based composites (insulation, panels, furniture, packaging) and mycelium leather (vegan leather for fashion and upholstery). Their advantages are biodegradability, low cost, good thermal and acoustic insulation, fire retardancy, and renewable feedstock (agricultural waste). Disadvantages are low mechanical strength (semi‑structural only), high water absorption, and currently higher price at scale.
Genetic Engineering of Fungi and Advantages over Bacteria
Fungi can be engineered to improve nutritional value (mycoprotein with meat‑like taste), bioproduction efficiency (enzymes, pharmaceuticals, bioplastics), and mycelial material properties (strength, hydrophobicity).
Powerful secretion system – fungi secrete higher amounts of target proteins and enzymes
Low‑cost substrate utilisation – grow on lignocellulosic waste instead of expensive media
Mycelium as a ready‑made material – the hyphal network itself is the composite/leather, reducing downstream processing
Non‑toxicity and food‑grade status – many fungi are safe for food and feed applications
Assignment Part 3: First DNA Twist Order
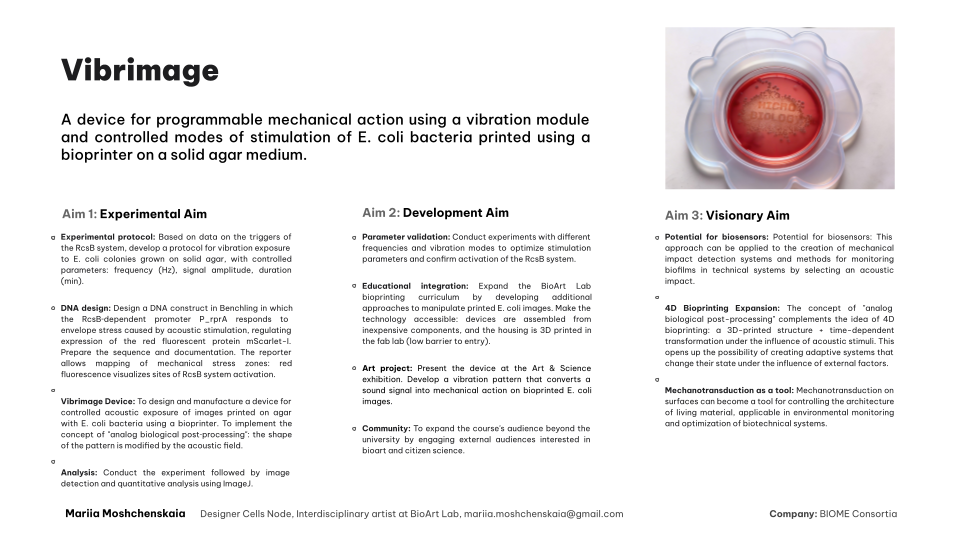
Vibrimage
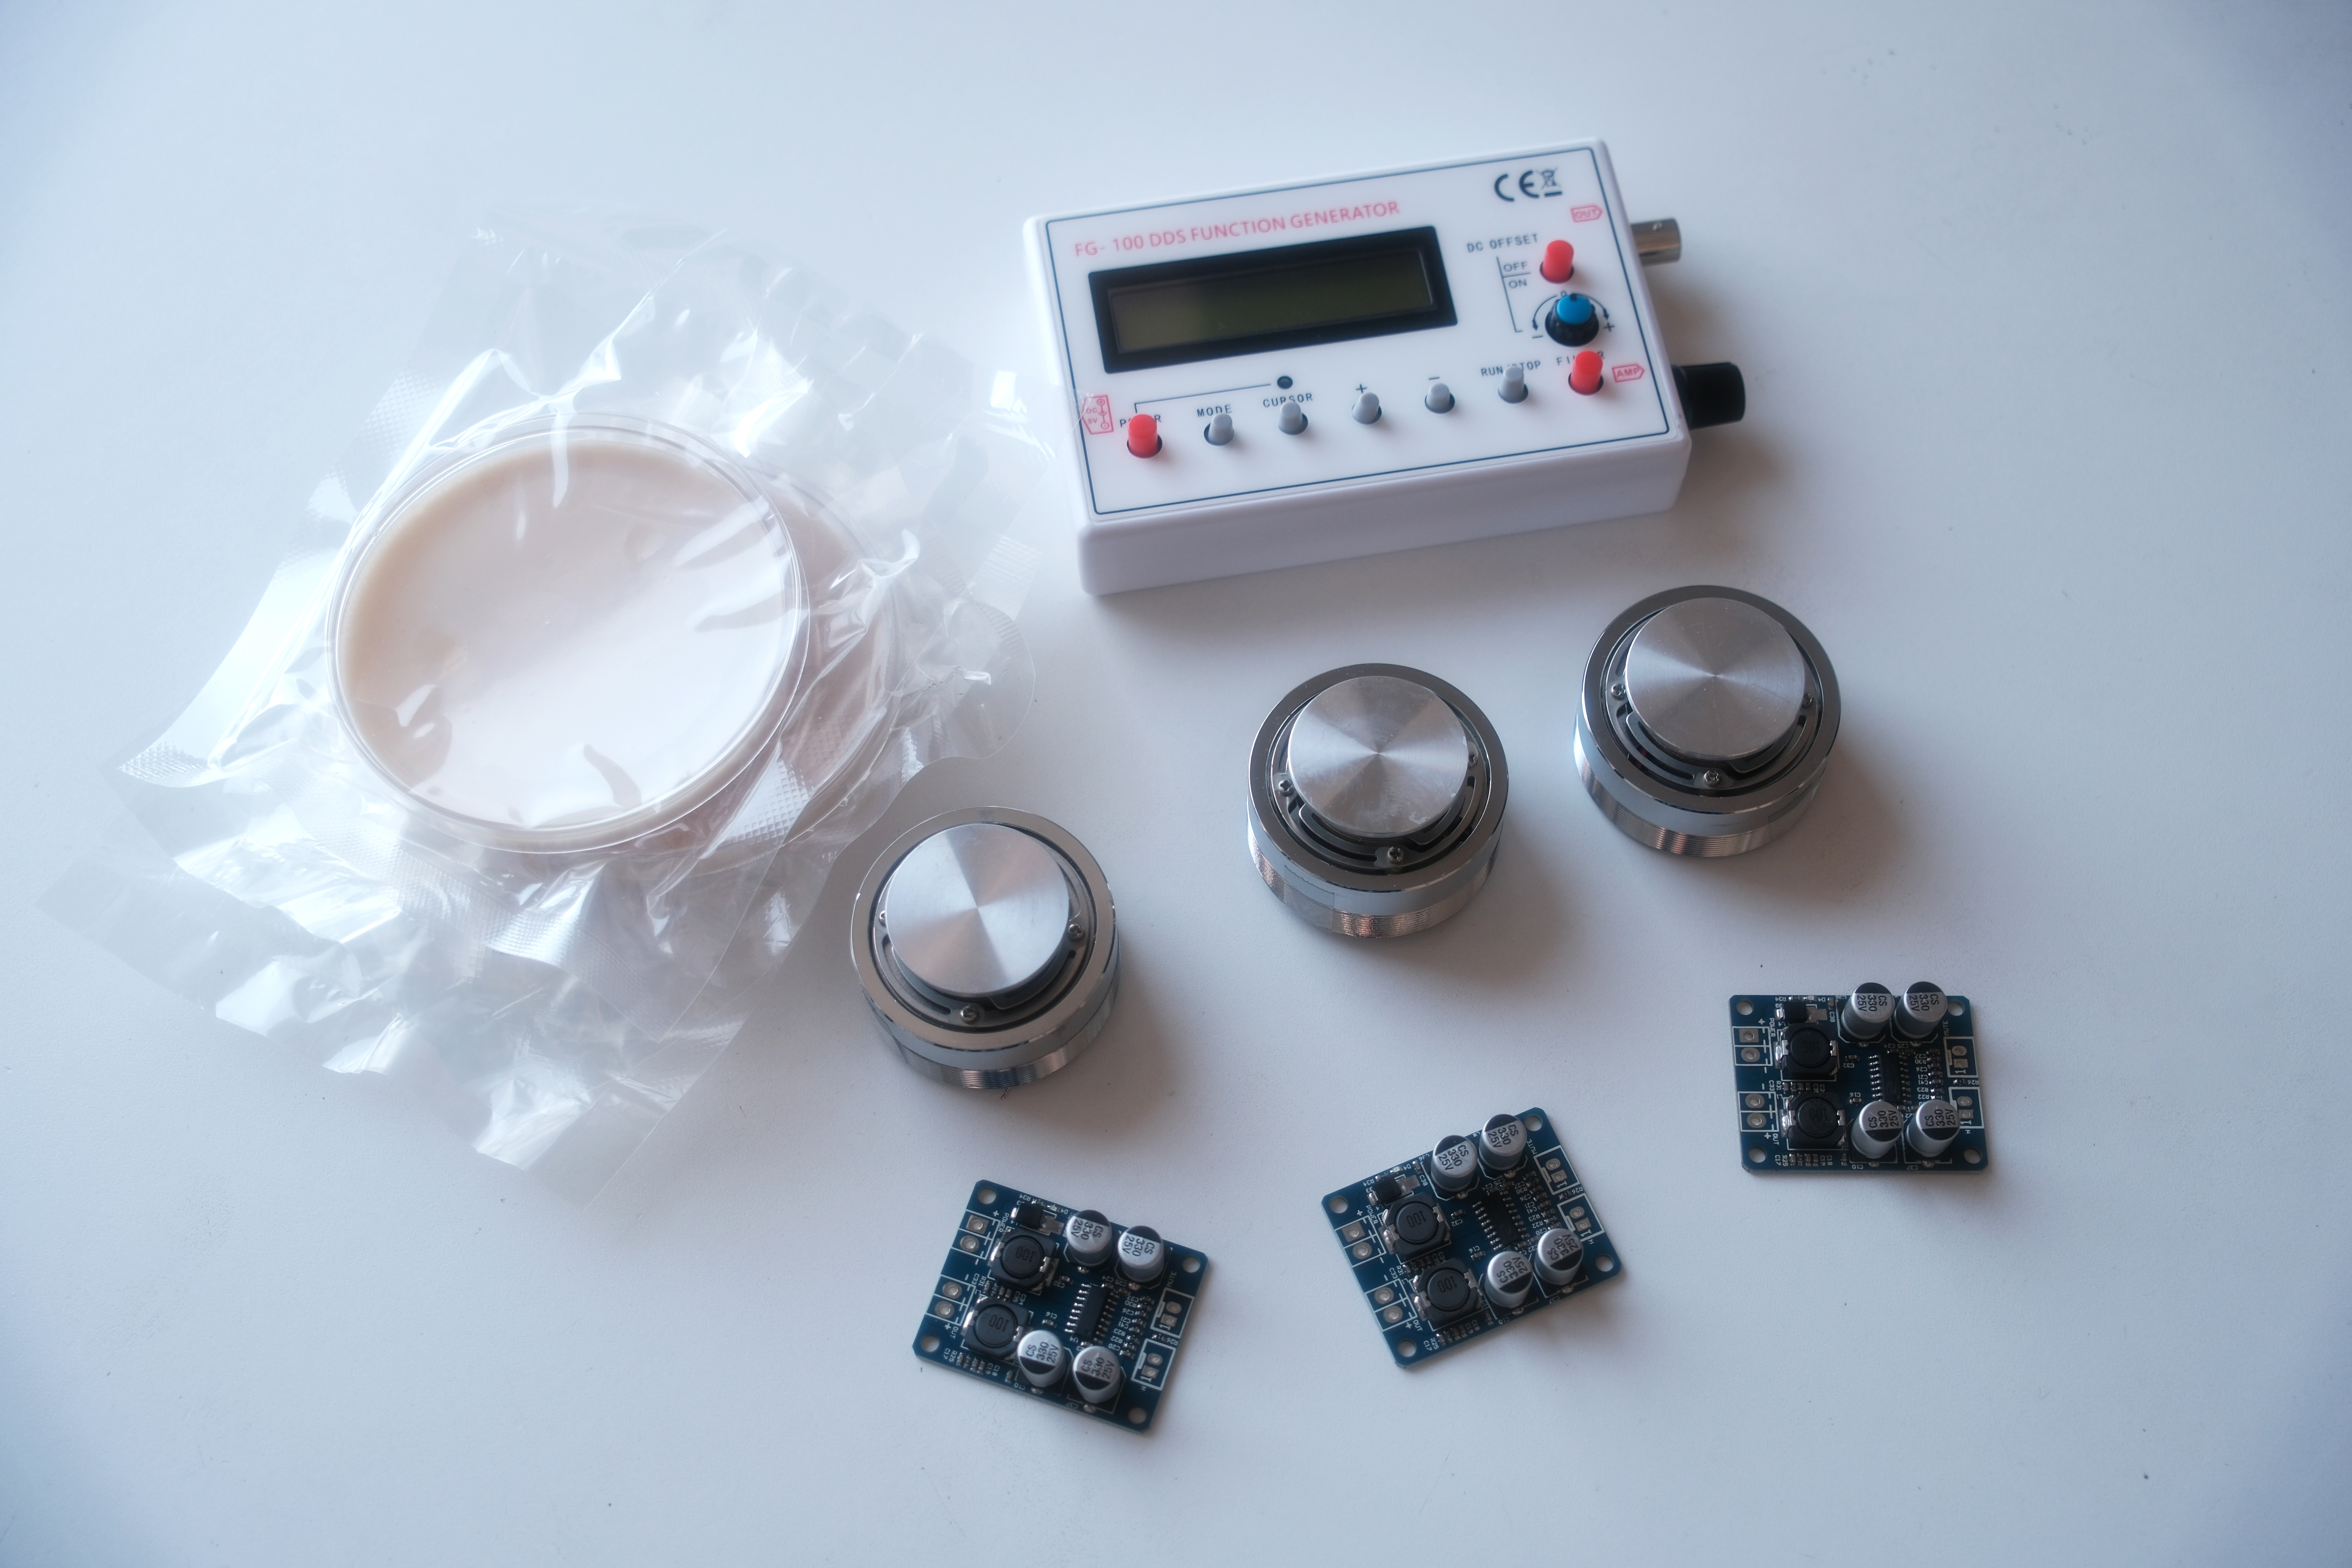
A device for affecting the growth of bioprinted E. coli on solid agar medium using programmable acoustic exposure.
Genetic stress reporters visualise the cellular response to vibration. For my DNA design, I use the P_rprA promoter. It makes E. coli glow red in zones of acoustic exposure. This makes “sound sculpting” visible.
Final Project Aim:
To characterize the influence of frequency, amplitude, and duration of vibration on the morphology and stress response of E. coli colonies bioprinted on a solid agar medium to develop a protocol for mechanical reprogramming of the architecture of living material.
Homework Part A: General and Lecturer-Specific Questions
General homework questions
Advantages of cell‑free protein synthesis
Direct access to the reaction environment and no constraints from cell viability. Cell‑free synthesis is preferable for producing toxic proteins and for rapid screening of many variants without maintaining live cultures.
Main components of a cell‑free system and their roles
Cell extract (ribosomes, tRNAs, translation factors, polymerase), energy system (ATP plus regeneration), amino acids, DNA template, buffer and salts.
Why energy regeneration is critical and how to ensure continuous ATP supply
Protein synthesis rapidly depletes ATP; regeneration is essential. Method: creatine phosphate / creatine kinase system (creatine phosphate donates phosphate to ADP, generating new ATP).
Comparison of prokaryotic and eukaryotic cell‑free systems. Choosing a protein for each
Prokaryotic system (E. coli extract) is suitable for simple proteins, e.g. GFP. Eukaryotic system (wheat germ extract) is suitable for proteins with post‑translational modifications, e.g. human immunoglobulin IgG.
Designing a cell‑free experiment to optimise membrane protein expression
Challenges: poor solubility, aggregation, misfolding. Solutions: add detergents (DDM) or liposomes, use lipid nanodiscs, optimise temperature and detergent concentration.
Low protein yield: three possible reasons and troubleshooting
For DNA degradation, add nuclease inhibitors and use fresh template. For energy depletion, increase ATP regeneration components. For protein aggregation, lower temperature and add chaperones or detergents.
Homework question from Kate Adamala
Pick a function and describe it.
a. What would your synthetic cell do? What is the input and what is the output?
The synthetic cell will detect mechanical envelope stress caused by sound vibration. Input: acoustic vibration (mechanical force transmitted through agar). Output: red fluorescence (mScarlet‑I protein).
b. Could this function be realized by cell‑free Tx/Tl alone, without encapsulation?
No. Without encapsulation there is no cell envelope, and envelope stress is required to activate the Rcs cascade. A cell‑free system in a test tube cannot sense mechanical stress.
c. Could this function be realized by a genetically modified natural cell?
Yes. E. coli carrying the P_rprA‑B0034‑mScarlet‑I‑B0015 construct works as a vibration biosensor. This is a natural cell with modified DNA.
d. Describe the desired outcome of your synthetic cell operation.
Upon acoustic stimulation, the cell displays red fluorescence. Fluorescence intensity is proportional to vibration strength up to a certain threshold.
Design all components that would need to be part of your synthetic cell.
a. What would be the membrane made of?
For a synthetic minimal cell, the membrane would consist of POPC and cholesterol lipids (for stability).
b. What would you encapsulate inside? Enzymes, small molecules.
Inside the liposome, one would encapsulate a cell‑free transcription‑translation (Tx/Tl) system based on E. coli extract (containing all necessary enzymes, including Rcs cascade components), amino acids, ATP, NTPs, buffer, and the DNA template with the P_rprA‑B0034‑mScarlet‑I‑B0015 cassette.
c. Which organism your Tx/Tl system will come from?
A bacterial system from E. coli is suitable because the Rcs signalling pathway is endogenous to E. coli.
d. How will your synthetic cell communicate with the environment?
Mechanical vibration is transmitted through the agar and creates envelope stress, which activates the Rcs cascade. All necessary substrates are stored inside the capsule.
Experimental details
a. List all lipids and genes.
Lipids: POPC, cholesterol (for stability).
Genes: P_rprA (RcsB‑dependent promoter), B0034 (strong RBS), mScarlet‑I (red fluorescent protein), B0015 (terminator).
b. How will you measure the function of your system?
Place Petri dishes with bioprinted bacteria on a vibration shaker. Apply controlled acoustic stimulation that produces vibration. Take photographs and quantify the fluorescence intensity using ImageJ software. Compare with control dishes that were not exposed to vibration.
Homework Part B: Individual Final Project
Vibrimage progect
DNA construct
The DNA construct includes the reporter cassette P_rprA — B0034 — mScarlet-I — B0015, where P_rprA is an RcsB‑dependent promoter and mScarlet-I encodes a red fluorescent protein.
The Concept: A living, breathable building brick made from fungal mycelium that acts as a continuous, low‑cost biosensor, visually detecting the presence of airborne heavy metal pollutants by changing colour.
One‑Sentence Pitch
A living mycelium building brick that changes colour upon contact with toxic heavy metals in the air or water, serving as a built‑in, maintenance‑free pollution detector.
How the Idea Works (in detail)
Fungal mycelium grown into a brick or tile is a living network. Certain fungi, such as Aspergillus niger, possess a natural ability for the biosorption of heavy metal ions (e.g., lead, cadmium, mercury) from the environment. When these ions bind to the fungal cell wall, biochemical reactions occur that produce a visible colour signal. For example, it has been demonstrated that fungal mycelium can turn blue upon contact with even very low concentrations of copper ions.
Societal Challenge / Market Need Addressed
Monitoring urban air and water quality requires expensive sensors and electricity. Heavy metal pollution is often invisible and uneven. This brick creates a distributed, passive sensor network within the fabric of the building itself. This makes environmental monitoring cheap, accessible and visually understandable for residents, allowing them to identify local pollution “hotspots” in real time without complex instruments.
Addressing Cell‑Free System Limitations
This proposal uses living fungi instead of freeze‑dried cell‑free systems, which directly addresses their limitations. First, activation by water is not required, because the hygroscopic mycelium naturally extracts moisture from the air. Second, stability is not a concern: as long as the fungus is alive and receives nutrients from the carrier material (e.g., agricultural waste), it remains active. Third, single‑use is also not an issue. The sensor is not “consumed” after a single event; it continues to react and accumulate the signal. The permanent colour change serves as a long‑term archival record of pollution, rather than a transient, disappearing signal.
Homework question from Ally Huang
Genes in Space Proposal: A Cell‑Free Biosensor for Early Biofilm Detection in Spacecraft Water Systems
Background Information
Biofilms are a recognized threat in space habitats. They can clog water recovery systems, corrode metal surfaces, and harbour opportunistic pathogens (e.g., Pseudomonas aeruginosa). In microgravity, bacteria form more robust biofilms, making monitoring crucial. Current detection relies on time‑consuming culturing. A rapid, low‑resource cell‑free biosensor would allow astronauts to detect early contamination, safeguard equipment, and protect health on long‑duration missions.
Biofilms pose a serious risk to spacecraft water systems and crew health. In microgravity, they grow faster and are more resistant. Existing detection methods are slow and resource‑intensive. A quick, easy‑to‑use cell‑free biosensor would enable early warning and timely countermeasures, which is critical for long‑duration space exploration where resupply is impossible.
Molecular or Genetic Target
A DNA construct encoding a fluorescent reporter protein (e.g., sfGFP) under the control of a promoter that is specifically activated by N‑acyl homoserine lactones (AHLs) – the quorum sensing molecules used by many biofilm‑forming bacteria, such as P. aeruginosa.
A genetic circuit consisting of a quorum‑sensing promoter (e.g., PluxR) fused to a superfolder GFP gene. This promoter is induced by AHL molecules that are key signals for biofilm formation.
Relation to the Space Biology Challenge
AHLs diffuse into water as biofilms develop. Our cell‑free BioBits system will detect these molecules. Upon rehydration of the freeze‑dried reaction with a water sample, AHLs will bind to a constitutively expressed transcription factor (e.g., LuxR), which then activates the reporter promoter, driving GFP expression. Fluorescence, read with the P51 viewer, directly correlates with AHL concentration and thus biofilm biomass. This provides a rapid, semi‑quantitative readout of biofilm status in the water system.
As a biofilm grows, bacteria release AHL molecules into the surrounding water. Our BioBits sensor will detect these AHLs: they activate a transcriptional activator, which turns on GFP production. The resulting green fluorescence can be easily seen by an astronaut using the P51 viewer. No complex equipment or cell culture is needed.
Hypothesis or Research Goal
Hypothesis: A cell‑free BioBits sensor can detect AHL molecules from developing biofilms in spacecraft water samples, producing a fluorescence signal proportional to the AHL concentration. Goal: To design, optimize, and validate a portable, shelf‑stable biosensor that provides an early, non‑invasive warning of biofilm contamination in ISS water systems. This will be tested both on Earth (with simulated microgravity controls) and in spaceflight conditions.
We hypothesize that our sensor will specifically and sensitively detect AHLs in water. The research goal is to produce a ready‑to‑use, freeze‑dried test that requires only adding a water sample, waiting 1‑2 hours, and looking for green fluorescence. This would enable routine, autonomous monitoring of water quality on the ISS and future deep‑space missions.
Experimental Plan
Samples: Water samples from the ISS Water Processor Assembly (WPA) collected at different time points. Controls: Negative – sterile deionized water; Positive – water spiked with synthetic AHL (C4‑HSL or 3OC12‑HSL). Procedure: Each sample is mixed with freeze‑dried BioBits sensor pellets (contains all CFPS components). After 1‑2 h incubation at 22°C, fluorescence is measured using the P51 viewer. Tests will be run in triplicate. Data: Qualitative (visible glow) and semi‑quantitative (image analysis via smartphone photo). Comparison of Earth and space results will reveal microgravity effects on sensor performance.
We will test our sensor with real and simulated ISS water samples. Controls include pure water (no signal) and water with added AHLs (strong signal). The experiment is simple: rehydrate a freeze‑dried pellet, incubate, and observe fluorescence. Astronauts will document results with photos. The same procedure will be run on Earth to validate performance and then transferred to the ISS for space validation.
The intensity of red fluorescence of E. coli bacteria carrying the P_rprA‑B0034‑mScarlet‑I‑B0015 construct after acoustic exposure will be measured. In addition, the area of fluorescent zones on the bioprinted image will be measured, and bacterial growth area as well as changes in the bioprinted image will be assessed.
How will these measurements be performed?
Using photography and subsequent analysis with ImageJ software, the following will be quantified:
Fluorescence intensity after incubation of Petri dishes with bioprinted bacteria (control and acoustically exposed samples); the mean fluorescence intensity in selected regions will be quantitatively assessed.
Fluorescence area – the area occupied by glowing zones will be measured and compared with the original printed pattern.
Bacterial growth area and changes in the image printed by E. coli using the bioprinter.
Which technologies (methods) will be used?
Digital photography and ImageJ for quantitative image analysis (integrated intensity, area).
Culturing and plating for viability assessment (colony‑forming unit counts).
Bioprinter to deposit bacteria on agar as a defined image (an automation hardware tool).
Vibration speaker (shaker) with a signal generator for controlled acoustic exposure.
All measurements will be performed in at least three replicates, with mandatory control samples (without acoustic exposure). This will allow statistical evaluation of how vibration affects activation of the RcsB‑dependent promoter and, consequently, fluorescence.
Homework: Waters Part I — Molecular Weight
Based on the predicted amino acid sequence of eGFP (see below) and any known modifications, what is the calculated molecular weight?
The calculated molecular weight (including the LE linker and the HHHHHH His‑tag at the end of the sequence) is 28,006.60 Da (≈ 28.0 kDa). The corresponding theoretical isoelectric point (pI) is 5.90.
Calculate the molecular weight of the eGFP using the adjacent charge state approach described in the recitation.
z for the adjacent pair of peaks
z = 903.7148 / (903.7148 − 875.4421) = 31.96
The molecular weight of the protein
MW = (903.7148 × 31.96) − (31.96 × 1.007276 Da) = 28850.53
Can you observe the charge state for the zoomed-in peak in the mass spectrum for the intact eGFP? If yes, what is it? If no, why not?
No, the peaks are too close together to resolve the charge states. The resolution of 30,000 is insufficient to separate individual isotopic peaks for a protein of this size, so the exact charge state cannot be determined from the zoomed‑in peak alone.
Homework: Waters Part II — Secondary/Tertiary structure
Based on learnings in the lab, please explain the difference between native and denatured protein conformations. For example, what happens when a protein unfolds? How is that determined with a mass spectrometer? What changes do you see in the mass spectrum between the native and denatured protein analyses?
In the native (folded) state, the protein has few accessible charges, so its peaks appear at high mass‑to‑charge ratio values. Upon denaturation, the protein unfolds, the number of charges increases, the peaks shift to lower mass‑to‑charge values, and the charge distribution becomes broader.
Looking at the zoomed‑in region of the native mass spectrum of eGFP (Figure 3), can you determine the charge state of the peak at approximately 2800? What is the charge state? How can you tell?
Yes, the charge state is 10+. It is obtained by dividing the protein mass (~28,000 Da) by the peak value (2800), giving ~10. The isotopic peak spacing of ~0.1 also indicates 1/10, confirming 10+.
Homework: Waters Part III — Peptide Mapping - primary structure
How many Lysines (K) and Arginines (R) are in eGFP?
The eGFP sequence contains 20 lysines (K) and 6 arginines (R).
How many peptides will be generated from tryptic digestion of eGFP?
Tryptic digestion (with 0 missed cleavages) will generate 27 peptides (26 K/R cleavage sites plus the C‑terminal fragment).
Based on the LC-MS data for the Peptide Map data generated in lab (please use Figure 5a as a reference) how many chromatographic peaks do you see in the eGFP peptide map between 0.5 and 6 minutes? You may count all peaks that are >10% relative abundance.
Based on the total ion chromatogram (Figure 5a), there are 20 chromatographic peaks between 0.5 and 6 minutes that exceed 10% of the maximum abundance.
Assuming all the peaks are peptides, does the number of peaks match the number of peptides predicted from question 2 above? Are there more peaks in the chromatogram or fewer?
The number of peaks (approximately 20) is fewer than the predicted 27 peptides. This indicates that some peptides did not separate or were not detected under the conditions used.
Determine the peak value of the peptide in the mass spectrum (Figure 5b). Determine the charge of the most abundant peak by using the spacing between the isotopic peaks in the inset. Calculate the mass of the singly charged form of the peptide.
The peak value is approximately 525.8. The spacing between isotopic peaks is about 0.2, corresponding to a charge of 5. The mass of the singly charged peptide ion is approximately 2624.8 Da.
Identify the peptide by comparing it to the expected masses in the PeptideMass tool. What is the measurement accuracy? Calculate the error in ppm.
The peptide with a mass of about 2624.8 Da corresponds, for example, to the fragment (R)TIFKDDGNYKTR(A) or similar. The theoretical mass of this peptide (calculated with PeptideMass) is approximately 2624.7 Da. The measurement error is (2624.8 – 2624.7)/2624.7 ≈ 0.000038, which is about 38 ppm.
What is the percentage of the sequence that is confirmed by peptide mapping?
88% of the sequence was confirmed.
Homework: Waters Part IV — Oligomers
On the CDMS spectrum (Figure 7), point out the peaks for the 7FU decamer, 8FU didecamer, 8FU 3‑decamer, and 8FU 4‑decamer. What are their masses?
7FU decamer – mass 3.4 MDa, peak at ~3.4 MDa.
8FU didecamer – mass 8.0 MDa, peak at ~8.0 MDa
8FU 3‑decamer – mass 12.0 MDa, peak at ~12.0 MDa
8FU 4‑decamer – mass 16.0 MDa, peak at ~16.0 MDa
Homework: Waters Part V — Did I make GFP?
Molecular weight (kDa)
Theoretical
Observed/measured on the Intact LC-MS
PPM Mass Error
eGFP with His‑tag
28.0066
27.984
812
The theoretical mass was calculated in task 2.1 (28,006.60 Da). The observed mass was obtained from charge state analysis (27,983.86 Da, rounded to 27,984 Da). The error in ppm is (28,006.60 – 27,983.86) / 28,006.60 × 10⁶ ≈ 812 ppm.
Bioproduction & Cloud Labs
Part A: The 1,536 Pixel Artwork Canvas | Collective Artwork
Collective image
Part B: Cell-Free Protein Synthesis | Cell-Free Reagents
Roles of components in the 20‑hour cell‑free reaction (yellow box)
E. coli Lysate (BL21 (DE3) Star) – provides the cellular machinery (ribosomes, tRNAs, polymerases, translation factors) required for transcription and translation. The BL21 (DE3) strain supplies T7 RNA polymerase, enabling high‑efficiency transcription from T7 promoters.
Salts/Buffer – maintain optimal pH (HEPES), ionic strength, and cofactor availability. Potassium glutamate and magnesium glutamate stabilise ribosomes and enzyme activity; potassium phosphate buffers the reaction and supplies phosphate groups.
Energy / Nucleotide System – ribose and glucose are metabolised by endogenous enzymes to generate ATP and other NTPs. AMP, CMP, GMP, UMP and guanine are converted into the corresponding NTPs, providing a sustainable, long‑term energy supply.
Translation Mix (Amino Acids) – supplies the 20 proteinogenic amino acids (17‑amino acid mix plus tyrosine and cysteine) as building blocks for the synthesised protein.
Additives (Nicotinamide) – acts as a cofactor for certain metabolic enzymes and may help reduce inhibitory by‑products, extending the reaction lifetime.
Backfill (Nuclease Free Water) – adjusts the final volume and ensures no contaminating nucleases degrade the DNA template or RNA.
Main differences between the 1‑hour PEP‑NTP master mix and the 20‑hour NMP‑ribose‑glucose master mix
The 1‑hour mix uses pre‑made NTPs (ATP, GTP, CTP, UTP) and phosphoenolpyruvate (PEP‑Mono) as an immediate energy source, allowing rapid protein synthesis but limiting reaction duration. The 20‑hour mix instead supplies ribose, glucose, and nucleotide monophosphates (AMP, CMP, UMP) plus guanine; endogenous bacterial enzymes convert these into NTPs and regenerate ATP over many hours, enabling sustained protein production for up to 20 hours. Consequently, the 1‑hour formulation is suitable for quick assays, while the 20‑hour formulation supports longer incubations and higher total protein yields.
Part C: Planning the Global Experiment | Cell-Free Master Mix Design
Biophysical or functional properties of the six proteins
sfGFP: matures very quickly (13.6 min) and folds robustly, ensuring fast and reliable fluorescence in cell‑free systems.
mRFP1: is a monomer with a maturation time of about 60 min and low acid sensitivity (pKa 4.5), reducing signal loss at low pH.
mKO2: is a bright, fast‑maturing orange protein with moderate acid sensitivity.
mTurquoise2: matures rapidly, has an extremely high quantum yield (0.93) and very low acid sensitivity, making it ideal for long incubations.
mScarlet‑I: matures in ~36 min (faster than most red proteins) and has moderate acid sensitivity, giving a strong signal in cell‑free setups.
Electra2: is a monomeric blue protein with optimized intracellular brightness and high photostability, ensuring a clear signal despite lower blue‑FP stability.
Hypothesis for improving fluorescence over 36 h
Protein: mScarlet‑I (or any protein limited by maturation).
Reagents: add a redox‑balancing system (e.g., DsbC/DsbG) and a chaperone cocktail (GroEL/ES) to the mastermix.
Expected effect: the redox reagents would improve chromophore maturation, while the chaperones would prevent aggregation, leading to a higher and more stable fluorescence signal throughout the 36‑h incubation.
Vibrimage SECTION 1: ABSTRACT
Vibrimage is a device for affecting the growth of bioprinted E. coli on solid agar medium using programmable acoustic exposure. The basic idea is to do post‑processing of a bacterial image using sound. In this case, audible frequencies act as a “bio‑Photoshop”. For DNA design, I will use the P_rprA promoter. It makes E. coli fluoresce red in areas of acoustic exposure. This makes ‘sound sculpting’ visible.
Vibrimage is a device for affecting the growth of bioprinted E. coli on solid agar medium using programmable acoustic exposure. The basic idea is to do post‑processing of a bacterial image using sound. In this case, audible frequencies act as a “bio‑Photoshop”. For DNA design, I will use the P_rprA promoter. It makes E. coli fluoresce red in areas of acoustic exposure. This makes ‘sound sculpting’ visible.
Most research focuses on removing bacteria using high frequencies in liquid media. The Vibrimage project studies the effect of sound frequencies on bacteria in a biosensor context. That is why it is important for me to also understand how to promote bacterial growth. Another important aspect of the project was to recreate conditions that could be found in real life. Bacteria grow on a solid medium. The exposure to audible sound frequencies is 500 hertz and 1000 hertz. The image will be printed by E. coli bacteria in the form of waves. It is 500 hertz and 1000 hertz waves, forming a kind of grid. This work is also presented as a way to share skills with the bioart community, so the focus is on building an easy‑to‑make device.
Acoustic exposure causes vibration and mechanical stress of the cell envelope, which activates the Rcs system. This triggers RcsB‑dependent signalling and activates the P_rprA promoter, ultimately leading to expression of mScarlet‑I and red fluorescence of E. coli.
In the future, the project is planned to be developed and presented as an Art & Science project with musical compositions, as well as to continue research into how it can be implemented in nutritional technologies.
Device
SECTION 2: PROJECT AIMS
Aim 1: Experimental Aim
Experimental protocol: Based on data on the triggers of the Rcs system, develop a protocol for vibration exposure to E. coli colonies grown on solid agar, with controlled parameters: frequency (Hz), signal amplitude, duration (min).
DNA design: Design a DNA construct in Benchling in which the RcsB‑dependent promoter P_rprA responds to envelope stress caused by acoustic stimulation, regulating expression of the red fluorescent protein mScarlet-I. Prepare the sequence and documentation. The reporter allows mapping of mechanical stress zones: red fluorescence visualizes sites of RcsB system activation.
Vibrimage Device: To design and manufacture a device for controlled acoustic exposure of images printed on agar with E. coli bacteria using a bioprinter. To -implement the concept of “analog biological post‑processing”: the shape of the pattern is modified by the acoustic field.
Analysis: Conduct the experiment followed by image detection and quantitative analysis using ImageJ.
Aim 2: Development Aim
Parameter validation: Conduct experiments with different frequencies and vibration modes to optimize stimulation parameters and confirm activation of the Rcs system.
Educational integration: Expand the BioArt Lab bioprinting curriculum by developing additional approaches to manipulate printed E. coli images. Make the technology accessible: devices are assembled from inexpensive components, and the housing is 3D printed in the fab lab (low barrier to entry).
Art project: Present the device at the Art & Science exhibition. Develop a vibration pattern that converts a sound signal into mechanical action on bioprinted E. coli images.
Community: To expand the course’s audience beyond the university by engaging external audiences interested in bioart and citizen science.
Aim 3: Visionary Aim
Potential for biosensors: Potential for biosensors: This approach can be applied to the creation of mechanical impact detection systems and methods for monitoring biofilms in technical systems by selecting an acoustic impact.
4D Bioprinting Expansion: The concept of “analog biological post-processing” complements the idea of 4D bioprinting: a 3D-printed structure + time-dependent transformation under the influence of acoustic stimuli. This opens up the possibility of creating adaptive systems that change their state under the influence of external factors.
Mechanotransduction as a tool: Mechanotransduction on surfaces can become a tool for controlling the architecture of living material, applicable in environmental monitoring and optimization of biotechnical systems.
SECTION 3: BACKGROUND
Murphy, M. F., Edwards, T., Hobbs, G., Shepherd, J., & Bezombes, F. (2016). Acoustic vibration can enhance bacterial biofilm formation. Journal of bioscience and bioengineering, 122(6), 765-770.
In this study, published in the Journal of Bioscience and Bioengineering, the scientists demonstrated that low-frequency acoustic vibration can significantly enhance biofilm formation in the bacteria Pseudomonas aeruginosa and Staphylococcus aureus. To do this, they developed a speaker-based system that transmitted vibration to the bottom of a Petri dish containing liquid culture. Exposure to vibration at frequencies of 100, 800, and 1600 Hz for 48 hours led to a significant increase in the number of cells and biofilm biomass, with each bacterial species having its own optimal frequency range. This research is of key importance because it was the first to show that vibration could serve as a new, potentially inexpensive tool for controlling biofilm growth in medical and industrial processes.
Bazzoli, D. G., Mahmoodi, N., Verrill, T. A., Overton, T. W., & Mendes, P. M. (2024). Nanovibrational stimulation of Escherichia coli mitigates surface adhesion by altering cell membrane potential. ACS nano, 18(44), 30786-30797.
In this study, published in the journal ACS Nano, the scientists applied nanoscale surface vibrations to mechanically stimulate E. coli bacteria and study their effect on adhesion. They used a device based on the inverse piezoelectric effect, which generated vertical vibrations at frequencies of 0.5, 1, and 2 kHz with an amplitude of up to 40 nm. Using laser vibrometry, the authors confirmed that the vibration amplitude increased linearly with increasing voltage and was uniform across the entire sample surface. The experiments revealed that nanovibrational stimulation consistently reduced the ability of E. coli to adhere to surfaces: adhesion decreased on average by 19% at 1 kHz and by 21% at 2 kHz. A key discovery was that vibration alters the membrane potential of the bacterial cell, which directly affects its adhesive properties, and the effect depended primarily on frequency rather than on stimulus intensity. This research represents the cutting edge of science, as it establishes a direct link between physical stimulation, bacterial electrophysiology, and bacterial behavior, and points to a new mechanism for controlling bacterial adhesion.
Ying, J. L., Dayou, J., & Phin, C. K. (2009). Experimental investigation on the effects of audible sound to the growth of Escherichia coli. Modern Applied Science, 3(3), 124.
In this work, published in the journal Modern Applied Science, the direct effect of audible sound on the growth of E. coli on solid nutrient medium (agar) was studied. The researchers exposed the bacteria to pure tone sound at frequencies of 1, 5, and 15 kHz. The results showed that all selected frequencies promoted the growth of E. coli, with the most significant increase in cell number (by 34%) observed at a frequency of 5 kHz. It is important to note that the stimulating effect was recorded both in liquid and on solid nutrient medium.
Novel and Innovative Aspects of the Project
The novelty of the project lies in the study of acoustic stimulation of bacteria on solid nutrient medium in the sub-kilohertz frequency range (500 Hz and 1000 Hz). Although a few studies have demonstrated the effect of sound on E. coli growth on agar, the vast majority of research has focused on liquid cultures. Existing articles typically investigate bacterial removal using ultrasound. The Vibrimage project, in contrast, proposes to explore how bacterial growth can be modulated using acoustic vibration. Moreover, the DNA construct design — P_rprA (promoter) — B0034 (RBS) — mScarlet-I (reporter) — B0015 (terminator) — can, through fluorescence, indicate zones of active acoustic impact, which has potential for the development of biosensor applications.
The experiment I conducted on bioprinting E. coli bacteria onto agar medium
SECTION 4: EXPERIMENTAL DESIGN, TECHNIQUES, TOOLS, AND TECHNOLOGY
Experiment
Print an image of E. coli bacteria on agar using a bioprinter. – Incubate for 2 hours to allow adaptation and entry into the active growth phase.
Exposure to 500 Hz, amplitude 1–10 μm during the active growth phase.
Exposure to 5 kHz, 0.25–5 μm during the active growth phase.
Control: no frequency exposure.
Using ImageJ, determine: areas of greatest fluorescence from acoustic vibration, area of bacterial growth.
Device
3 vibrating speakers
Amplifiers
Signal generator
Power supply
Accelerometers for fine-tuning transmitted power
App for monitoring audio parameters
Endo agar (5.5 mm) – Biomorphic device casing made of photopolymer resin
– Metal plates for Petri dishes
– Radiators and fan
The experiment I conducted on bioprinting E. coli bacteria onto agar medium
Techniques Used
Bioethical Considerations
Bioproduction
Bacterial Culturing
Quality Control/Analysis
Bacterial Processing (e.g., Centrifugation, Lysis, DNA Purification)
DNA Construct Design
Databases (e.g., GenBank, NCBI, Ensembl, and UCSC Genome Browser)
Gibson Assembly
Use of Benchling
Databases
Technique Expansion
Use of Benchling
“I would use Benchling to design, visualize, and annotate my DNA construct. This platform allows me to create detailed plasmid maps with color-coded features (promoter, RBS, CDS, terminator) and verify the correct assembly of genetic parts. Benchling also enables me to export sequences in various formats for future ordering or cloning. Additionally, I can share my design with collaborators and maintain detailed records of my construct design process.”
Databases
“I would utilize databases such as NCBI and the iGEM Registry of Standard Biological Parts to obtain verified sequences for my genetic components. For example, I retrieved the B0034 RBS and B0015 terminator sequences from the iGEM Registry, and found the mScarlet-I sequence from NCBI. These databases ensure that I am using well-characterized parts with known functionality. This approach increases the reliability and success rate of my synthetic biology project.”
SECTION 5: Results & Quantitative Expectations
I validated the DNA construct design required for my project, as well as performed experimental testing of bioprinting and technical device assembly. In Benchling, I created the reporter cassette P_rprA — B0034 — mScarlet-I — B0015 and simulated its assembly into a plasmid vector. Additionally, real experiments were conducted to print E. coli bacteria using a bioprinter and to debug the technical setup for acoustic exposure. These steps confirmed the feasibility of the project.
DNA construct design
SECTION 6: ADDITIONAL INFORMATION
Murphy, M. F., Edwards, T., Hobbs, G., Shepherd, J., & Bezombes, F. (2016). Acoustic vibration can enhance bacterial biofilm formation. Journal of bioscience and bioengineering, 122(6), 765-770.
Bazzoli, D. G., Mahmoodi, N., Verrill, T. A., Overton, T. W., & Mendes, P. M. (2024). Nanovibrational stimulation of Escherichia coli mitigates surface adhesion by altering cell membrane potential. ACS nano, 18(44), 30786-30797.
Ying, J. L., Dayou, J., & Phin, C. K. (2009). Experimental investigation on the effects of audible sound to the growth of Escherichia coli. Modern Applied Science, 3(3), 124.
Gu, S., Zhang, Y., & Wu, Y. (2016). Effects of sound exposure on the growth and intracellular macromolecular synthesis of E. coli k-12. PeerJ, 4, e1920.
Li, Z., Zhu, Y., Zhang, W., & Mu, W. (2024). Rcs signal transduction system in Escherichia coli: Composition, related functions, regulatory mechanism, and applications. Microbiological Research, 285, 127783.
Bindels, D. S., Haarbosch, L., Van Weeren, L., Postma, M., Wiese, K. E., Mastop, M., … & Gadella Jr, T. W. (2017). mScarlet: a bright monomeric red fluorescent protein for cellular imaging. Nature methods, 14(1), 53-56.