Week 10 HW: Advance imaging & Measurement technology
WEEK 10 HW
Homework is based on data that will be generated in the Waters Immerse Lab in Cambridge, MA. Students will be characterizing green fluorescent protein (eGFP, a recombinant protein standard) structure (primary, secondary/tertiary) in the lab using liquid chromatography and mass spectrometry. Data generated in the lab will be available on-line for Committed Listeners.
Homework: Final Project
Before I decide what to measure I need to:
Decide which types of substrates or food or environmental contaminants I want to use for training my mycelium with. We will train it naturally to degrade a variety of different types of petroleum derived polymers and environmental contaminants but also synthetically through DNA sequencing and optimising the enzymatic degradation process through gene editing technologies and methods.
Decide which types of mycelium I am going to use for my experiment based on the type of contaminants or petroleum derived polymers I want my mycelium to remediate. I need to pick at least a strain that already has the capability of degrading petroleum derived polymers, one strain that is not particularly able to break down contaminants (for engingeering and optimising the enzymatic degradation pathways) and one that can break down other types of enviromental pollutants or contaminants like heavy metals.
The hypothesis is that we can measure the bioremediation process through looking into the enzymatic degradation process and the action potential (electrical activity) of mycelial growth/networks using different types of stimulation (aka food or substrates, contaminants etc). Enhancing or introducing plastic-degrading enzyme pathways—through selective exposure or through genetic modification will alter metabolic activity and produce distinct electrophysiological patterns that can be used as control inputs for actuating a soft robotic system.
For my final project in this weeks homework
Please identify at least one (ideally many) aspect(s) of your project that you will measure. It could be the mass or sequence of a protein, the presence, absence, or quantity of a biomarker, etc.
+action potential (electrical charge) +extracellular enzymes (mass spectrometry) +DNA sequencing, amplification and editing to optimise extracellular pathways during mycoremediation of synthetic petroleum derived polymers (LDPE)
Please describe all of the elements you would like to measure, and furthermore describe how you will perform these measurements.
I need to learn how to DNA sequence specific fungal strains and look into how mass spectrometry can help me understand how mycelium interact and talk. For the extracellular enzymes mass spectrometry is needed.
I need to measure fungi action potential-> μV -> electrical spikes from stimulation and without stimulation.
Action potentials are measured in neuroscience to understand how neurons communicate, as they are the fundamental “language” of the brain. They are brief electrical impulses that travel along neurons, firing in an all-or-none manner to transmit signals, with the frequency of these spikes representing the intensity of stimuli or information. Similarly, Mycelium networks generate action potential-like electrical spikes to communicate environmental changes, such as changes in moisture, nutrients, or physical injury. I found some interesting papers like this one that talks about “Action potentials” in Neurospora crassa, a mycelial fungus.
I want to measure the environmental response or Stimulation: Electrical activity increases in frequency when the mycelium is stimulated with attractive resources (wood) or stressors (salt, chemical agents).
- Technologies used to carry out my final project (e.g., gel electrophoresis, DNA sequencing, mass spectrometry, etc.)? Describe in detail.
For cultivation: Cultivation of mycelia using a variety of scaffolds, substrates and contaminants.
For optimising enzymatic degradation pathways: Mass spectrometry, DNA sequencing, amplification and editing.
For the fabrication of the robot: digital fabrication (technical drawing and 3D modeling on Rhinoceros, 3D printing)
For the sensing part and actuation of the soft robot: capture activity via electrodes, to interface and translate these signals into actuation with microcontroller-driven soft robotic systems.
Homework: Waters Part 1 — Molecular Weight
*We will be analyzing an eGFP standard onto a BioAccord LC-MS system to determine the molecular weight of intact eGFP and observe its charge state distribution in the denatured (unfolded) state. The conditions for LC-MS analysis of intact protein cause it to unfold and be detected in its denatured form (due to the solvents and pH used for analysis).
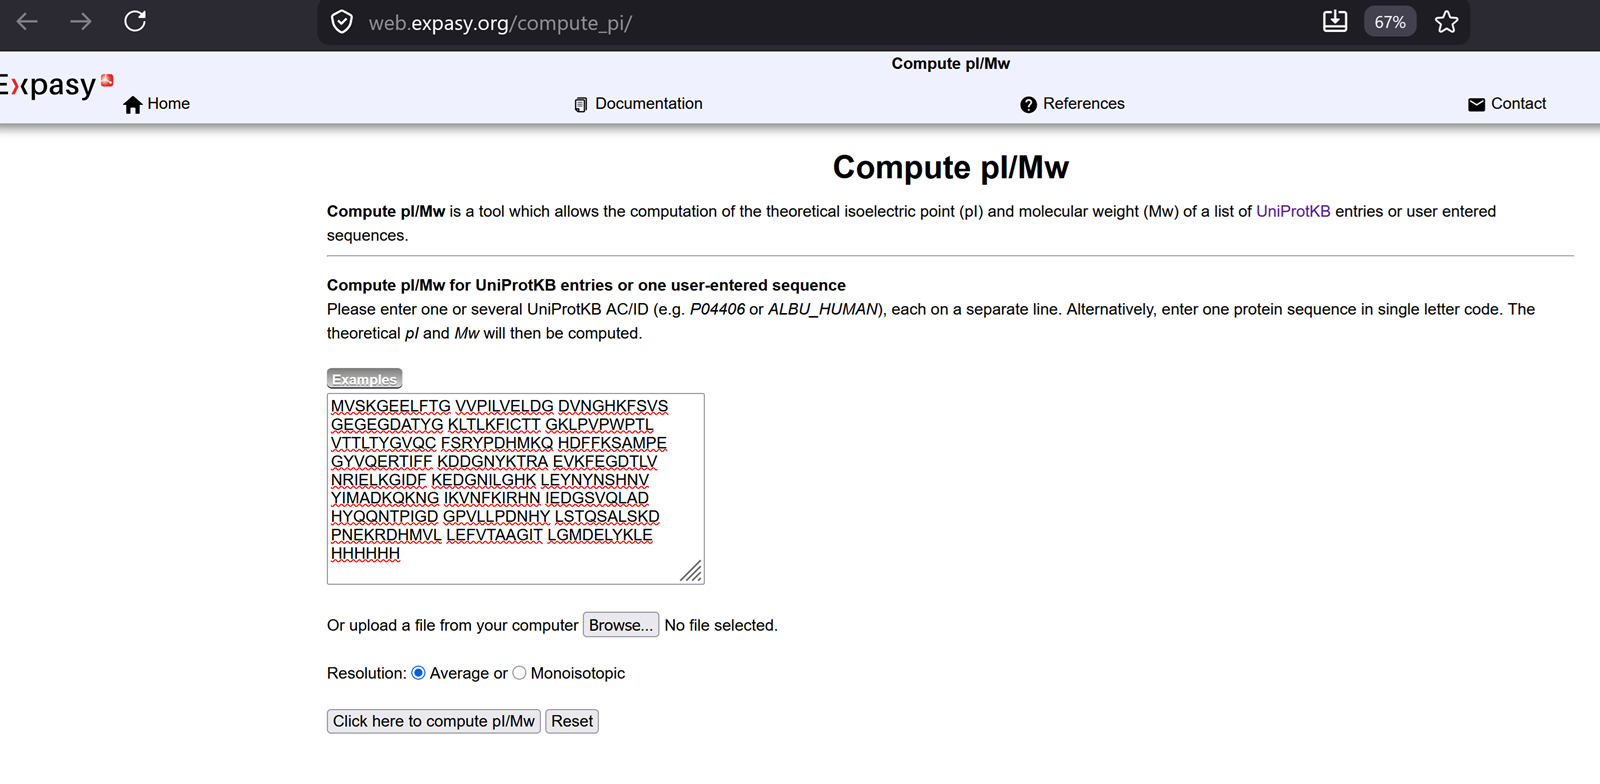
- Based only on the predicted amino acid sequence of eGFP (see below), what is the calculated molecular weight? You can use an online calculator like the one at expasy.org.
From the recitation-> notes to remember on how to calculate the theoritical molecular weight of eGFP.
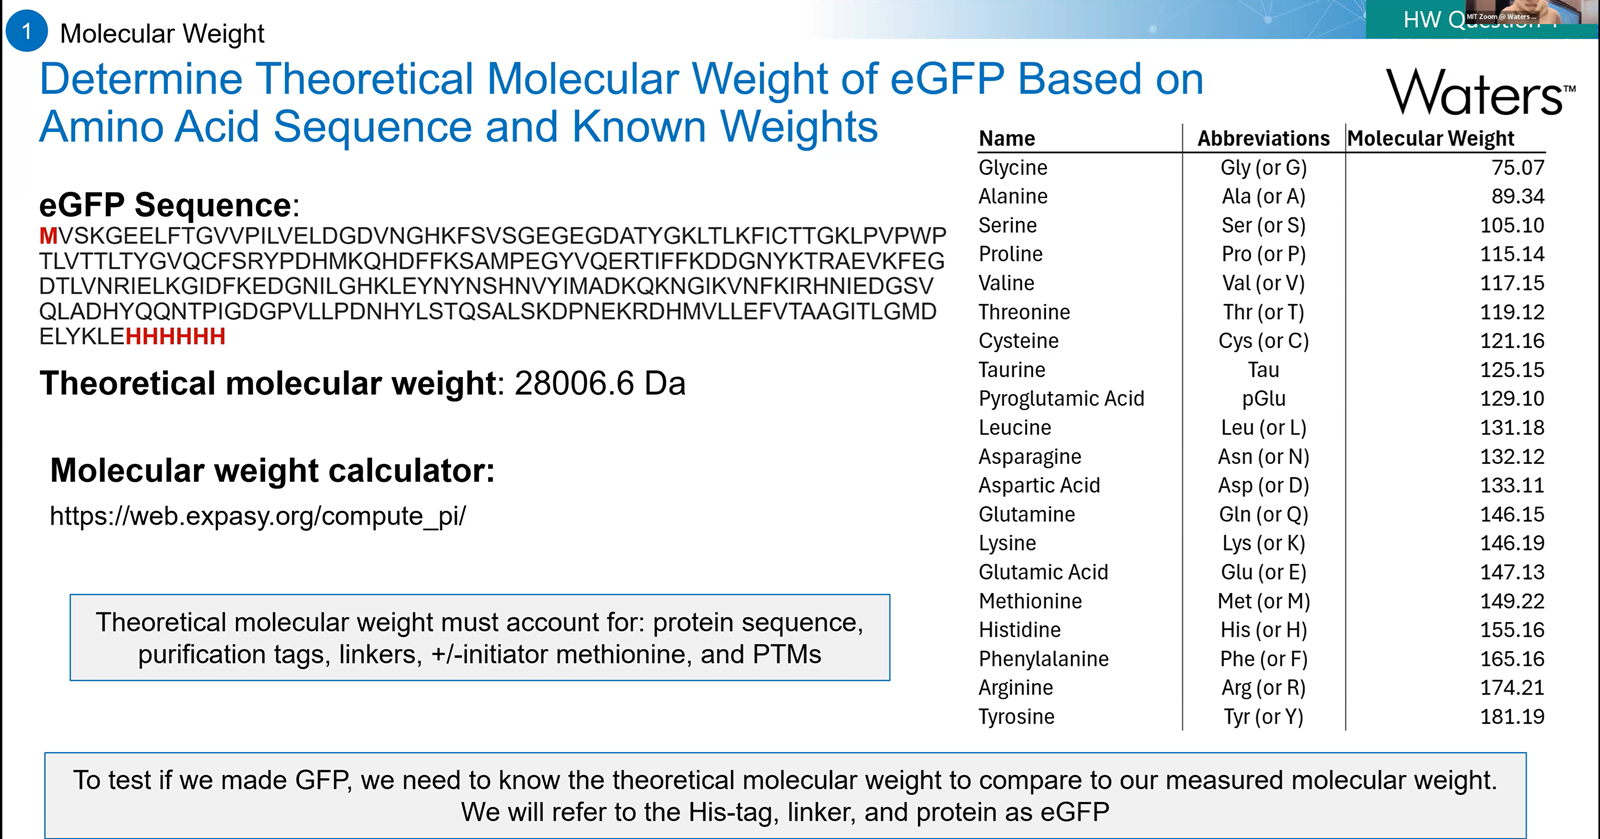
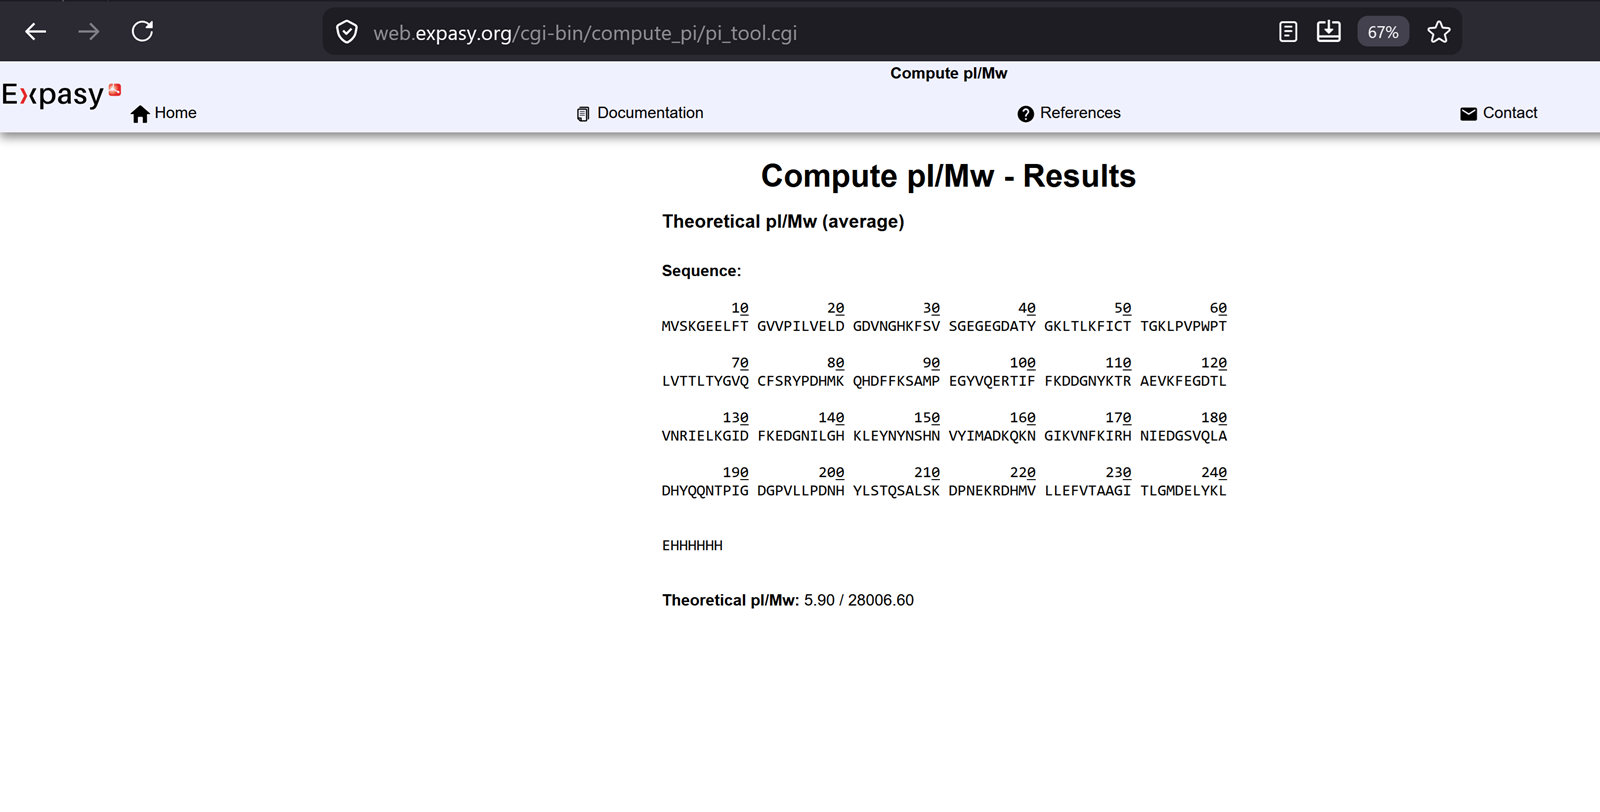
The molecular weight of eGFP with added linker and His-tag is 28006.60 Da.
Soooo there is a trick here!
Calculate the molecular weight of the eGFP using the adjacent charge state approach described in the recitation. Select two charge states from the intact LC-MS data (Figure 1) and:
i. Determine z for each adjacent pair of peaks (n, n+1) using:
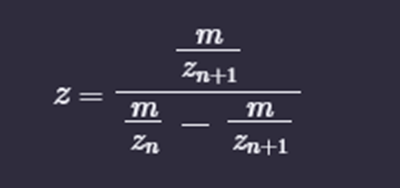
875.4421 / [903.7148 - 875.4421] = 875.4421 / 28.2727 = 30.9642
z = 30.9642
Rounding to the nearest integer, the charge state for the 903.7 peak is 31, and the 875.4 peak is 32+.
ii. Determine the MW of the protein using the relationship between m/zn, MW and Z.
Using 875.4421:
MW = (875.4421 * 32) - (32 * 1.0078) MW = 28,014.15 - 32.25 Calculated MW: 27,981.90 Da
iii. Calculate the accuracy of the measurement using the deconvoluted MW from 2.2 and the predicted weight of the protein from 2.1 using:
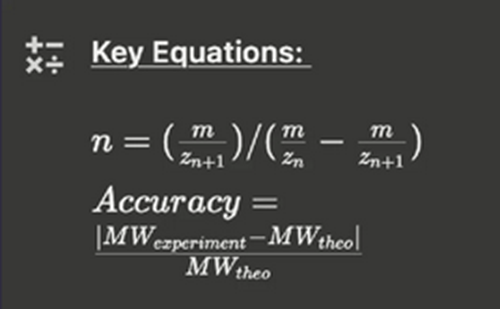
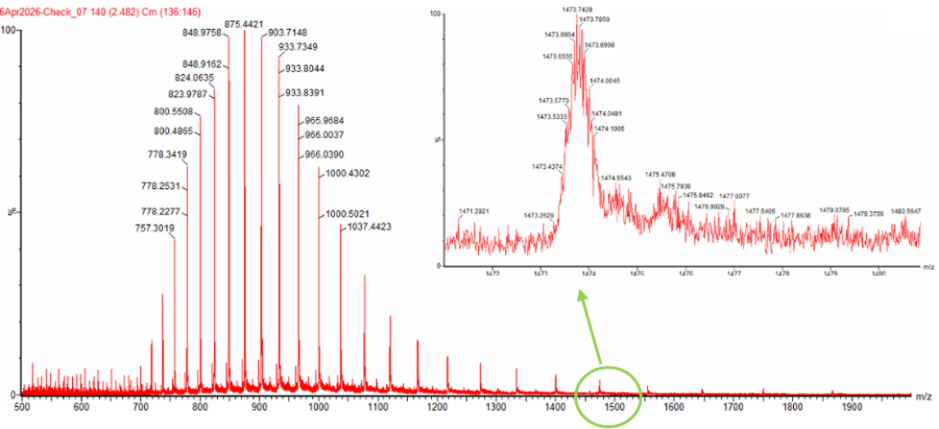
Figure 1. Mass Spectrum of intact eGFP protein from the Waters BioAccord LC-MS (a mass spectrometer with 10,000 resolution) with individual charge state peaks labeled with m/z values.
Error = [|27,981.90 - 27,988.97| / 27,988.97] * 1,000,000 Accuracy: 252.6 ppm
- Can you observe the charge state for the zoomed-in peak in the mass spectrum for the intact eGFP? If yes, what is it? If no, why not?
No because the charge state cannot be determined for the zoomed-in peak from this figure alone. In order to determin the charge state we need at least two adjacent peaks, so their spacing can be used to calculate z. In the zoomed region, only a single isolated peak is shown and no neighboring charge-state peak is visible.
Homework: Waters Part 2 — Secondary/Tertiary structure
We will be analyzing eGFP in its native, folded state and comparing it to its denatured, unfolded state on a quadrupole time-of-flight MS. We will be doing MS only analysis (no liquid chromatography) on the Xevo G3-QToF MS.
- Based on bonus learnings in the lab, please explain the difference between native and denatured protein conformations. For example, what happens when a protein unfolds? How is that determined with a mass spectrometer? What changes do you see in the mass spectrum between the native and denatured protein analyses (Figure 2)?
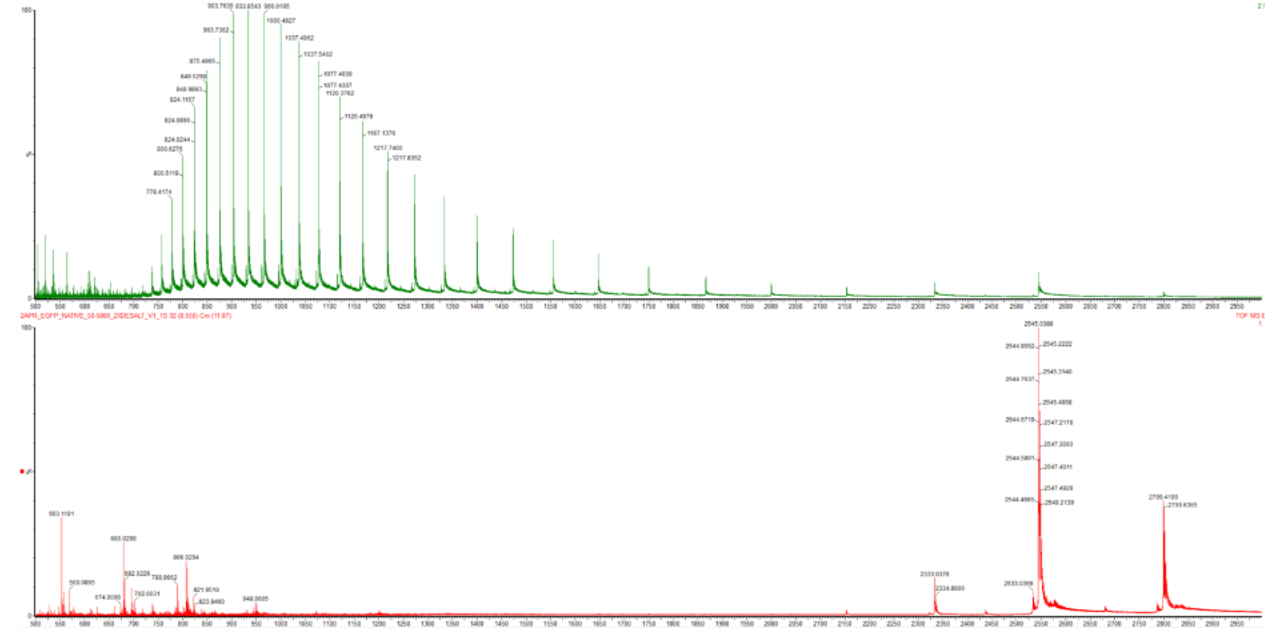
Figure 2. Comparison of the mass spectra between denatured (top) and native (bottom) eGFP standard on the Waters Xevo G3 QTof MS.
In the native state -> eGFP stays folded and compact, so it has fewer exposed protonation sites and usually carries fewer charges, which gives peaks at higher m/z.
In the denatured state -> the eGFP protein unfolds, exposes more basic sites, and picks up more charges, so the spectrum shifts to a broader charge-state distribution at lower m/z.
- Zooming into the native mass spectrum of eGFP from the Waters Xevo G3 Q-Tof MS (see Figure 3), can you discern the charge state of the peak at ~2800 m/z? What is the charge state? How can you tell?
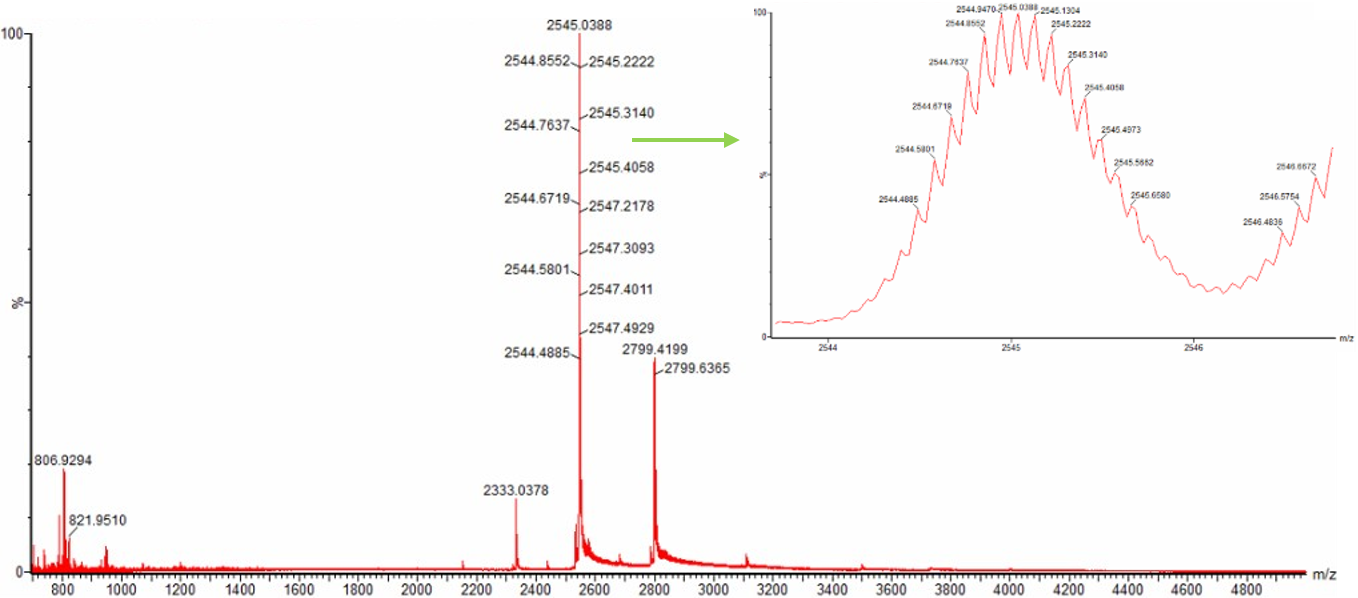
Figure 3. Native eGFP mass spectrum from the Waters Xevo G3 Q-Tof MS. The inset is a zoomed-in view of the charge state at ~2800 on a mass spectrometer with 30,000 resolution.
At 2800 m/z the charge state is 10.
Homework: Waters Part 3 — Peptide Map Work - primary structure
We will be digesting eGFP protein standard into peptides using Trypsin (an enzyme that selectively cleaves the peptide bond after Lysine (K) and Arginine (R) residues. These peptides, resulting from the digested eGFP will be analyzed by LC-MS to measure their molecular weight and to fragment them to confirm the amino acid sequence within each peptide – generating a Peptide Map. This process is used to confirm the primary structure of the protein.
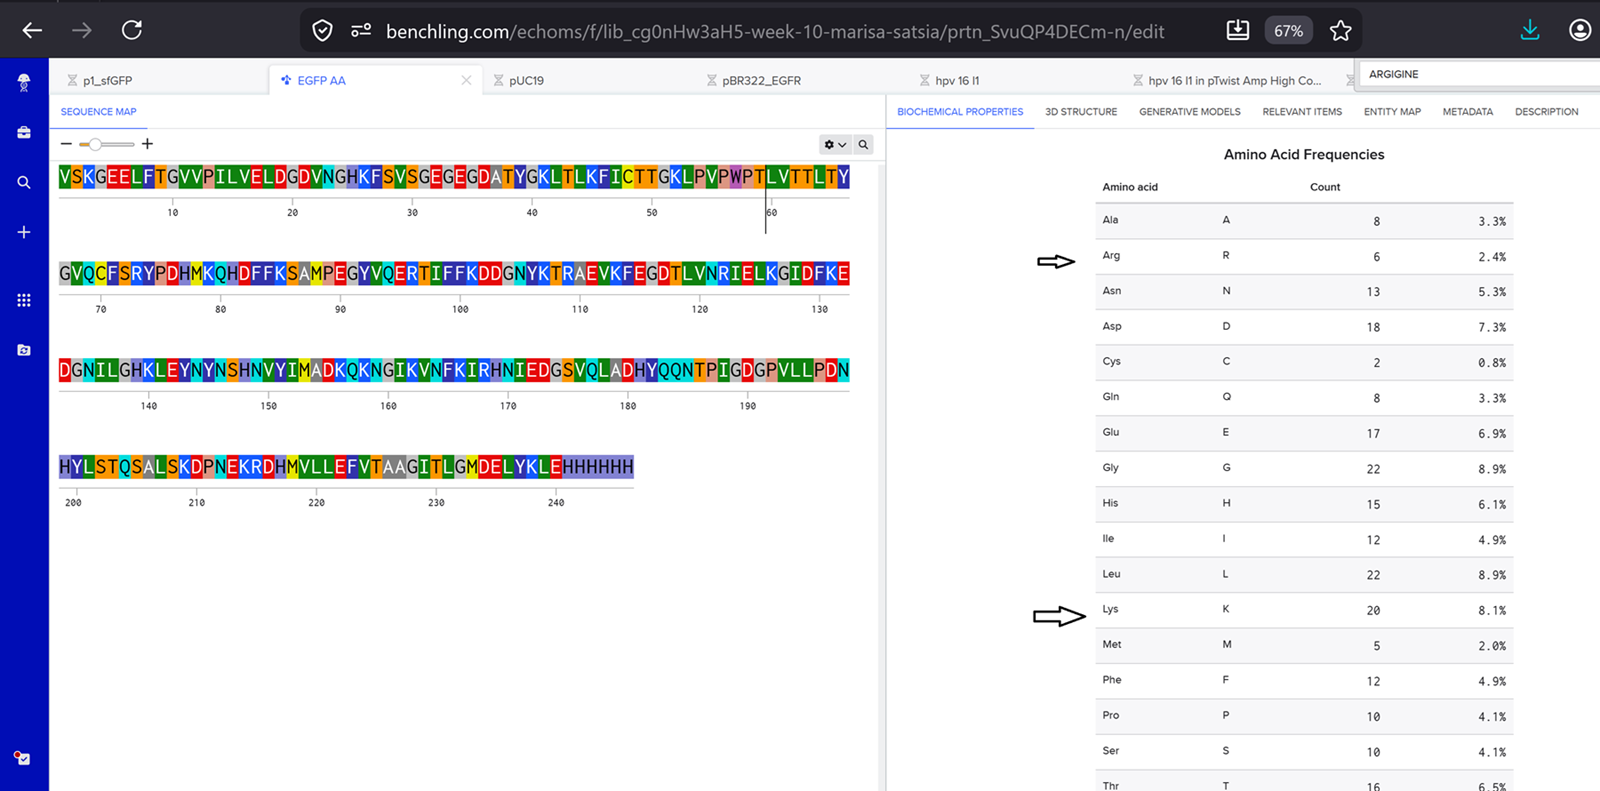
- How many Lysines (K) and Arginines (R) are in eGFP? Please circle or highlight them in the sequence listed above. (note: Adding the sequence to Benchling as an amino acid file and clicking biochemical properties tab will show you a count for each amino acid).
I found 6 lysines(K) and 20 Arginines(R) in eGFP.
There are a variety of tools available online to calculate protein molecular weight and predict a list of peptides generated from a tryptic digest. We will be using tools within the online resource Expasy (bioinformatics resource portal of the SIB Swiss Institute of Bioinformatics) to predict a list of tryptic peptides from eGFP.
How many peptides will be generated from Tryptic digestion of eGFP?
 i. Navigate to https://web.expasy.org/peptide_mass/
 ii. Copy/paste the sequence above into the input box in the PeptideMass tool to generate expected list of peptides.
 iii. Use Figure 2 below as a guide for the relevant parameters to predict peptides from eGFP.
I chose the relevant parameters to predict peptides from eGFP.
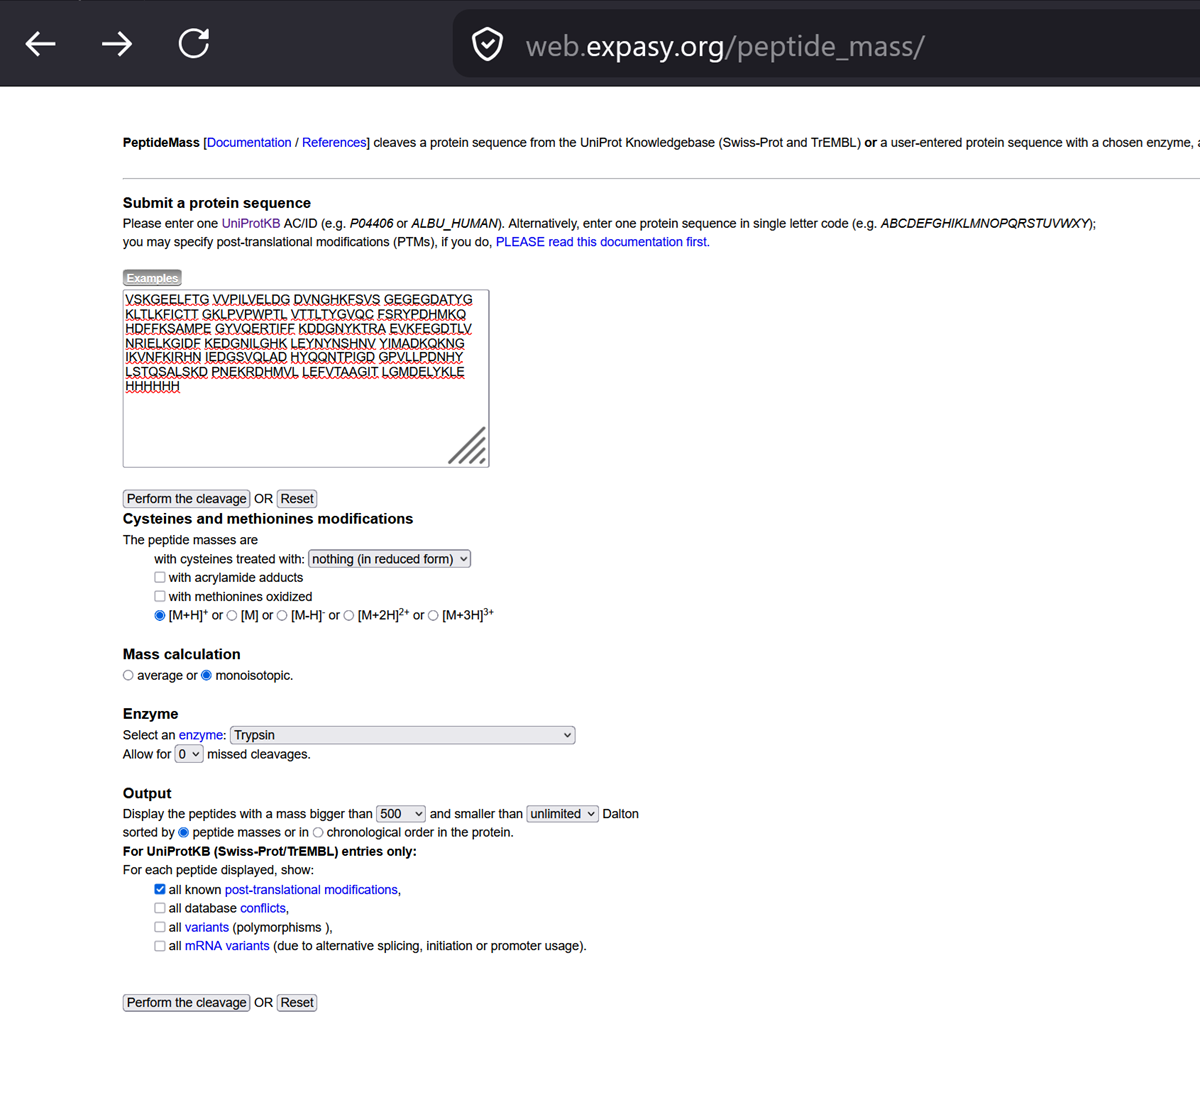
Figure 2. Example conditions for predicting the number of tryptic peptides from eGFP standard. Please replicate all parameters shown above.
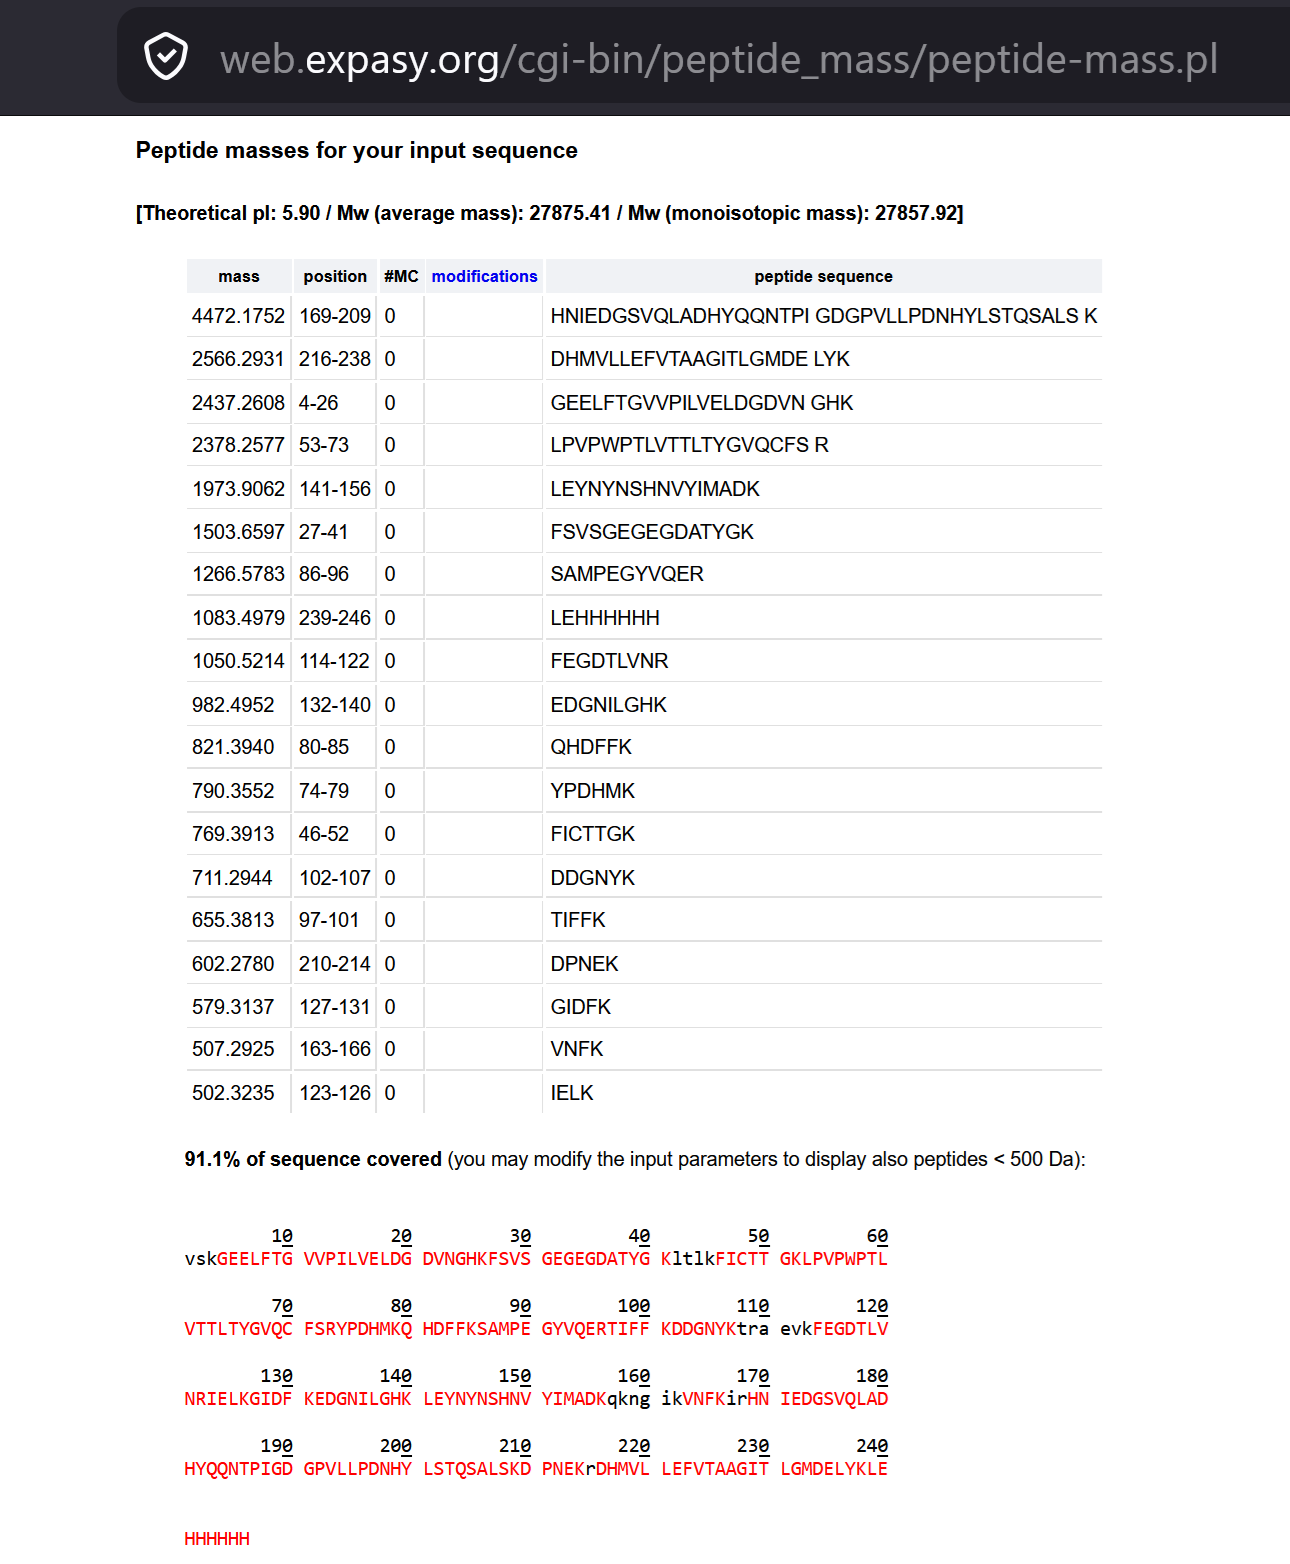
iv. Click “Perform the Cleavage” button in the PeptideMass tool and report the number of peptides generated when using Trypsin.
- Based on the LC-MS data for the Peptide Map data generated in lab (please use Figure 3a as a reference) how many chromatographic peaks do you see in the eGFP peptide map between 0.5 and 6 minutes? You may count all peaks that are >10% relative abundance.
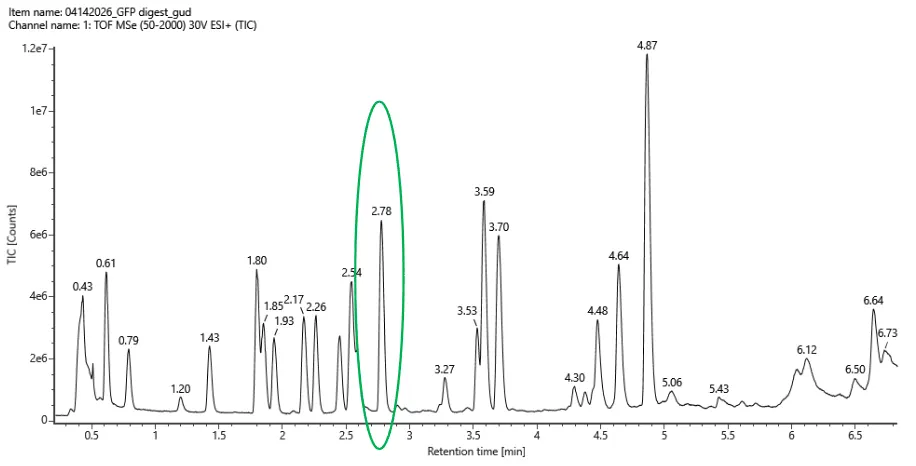
Figure 3a. Example LC-MS Chromatogram for eGFP Peptide Map. The peak at 2.78 minutes is circled, and its MS data is shown in the mass spectrum in Figure 3b, below.
I counted 19 peaks before counging all peaks that are >10% relative abundance. The highest peak is at 4.78 minutes in which in which the counts are 1.2e7.
- Assuming all the peaks are peptides, does the number of peaks match the number of peptides predicted from Step 2.3 and 2.4? Are there more peaks in the chromatogram or fewer?
There are only 19 peaks or peptides generated from expasys above in steps 2.3 and 2.4. In the chromatogram we can see more peaks but we should only cound the >10% relative abundance. The little spikes have to do with impurities in the sample. Linsday mentioned even something from your hair or fingernails even when you are wearing gloves could add impurities to the mix.
- Identify the mass-to-charge (m/z) of the peptide shown in Figure 3b. What is the charge (z) of the most abundant charge state of the peptide (use the separation of the isotopes to determine the charge state). Calculate the mass of the singly charged form of the peptide ([M+H]+) based on its m/z and z.
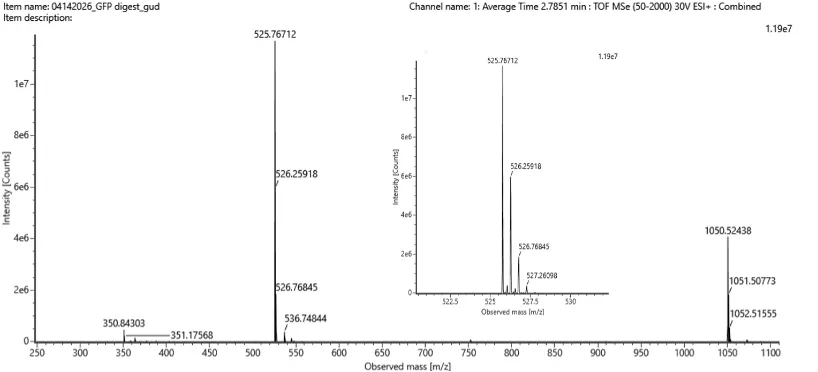
Figure 5b. Mass spectrum figure to show m/z for the chromatographic peak at 2.78 min from Figure 5a above. The inset is a zoom-in of the peak at m/z 525.76, to discern the isotope peaks.
The most prominent peak in Figure 3b is at m/z 525.76712. From the other zoomed-in inset in the image, the m/z values of two adjacent major isotopic peaks are approximately 525.76712 and 526.25918.
m/z= 525.76712
The difference between these values is 526.25918-525.76712 = 0.492
z= 0.492 -> 0.5
Singly Charged Mass (MH+): (525.767 * 2) - 1.0078 = 1050.53 Da.
- Identify the peptide based on comparison to expected masses in the PeptideMass tool. What is mass accuracy of measurement? Please calculate the error in ppm.

Comparing the mass to the predicted list, the peptide is FEGDTLVNR (Theoretical MH+ = 1049.52 Da).
What is the percentage of the sequence that is confirmed by peptide mapping? (see Figure 6)
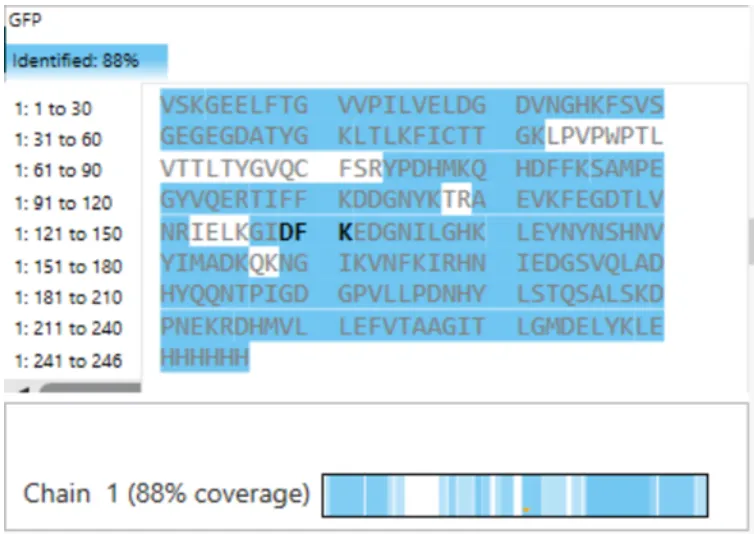
Figure 6. Amino Acid Coverage Map of eGFP based on BioAccord LC-MS peptide identification data.
It is 88%.
Homework: Waters Part IV — Oligomers
We will determine Keyhole Limpet Hemocyanin (KLH)’s oligomeric states using charge detection mass spectrometry (CDMS). CDMS single-particle measurements of KLH allow us to make direct mass measurements to determine what oligomeric states (that is, how many protein subunits combine) are present in solution. Using the known masses of the polypeptide subunits (Table 1) for KLH, identify where the following oligomeric species are on the spectrum shown below from the CDMS (Figure 7):
Using the given subunit masses below-
| Polypeptide Subunit Name | Subunit Mass |
|---|---|
| 7FU | 340 kDa |
| 8FU | 400 kDa |
Table 1: KLH Subunit Masses
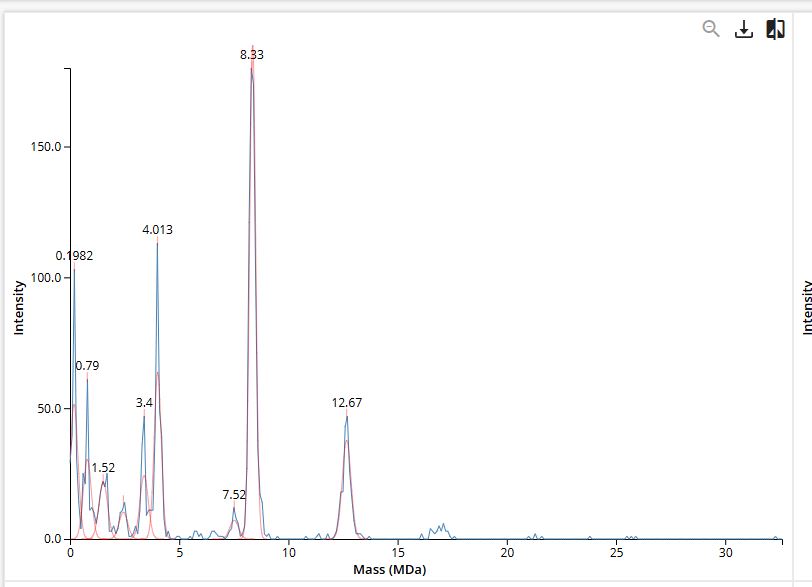
Figure 7. Mass spectrum of Keyhole Limpet Hemocyanin (KLH) acquired on the CDMS.
7FU Decamer = 10×340=3400kDa = 3.4 MDa
8FU Didecamer = 20×400=8000kDa = 8.0 MDa
8FU 3-Decamer = 30×400=12000kDa = 12.0 MDa
8FU 4-Decamer = 40×400=16000kDa = 16.0 MDa
Homework: Waters Part V — Did I make GFP?
Please fill out this table with the data you acquired from the lab work done at the Waters Immerse Lab in Cambridge, or else the data screenshots in this document if you were unable to have lab work done at Waters.
| Theoretical | Observed/measured on the Intact LC-MS | PPM Mass Error | |
|---|---|---|---|
| Molecular weight (kDa) | 28.006 | 27.982 | 252.6 ppm |