Hi, I’m Milenka. I am a biotechnologist from Ecuador, currently working as a Researcher in the Department of Plant Pathology at the University of Minnesota.
I am deeply passionate about research, especially when experiments don’t go as expected, those moments drive my curiosity and push me to ask better questions and find meaningful answers. I enjoy approaching biology with an engineering mindset, designing and building solutions rather than just studying them.
My main interest lies in synthetic biology and its potential to create impactful innovations. In the long term, I aim to develop novel, applied solutions in agriculture, food, or health, and translate scientific knowledge into real-world products that make a difference.
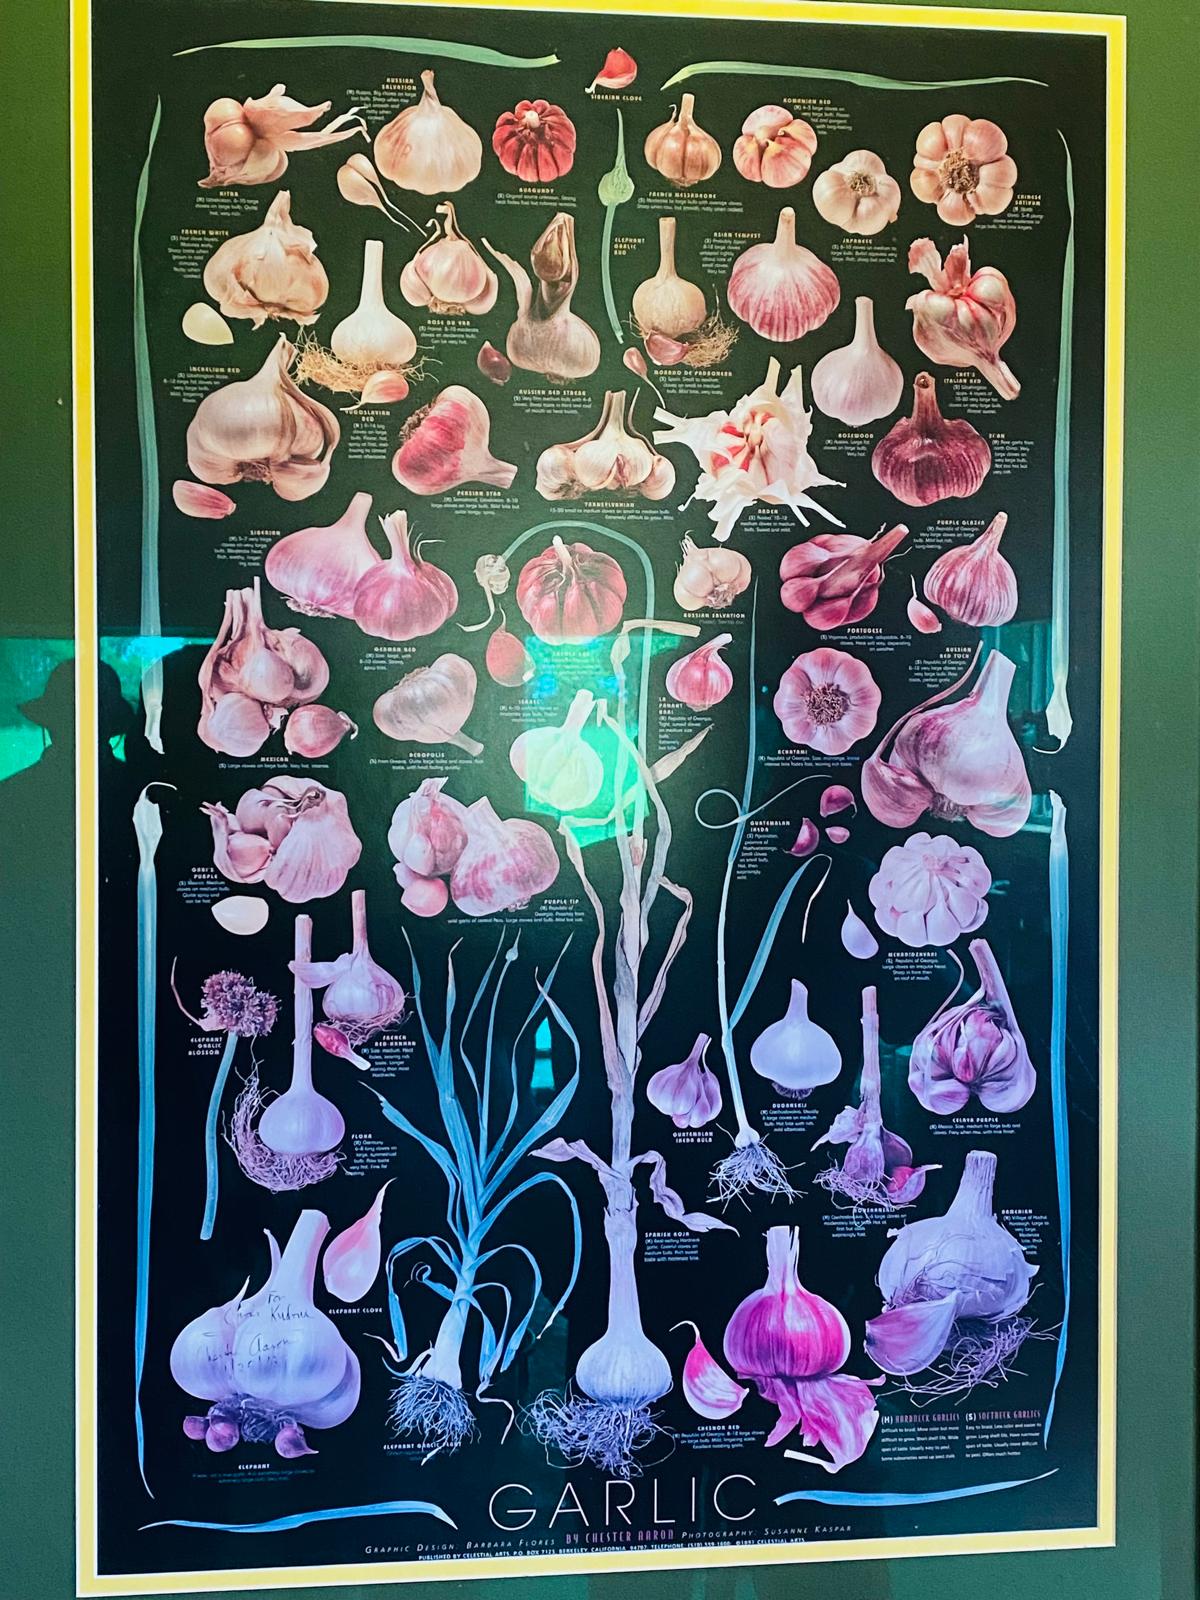
First, describe a biological engineering application or tool you want to develop and why. I am working on the epidemiology and development of management practices of Aster Yellows Phytoplasma (AYP) in the Plant Molecular Virology Laboratory at University of Minnesota. AYP was first detected in garlic in Minnesota in 2012, with outbreaks recorded in 2017 and 2021, and spread to planting material in 2018 and 2022. In 2024, infestations were detected throughout Minnesota. However, there are no precise data on its incidence. AYP is an obligate type of bacteria that resides in the phloem and it is transmitted by leafhoppers. AYP is a concern for production, because there are not available effective treatments for this emergent pathogen in Minnesota’s garlic crops, and current diagnostic methods are time-consuming and costly. There is a need to develop biotechnological tools for the detection and management of this plant pathogen.
My Homework DNA!
Part 1: Benchling & In-silico Gel Art See this week’s lab protocol “Gel Art: Restriction Digests and Gel Electrophoresis” for details. Overview:
Make a free account at benchling.com Import the Lambda DNA. Simulate Restriction Enzyme Digestion with the following Enzymes: EcoRI HindIII BamHI KpnI EcoRV SacI SalI Create a pattern/image in the style of Paul Vanouse’s Latent Figure Protocol artworks. You might find Ronan’s website a helpful tool for quickly iterating on designs!
My Homework DNA!
Assignment: Python Script for Opentrons Artwork Your task this week is to Create a Python file to run on an Opentrons liquid handling robot. Review this week’s recitation and this week’s lab for details on the Opentrons and programming it. Generate an artistic design using the GUI at opentrons-art.rcdonovan.com. Using the coordinates from the GUI, follow the instructions in the HTGAA26 Opentrons Colab to write your own Python script which draws your design using the Opentrons.
My homework DNA!
Part A. Conceptual Questions Answer any NINE of the following questions from Shuguang Zhang: (i.e. you can select two to skip)
How many molecules of amino acids do you take with a piece of 500 grams of meat? (on average an amino acid is ~100 Daltons) Why do humans eat beef but do not become a cow, eat fish but do not become fish? Humans do not become cows or fish after eating them because the proteins we consume are first broken down into their basic components during digestion. Although all living organisms use the same 20 standard amino acids as building blocks of proteins, these proteins are digested into individual amino acids by enzymes such as pepsin in the stomach and trypsin in the small intestine. These amino acids are then absorbed and reused by our cells to synthesize new proteins according to the instructions encoded in human DNA. Therefore, the amino acids from beef or fish are simply raw materials that our bodies use to build human proteins.
My Homework Part 1: Generate Binders with PepMLM Begin by retrieving the human SOD1 sequence from UniProt (P00441) and introducing the A4V mutation. Using the PepMLM Colab linked from the HuggingFace PepMLM-650M model card: Generate four peptides of length 12 amino acids conditioned on the mutant SOD1 sequence. To your generated list, add the known SOD1-binding peptide FLYRWLPSRRGG for comparison. Record the perplexity scores that indicate PepMLM’s confidence in the binders. sp|P00441|SODC_HUMAN Superoxide dismutase [Cu-Zn] OS=Homo sapiens OX=9606 GN=SOD1 PE=1 SV=2 MATKAVCVLKGDGPVQGIINFEQKESNGPVKVWGSIKGLTEGLHGFHVHEFGDNTAGCTS AGPHFNPLSRKHGGPKDEERHVGDLGNVTADKDGVADVSIEDSVISLSGDHCIIGRTLVV HEKADDLGKGGNEESTKTGNAGSRLACGVIGIAQ
My Homework DNA Assembly Answer these questions about the protocol in this week’s lab:
What are some components in the Phusion High-Fidelity PCR Master Mix and what is their purpose? Phusion High-Fidelity PCR master mix contains Phusion DNA polymerase, deoxynucleotides and HF reaction buffer with MgCl2. This master mix is used for long or difficult PCR amplifications and applications where high sequence fidelity is critical, such as cloning, mutagenesis, or amplicon sequencing.
My Homework General homework questions Explain the main advantages of cell-free protein synthesis over traditional in vivo methods, specifically in terms of flexibility and control over experimental variables. Name at least two cases where cell-free expression is more beneficial than cell production. Cell-free protein synthesis offers significant advantages over in vivo systems due to its flexibility and precise control over experimental conditions. Components can be easily added, removed, or adjusted without affecting cell viability, enabling rapid optimization and high-throughput experimentation. This system allows incorporation of non-natural amino acids to create proteins with novel properties, which is difficult in living cells. It is also ideal for producing toxic proteins that would otherwise harm cells. Additionally, cell-free systems are fast, scalable, reproducible, and suitable for prototyping genetic circuits and biosensors, including portable and freeze-dried applications for field use.
Bioproduction lab Post-Lab questions Which genes when transferred into E. coli will induce the production of lycopene and beta-carotene, respectively? Three genes are responsible crtE, crtI, and crtB for the activation of the lycopene pathway and four genes (same as lycopene) plus one more gene crtY for the production of beta-caroteno from Erwinia herbicola in E.coli.
Subsections of Homework
Week 1 HW: Principles and Practices
First, describe a biological engineering application or tool you want to develop and why.
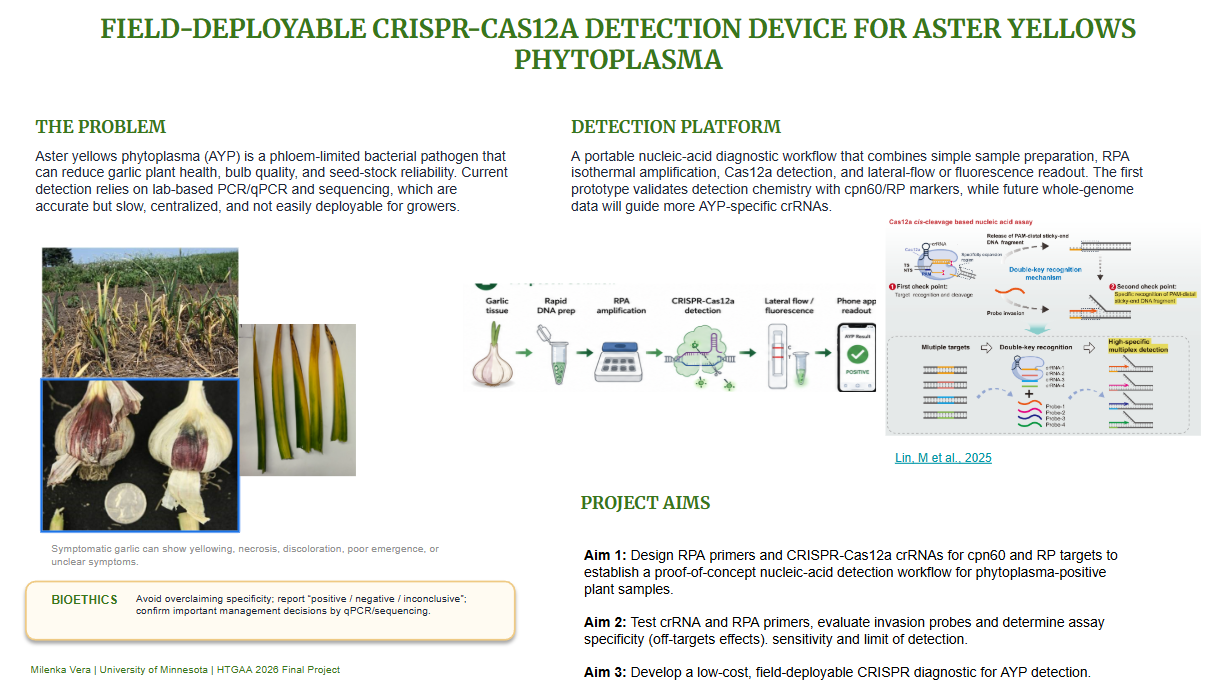
I am working on the epidemiology and development of management practices of Aster Yellows Phytoplasma (AYP) in the Plant Molecular Virology Laboratory at University of Minnesota.
AYP was first detected in garlic in Minnesota in 2012, with outbreaks recorded in 2017 and 2021, and spread to planting material in 2018 and 2022. In 2024, infestations were detected throughout Minnesota. However, there are no precise data on its incidence.
AYP is an obligate type of bacteria that resides in the phloem and it is transmitted by leafhoppers. AYP is a concern for production, because there are not available effective treatments for this emergent pathogen in Minnesota’s garlic crops, and current diagnostic methods are time-consuming and costly. There is a need to develop biotechnological tools for the detection and management of this plant pathogen.
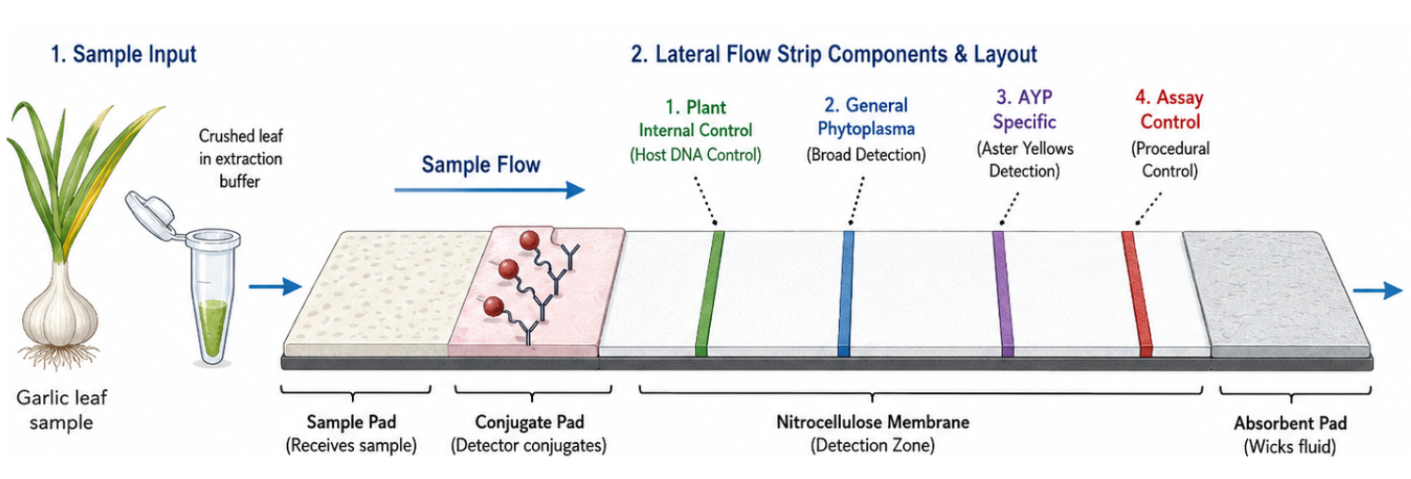
One of the objectives of my research is to develop a low-cost, field-deployable biosensing platform to detect AYP and growers can have access to this test. The idea is to create a platform free of lab equipment, user-friendly, rapid detection and programmable. The biosensor is a cell-free system that integrates a nucleic acid extraction step with minimal sample preparation, a pre-amplification step (multiplexed RPA reaction for internal control and AYP) to improve sensitivity and specificity and detection step by CRISPR Cas12a or Toehold switch technology. Lateral flow assay could be adapted to visualize the results inside of a microfluidic chip or another Point-of-care testing (POCT) device.
The technology will be validated to detect AYP in other potential hosts in Minnesota like grapevines, pennycress and camelina.
Next, describe one or more governance/policy goals related to ensuring that this application or tool contributes to an “ethical” future, like ensuring non-malfeasance (preventing harm). Break big goals down into two or more specific sub-goals. Below is one example framework (developed in the context of synthetic genomics) you can choose to use or adapt, or you can develop your own. The example was developed to consider policy goals of ensuring safety and security, alongside other goals, like promoting constructive uses, but you could propose other goals for example, those relating to equity or autonomy.
The development of field-deployable diagnostic devices has several ethical risk categories that I consider in the policy governance goals and subgoals to promote safety and security in this area.
Prevent economic loss from false results
Describe performance thresholds such as limit of detection “LoD”, specificity and sensitivity that must be met before use in the field. Further validation with additional phytoplasma samples and off-target effects of unrelated species.
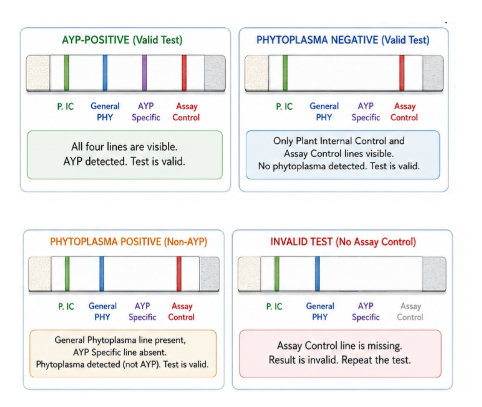
Establish an internal extraction/amplification control lane in every test to differentiate correctly inhibited samples from negative samples.
Confirm results using other detection methods such as qPCR to avoid crop destruction, spread of plant material such as cloves, and unnecessary quarantines.
Determine contamination prevention practices such as workflow separation inside the device.
Establish clear result categories like negative, positive and invalid.
Support equitable access and benefits
Low-cost platform and user-friendly allow farmers, growers and research laboratories to use the platform.
Training materials provided to growers and researchers.
Inform and explain about results, findings and the technology to farmers.
Participation in events, festivals and extension programs, field days to disseminate findings.
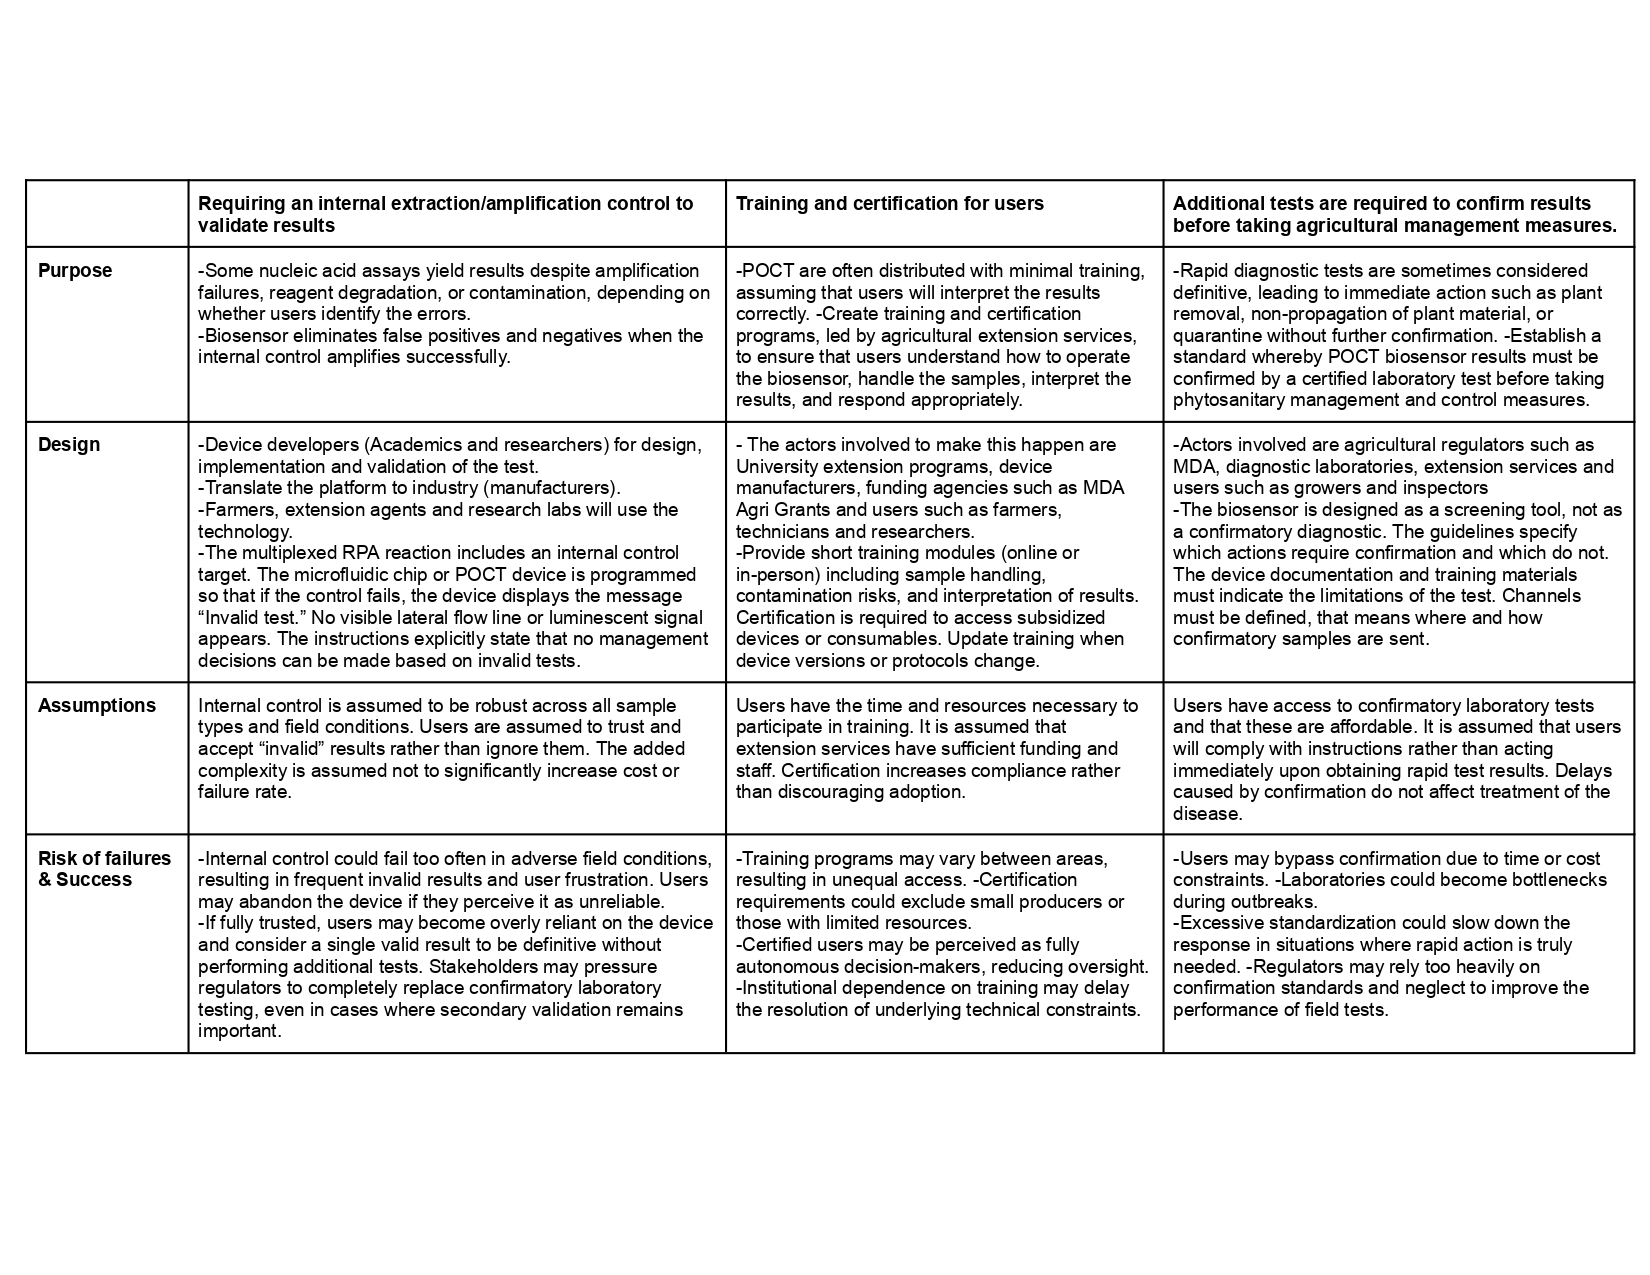
Next, describe at least three different potential governance “actions” by considering the four aspects below (Purpose, Design, Assumptions, Risks of Failure & “Success”). Try to outline a mix of actions (e.g. a new requirement/rule, incentive, or technical strategy) pursued by different “actors” (e.g. academic researchers, companies, federal regulators, law enforcement, etc). Draw upon your existing knowledge and a little additional digging, and feel free to use analogies to other domains (e.g. 3D printing, drones, financial systems, etc.).
Purpose: What is done now and what changes are you proposing?
Design: What is needed to make it “work”? (including the actor(s) involved - who must opt-in, fund, approve, or implement, etc)
Assumptions: What could you have wrong (incorrect assumptions, uncertainties)?
Risks of Failure & “Success”: How might this fail, including any unintended consequences of the “success” of your proposed actions?
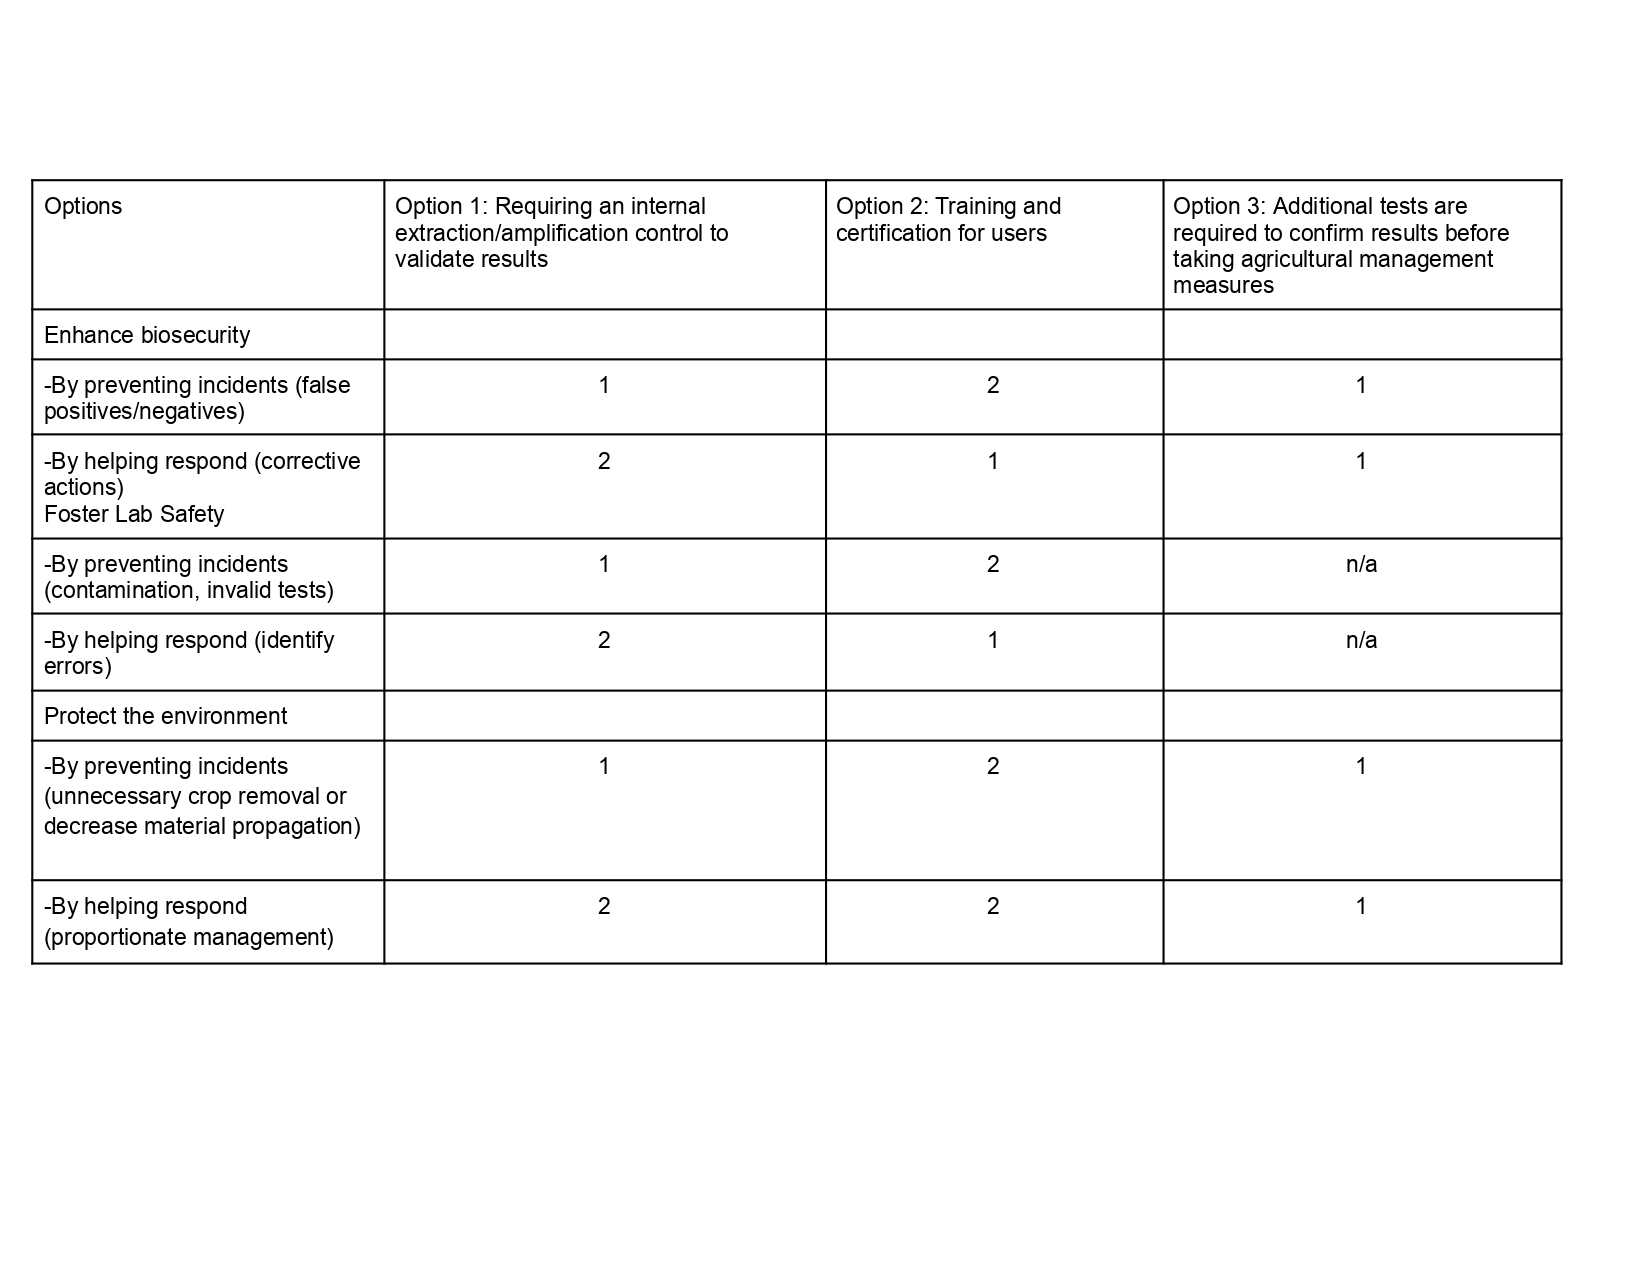
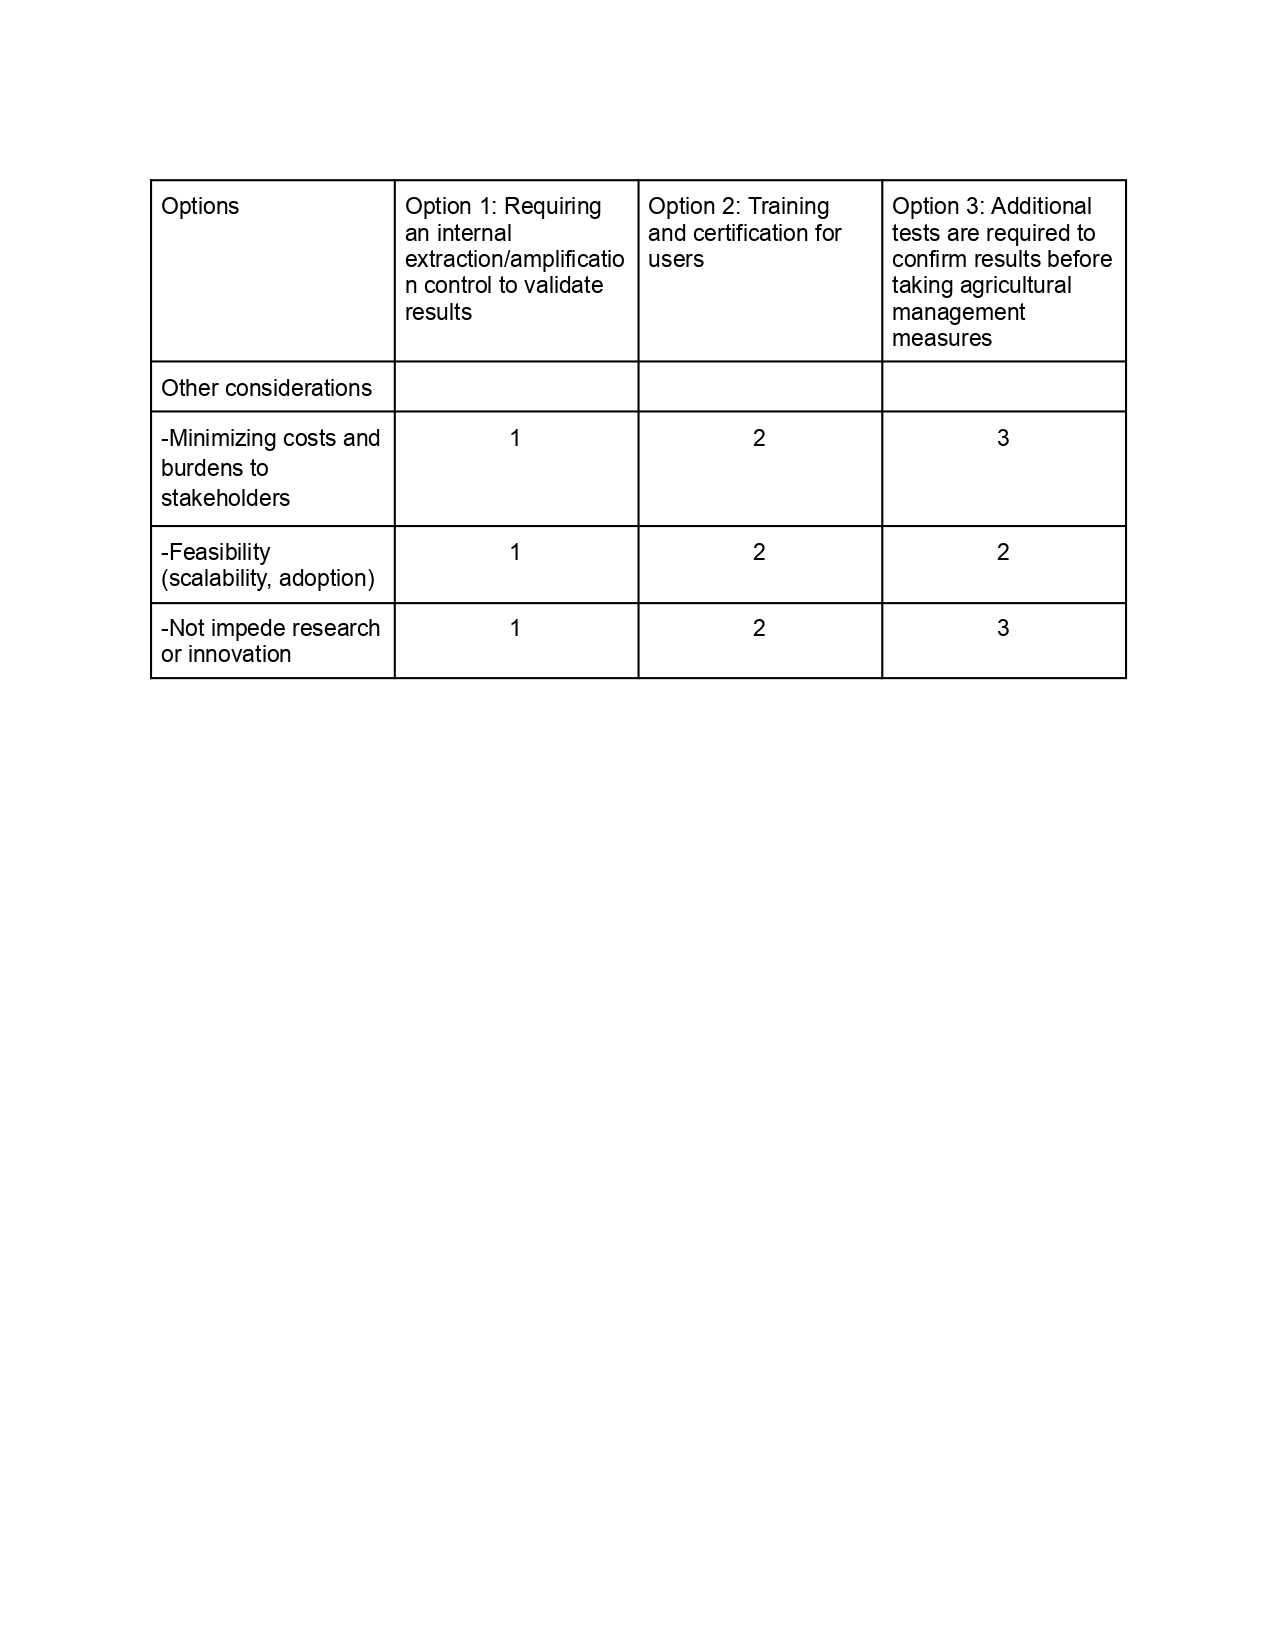
Next, score (from 1-3 with, 1 as the best, or n/a) each of your governance actions against your rubric of policy goals. The following is one framework but feel free to make your own:
Governance Goal 1: Prevent economic loss from false results
Governance Goal 2: Support equitable access and benefits
Last, drawing upon this scoring, describe which governance option, or combination of options, you would prioritize, and why. Outline any trade-offs you considered as well as assumptions and uncertainties. For this, you can choose one or more relevant audiences for your recommendation, which could range from the very local (e.g. to MIT leadership or Cambridge Mayoral Office) to the national (e.g. to President Biden or the head of a Federal Agency) to the international (e.g. to the United Nations Office of the Secretary-General, or the leadership of a multinational firm or industry consortia). These could also be one of the “actor” groups in your matrix.
Reflecting on what you learned and did in class this week, outline any ethical concerns that arose, especially any that were new to you. Then propose any governance actions you think might be appropriate to address those issues. This should be included on your class page for this week.
Based on the scoring analysis, the prioritized governance approach includes Option 1 with Option 3. The internal control supports the goal of preventing economic loss by reducing false negative results. Additional tests such as gold standard qPCR are required to validate results in uncertainty scenarios ensuring proper management practices.
This prioritization involves balancing speed, cost, and confidence. Although confirmatory testing can cause delays and access difficulties, these are justified by the reduction of irreversible economic damage. The approach is based on the assumption that internal controls are robust in field conditions and that the infrastructure for confirmatory testing is accessible through agricultural agencies or extension services. There may be uncertainty in user behavior, particularly in terms of how people respond to invalid results or delays in procedures.
A major ethical concern is the risk of dependence on POCT, where users may consider the results as definitive. To address this issue, it will implement measures such as clear communication of the limitations of the tests and feedback mechanisms to report unexpected results.
Slides Homework
Nature’s machinery for copying DNA is called polymerase. What is the error rate of polymerase? How does this compare to the length of the human genome? How does biology deal with that discrepancy?
Error rate of a proofreading polymerase is around 1 in 10⁶ per base. Considering that the human genome is around 3.2 billion base pairs it will be around 3200 errors in every cell division. There are some different repair mechanisms post replication as MutS mechanism. This protein recognizes and binds regions that were not fixed during replication proofreading.
How many different ways are there to code (DNA nucleotide code) for an average human protein? In practice what are some of the reasons that all of these different codes don’t work to code for the protein of interest?
As we know the genetic code is degenerate, which means one amino acid could be encoded by multiple codons. There are 61 sense codons that encode 20 aa, that means a ratio of 3. An average human protein of 500 aa could have around 3 to the power of 500. There are several reasons all of these different codes do not work to code for the protein. One is that organisms do not use synonymic codons equally, instead preferring some codons rather than others and that depends on tRNA abundance and other factors. mRNA secondary structure and GC content can produce hairpins which affect the availability of ribosomes to translate the protein of interest.
What’s the most commonly used method for oligo synthesis currently?
Gold standard method is Phosphoramidite Chemistry.
Why is it difficult to make oligos longer than 200nt via direct synthesis?
Coupling and capping can fail and produce short sequences which decrease the abundance of full-length molecules and makes it difficult to purify. The larger the oligonucleotide, the more errors accumulate and the lower the percentage of correct oligo size.
Why can’t you make a 2000bp gene via direct oligo synthesis?
For the same reasons of question 2, you will have a lot of truncated molecules with a lot of error accumulations which make it impossible to synthesize a gene.
Choose ONE of the following three questions to answer; and please cite AI prompts or paper citations used, if any.
[Using Google & Prof. Church’s slide #4] What are the 10 essential amino acids in all animals and how does this affect your view of the “Lysine Contingency”?
The essential amino acids are methionine, valine, tryptophan, threonine, lysine, histidine, leucine, arginine, isoleucine, and phenylalanine. Lysine contingency is a term introduced in Jurassic Park to control dinosaurs and states that dinosaurs can survive only if they are supplemented with diets rich in lysine. However, this strategy is unrealistic because dinosaurs that escape could survive by eating other sources of lysine, such as plants and animals.
[Given slides #2 & 4 (AA:NA and NA:NA codes)] What code would you suggest for AA:AA interactions?
[(Advanced students)] Given the one paragraph abstracts for these real 2026 grant programs sketch a response to one of them or devise one of your own:
Week 2 HW: DNA Read, Write, & Edit
My Homework
DNA!
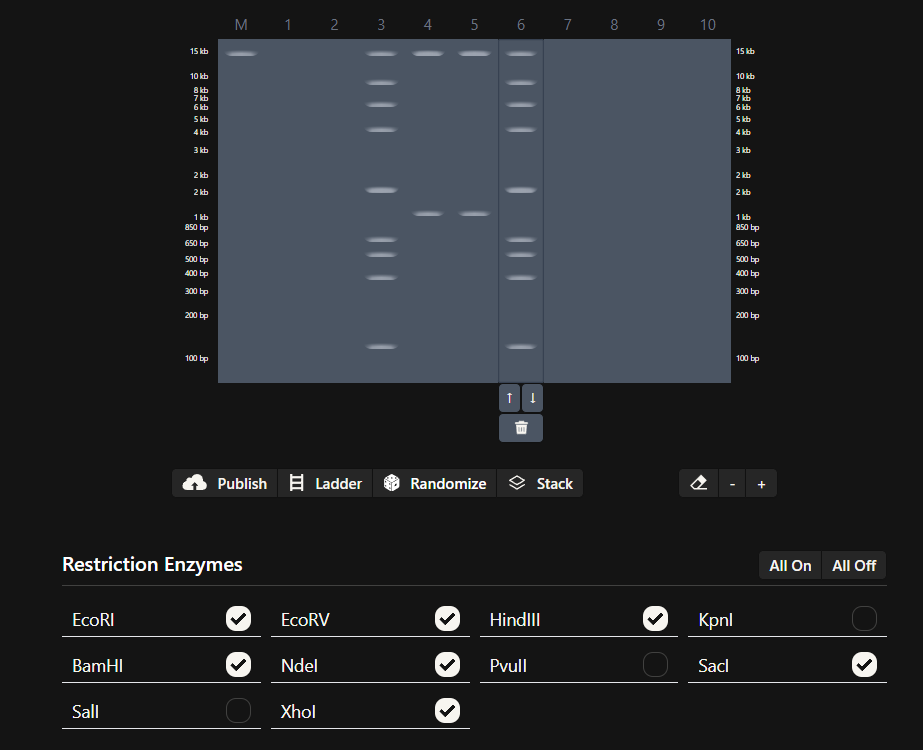
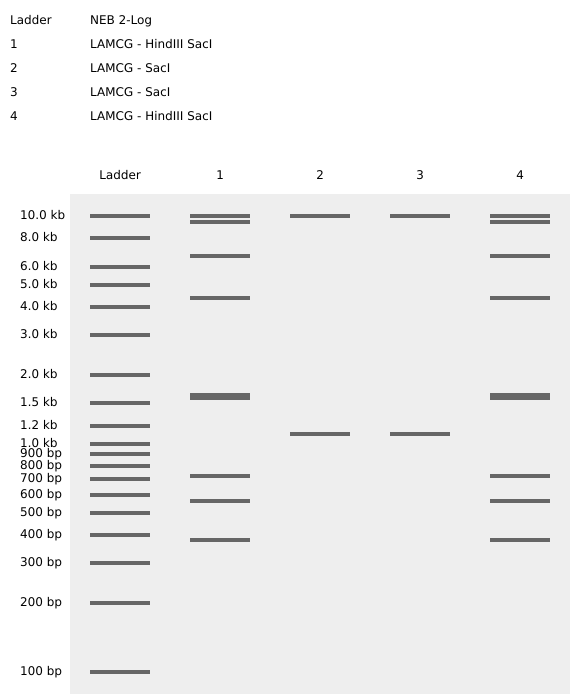
Part 1: Benchling & In-silico Gel Art
See this week’s lab protocol “Gel Art: Restriction Digests and Gel Electrophoresis” for details. Overview:
Make a free account at benchling.com
Import the Lambda DNA.
Simulate Restriction Enzyme Digestion with the following Enzymes:
EcoRI
HindIII
BamHI
KpnI
EcoRV
SacI
SalI
Create a pattern/image in the style of Paul Vanouse’s Latent Figure Protocol artworks.
You might find Ronan’s website a helpful tool for quickly iterating on designs!
My in silico design in Benchling
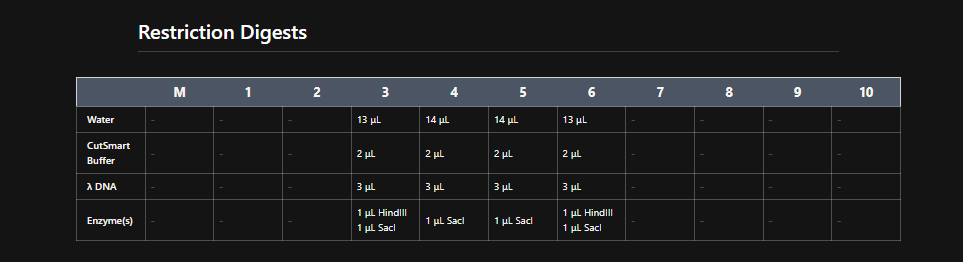
Part 2: Gel Art - Restriction Digests and Gel Electrophoresis
In the wet-lab perform the lab experiment you designed in Part 1 and outlined in this week’s lab protocol “Gel Art: Restriction Digests and Gel Electrophoresis”.
Part 3: DNA Design Challenge
3.1. Choose your protein.
In recitation, we discussed that you will pick a protein for your homework that you find interesting. Which protein have you chosen and why? Using one of the tools described in recitation (NCBI, UniProt, google), obtain the protein sequence for the protein you chose.
[Example from our group homework, you may notice the particular format — The example below came from UniProt]
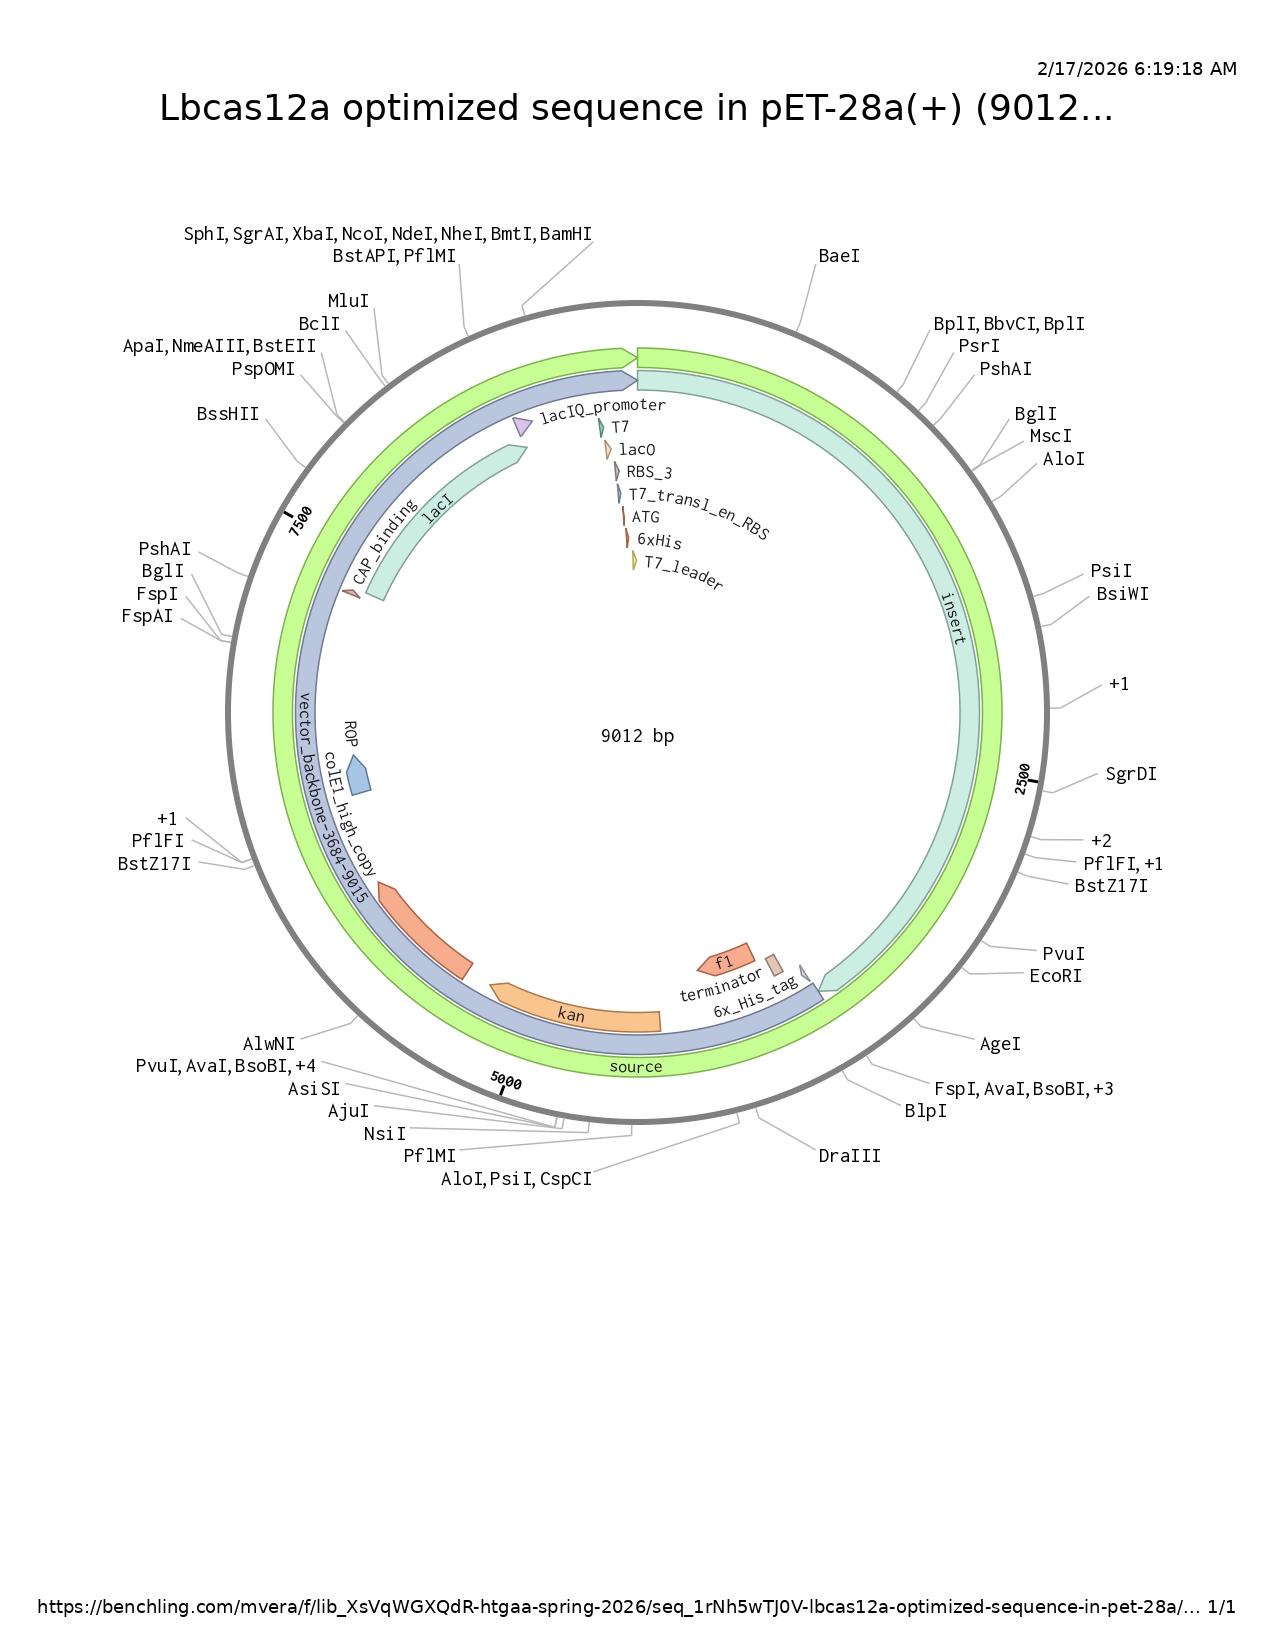
For my final project, I decided to develop a field-deployable diagnostic platform that is user-friendly and low-cost for growers. For this platform, one idea could be to use the CRISPR-Cas12a system; therefore, I chose the enzyme LbCas12a-Ultra.
In the article, they improved different components of the CRISPR assay, such as Cas12a and the reporter system. They tested different Cas12a variants, and the best-performing one was LbCas12a-Ultra. This enzyme was generated by IDT, and the sequence is not available in databases or articles. I found this information in UniProt:
3.2. Reverse Translate: Protein (amino acid) sequence to DNA (nucleotide) sequence.
The Central Dogma discussed in class and recitation describes the process in which DNA sequence becomes transcribed and translated into protein. The Central Dogma gives us the framework to work backwards from a given protein sequence and infer the DNA sequence that the protein is derived from. Using one of the tools discussed in class, NCBI or online tools (google “reverse translation tools”), determine the nucleotide sequence that corresponds to the protein sequence you chose above.
[Example: Get to the original sequence of phage MS2 L-protein from its genome phage MS2 genome - Nucleotide - NCBI]
Lysis protein DNA sequence
atggaaacccgattccctcagcaatcgcagcaaactccggcatctactaatagacgccggccattcaaacatgaggattacccatgtcgaagacaacaaagaagttcaactctttatgtattgatcttcctcgcgatctttctctcgaaatttaccaatcaattgcttctgtcgctactggaagcggtgatccgcacagtgacgactttacagcaattgcttacttaa
LbCas12a from NCBI Genbank: OK557998.1
atgagcaagctggagaagtttacaaactgctactccctgtctaagaccctgaggttcaaggccatccctgtgggcaagacccaggagaacatcgacaataagcggctgctggtggaggacgagaagagagccgaggattataagggcgtgaagaagctgctggatcgctactatctgtcttttatcaacgacgtgctgcacagcatcaagctgaagaatctgaacaattacatcagcctgttccggaagaaaaccagaaccgagaaggagaataaggagctggagaacctggagatcaatctgcggaaggagatcgccaaggccttcaagggcaacgagggctacaagtccctgtttaagaaggatatcatcgagacaatcctgccagagttcctggacgataaggacgagatcgccctggtgaacagcttcaatggctttaccacagccttcaccggcttctttgataacagagagaatatgttttccgaggaggccaagagcacatccatcgccttcaggtgtatcaacgagaatctgacccgctacatctctaatatggacatcttcgagaaggtggacgccatctttgataagcacgaggtgcaggagatcaaggagaagatcctgaacagcgactatgatgtggaggatttctttgagggcgagttctttaactttgtgctgacacaggagggcatcgacgtgtataacgccatcatcggcggcttcgtgaccgagagcggcgagaagatcaagggcctgaacgagtacatcaacctgtataatcagaaaaccaagcagaagctgcctaagtttaagccactgtataagcaggtgctgagcgatcgggagtctctgagcttctacggcgagggctatacatccgatgaggaggtgctggaggtgtttagaaacaccctgaacaagaacagcgagatcttcagctccatcaagaagctggagaagctgttcaagaattttgacgagtactctagcgccggcatctttgtgaagaacggccccgccatcagcacaatctccaaggatatcttcggcgagtggaacgtgatccgggacaagtggaatgccgagtatgacgatatccacctgaagaagaaggccgtggtgaccgagaagtacgaggacgatcggagaaagtccttcaagaagatcggctccttttctctggagcagctgcaggagtacgccgacgccgatctgtctgtggtggagaagctgaaggagatcatcatccagaaggtggatgagatctacaaggtgtatggctcctctgagaagctgttcgacgccgattttgtgctggagaagagcctgaagaagaacgacgccgtggtggccatcatgaaggacctgctggattctgtgaagagcttcgagaattacatcaaggccttctttggcgagggcaaggagacaaacagggacgagtccttctatggcgattttgtgctggcctacgacatcctgctgaaggtggaccacatctacgatgccatccgcaattatgtgacccagaagccctactctaaggataagttcaagctgtattttcagaaccctcagttcatgggcggctgggacaaggataaggagacagactatcgggccaccatcctgagatacggctccaagtactatctggccatcatggataagaagtacgccaagtgcctgcagaagatcgacaaggacgatgtgaacggcaattacgagaagatcaactataagctgctgcccggccctaataagatgctgccaaaggtgttcttttctaagaagtggatggcctactataaccccagcgaggacatccagaagatctacaagaatggcacattcaagaagggcgatatgtttaacctgaatgactgtcacaagctgatcgacttctttaaggatagcatctcccggtatccaaagtggtccaatgcctacgatttcaacttttctgagacagagaagtataaggacatcgccggcttttacagagaggtggaggagcagggctataaggtgagcttcgagtctgccagcaagaaggaggtggataagctggtggaggagggcaagctgtatatgttccagatctataacaaggacttttccgataagtctcacggcacacccaatctgcacaccatgtacttcaagctgctgtttgacgagaacaatcacggacagatcaggctgagcggaggagcagagctgttcatgaggcgcgcctccctgaagaaggaggagctggtggtgcacccagccaactcccctatcgccaacaagaatccagataatcccaagaaaaccacaaccctgtcctacgacgtgtataaggataagaggttttctgaggaccagtacgagctgcacatcccaatcgccatcaataagtgccccaagaacatcttcaagatcaatacagaggtgcgcgtgctgctgaagcacgacgataacccctatgtgatcggcatcgataggggcgagcgcaatctgctgtatatcgtggtggtggacggcaagggcaacatcgtggagcagtattccctgaacgagatcatcaacaacttcaacggcatcaggatcaagacagattaccactctctgctggacaagaaggagaaggagaggttcgaggcccgccagaactggacctccatcgagaatatcaaggagctgaaggccggctatatctctcaggtggtgcacaagatctgcgagctggtggagaagtacgatgccgtgatcgccctggaggacctgaactctggctttaagaatagccgcgtgaaggtggagaagcaggtgtatcagaagttcgagaagatgctgatcgataagctgaactacatggtggacaagaagtctaatccttgtgcaacaggcggcgccctgaagggctatcagatcaccaataagttcgagagctttaagtccatgtctacccagaacggcttcatcttttacatccctgcctggctgacatccaagatcgatccatctaccggctttgtgaacctgctgaaaaccaagtataccagcatcgccgattccaagaagttcatcagctcctttgacaggatcatgtacgtgcccgaggaggatctgttcgagtttgccctggactataagaacttctctcgcacagacgccgattacatcaagaagtggaagctgtactcctacggcaaccggatcagaatcttccggaatcctaagaagaacaacgtgttcgactgggaggaggtgtgcctgaccagcgcctataaggagctgttcaacaagtacggcatcaattatcagcagggcgatatcagagccctgctgtgcgagcagtccgacaaggccttctactctagctttatggccctgatgagcctgatgctgcagatgcggaacagcatcacaggccgcaccgacgtggattttctgatcagccctgtgaagaactccgacggcatcttctacgatagccggaactatgaggcccaggagaatgccatcctgccaaagaacgccgacgccaatggcgcctataacatcgccagaaaggtgctgtgggccatcggccagttcaagaaggccgaggacgagaagctggataaggtgaagatcgccatctctaacaaggagtggctggagtacgcccagaccagcgtgaagcac
3.3. Codon optimization.
Once a nucleotide sequence of your protein is determined, you need to codon optimize your sequence. You may, once again, utilize google for a “codon optimization tool”. In your own words, describe why you need to optimize codon usage. Which organism have you chosen to optimize the codon sequence for and why?
[Example from Codon Optimization Tool | Twist Bioscience while avoiding Type IIs enzyme recognition sites BsaI, BsmBI, and BbsI]
Lysis protein DNA sequence with Codon-Optimization
ATGGAAACCCGCTTTCCGCAGCAGAGCCAGCAGACCCCGGCGAGCACCAACCGCCGCCGCCCGTTCAAACATGAAGATTATCCGTGCCGTCGTCAGCAGCGCAGCAGCACCCTGTATGTGCTGATTTTTCTGGCGATTTTTCTGAGCAAATTCACCAACCAGCTGCTGCTGAGCCTGCTGGAAGCGGTGATTCGCACAGTGACGACCCTGCAGCAGCTGCTGACCTAA
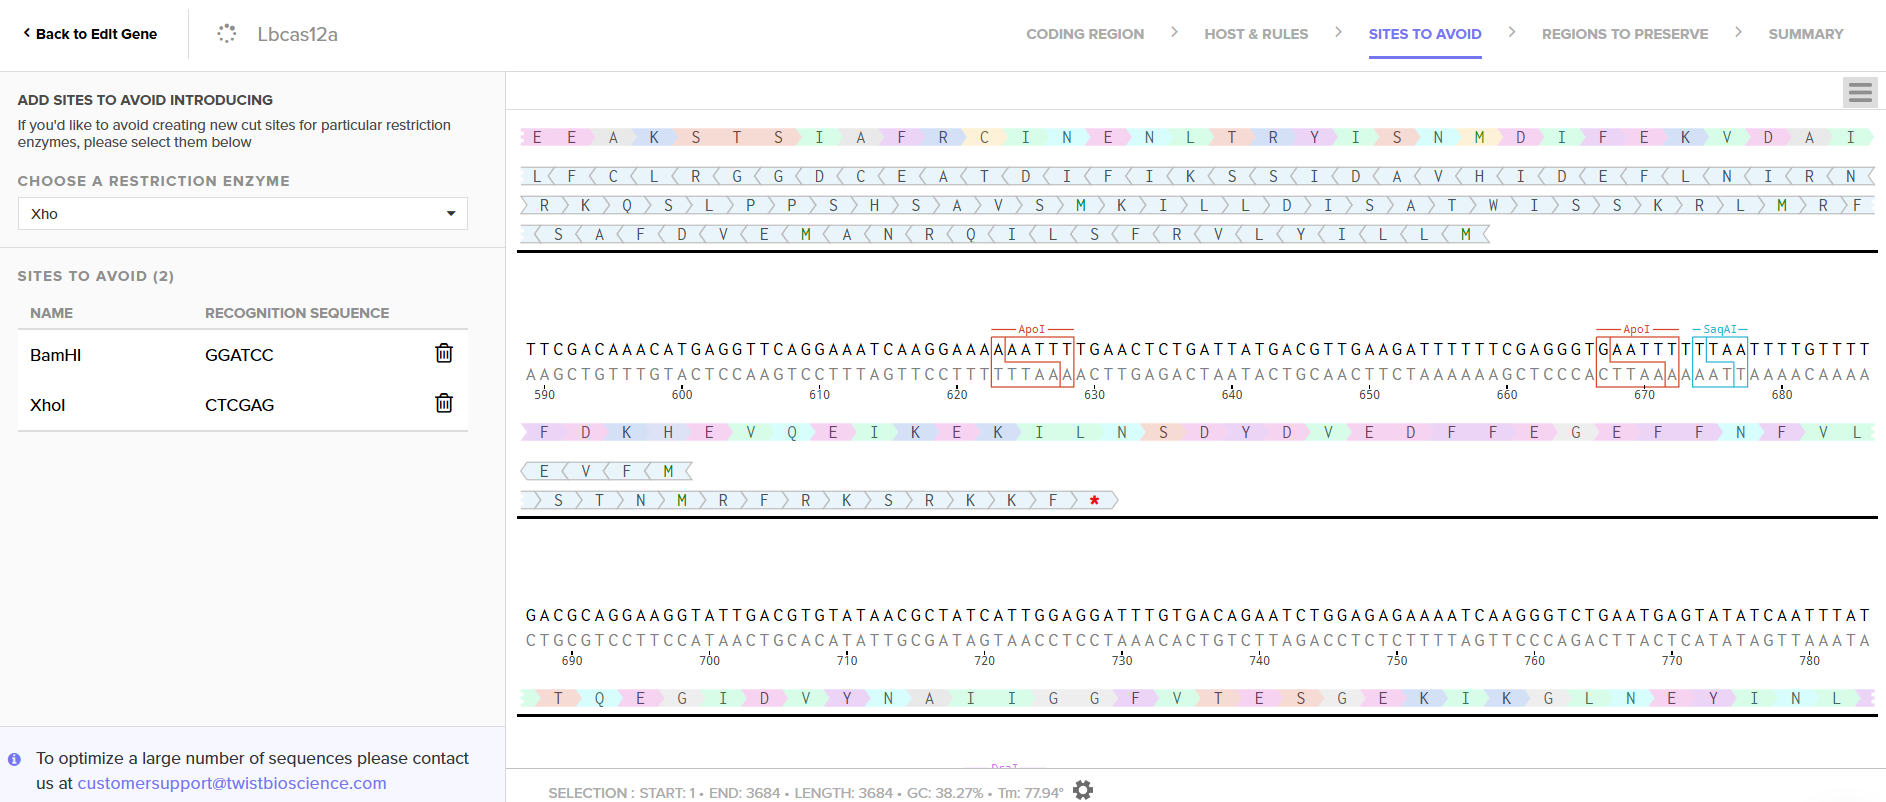
I used the codon optimization tool from Twist Bioscience because I plan to produce LbCas12a in E. coli, purify it, and prepare it for use in a cell-free system. E. coli is a well-characterized organism and is relatively simple to handle for protein expression and purification.
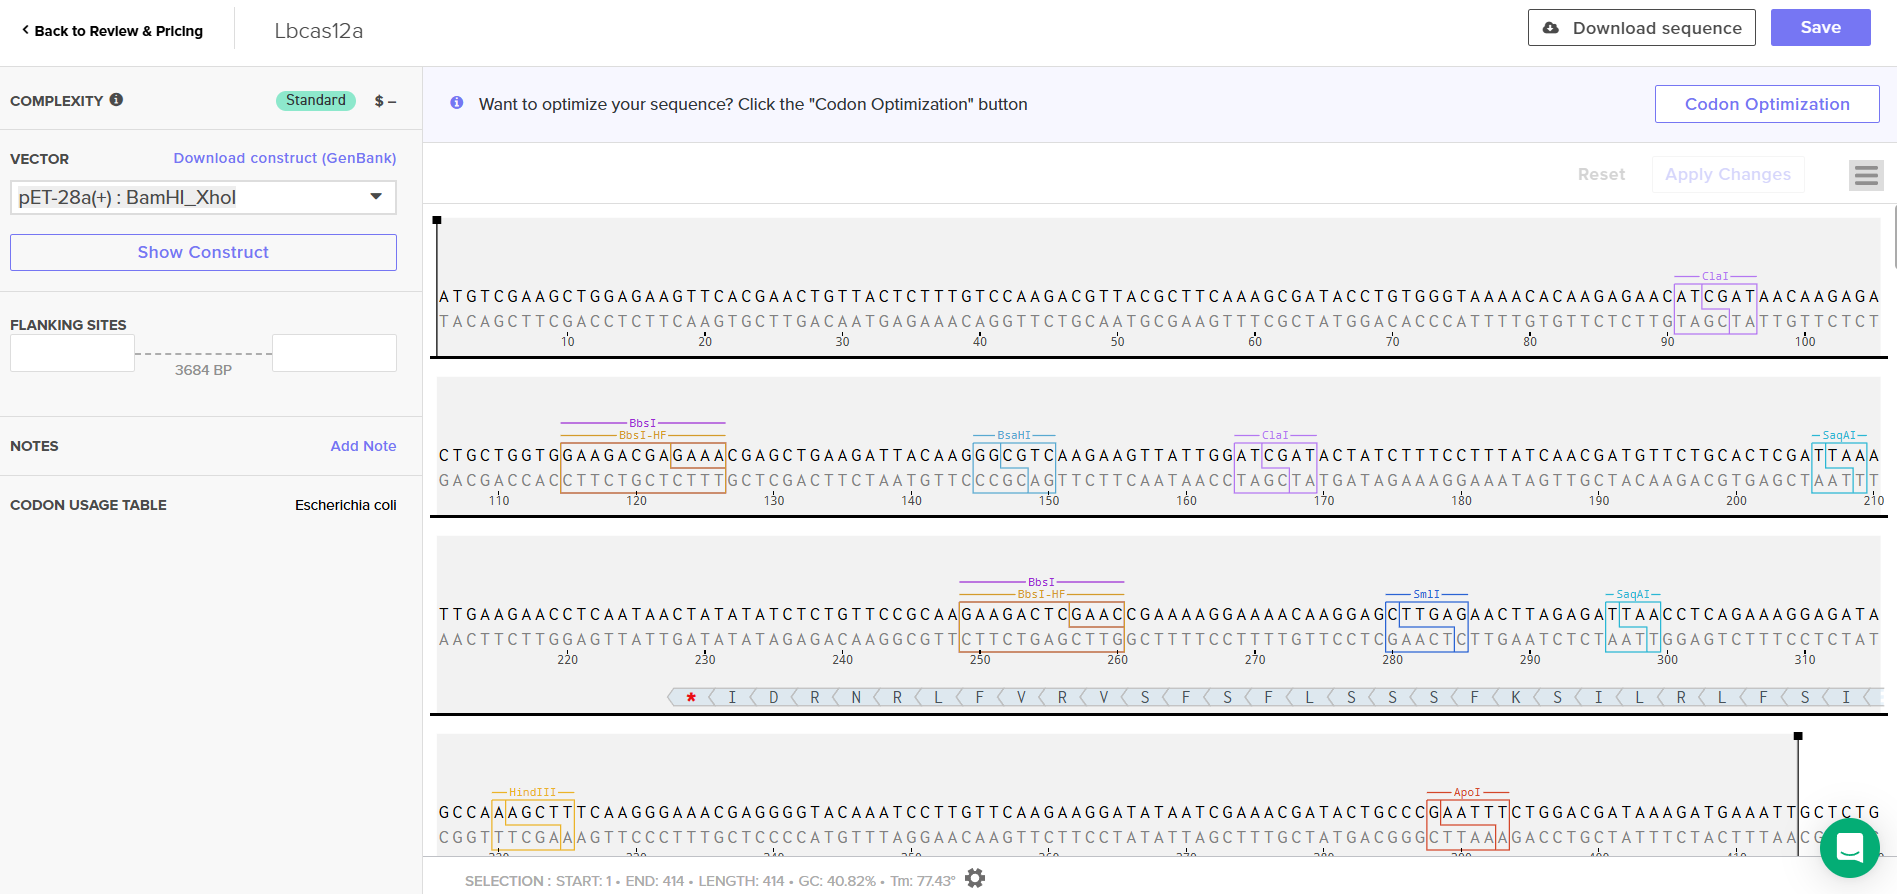
LbCas12a is an enzyme originally derived from Lachnospiraceae bacterium. Since I chose the expression vector pET-28a(+), I selected the option in the program to optimize codon usage for E. coli and to avoid introducing restriction sites for BamHI and XhoI, as I will use these enzymes for cloning.
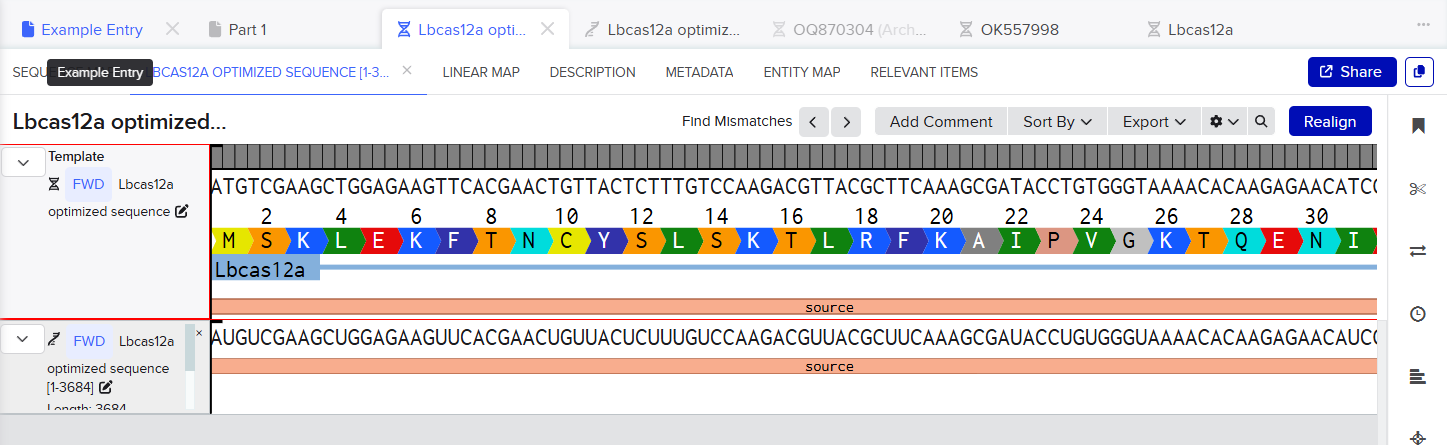
LbCas12a DNA sequence with Codon-optimization
ATGTCGAAGCTGGAGAAGTTCACGAACTGTTACTCTTTGTCCAAGACGTTACGCTTCAAAGCGATACCTGTGGGTAAAACACAAGAGAACATCGATAACAAGAGACTGCTGGTGGAAGACGAGAAACGAGCTGAAGATTACAAGGGCGTCAAGAAGTTATTGGATCGATACTATCTTTCCTTTATCAACGATGTTCTGCACTCGATTAAATTGAAGAACCTCAATAACTATATATCTCTGTTCCGCAAGAAGACTCGAACCGAAAAGGAAAACAAGGAGCTTGAGAACTTAGAGATTAACCTCAGAAAGGAGATAGCCAAAGCTTTCAAGGGAAACGAGGGGTACAAATCCTTGTTCAAGAAGGATATAATCGAAACGATACTGCCCGAATTTCTGGACGATAAAGATGAAATTGCTCTGGTCAACTCGTTCAATGGCTTCACGACTGCATTTACGGGTTTCTTCGACAACCGTGAGAACATGTTCAGCGAAGAGGCTAAAAGCACGAGCATTGCCTTTCGTTGCATTAACGAGAACCTGACCCGGTACATAAGTAATATGGACATATTTGAGAAAGTAGACGCTATCTTTGATAAGCACGAAGTCCAAGAGATTAAAGAGAAGATCCTTAATTCAGACTACGATGTAGAGGACTTCTTTGAAGGGGAGTTCTTCAACTTCGTACTGACCCAAGAGGGCATAGATGTCTACAATGCAATTATAGGCGGCTTCGTCACCGAGTCGGGCGAAAAGATAAAAGGCTTGAACGAATACATTAACCTGTACAACCAGAAGACAAAACAAAAGCTCCCGAAGTTCAAGCCCCTGTATAAACAAGTTCTCTCAGACCGCGAGAGTTTGTCTTTCTACGGTGAGGGTTACACTTCGGATGAAGAGGTCCTCGAAGTATTTCGCAATACGTTAAACAAGAACTCAGAGATATTTTCTTCCATTAAGAAATTAGAGAAGCTCTTCAAGAACTTTGATGAGTACTCCTCAGCTGGTATATTCGTGAAGAATGGGCCAGCAATCTCCACCATTAGTAAGGATATATTTGGCGAATGGAACGTAATCCGTGACAAATGGAACGCTGAATACGATGATATCCATCTGAAGAAGAAGGCCGTAGTGACGGAGAAGTACGAAGACGACCGTCGGAAGTCCTTTAAGAAGATAGGAAGCTTCAGTCTCGAACAGCTCCAGGAGTACGCAGATGCGGATTTAAGTGTAGTCGAGAAATTGAAGGAGATAATAATTCAAAAGGTTGATGAGATCTACAAGGTCTATGGGTCTAGTGAGAAACTCTTCGACGCCGACTTCGTGTTGGAAAAGTCACTGAAGAAGAATGATGCCGTTGTGGCCATTATGAAGGACCTGCTGGATTCAGTGAAGAGCTTTGAGAACTACATTAAAGCATTCTTCGGAGAAGGTAAGGAAACTAATCGCGACGAGTCTTTCTACGGAGACTTCGTTCTTGCGTATGACATCCTTTTGAAGGTGGACCACATTTACGATGCAATTAGAAACTACGTCACTCAGAAGCCTTACTCCAAGGACAAGTTTAAGCTTTACTTCCAAAACCCTCAATTTATGGGCGGTTGGGACAAAGACAAAGAGACTGACTATCGCGCCACGATCTTACGCTATGGAAGCAAGTACTACTTAGCGATTATGGACAAGAAGTACGCAAAGTGCCTGCAAAAGATAGACAAGGATGATGTTAACGGCAACTACGAGAAAATTAATTACAAGCTGCTTCCTGGCCCAAATAAGATGCTGCCAAAGGTCTTCTTTTCTAAGAAGTGGATGGCTTACTACAACCCATCAGAGGACATACAAAAGATTTATAAGAACGGCACTTTCAAGAAGGGTGACATGTTTAACCTCAATGACTGTCATAAGTTGATTGACTTCTTCAAGGACAGTATATCCCGATACCCTAAGTGGTCCAATGCGTACGACTTCAATTTCTCAGAGACAGAAAAGTACAAAGACATCGCGGGTTTCTATCGCGAGGTGGAAGAACAAGGATACAAGGTTTCTTTCGAGTCAGCTTCTAAGAAAGAGGTCGACAAGCTGGTGGAAGAGGGTAAGCTGTACATGTTTCAGATTTACAATAAGGATTTCTCAGATAAGTCACACGGAACTCCCAACCTGCACACCATGTACTTCAAACTGCTGTTCGATGAGAACAACCACGGTCAAATTCGCTTGTCTGGCGGCGCAGAACTTTTCATGCGGCGCGCTTCTCTGAAGAAAGAGGAACTTGTTGTTCATCCAGCCAACAGCCCTATCGCTAACAAGAATCCTGACAACCCCAAGAAAACTACTACGTTGAGTTACGACGTTTACAAGGATAAGAGATTTTCCGAGGACCAGTACGAGTTGCATATTCCGATAGCCATTAATAAATGCCCTAAGAACATTTTCAAGATCAATACGGAAGTACGTGTCCTTTTGAAACACGACGACAACCCATACGTGATTGGGATTGACAGAGGAGAGCGTAACTTATTATATATCGTCGTCGTCGACGGCAAGGGAAACATAGTTGAACAGTATAGCTTAAATGAGATAATCAACAACTTCAACGGTATCCGTATCAAAACAGATTACCACTCTTTACTTGACAAGAAGGAGAAGGAGCGCTTCGAGGCTCGTCAAAATTGGACTAGCATTGAGAATATTAAAGAGCTCAAGGCTGGGTATATCAGCCAGGTTGTACATAAGATCTGCGAGCTGGTTGAAAAGTACGACGCGGTCATCGCACTTGAGGACCTGAACAGTGGTTTTAAGAACAGCCGTGTGAAGGTCGAGAAGCAGGTATACCAAAAGTTTGAGAAGATGCTGATAGATAAGCTGAACTACATGGTAGACAAGAAATCTAATCCATGTGCGACTGGTGGGGCCTTAAAGGGATATCAGATAACCAACAAATTTGAGTCCTTCAAGAGCATGTCGACCCAGAACGGATTCATATTTTACATCCCGGCTTGGTTGACATCCAAGATCGATCCTAGCACTGGTTTCGTTAACCTCTTGAAGACTAAGTACACGAGTATAGCTGACAGTAAGAAGTTTATCTCATCTTTCGATCGTATTATGTACGTTCCAGAGGAAGACCTTTTCGAGTTTGCGTTAGATTACAAGAACTTCAGCCGAACTGACGCAGACTACATTAAGAAGTGGAAATTGTATAGCTATGGGAACCGAATTCGCATCTTCCGGAATCCAAAGAAGAATAACGTTTTCGACTGGGAAGAGGTGTGTTTAACTTCAGCGTATAAAGAGCTGTTTAATAAGTACGGAATAAATTACCAACAAGGTGACATCCGCGCCCTTCTGTGCGAGCAATCGGATAAAGCATTTTACTCCTCGTTCATGGCATTGATGTCATTAATGTTGCAAATGCGGAACTCCATAACTGGTAGAACCGATGTAGACTTTCTTATCTCACCGGTTAAGAACAGTGATGGTATCTTCTACGATTCTCGGAATTATGAGGCTCAAGAGAACGCAATCCTGCCCAAGAACGCTGACGCGAATGGAGCCTATAATATCGCACGTAAAGTACTGTGGGCTATAGGTCAATTTAAGAAGGCCGAAGACGAGAAATTGGACAAAGTTAAAATCGCAATTTCTAACAAAGAGTGGCTGGAATATGCGCAAACAAGTGTGAAGCAT
3.4. You have a sequence! Now what?
What technologies could be used to produce this protein from your DNA? Describe in your words the DNA sequence can be transcribed and translated into your protein. You may describe either cell-dependent or cell-free methods, or both.
It could be used both tecnologies cell-dependent system and cell-free system. In a cell-dependent system, the optimized LbCas12a gene will be cloned into an expression vector such as pET-28a(+) and transformed into E. coli expression strains (for example, BL21(DE3)). Once inside the bacteria, the DNA is first transcribed into messenger RNA (mRNA) by RNA polymerase. In the pET system, transcription is typically driven by the T7 promoter, which is activated after induction (commonly with IPTG). The mRNA is then translated by ribosomes in the cytoplasm, where transfer RNAs (tRNAs) recognize codons and incorporate the corresponding amino acids to synthesize the LbCas12a protein. After translation, the protein can be purified, often using Nickle affinity and cation exchange chromatography.
In a cell-free expression system, the same DNA template (plasmid or linear DNA) is added to a reaction mixture containing the molecular machinery required for transcription and translation. This mixture typically includes RNA polymerase, ribosomes, tRNAs, amino acids, nucleotides, enzymes, and energy sources. The DNA is transcribed into mRNA in vitro, and ribosomes translate the mRNA into protein directly in the reaction tube. Cell-free systems allow faster protein production and easier control of reaction conditions, which is useful for rapid prototyping or diagnostic applications.
3.5. [Optional] How does it work in nature/biological systems?
Describe how a single gene codes for multiple proteins at the transcriptional level.
Try aligning the DNA sequence, the transcribed RNA, and also the resulting translated Protein!!! See example below.
[Example shows the biomolecular flow in central dogma from DNA to RNA to Protein] Special note that all “T” were transcribed into “U” and that the 3-nt codon represents 1-AA.
Splicing can generate different mRNA variants with different exon organization, resulting in the production of different proteins. Alternative promoters within a single gene or different transcription start sites can also generate different protein isoforms.
Part 4: Prepare a Twist DNA Synthesis Order
In this case, I can order the synthetic fragment (LbCas12a gene) containing the restriction sites and clone it into the expression vector pET-28a(+) using the restriction enzymes BamHI and XhoI.
Order from Twist
Insert and desired expression vector
Part 5: DNA Read/Write/Edit
5.1 DNA Read
(i) What DNA would you want to sequence (e.g., read) and why? This could be DNA related to human health (e.g. genes related to disease research), environmental monitoring (e.g., sewage waste water, biodiversity analysis), and beyond (e.g. DNA data storage, biobank).
DNA-based digital data storage technology. Source: Archives in DNA: Workshop Exploring Implications of an Emerging Bio-Digital Technology through Design Fiction - Scientific Figure on ResearchGate. Available from: https://www.researchgate.net/figure/DNA-based-digital-data-storage-technology_fig1_353128454 [accessed 11 Feb 2025]
For the development of a field-deployable CRISPR platform to detect Aster Yellows Phytoplasma (AYP), I would sequence DNA from symptomatic garlic plants that test positive for AYP. I plan to do this in two ways: (1) cloning and sequencing three molecular marker genes to confirm AYP identity and compare strains, and (2) whole-genome sequencing to fully characterize the entire AYP genome from field isolates. These sequencing approaches are important because they reveal conserved and variable regions of the pathogen, which helps me design guide RNAs that are specific, sensitive, and robust across different AYP strains found in real agricultural samples.
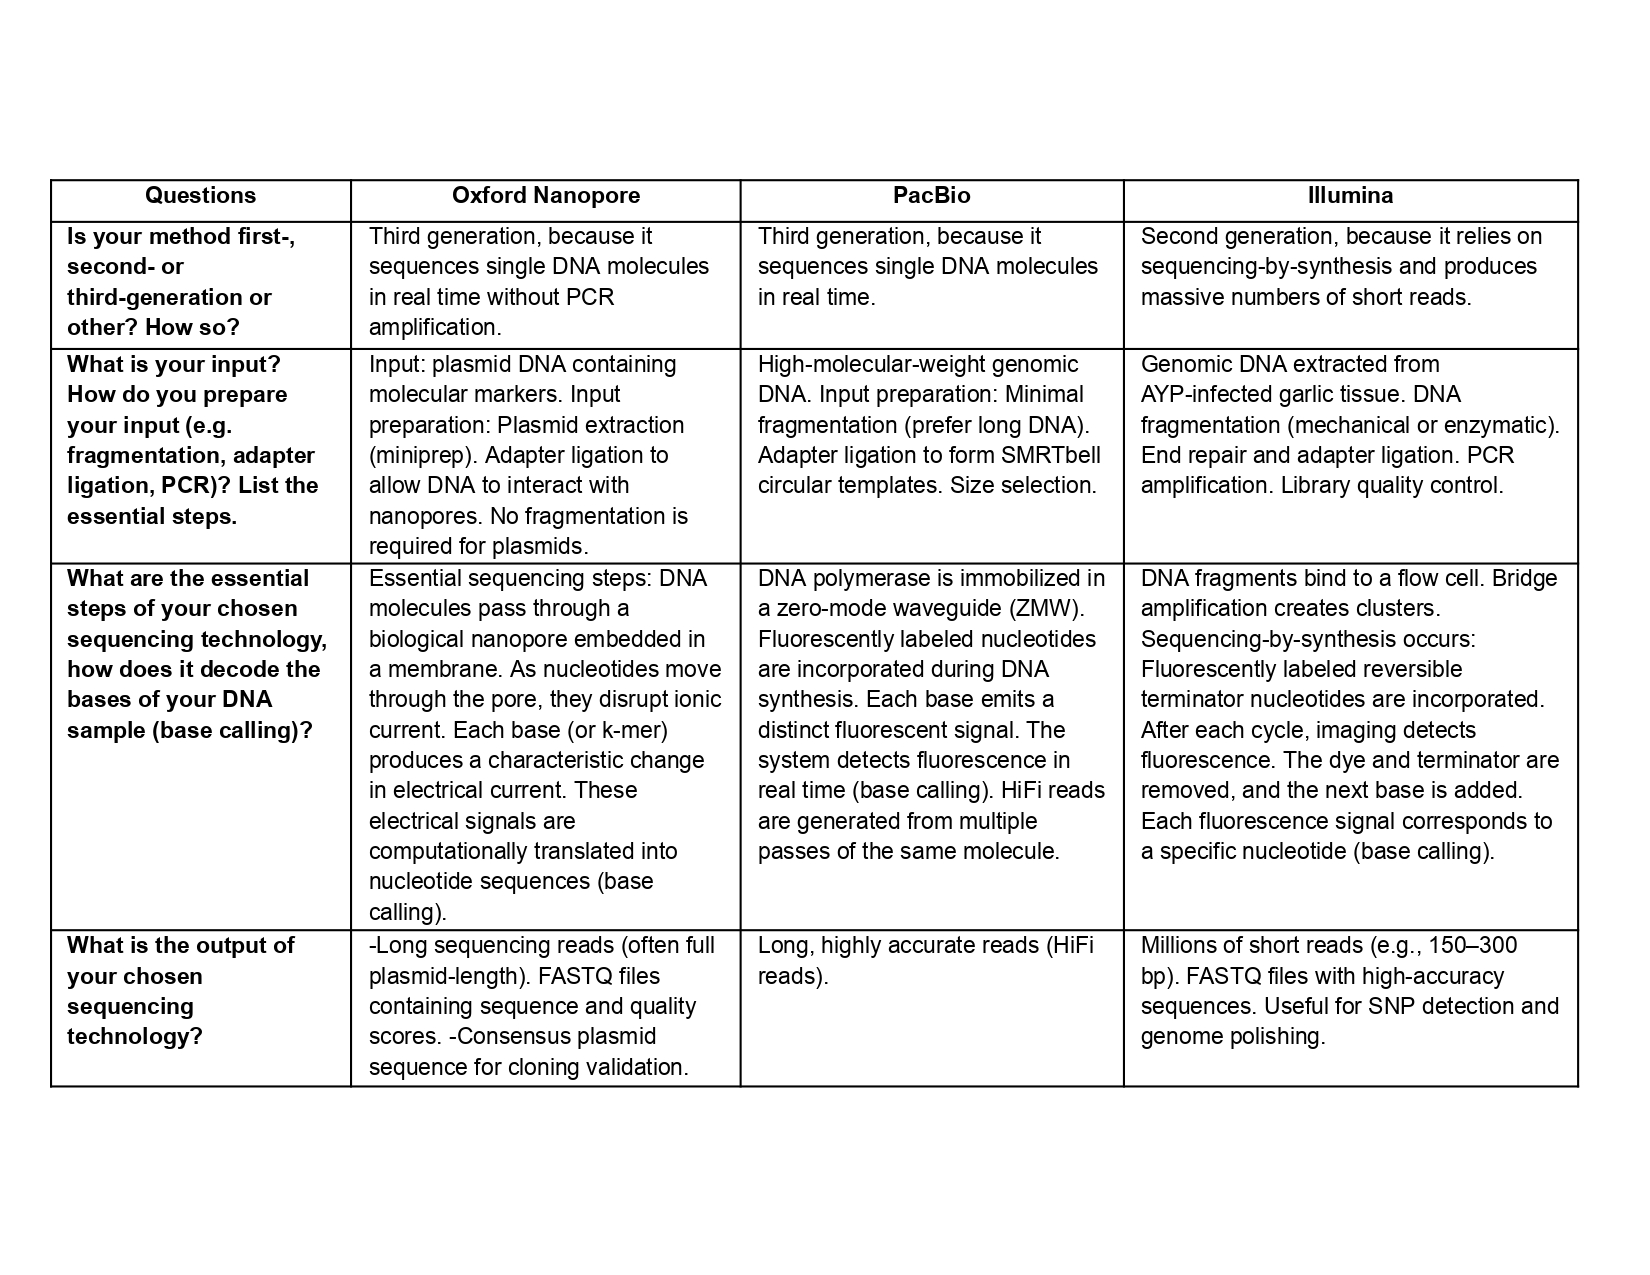
(ii) In lecture, a variety of sequencing technologies were mentioned. What technology or technologies would you use to perform sequencing on your DNA and why?
Also answer the following questions:
Is your method first-, second- or third-generation or other? How so?
What is your input? How do you prepare your input (e.g. fragmentation, adapter ligation, PCR)? List the essential steps.
What are the essential steps of your chosen sequencing technology, how does it decode the bases of your DNA sample (base calling)?
What is the output of your chosen sequencing technology?
5.2 DNA Write
(i) What DNA would you want to synthesize (e.g., write) and why? These could be individual genes, clusters of genes or genetic circuits, whole genomes, and beyond. As described in class thus far, applications could range from therapeutics and drug discovery (e.g., mRNA vaccines and therapies) to novel biomaterials (e.g. structural proteins), to sensors (e.g., genetic circuits for sensing and responding to inflammation, environmental stimuli, etc.), to art (DNA origamis). If possible, include the specific genetic sequence(s) of what you would like to synthesize! You will have the opportunity to actually have Twist synthesize these DNA constructs! :)
See some famous examples of DNA design
DNA origami by Paul W. K. Rothemund, California Institute of Technology, 2004. 100 nanometers in diameter.
For now I want to synthetize the individual gene LbCas12a to clone in E.coli and produce and purify it. Also, it could be a genetic circuit in a cell free-system where LbCas12a generates itself or by using Toehold switch system for detection.
(ii) What technology or technologies would you use to perform this DNA synthesis and why?
Also answer the following questions:
What are the essential steps of your chosen sequencing methods?
What are the limitations of your sequencing method (if any) in terms of speed, accuracy, scalability?
(i) For this project, I would like to synthesize the individual gene encoding LbCas12a (from Lachnospiraceae bacterium) for heterologous expression in E. coli. The goal is to clone the codon-optimized gene into an expression vector (such as pET-28a(+)), produce the recombinant protein, and purify it for CRISPR-based detection of AYP. Synthesizing this gene allows me to optimize codon usage for E. coli and remove unwanted restriction sites.
In addition to expressing LbCas12a as a standalone protein, I am also interested in synthesizing a genetic circuit for a cell-free system. This system could integrate Cas12a or toehold switch technology. In this design, the DNA construct could encode LbCas12a under a T7 promoter, enabling in vitro transcription and translation directly within a cell-free reaction. This would allow on-demand production of the CRISPR effector enzyme during the diagnostic reaction itself, reducing the need for pre-purified protein. I do not yet have a fully defined design, but I plan to refine and optimize the system as the project progresses.
(ii) To synthesize the LbCas12a gene and the genetic circuit constructs, I would use commercial gene synthesis services, such as those provided by Twist Bioscience (synthetic fragments or clonal genes). Twist uses high-throughput, phosphoramidite silicon-based DNA synthesis technology to chemically synthesize DNA fragments with high accuracy and scalability.
Gene synthesis typically follows these essential steps:
Oligonucleotide synthesis
Short DNA oligonucleotides (~60–200 nt) are chemically synthesized using phosphoramidite chemistry.
Oligo assembly
Overlapping oligos are assembled into longer double-stranded DNA (dsDNA) fragments.
Error correction and amplification
Gene fragments are purified and subjected to quality control, including size and length verification. Sequence verification may be performed by next-generation sequencing (NGS), and enzymatic error correction combined with PCR amplification improves sequence fidelity. The validated gene fragments are then ready to be shipped. For clonal genes, additional cloning and bacterial amplification steps may be required.
Cloning into a vector
The synthesized gene is inserted into a plasmid backbone for propagation and expression.
Sequence verification
The final construct is validated by Sanger sequencing or next-generation sequencing to confirm sequence accuracy.
Although commercial DNA synthesis is highly efficient and accurate, it has several limitations. Errors can still occur during oligonucleotide synthesis and assembly, particularly in repetitive sequences or regions with very high GC content, which may require additional verification and correction. The synthesis of very long DNA constructs can be technically challenging and more expensive, as longer sequences increase the probability of errors and assembly difficulties. Turnaround time may also vary depending on the complexity and size of the construct, sometimes requiring several days to weeks.
5.3 DNA Edit
(i) What DNA would you want to edit and why? In class, George shared a variety of ways to edit the genes and genomes of humans and other organisms. Such DNA editing technologies have profound implications for human health, development, and even human longevity and human augmentation. DNA editing is also already commonly leveraged for flora and fauna, for example in nature conservation efforts, (animal/plant restoration, de-extinction), or in agriculture (e.g. plant breeding, nitrogen fixation). What kinds of edits might you want to make to DNA (e.g., human genomes and beyond) and why?
Colossal Biosciences Inc., a biotechnology company using genetic engineering to de-extinct various historic animals such as the woolly mammoth, dodo, and dire wolf.
(ii) What technology or technologies would you use to perform these DNA edits and why?
Also answer the following questions:
How does your technology of choice edit DNA? What are the essential steps?
What preparation do you need to do (e.g. design steps) and what is the input (e.g. DNA template, enzymes, plasmids, primers, guides, cells) for the editing?
What are the limitations of your editing methods (if any) in terms of efficiency or precision?
(i) I am interested in editing plant genomes to improve agriculturally important traits such as disease resistance, stress tolerance (drought, heat), and yield stability. Specifically, I would target genes involved in plant-pathogen interactions, immune signaling pathways, and susceptibility (S) genes that facilitate pathogen infection.
(ii) I would use CRISPR-Cas systems, delivered through engineered plant viruses. CRISPR-Cas is highly programmable, efficient, and relatively simple to design compared to earlier genome-editing tools (e.g., ZFNs or TALENs). Using plant viruses as delivery vectors allows systemic spread of guide RNAs throughout the plant, enabling editing directly in planta.
First, the target gene sequence must be identified and analyzed to select an appropriate editing site adjacent to a compatible PAM sequence. Guide RNAs (gRNAs) are then computationally designed to ensure high specificity and minimal off-target effects. The selected guide sequence is cloned into a plant viral vector capable of systemic infection. The input materials include the guide RNA construct, a Cas nuclease (either stably expressed in the plant or delivered separately), the engineered viral vector, and the target plant tissue. Once delivered into plant cells, the Cas protein and guide RNA form a ribonucleoprotein complex that recognizes the target DNA sequence and introduces a double-strand break, which is subsequently repaired by the plant’s endogenous DNA repair mechanisms, resulting in the desired mutation.
Editing efficiency can vary depending on plant species, en vironemtnal conditions and viral delivery efficiency. Off-target mutations may occur if guide RNAs are not carefully designed. Precise edits using HDR are typically inefficient in plants compared to knockouts generated through NHEJ. Additionally, viral vectors may have cargo size limitations and may not efficiently infect all plant tissues or germline cells, which can affect heritability of edits.
Week 3 HW: Lab Automation
My Homework
DNA!
Assignment: Python Script for Opentrons Artwork
Your task this week is to Create a Python file to run on an Opentrons liquid handling robot.
Review this week’s recitation and this week’s lab for details on the Opentrons and programming it.
Generate an artistic design using the GUI at opentrons-art.rcdonovan.com.
Using the coordinates from the GUI, follow the instructions in the HTGAA26 Opentrons Colab to write your own Python script which draws your design using the Opentrons.
You may use AI assistance for this coding — Google Gemini is integrated into Colab (see the stylized star bottom center); it will do a good job writing functional Python, while you probably need to take charge of the art concept.
If you’re a proficient programmer and you’d rather code something mathematical or algorithmic instead of using your GUI coordinates, you may do that instead.
If the Python component is proving too problematic even with AI and human assistance, download the full Python script from the GUI website and submit that:
If you use AI to help complete this homework or lab, document how you used AI and which models made contributions.
Sign up for a robot time slot if you are at MIT/Harvard/Wellesley or at a Node offering Opentrons automation. The Python script you created will be run on the robot to produce your work of art!
At MIT/Harvard? Lab times are on Thursday Feb.19 between 10AM and 6PM.
At other Nodes? Please coordinate with your Node.
Submit your Python file via this form.
Yes, I used AI to help generate my code. The majority of the script was generated using ChatGPT. I provided detailed instructions describing what I wanted to achieve specifically, generating a Yin-Yang pattern using the Opentrons platform, including how I wanted the shape to look and how the points should be distributed. However, I still needed to review, test, and modify the code to ensure it behaved as expected. Some adjustments were required to correct positioning and curvature details.
Post-Lab Questions — DUE BY START OF FEB 24 LECTURE
One of the great parts about having an automated robot is being able to precisely mix, deposit, and run reactions without much intervention, and design and deploy experiments remotely.
For this week, we’d like for you to do the following:
Find and describe a published paper that utilizes the Opentrons or an automation tool to achieve novel biological applications.
Malcı et al. (2026) developed Slowpoke, an automated Golden Gate cloning workflow for the Opentrons OT-2 and Flex platforms. The system automates DNA assembly, transformation, plating, and colony PCR, with manual colony picking and plasmid purification. The authors validated the workflow by assembling Level 1 transcription units in Saccharomyces cerevisiae using 19 promoters driving sfGFP expression, and five-part GFP constructs in Bacillus subtilis with different promoter and RBS combinations. They further demonstrated scalability by constructing 62 assemblies encoding secreted recombinant proteins such as endolysin and scFv fragments. Assembly efficiencies exceeded 90% for most constructs, demonstrating that affordable liquid-handling automation can enable high-throughput synthetic biology applications.
Write a description about what you intend to do with automation tools for your final project. You may include example pseudocode, Python scripts, 3D printed holders, a plan for how to use Ginkgo Nebula, and more. You may reference this week’s recitation slide deck for lab automation details.
While your description/project idea doesn’t need to be set in stone, we would like to see core details of what you would automate. This is due at the start of lecture and does not need to be tested on the Opentrons yet.
Example 1: You are creating a custom fabric, and want to deposit art onto specific parts that need to be intertwined in odd ways. You can design a 3D printed holder to attach this fabric to it, and be able to deposit bio art on top. Check out the Opentrons 3D Printing Directory.
Example 2: You are using the cloud laboratory to screen an array of biosensor constructs that you design, synthesize, and express using cell-free protein synthesis.
Echo transfer biosensor constructs and any required cofactors into specified wells.
Bravo stamp in CPFS reagent master mix into all wells of a 96-well / 384-well plate.
Multiflo dispense the CFPS lysate to all wells to start protein expression.
PlateLoc seal the plate.
Inheco incubate the plate at 37°C while the biosensor proteins are synthesized.
XPeel remove the seal.
PHERAstar measure fluorescence to compare biosensor responses.
For my final project, I intend to use automation tools to optimize a CRISPR-Cas12a diagnostic platform that combines RPA (Recombinase Polymerase Amplification) with cell-free CRISPR detection. The goal is to systematically screen primers, reaction conditions, and crRNAs using high-throughput liquid handling to accelerate assay development.
RPA is an isothermal amplification reaction performed at 37-42°C (typically ~39°C). Small changes in primer design, Mg²⁺ concentration, and template input significantly affect performance. Instead of optimizing conditions manually, I will automate reaction matrix setup using an Opentrons OT-2 (or Flex).
The robot will:
Dispense multiple primer pairs across rows
Generate Mg²⁺ concentration gradients across columns
Add template dilution series
Add RPA master mix
Plates will be sealed and incubated at controlled isothermal temperature using a thermocycler module or external heater.
After identifying optimal RPA conditions, I will automate screening of CRISPR detection reactions in a cell-free format.
Variables to test include:
Multiple crRNAs targeting different regions
Cas12a enzyme concentrations
Reporter concentrations
Positive and negative controls
Echo transfer RPA products into designated wells.
Echo transfer crRNA variants into specific wells.
Bravo dispense Cas12a master mix across plate.
Multiflo add fluorescent ssDNA reporter.
PlateLoc seal plate.
Inheco incubate at 37°C for collateral cleavage activation.
PHERAstar measure fluorescence kinetics.
Fluorescence over time will be used to calculate signal-to-noise ratios and rank crRNA performance.
Using Ginkgo Nebula or a cloud lab platform, I could upload a crRNA design library and screen 50-200 crRNAs in parallel, integrating automated synthesis, liquid handling, and fluorescence analytics. This would significantly accelerate crRNA optimization.
Final Project Ideas — DUE BY START OF FEB 24 LECTURE
As explained in this week’s recitation, add 1-3 slides in your Node’s section of this slide deck with 3 ideas you have for an Individual Final Project. Be sure to put your name, city, and country on your slide!
Week 4 HW: Protein Design Part I
My homework
DNA!
Part A. Conceptual Questions
Answer any NINE of the following questions from Shuguang Zhang: (i.e. you can select two to skip)
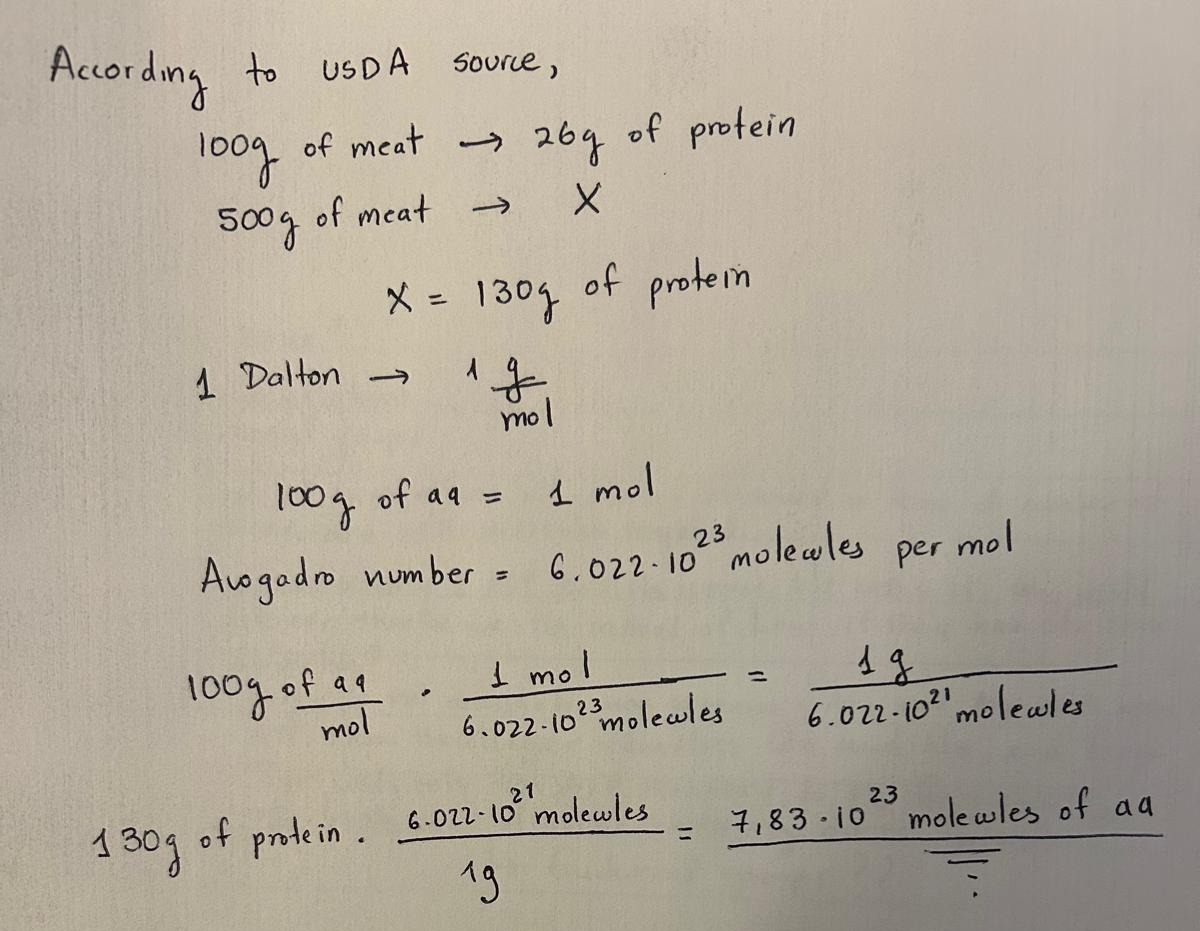
How many molecules of amino acids do you take with a piece of 500 grams of meat? (on average an amino acid is ~100 Daltons)
Why do humans eat beef but do not become a cow, eat fish but do not become fish?
Humans do not become cows or fish after eating them because the proteins we consume are first broken down into their basic components during digestion. Although all living organisms use the same 20 standard amino acids as building blocks of proteins, these proteins are digested into individual amino acids by enzymes such as pepsin in the stomach and trypsin in the small intestine. These amino acids are then absorbed and reused by our cells to synthesize new proteins according to the instructions encoded in human DNA. Therefore, the amino acids from beef or fish are simply raw materials that our bodies use to build human proteins.
Why are there only 20 natural amino acids?
According to Doig (2016), the amino acids were selected during the early “RNA world” because they allow proteins to form stable, soluble structures with tightly packed hydrophobic cores and functional binding pockets. The chosen amino acids cover a wide range of properties such as size, charge, hydrophobicity, and functional groups, which enable proteins to have diverse and stable 3D structures. Other possible amino acids were likely excluded because they would not improve protein stability, solubility, or biosynthetic efficiency and cost more conformational entropy to fold than their branched isomers.
Where did amino acids come from before enzymes that make them, and before life started?
Before life began and before enzymes existed, amino acids likely formed through prebiotic chemical reactions under early Earth conditions. According to Kirschning (2022), amino acids have been detected in meteorites, suggesting that some were synthesized in space and delivered to Earth through extraterrestrial material. In addition, amino acids could be produced on the early Earth through abiotic reactions involving simple molecules such as CO₂, NH₃, H₂O, and other small compounds under energy sources like lightning, UV radiation, or hydrothermal activity.
If you make an α-helix using D-amino acids, what handedness (right or left) would you expect?
Natural proteins are made of L-amino acids, which typically form right-handed α-helices. If the chirality is reversed and D-amino acids are used, the geometry is mirrored, producing a left-handed α-helix.
Can you discover additional helices in proteins?
Yes, additional helices in proteins can be identified using experimental structural techniques such as X-ray crystallography and cryo-electron microscopy, as well as computational prediction tools like AlphaFold and ESMFold.
Why are most molecular helices right-handed?
Most molecular helices in proteins are right-handed because proteins are composed of L-amino acids. The stereochemistry of L-amino acids favors backbone conformations that form stable hydrogen bonds between the carbonyl oxygen of residue i and the amide hydrogen of residue i+4, which stabilizes a right-handed α-helix. A left-handed helix would create unfavorable steric interactions for L-amino acids, so the right-handed α-helix is energetically preferred.
Why do β-sheets tend to aggregate?
What is the driving force for β-sheet aggregation?
β-sheets tend to aggregate because they form hydrogen-bonding networks that can interact with neighboring β-strands from other protein molecules. The main driving forces for β-sheet aggregation are hydrogen bonding and hydrophobic interactions, which allow β-strands from different proteins to stack together into stable sheet-like structures.
Why do many amyloid diseases form β-sheets?
Can you use amyloid β-sheets as materials?
Many amyloid diseases involve β-sheet structures because misfolded proteins can reorganize into highly stable cross-β sheet fibrils. In these structures, β-strands align perpendicular to the fibril axis and form repetitive hydrogen-bond networks between protein molecules. Amyloid β-sheet structures can be used as biomaterials because they form extremely stable, self-assembling nanofibers with high mechanical strength.
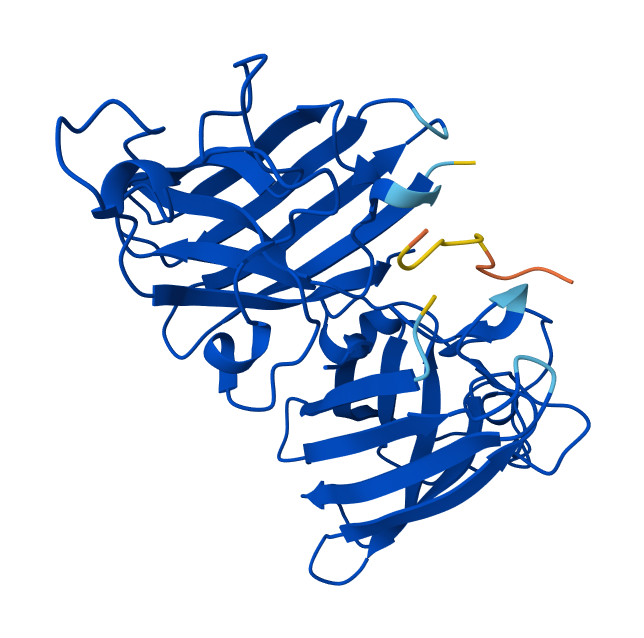
Part B: Protein Analysis and Visualization
In this part of the homework, you will be using online resources and 3D visualization software to answer questions about proteins. Pick any protein (from any organism) of your interest that has a 3D structure and answer the following questions:
Briefly describe the protein you selected and why you selected it.
I chose the enzyme LbCas12a because I am going to develop a field-deployable diagnostic platform that is user-friendly and low-cost for growers using the CRISPR-Cas12a system.
Identify the amino acid sequence of your protein.
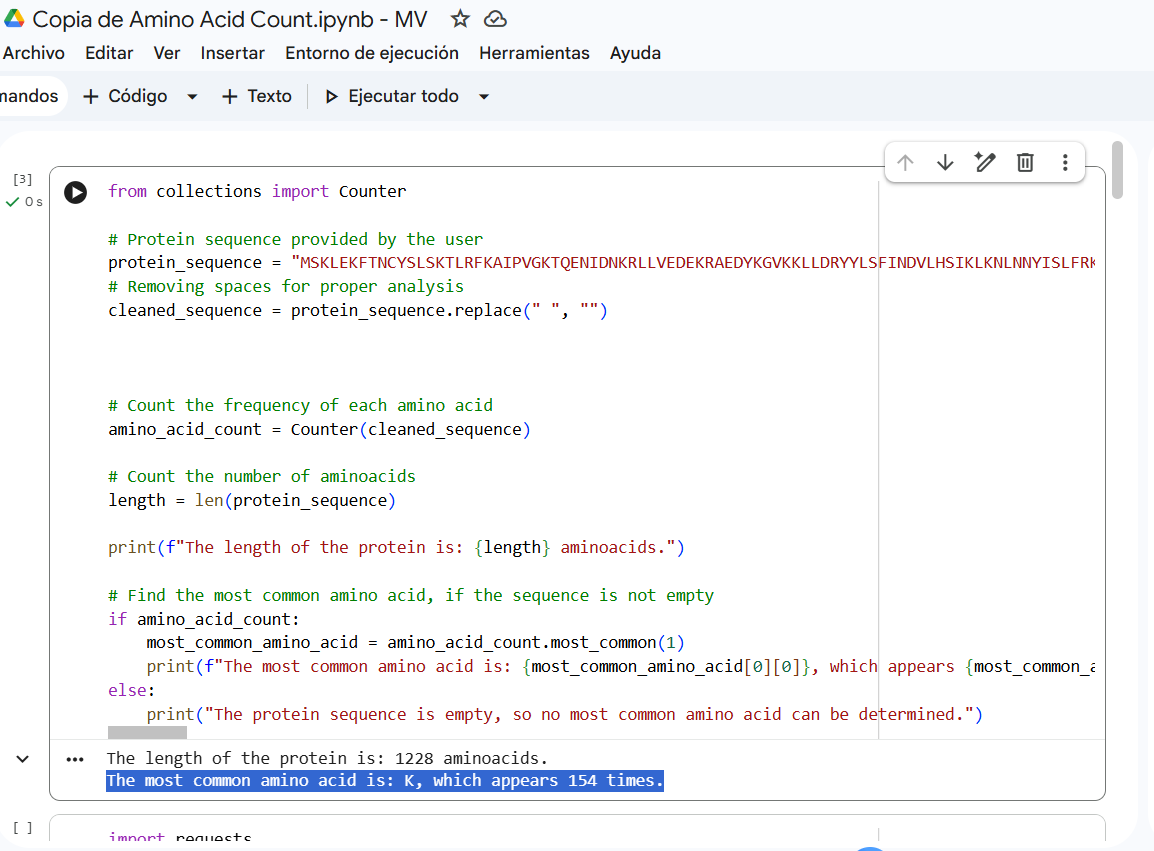
How long is it? What is the most frequent amino acid? You can use this Colab notebook to count the frequency of amino acids.
Sequence length: 1,228 AA. According to google Colab script, the most common amino acid is: K, which appears 154 times.
How many protein sequence homologs are there for your protein? Hint: Use Uniprot’s BLAST tool to search for homologs.
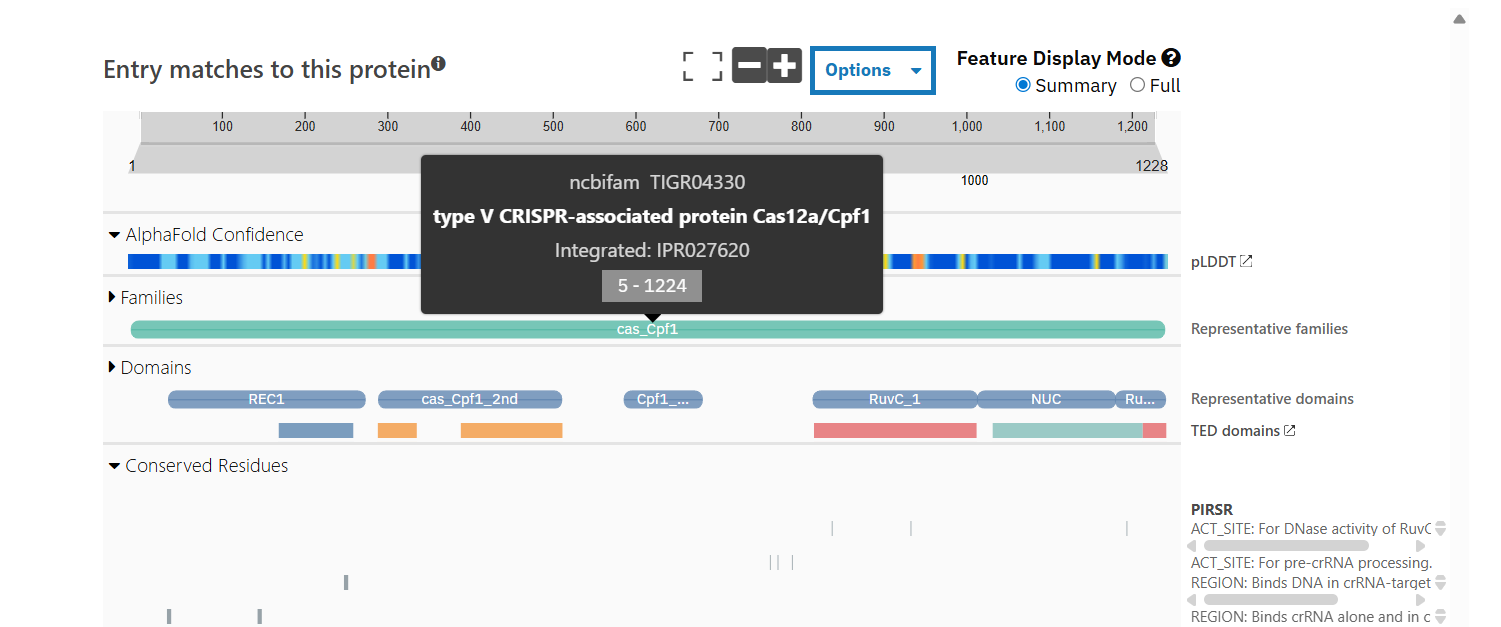
Does your protein belong to any protein family?
According to Interpro, family membership: CRISPR-associated endonuclease Cas12a.
NCBIFam: type V CRISPR-associated protein Cas12a/Cpf1
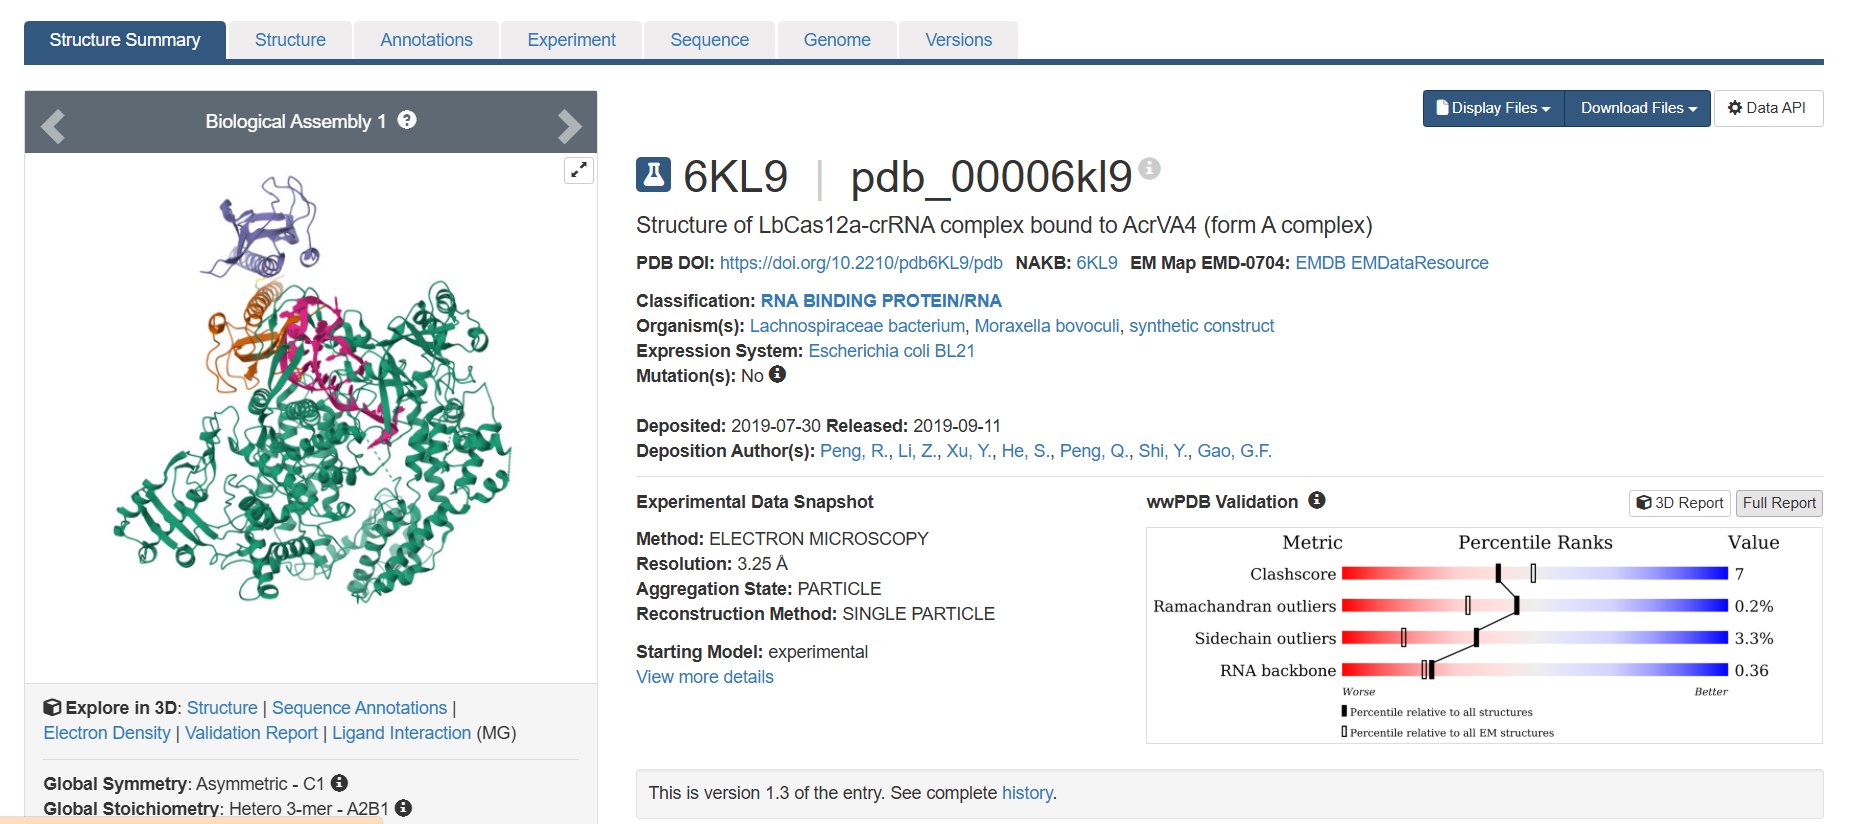
Identify the structure page of your protein in RCSB
When was the structure solved? Is it a good quality structure? Good quality structure is the one with good resolution. Smaller the better (Resolution: 2.70 Å)
The structure was deposited in July 2019 and solved at 3.25 Å resolution by cryo-EM. This is considered a good-quality structure for electron microscopy.
Are there any other molecules in the solved structure apart from protein?
Yes, it is a complex. There are several molecules such as AcrVA4 protein, Mg+2 ion and RNA (42-MER) (crRNA).
Does your protein belong to any structure classification family?
When I enter the PDB ID in the search bar, no results appear.
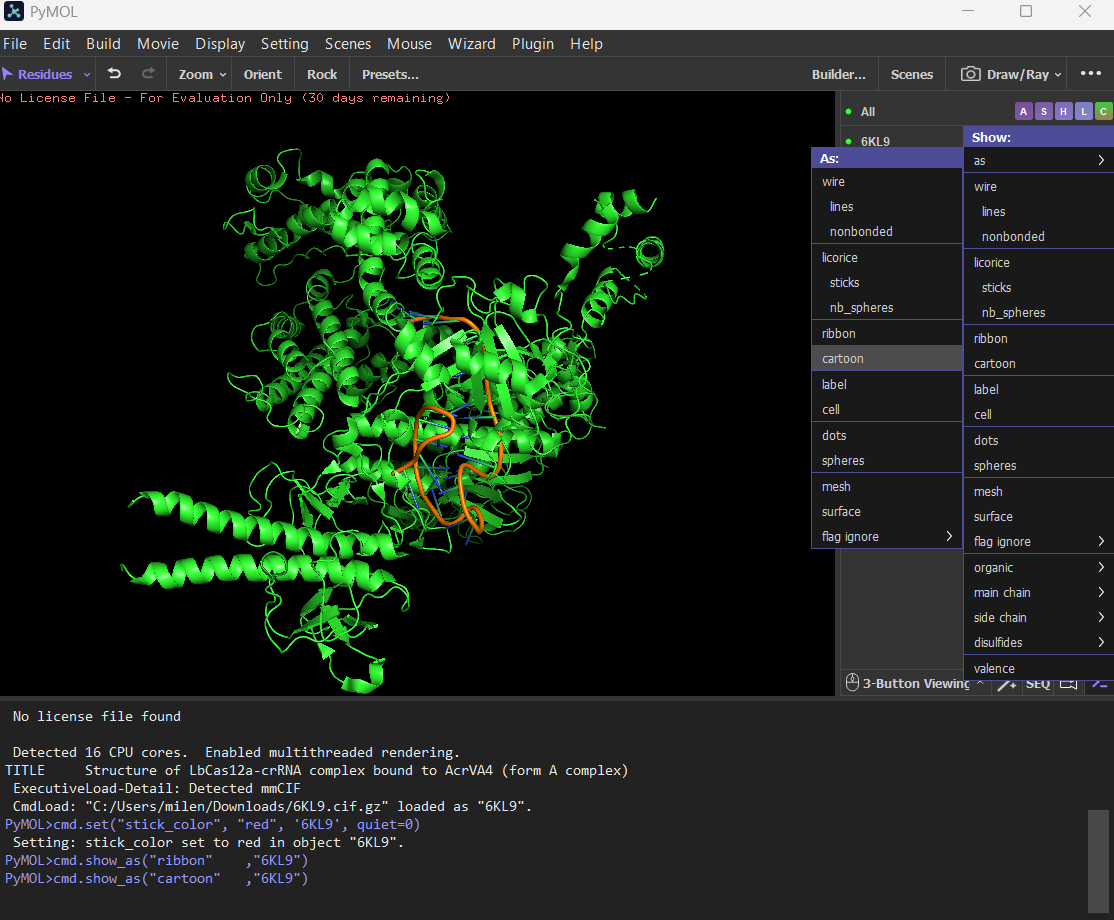
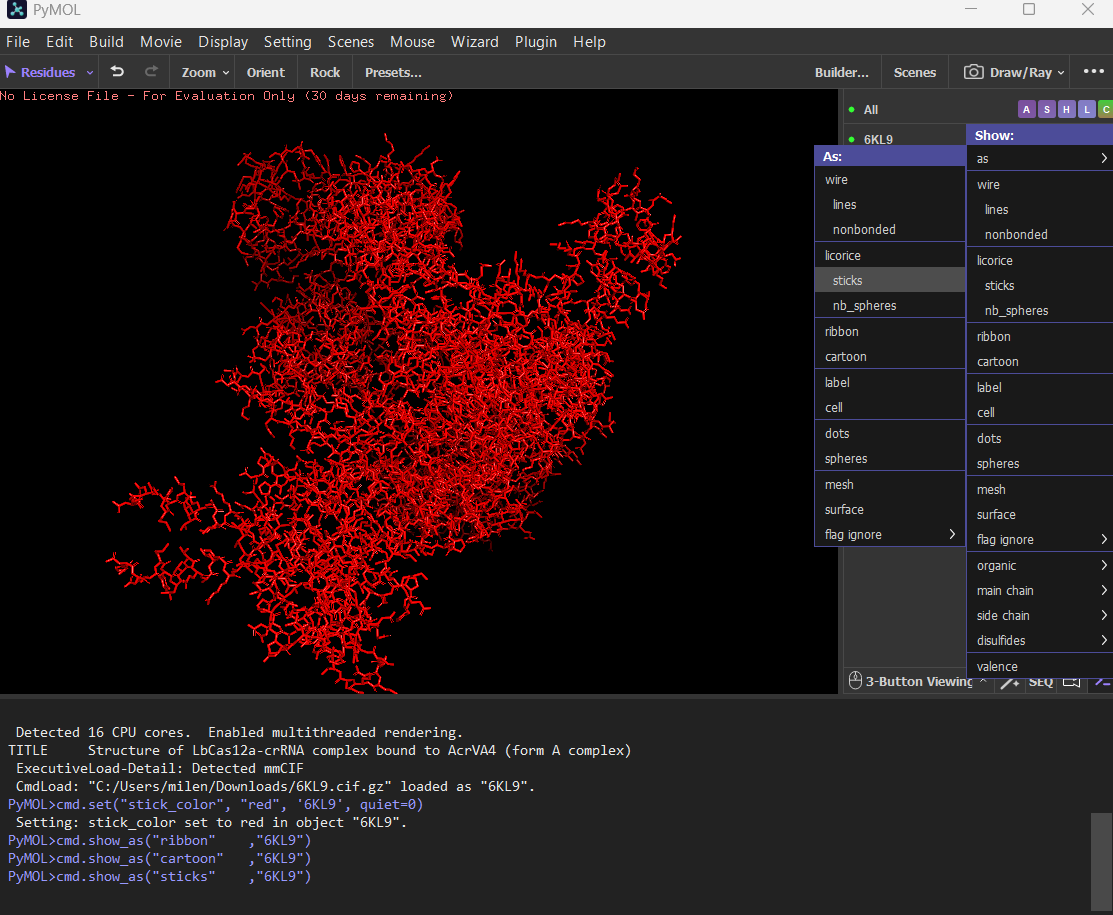
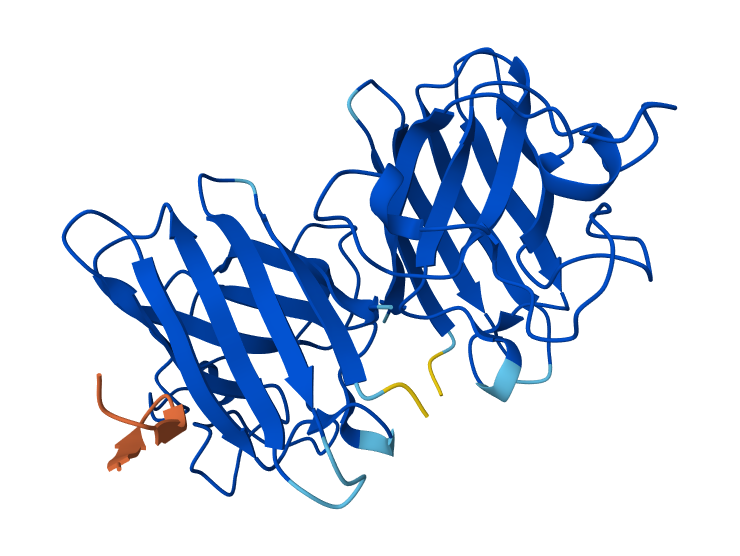
Open the structure of your protein in any 3D molecule visualization software:
PyMol Tutorial Here (hint: ChatGPT is good at PyMol commands)
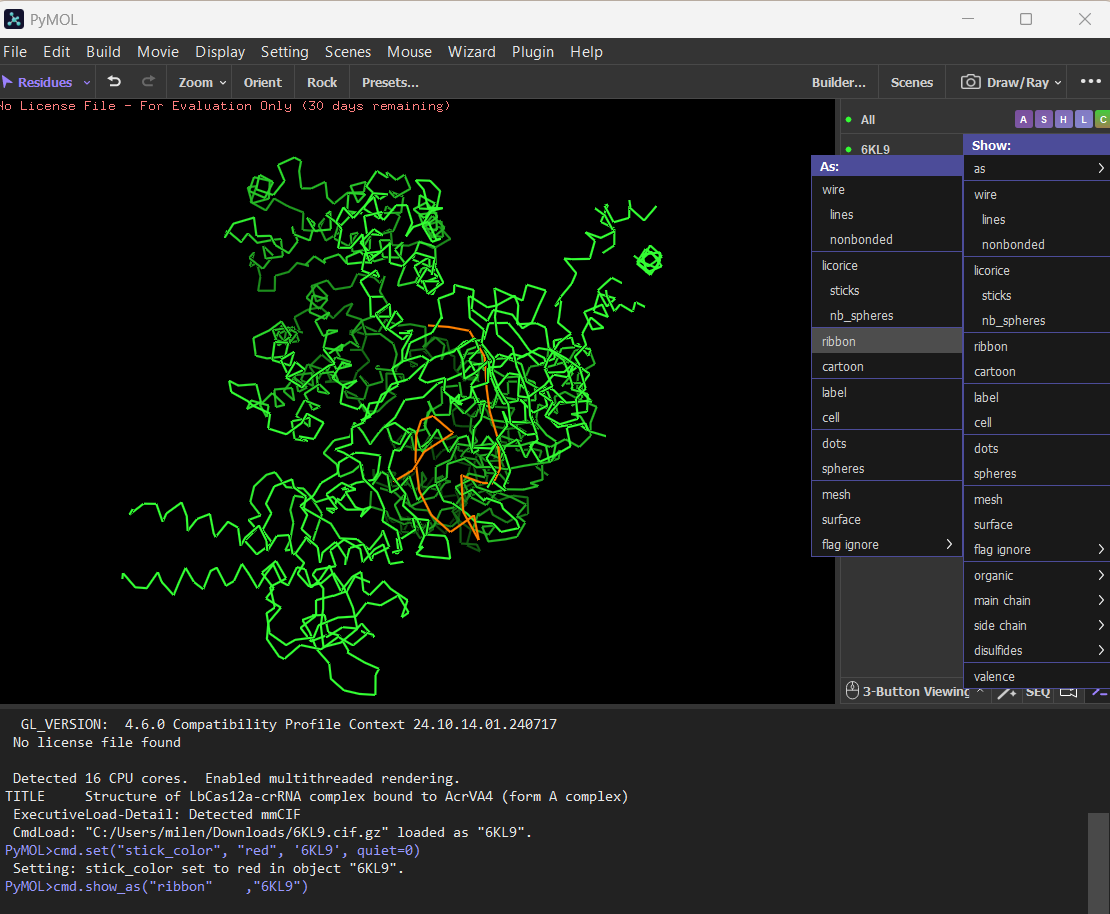
Visualize the protein as “cartoon”, “ribbon” and “ball and stick”.
Cartoon
Ribbon
Ball and stick
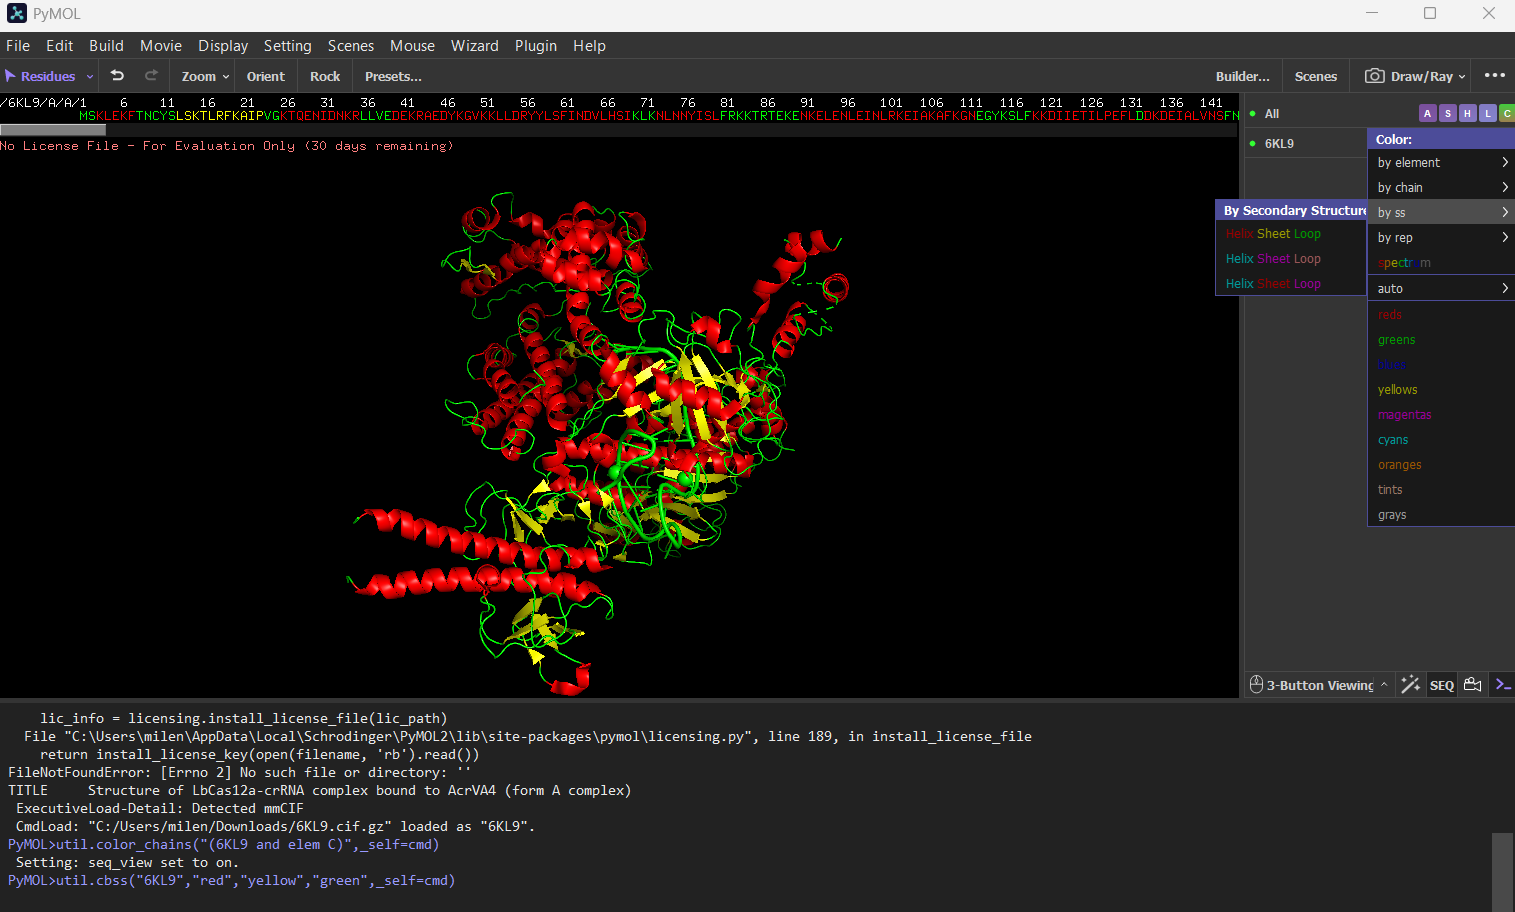
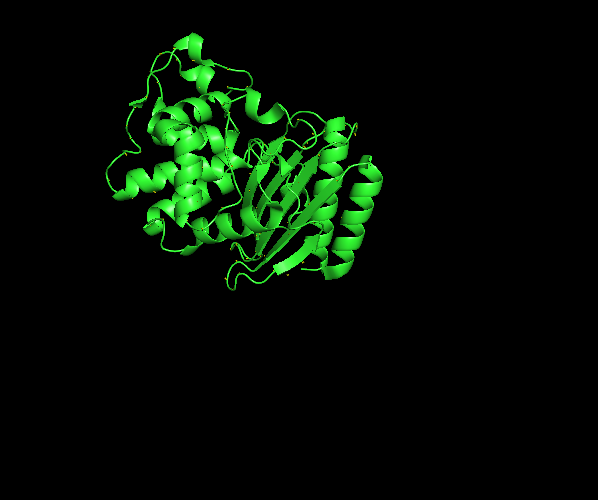
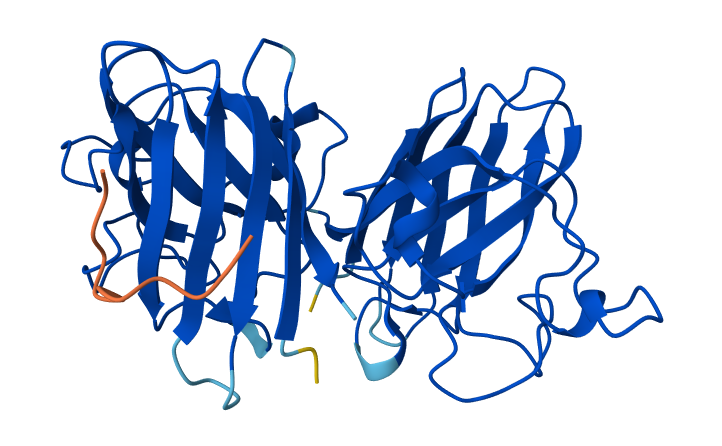
Color the protein by secondary structure. Does it have more helices or sheets?
The protein has more helices (red) than sheets (yellow).
It is predominantly alpha-helical, with fewer beta-sheet regions.
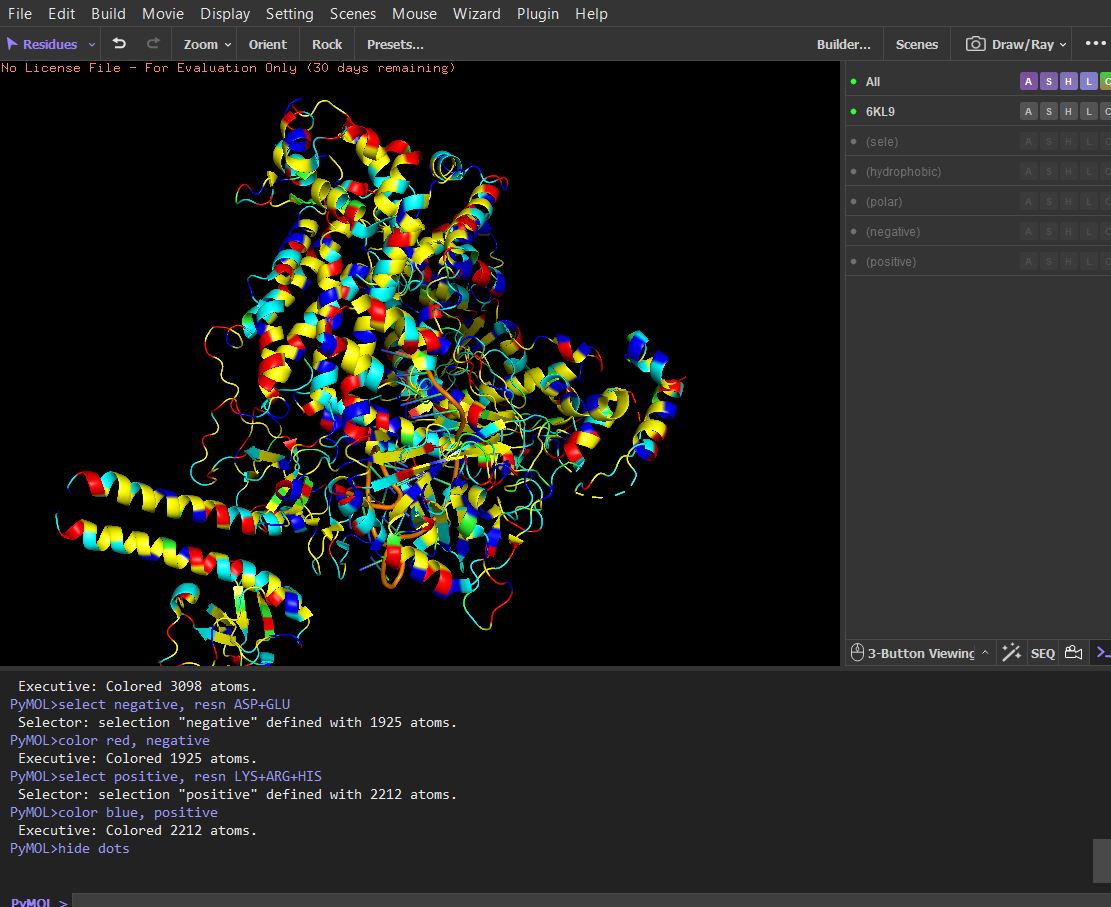
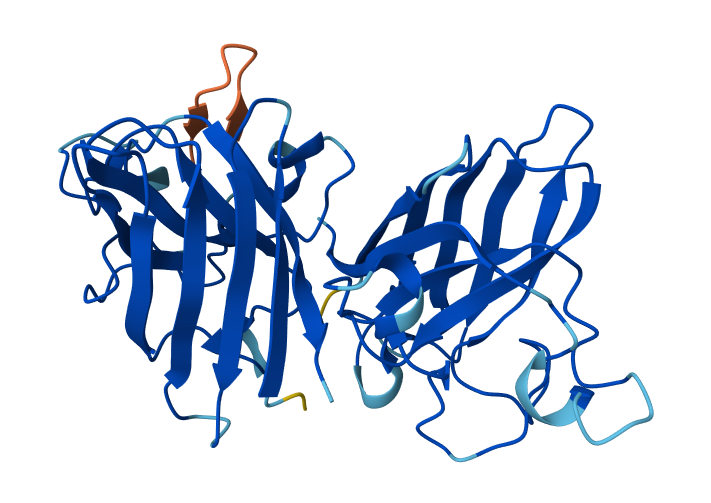
Color the protein by residue type. What can you tell about the distribution of hydrophobic vs hydrophilic residues?
Script
Hydrophobic (yellow)
select hydrophobic, resn ALA+VAL+LEU+ILE+MET+PHE+TRP+PRO
color yellow, hydrophobic
Polar without charge (cyan)
select polar, resn SER+THR+ASN+GLN+TYR
color cyan, polar
Negatives (red)
select negative, resn ASP+GLU
color red, negative
Positives (blue)
select positive, resn LYS+ARG+HIS
color blue, positive
After coloring the protein by residue type, hydrophobic residues (ALA, VAL, LEU, ILE, MET, PHE, TRP, PRO) are mainly located in the interior of the protein structure. These residues form the structural core and help stabilize the protein through hydrophobic interactions.
In contrast, hydrophilic and charged residues (SER, THR, ASN, GLN, TYR, ASP, GLU, LYS, ARG, HIS) are predominantly exposed on the surface. Many positively charged residues are concentrated in the nucleic acid-binding region, which is consistent with the protein’s function in binding negatively charged RNA and DNA molecules.
Overall, the distribution shows a typical soluble protein organization: a hydrophobic core and a hydrophilic, charged surface.
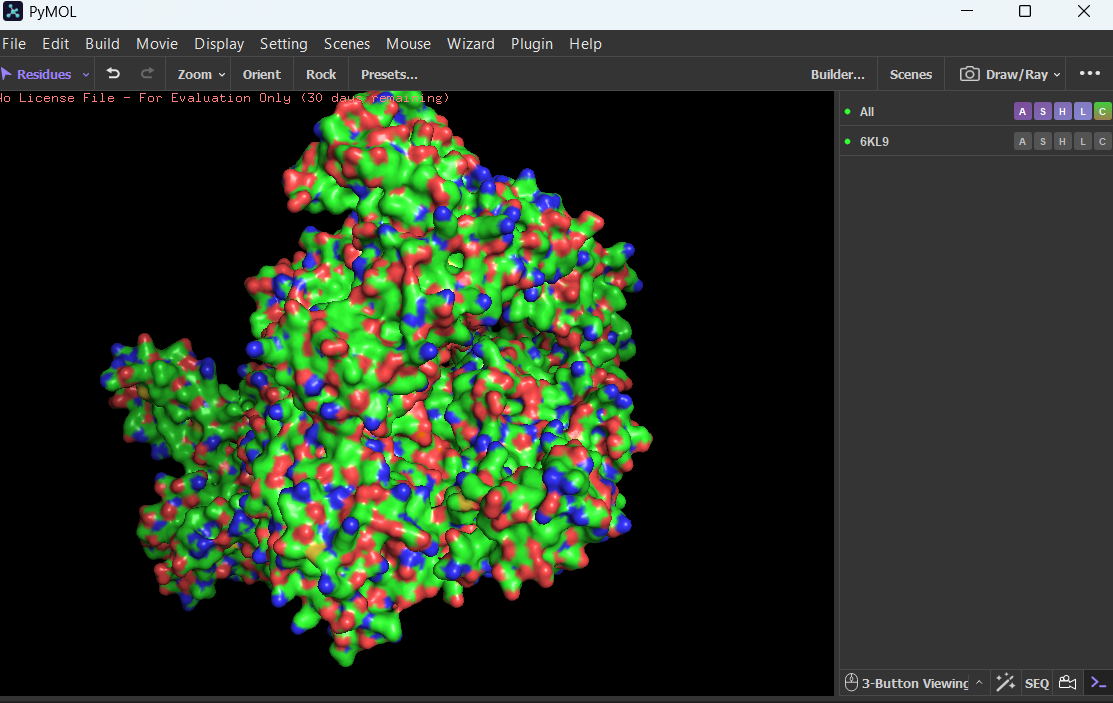
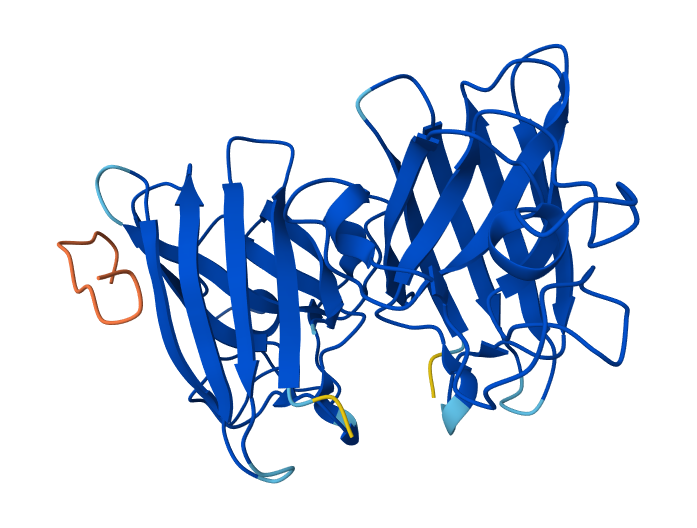
Visualize the surface of the protein. Does it have any “holes” (aka binding pockets)?
Yes, the protein surface shows several cavities and grooves. There is a prominent cleft that likely corresponds to the nucleic acid-binding pocket of Cas12a. These surface indentations are consistent with functional binding sites.
Part C. Using ML-Based Protein Design Tools
In this section, we will learn about the capabilities of modern protein AI models and test some of them in your chosen protein.
Copy the HTGAA_ProteinDesign2026.ipynb notebook and set up a colab instance with GPU.
Choose your favorite protein from the PDB.
We will now try multiple things in the three sections below; report each of these results in your homework writeup on your HTGAA website:
C1. Protein Language Modeling
Deep Mutational Scans
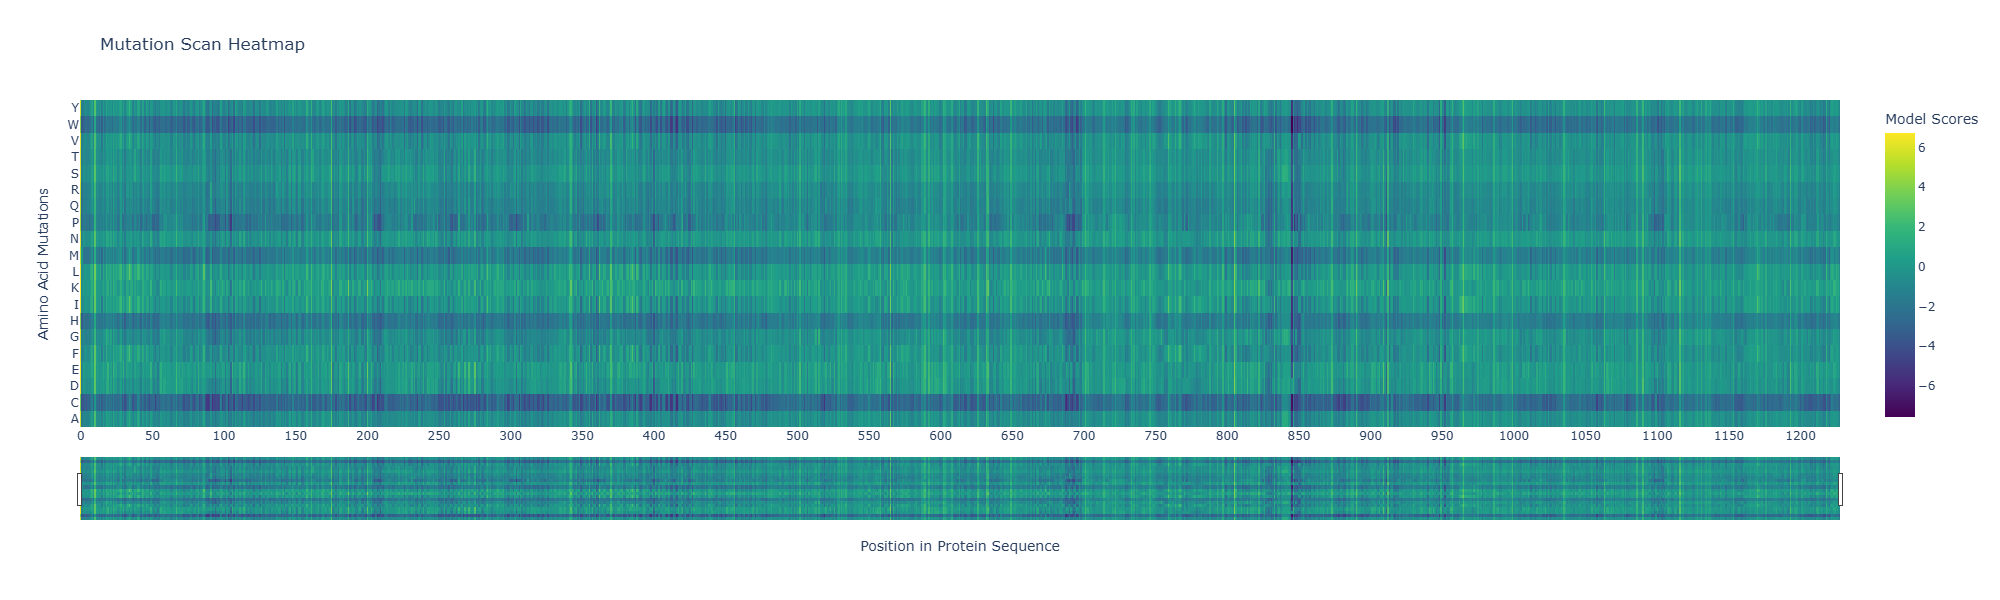
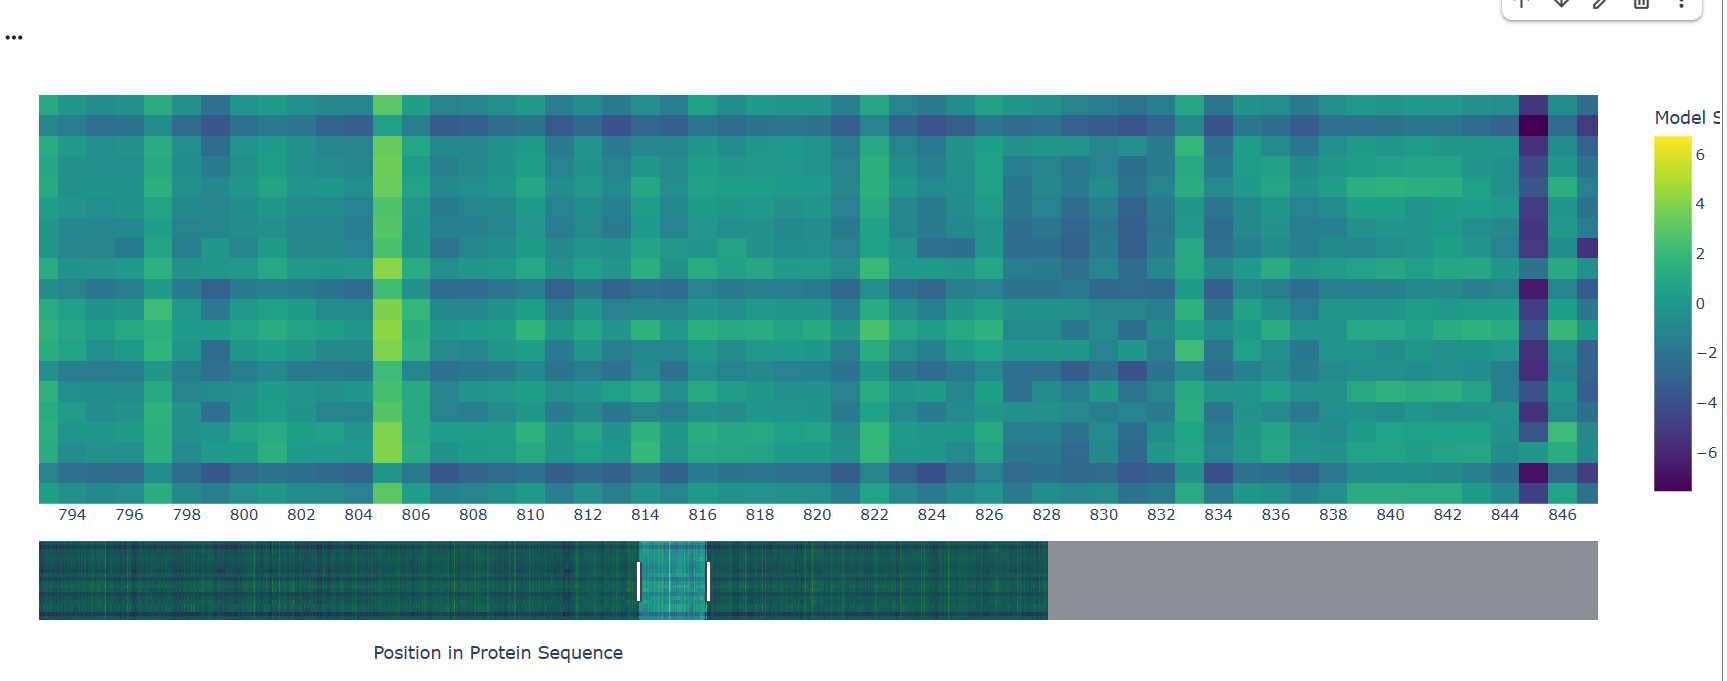
Use ESM2 to generate an unsupervised deep mutational scan of your protein based on language model likelihoods.
Can you explain any particular pattern? (choose a residue and a mutation that stands out)
A notable pattern is observed around position 845, where most substitutions show strongly negative scores, indicating high intolerance to mutation. This suggests that the residue at this position is under strong evolutionary constraint, likely contributing to structural stability or functional activity. In contrast, other regions display more neutral scores, suggesting mutational flexibility.
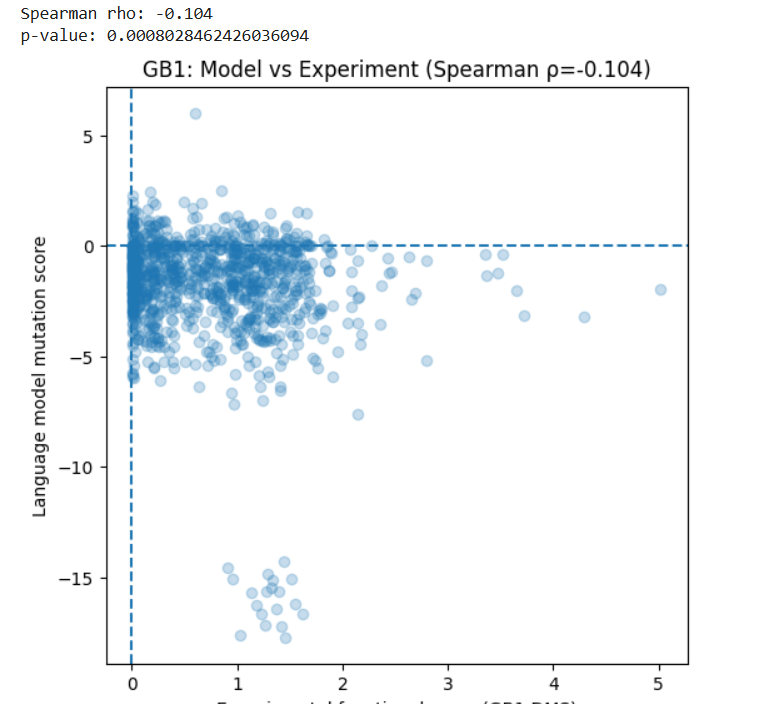
(Bonus) Find sequences for which we have experimental scans, and compare the prediction of the language model to experiment.
I used the GB1 protein deep mutational scanning (DMS) dataset from Olson et al. (2014), available in MaveDB. This dataset contains experimental measurements of how single amino acid mutations affect the function of a 55 amino acid protein. I used this protein sequence established in the article: protein_sequence = “QYKLILNGKTLKGETTTEAVDAATAEKVFKQYANDNGVDGEWTYDDATKTFTVTE”
I generated mutation scores for the same protein using the ESM2 language model. For each possible single mutation, I calculated how likely the mutation is compared to the wild-type amino acid.
Then, I compared the model scores with the experimental functional scores using Spearman correlation.
Results:
Spearman ρ = -0.104
p-value = 8 × 10⁻⁴
This shows a very weak negative correlation between the model predictions and the experimental data.
In simple terms, the language model does not strongly predict which mutations improve or reduce protein function in this case.
This may be because:
The model is trained to predict natural sequence patterns, not experimental fitness.
Protein function depends on structural and biophysical effects that may not be fully captured by sequence likelihood.
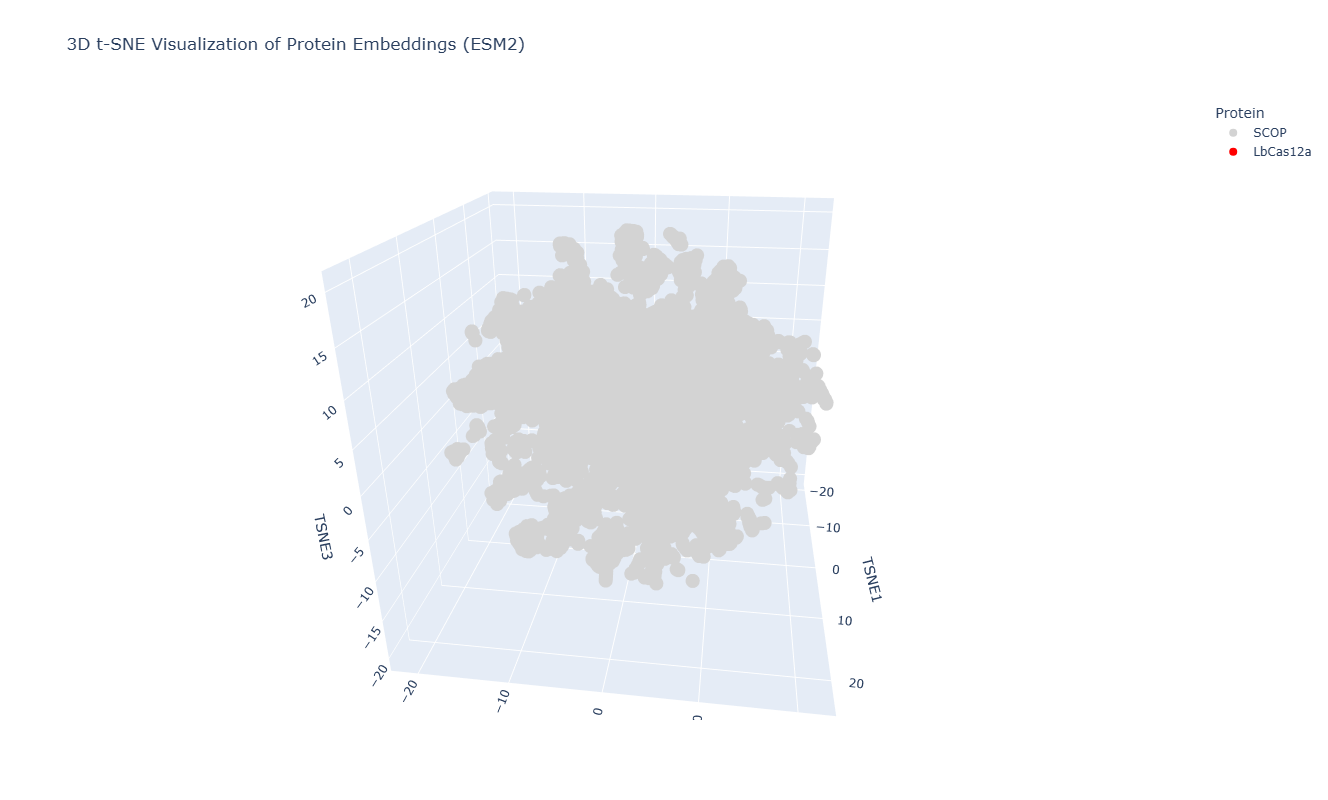
Latent Space Analysis
Use the provided sequence dataset to embed proteins in reduced dimensionality.
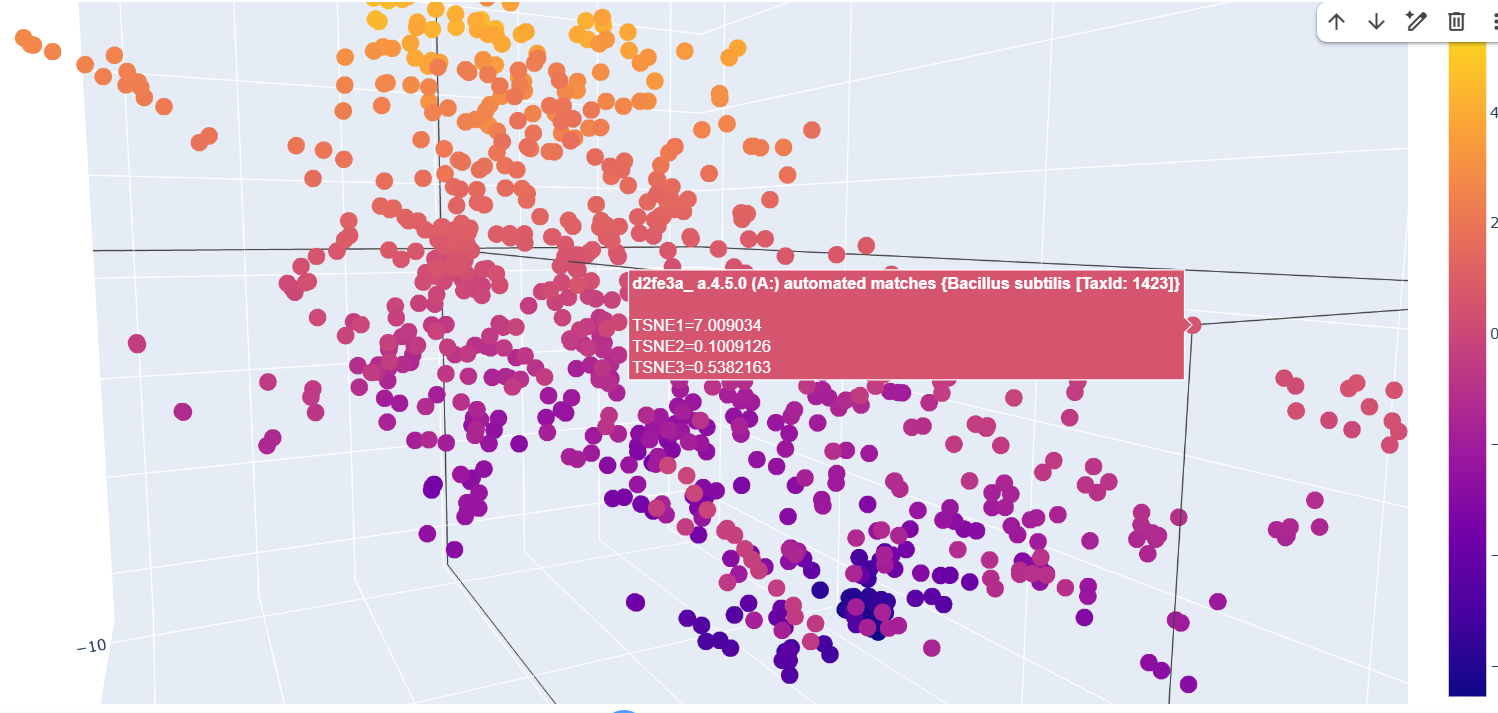
Analyze the different formed neighborhoods: do they approximate similar proteins?
The formed neighborhoods approximate structurally similar proteins rather than taxonomically related ones. For example, sequences from Francisella tularensis, Campylobacter jejuni, Streptococcus pyogenes, Vibrio cholerae, and Bacillus subtilis cluster together despite belonging to different bacterial species. All share the SCOP classification a.4.5.0, indicating a common structural fold. This suggests that the embedding captures structural similarity across evolutionary distance.
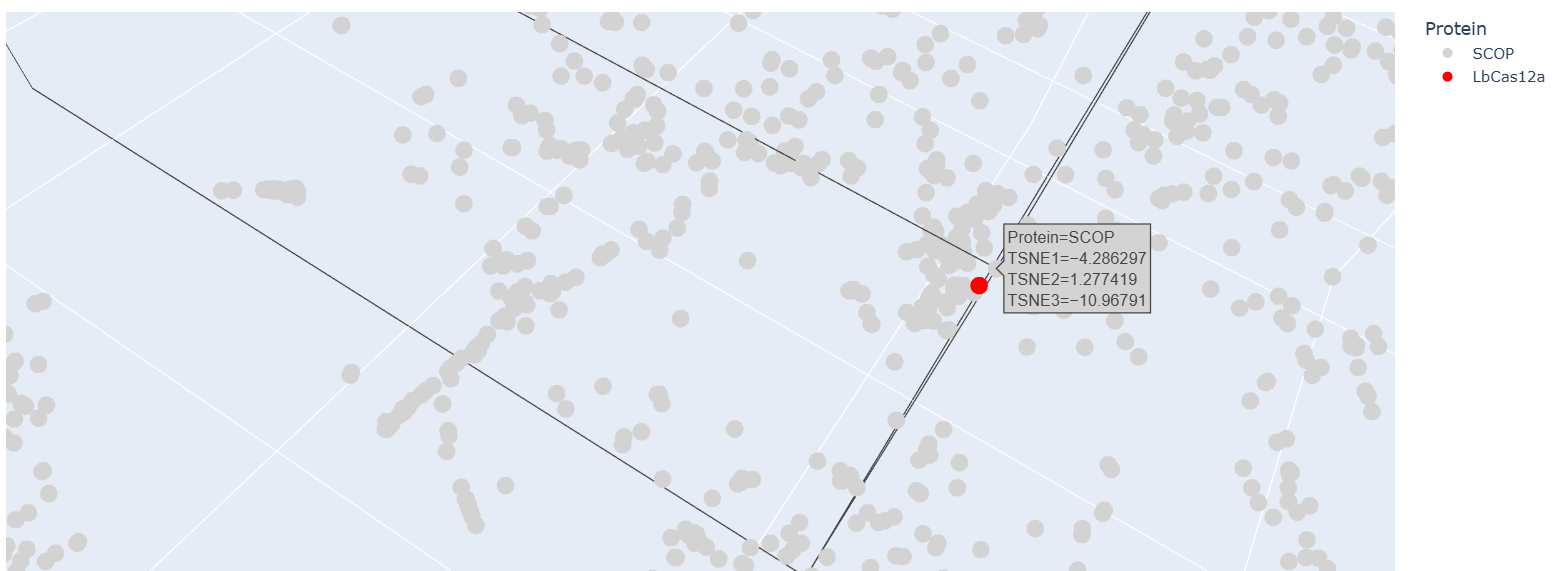
Place your protein in the resulting map and explain its position and similarity to its neighbors.
After embedding SCOP domain proteins using ESM2 and reducing dimensionality with t-SNE, I placed LbCas12a into the same latent space.
The SCOP proteins form a broad, continuous distribution rather than sharply separated clusters, reflecting the diversity of protein folds in the dataset.
LbCas12a appears within the overall distribution rather than being completely isolated. It lies near a local group of SCOP proteins, suggesting that the language model identifies some similarity in sequence patterns or structural features between LbCas12a and those neighboring proteins.
Because embeddings were generated using mean pooling over the entire sequence, the model likely captures global sequence properties rather than specific catalytic functions. Therefore, proximity in latent space reflects general evolutionary and structural similarity rather than precise functional classification.
C2. Protein Folding
Folding a protein
Fold your protein with ESMFold. Do the predicted coordinates match your original structure?
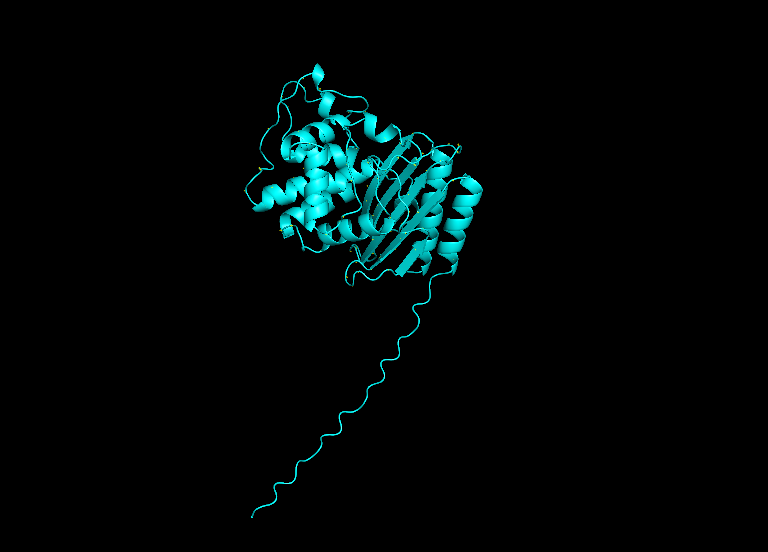
Since LbCas12a is a very large protein, running the ESMfold and inverse folding analyses would be computationally demanding. For this reason, I chose TEM-1 β-lactamase for parts C2 and C3 of the assignment, as its smaller size makes the analysis faster and easier to perform. The structure predicted by ESMFold closely matches the experimentally determined structure. After structural alignment in PyMOL, the RMSD between the predicted and experimental coordinates was 0.44 Å across 252 aligned atoms, indicating a very high structural similarity. The overall fold and arrangement of secondary structure elements are almost identical. Minor deviations occur mainly in flexible terminal regions, which are typically less structured and more difficult to predict accurately. The ESMFold prediction had a high average pLDDT score (~95.9), indicating very high confidence in the predicted structure.
β-lactamase sequence structure from RCSB PDB visualized in Pymol
β-lactamase sequence structure from ESMFold visualized in Pymol
Structural alignment between the experimental β-lactamase structure and the structure predicted by ESMFold in PyMOL
Try changing the sequence, first try some mutations, then large segments. Is your protein structure resilient to mutations?
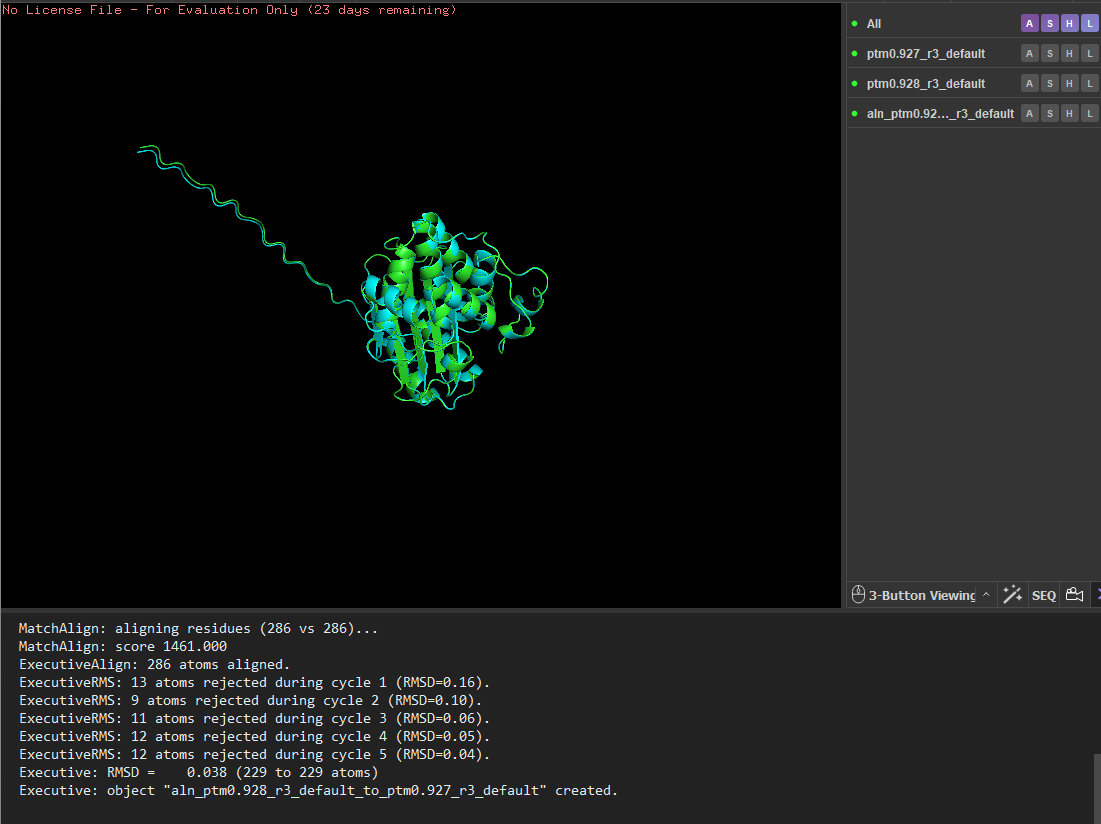
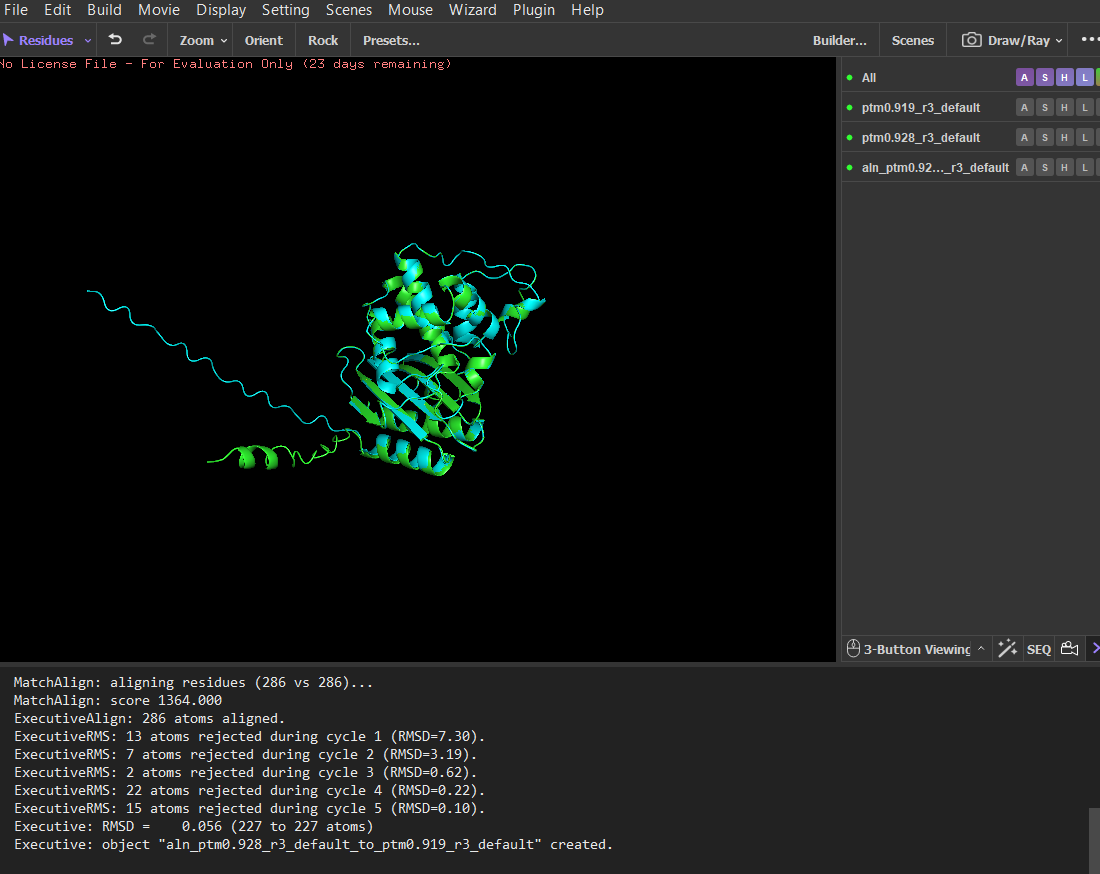
I tested the structural resilience of the protein by introducing point mutations predicted by the mutational scan. I first mutated residue 68 to glutamate (E), which was predicted to be unfavorable (blue), and then mutated residue 59 to aspartate (D), which was predicted to be tolerated (green). For each mutant sequence, I predicted the structure using ESMFold and aligned it with the original predicted structure in PyMOL. The alignments produced extremely low RMSD values (0.057 Å for the mutation at position 68 and 0.038 Å for the mutation at position 59), indicating that the global protein fold remained essentially unchanged. These results suggest that the protein structure is highly resilient to single amino-acid substitutions, as these mutations do not significantly alter the overall structure.
Residue 68 was mutated to glutamate (E), and the mutated structure was aligned with the original ESMFold-predicted structure using PyMOL.
Residue 59 was mutated to aspartate (D), and the mutated structure was aligned with the original ESMFold-predicted structure using PyMOL.
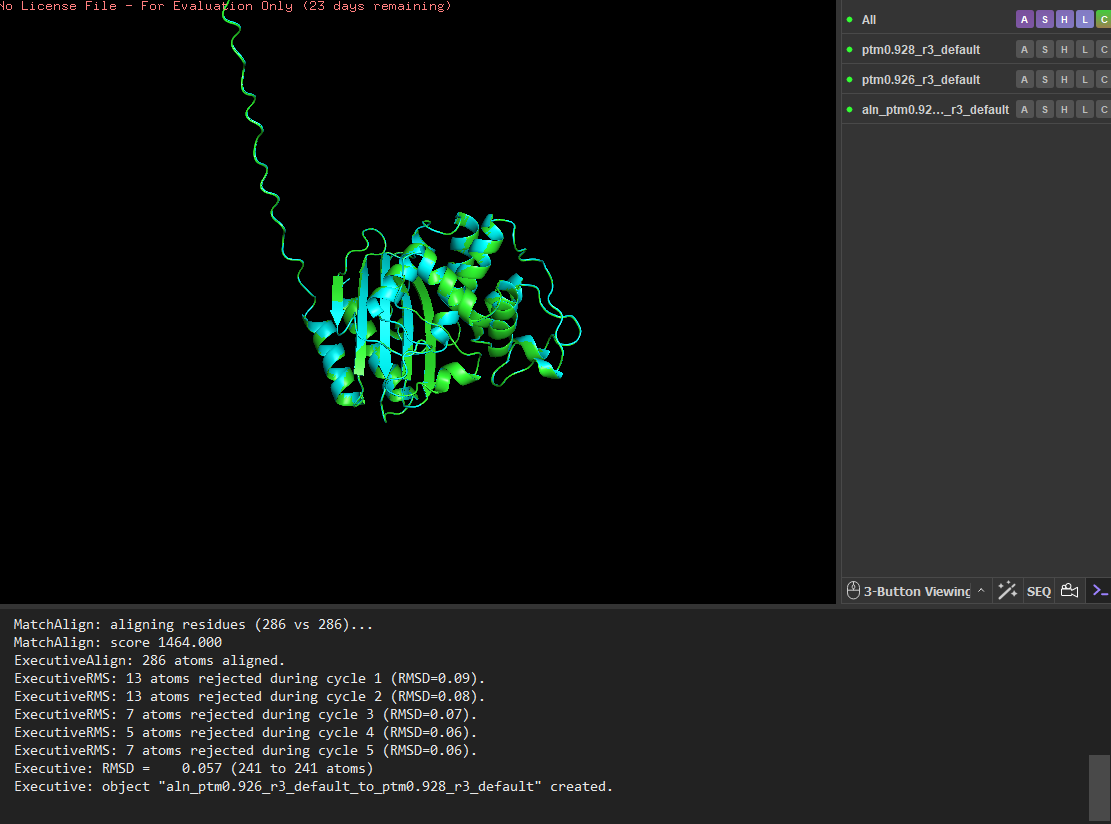
I then mutated a larger segment (residues 8-14) by replacing them with glutamate residues. The initial alignment showed larger deviations, suggesting local structural changes. However, after alignment refinement, the core structure still aligned well with a low RMSD (~0.056 Å), indicating that the overall fold remained stable. These results suggest that the protein structure is highly resilient to both point mutations and small segment mutations, with most structural changes occurring in flexible regions rather than the stable core.
14 residues were mutated to glutamate (E), and the mutated structure was aligned with the original ESMFold-predicted structure using PyMOL.
C3. Protein Generation
Inverse-Folding a protein: Let’s now use the backbone of your chosen PDB to propose sequence candidates via ProteinMPNN
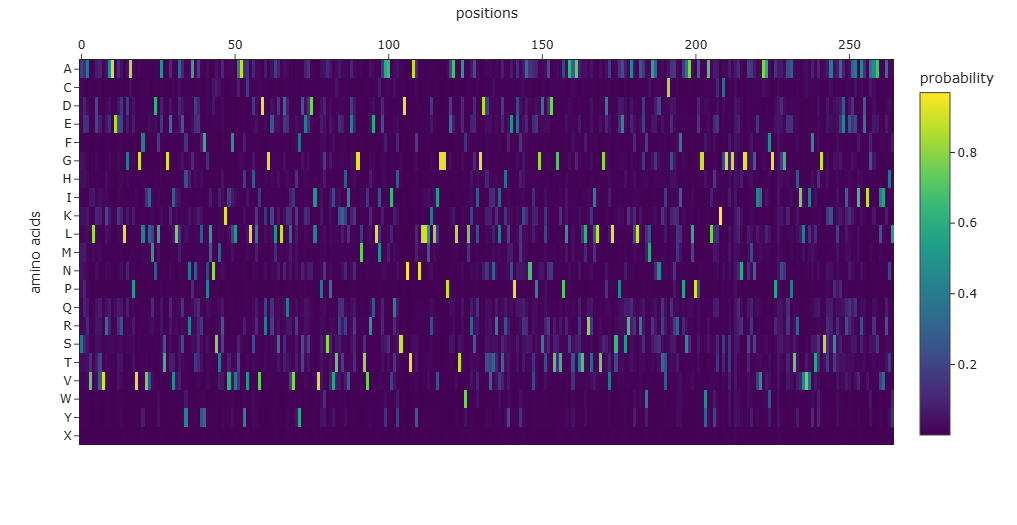
Analyze the predicted sequence probabilities and compare the predicted sequence vs the original one.
The amino-acid probability heatmap shows the probability of each residue at every position of the protein backbone. Positions with strong probability peaks correspond to residues that are strongly preferred by the model, indicating structurally constrained sites such as buried residues or catalytic positions. Positions with lower probabilities across many amino acids correspond to more flexible or surface-exposed regions. The designed sequence generated by ProteinMPNN has a score of 0.7625, which represents the negative log-likelihood of the sequence given the backbone structure, with lower scores indicating better structural compatibility. The sequence recovery of 0.4867 indicates that approximately 48.7% of the residues match the native sequence, demonstrating that multiple sequences can adopt the same protein fold.
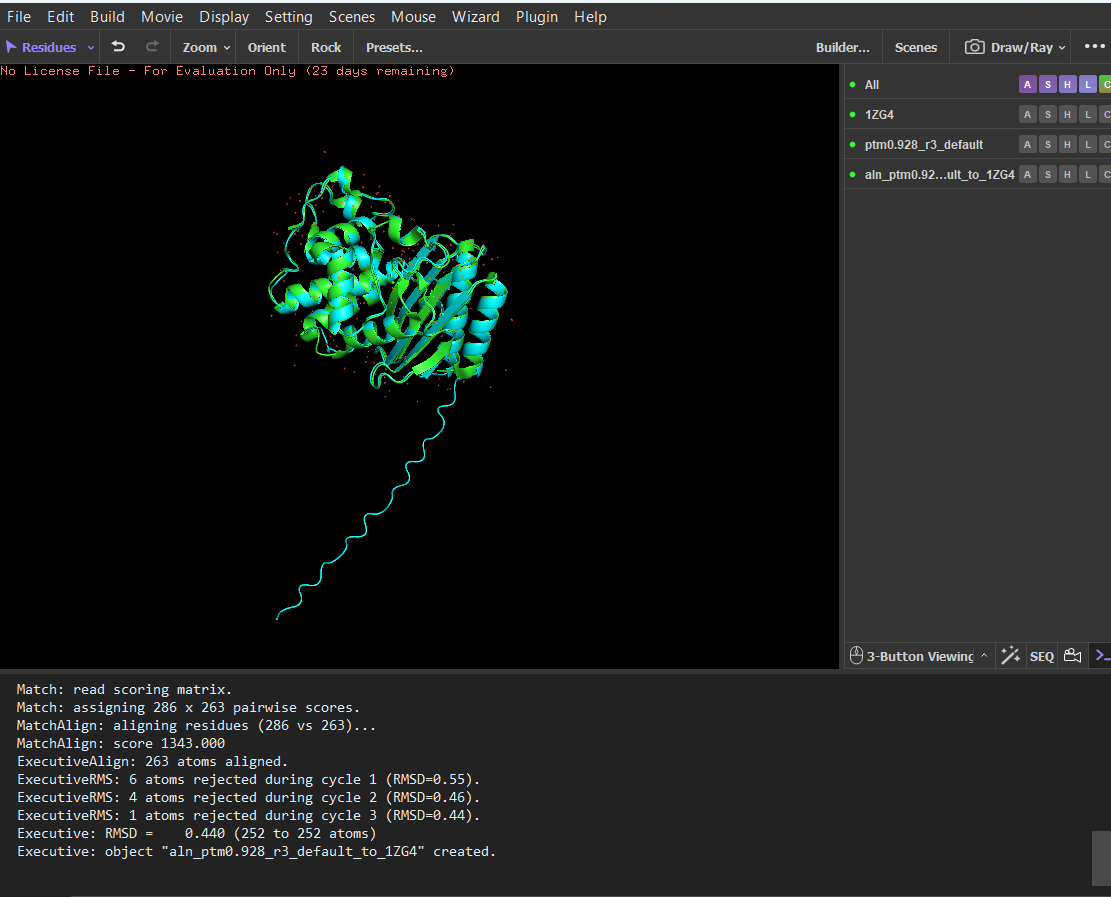
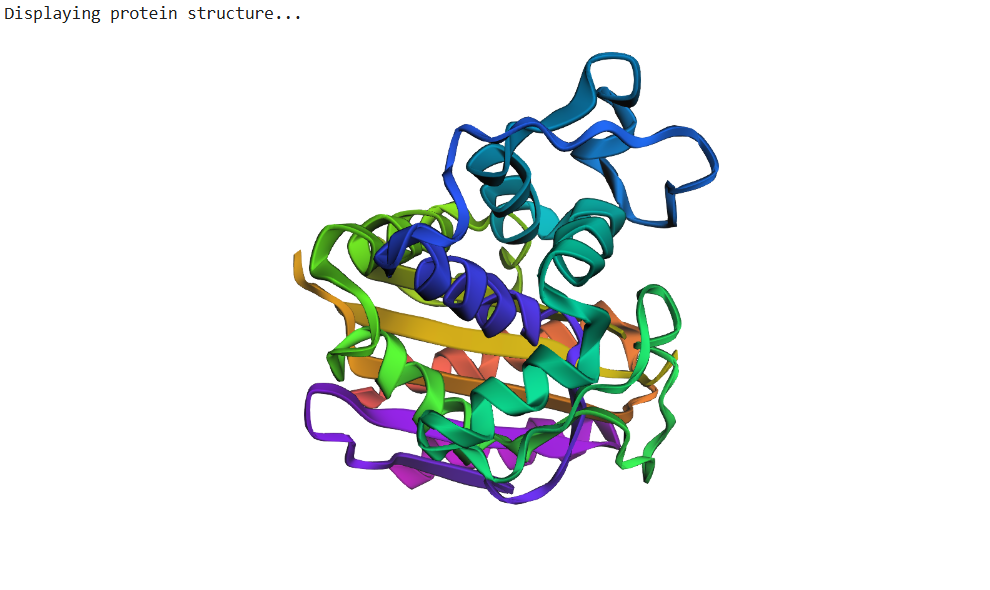
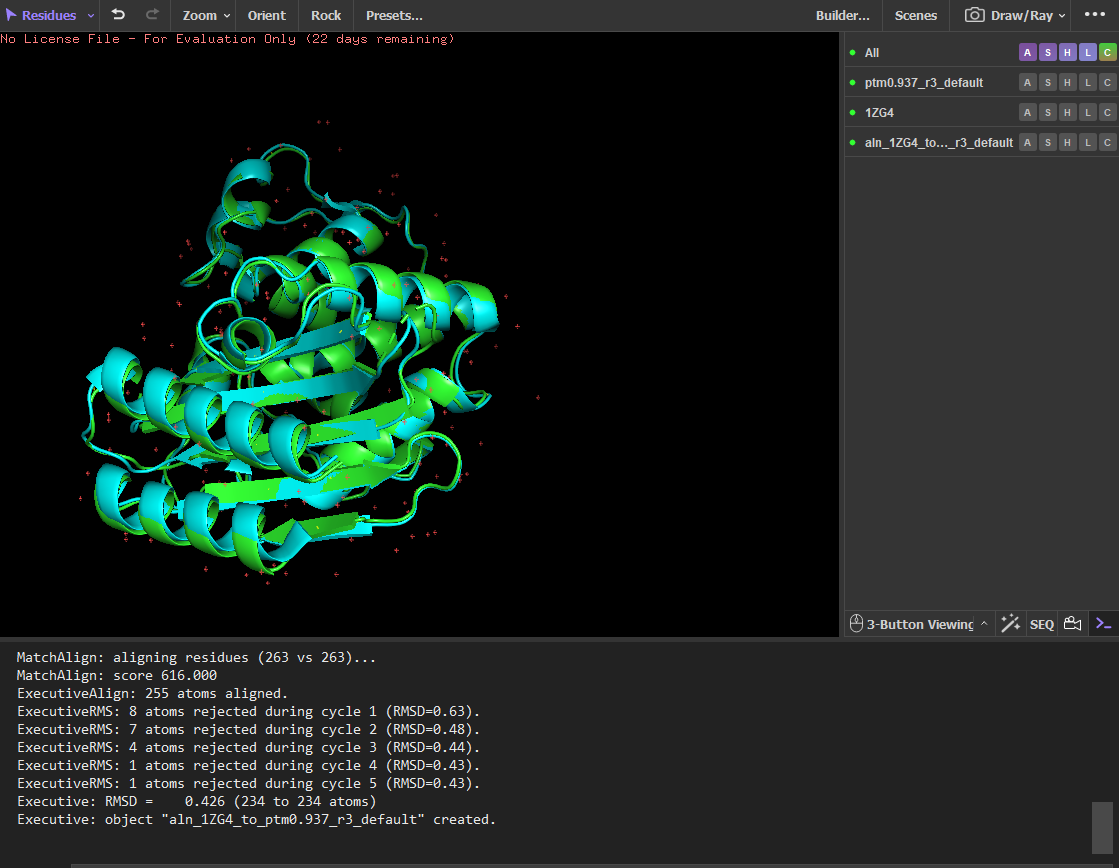
Input this sequence into ESMFold and compare the predicted structure to your original.
The sequence generated by the inverse folding model (ProteinMPNN) was used as input for ESMFold to predict its structure. The predicted structure was then aligned with the original crystal structure (PDB: 1ZG4) using PyMOL. Despite the sequence recovery being approximately 48%, the structural alignment shows a very low RMSD value of 0.426 Å, indicating that the two structures are nearly identical. This result demonstrates that different amino-acid sequences can adopt very similar three-dimensional folds, highlighting that protein structure is often more conserved than sequence.
References
Balasco, N., Diaferia, C., Morelli, G., Vitagliano, L., & Accardo, A. (2021). Amyloid-like aggregation in diseases and biomaterials: Osmosis of structural information. Frontiers in Bioengineering and Biotechnology, 9. https://doi.org/10.3389/fbioe.2021.641372
Cheng, P.-N., Liu, C., Zhao, M., Eisenberg, D., & Nowick, J. S. (2012). Amyloid β-sheet mimics that antagonize protein aggregation and reduce amyloid toxicity. Nature Chemistry, 4(11), 927–933. https://doi.org/10.1038/nchem.1433
Doig, A. J. (2017). Frozen, but no accident – why the 20 standard amino acids were selected. The FEBS Journal, 284(9), 1296–1305. https://doi.org/10.1111/febs.13982
Kirschning, A. (2022). On the evolutionary history of the twenty encoded amino acids. Chemistry – A European Journal, 28(55). https://doi.org/10.1002/chem.202201419
Week 5 HW: Protein Design part II
My Homework
Part 1: Generate Binders with PepMLM
Begin by retrieving the human SOD1 sequence from UniProt (P00441) and introducing the A4V mutation.
Using the PepMLM Colab linked from the HuggingFace PepMLM-650M model card:
Generate four peptides of length 12 amino acids conditioned on the mutant SOD1 sequence.
To your generated list, add the known SOD1-binding peptide FLYRWLPSRRGG for comparison.
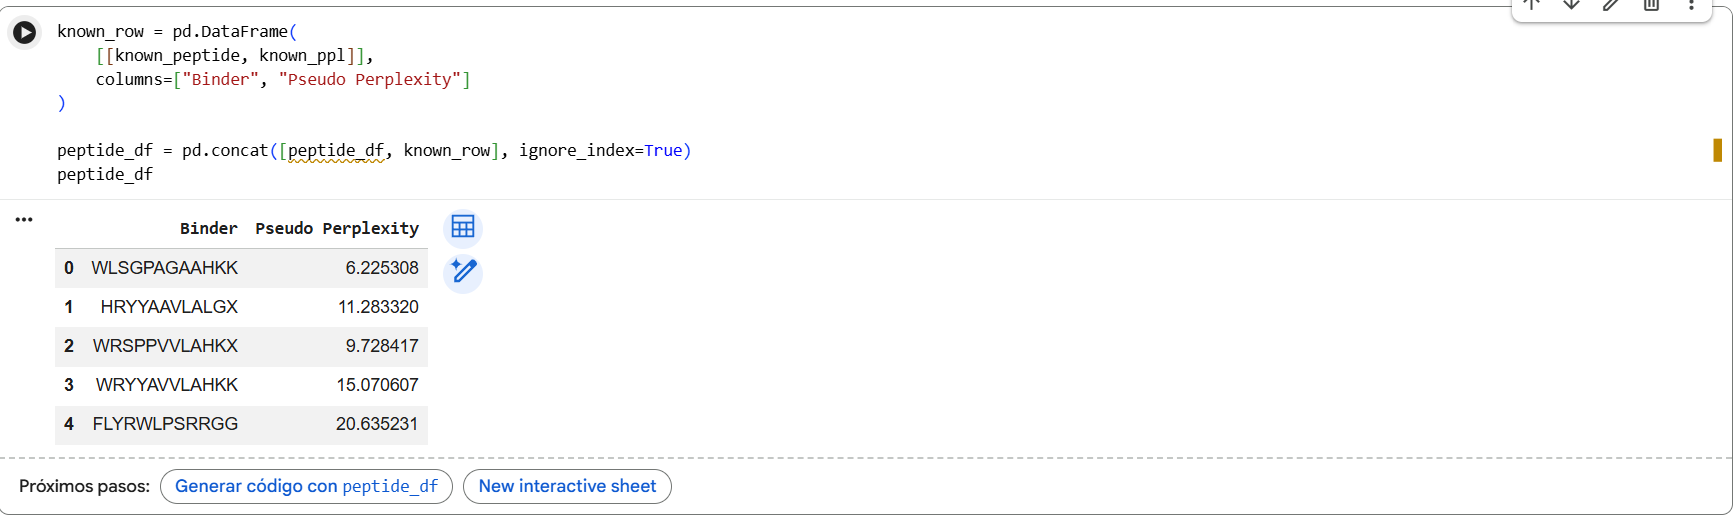
Record the perplexity scores that indicate PepMLM’s confidence in the binders.
Pseudo-perplexity values represent PepMLM’s confidence in each peptide sequence. Lower values indicate sequences that are more consistent with patterns learned by the model. In our results, the generated peptides showed lower perplexity scores (6.2-15.1) compared with the known SOD1-binding peptide FLYRWLPSRRGG (20.6), suggesting the model considers the generated sequences more probable under its learned sequence distribution.
In the PepMLM study, most experimentally validated peptide binders exhibit pseudo-perplexity values below ~40, with many falling between approximately 5 and 20. Lower PPL values indicate higher model confidence in the peptide-protein interaction. In our results, the generated peptides showed PPL values between 6.2 and 15.1, which fall within the range reported in the paper, while the known SOD1-binding peptide had a higher PPL of 20.6, suggesting lower confidence by the model.
Part 2: Evaluate Binders with AlphaFold3
Navigate to the AlphaFold Server: alphafoldserver.com
For each peptide, submit the mutant SOD1 sequence followed by the peptide sequence as separate chains to model the protein-peptide complex.
Record the ipTM score and briefly describe where the peptide appears to bind. Does it localize near the N-terminus where A4V sits? Does it engage the β-barrel region or approach the dimer interface? Does it appear surface-bound or partially buried?
In a short paragraph, describe the ipTM values you observe and whether any PepMLM-generated peptide matches or exceeds the known binder.
The amino acid X represents an unknown or unspecified residue predicted by PepMLM. Since AlphaFold does not accept ambiguous residues, alanine (A) was used as a replacement. Alanine is commonly used in protein modeling because it has a small, non-reactive side chain, which minimizes steric and chemical effects on the predicted structure. This makes it a reasonable neutral placeholder that is unlikely to strongly bias peptide-protein interactions in the model.
Index
Peptide
iPTM
Binding description
0
WRYGATGVAHKK
0.80
Peptide binds on the surface of the β-barrel of one SOD1 monomer, away from the N-terminus. The interaction appears surface-bound and does not strongly approach the dimer interface.
1
WRYPATALRHKX
0.87
Peptide binds along the β-barrel surface of one monomer, distant from the N-terminal region. The peptide remains solvent-exposed and mostly surface-associated and it is away from the dimer interface.
2
WHYPAAGVEHGX
0.65
Peptide interacts with loop regions on the protein surface, away from the N-terminus, β-barrel core and dimer interface. Binding appears weak and loosely surface-bound.
3
WHYYATGAAHGX
0.86
Peptide binds near the β-barrel surface, not close to the N-terminal A4V region and dimer interface. Interaction occurs on the outer protein surface.
4
FLYRWLPSRRGG (known binder)
0.89
Peptide binds close to the N-terminus where the A4V mutation is located and lies along the β-barrel surface near the dimer interface.
0-WRYGATGVAHKK & SOD1 Mutant
1-WRYPATALRHKX & SOD1 Mutant
2-WHYPAAGVEHGX & SOD1 Mutant
3-WHYYATGAAHGX & SOD1 Mutant
4-FLYRWLPSRRGG & SOD1 Mutant
In AlphaFold predictions, pTM reflects confidence in the overall fold of the protein complex, while ipTM measures the confidence of the interface between interacting chains. ipTM values above ~0.8 indicate high-confidence interfaces, values between 0.6-0.8 represent moderate confidence, and values below 0.6 suggest unreliable interactions.
The predicted complexes show ipTM values between 0.65 and 0.89, indicating mostly moderate to high confidence. Most PepMLM-generated peptides bind to surface regions of the SOD1 β-barrel, but do not localize near the N-terminal A4V region and dimer interface. Only the known binder FLYRWLPSRRGG binds close to the N-terminus and near the dimer interface, and it also produces the highest ipTM score (0.89). Although some generated peptides show relatively high ipTM values (0.87 and 0.86), none match or exceed the known binder in both binding location and interface confidence.
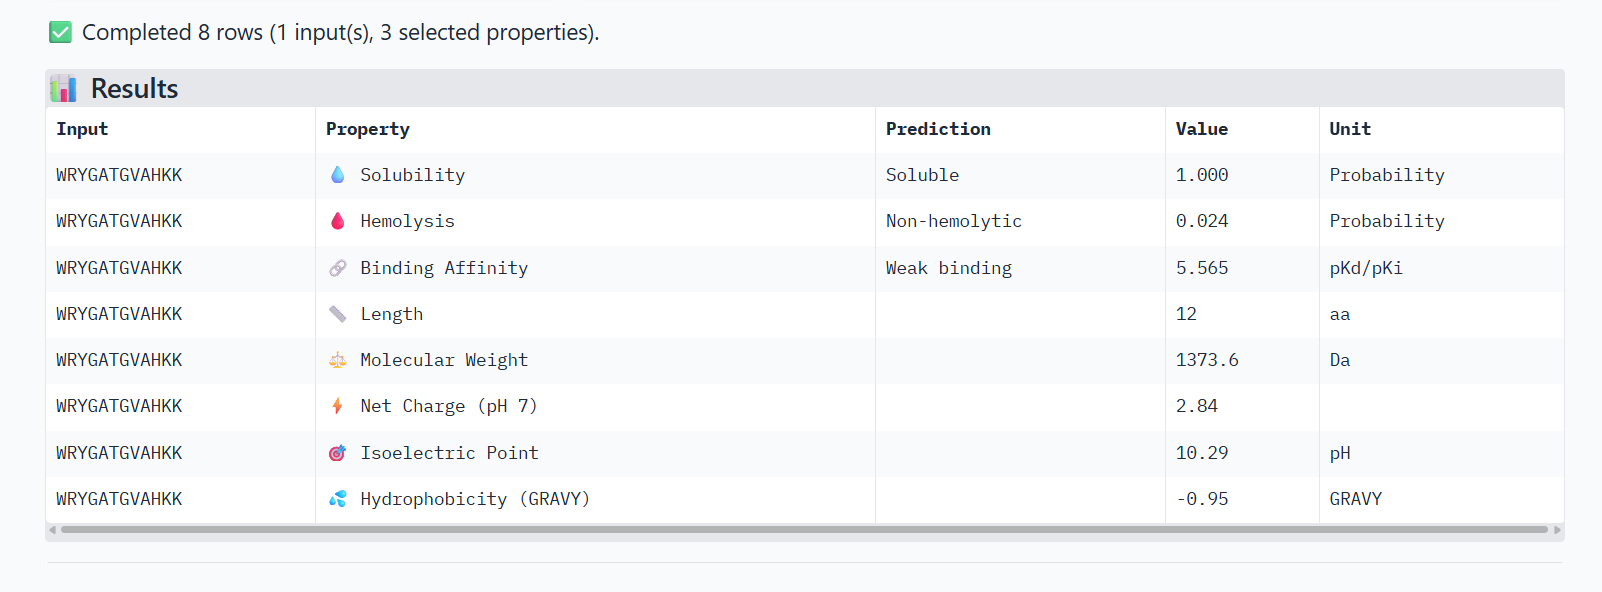
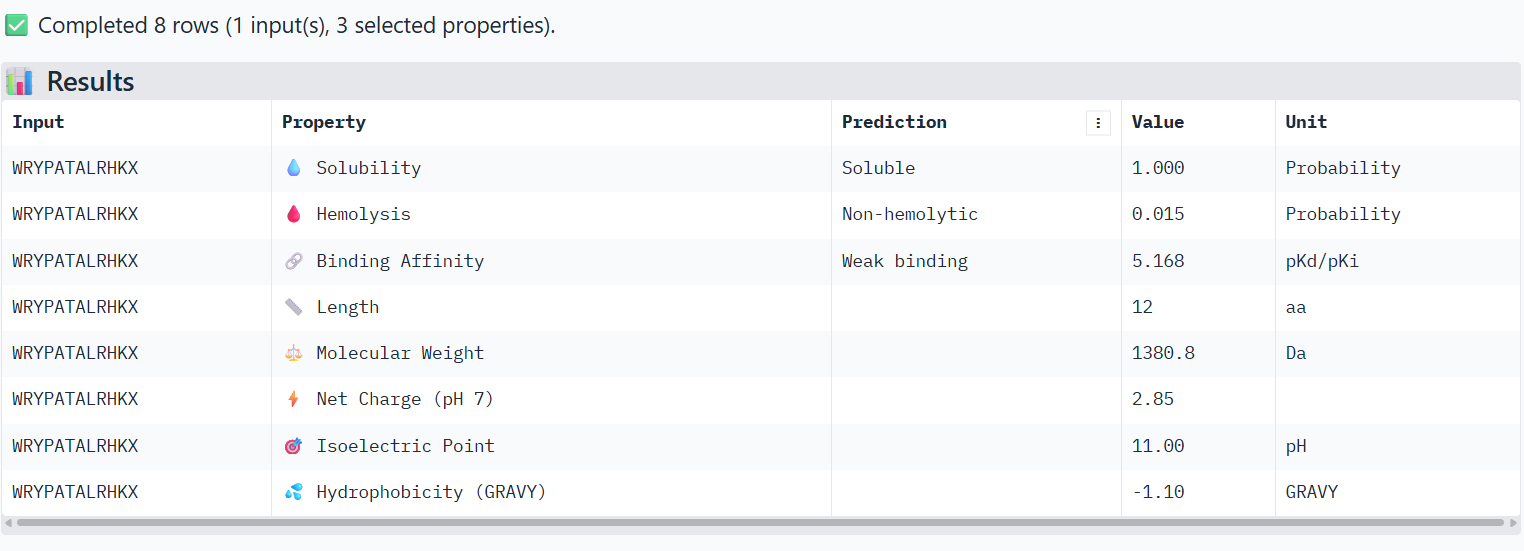
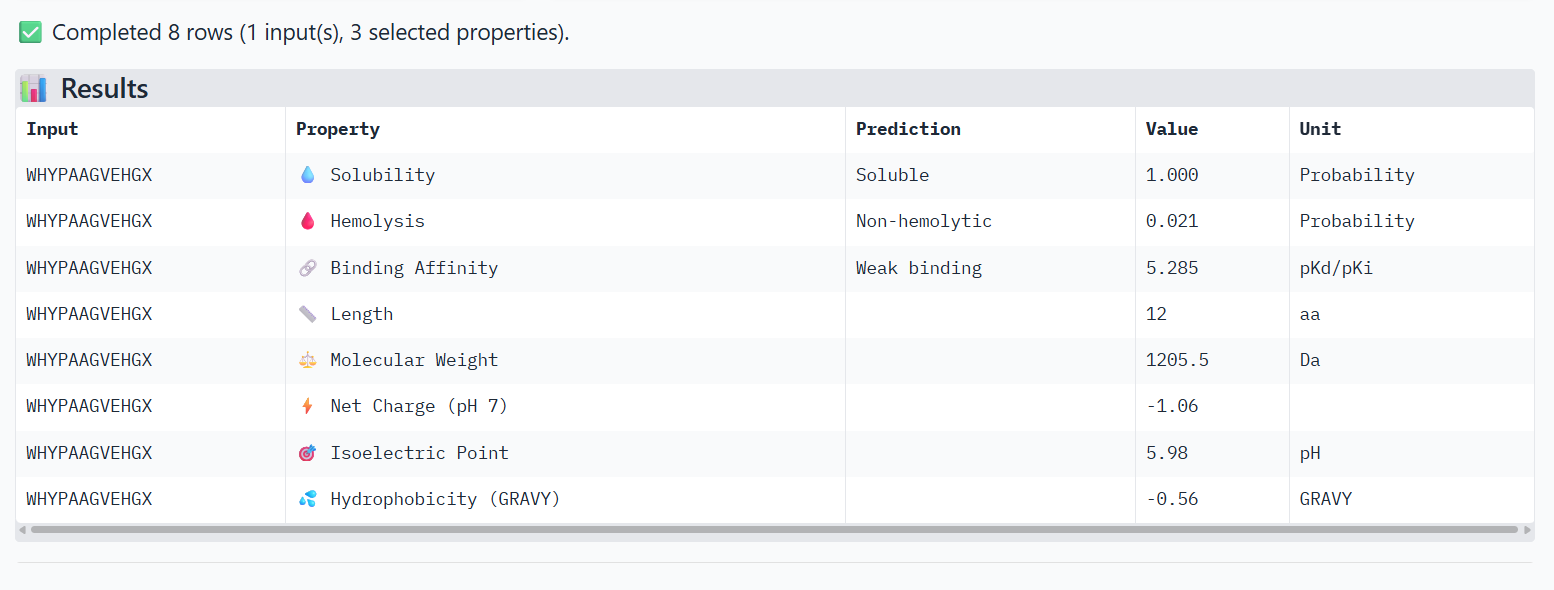
Part 3: Evaluate Properties of Generated Peptides in the PeptiVerse
Structural confidence alone is insufficient for therapeutic development. Using PeptiVerse, let’s evaluate the therapeutic properties of your peptide! For each PepMLM-generated peptide:
Paste the peptide sequence.
Paste the A4V mutant SOD1 sequence in the target field.
Check the boxes
Predicted binding affinity
Solubility
Hemolysis probability
Net charge (pH 7)
Molecular weight
Compare these predictions to what you observed structurally with AlphaFold3. In a short paragraph, describe what you see. Do peptides with higher ipTM also show stronger predicted affinity? Are any strong binders predicted to be hemolytic or poorly soluble? Which peptide best balances predicted binding and therapeutic properties?
Choose one peptide you would advance and justify your decision briefly.
0-WRYGATGVAHKK
1-WRYPATALRHKX
X→ Alanine
2-WHYPAAGVEHGX
X→ Alanine
3-WHYYATGAAHGX
X→ Alanine
4-FLYRWLPSRRGG (known binder)
The PeptiVerse analysis shows that all peptides are predicted to be highly soluble (probability = 1.0) and non-hemolytic, indicating favorable safety and formulation properties for therapeutic development. The predicted binding affinities for all peptides fall within a similar range (pKd/pKi ≈ 5.1-5.7), suggesting relatively weak binding interactions overall. These affinity predictions do not perfectly correlate with the structural confidence observed in AlphaFold3. For example, peptide WRYPATALRHKX (index 1) showed a high structural interface score in AlphaFold (ipTM ≈ 0.87) but has the lowest predicted affinity (5.168) in PeptiVerse. Conversely, the known binder FLYRWLPSRRGG shows the highest predicted affinity (5.968) and also had the highest AlphaFold interface confidence.
The peptides also fall within a similar molecular weight range (~1200-1500 Da) and most carry a moderate positive charge, which may favor protein-protein interactions.
Although several PepMLM-generated peptides show similar therapeutic properties, peptide WHYYATGAAHGX (index 3) provides the best balance between structural and biochemical predictions. It shows a relatively high AlphaFold interface confidence (ipTM ≈ 0.86) together with weaker predicted binding affinity (pKd/pKi ≈ 5.71, but higher than the other ones). In addition, it has favorable therapeutic properties including high solubility, low hemolysis probability, and a smaller molecular weight. Its near-neutral net charge may also reduce nonspecific interactions compared with more positively charged peptides.
Part 4: Generate Optimized Peptides with moPPIt
Now, move from sampling to controlled design. moPPIt uses Multi-Objective Guided Discrete Flow Matching (MOG-DFM) to steer peptide generation toward specific residues and optimize binding and therapeutic properties simultaneously. Unlike PepMLM, which samples plausible binders conditioned on just the target sequence, moPPIt lets you choose where you want to bind and optimize multiple objectives at once.
Open the moPPit Colab linked from the HuggingFace moPPIt model card
Make a copy and switch to a GPU runtime.
In the notebook:
Paste your A4V mutant SOD1 sequence.
Choose specific residue indices on SOD1 that you want your peptide to bind (for example, residues near position 4, the dimer interface, or another surface patch).
Set peptide length to 12 amino acids.
Enable motif and affinity guidance (and solubility/hemolysis guidance if available). Generate peptides.
After generation, briefly describe how these moPPit peptides differ from your PepMLM peptides. How would you evaluate these peptides before advancing them to clinical studies?
The peptides generated with moPPIt differ from the PepMLM peptides because they are not just sampled based on sequence likelihood, but are actively guided toward multiple objectives, including binding affinity, motif constraints, solubility, and hemolysis. As a result, moPPIt peptides (e.g., GHSYFRGCGTYW, YYTMTCYTTIPY) tend to show higher predicted affinity scores (~6-7.3) compared to PepMLM peptides (~5-6), and also include specific sequence features (motifs) that target selected regions of SOD1.
However, this optimization comes with trade-offs. Some moPPIt peptides show high hemolysis probabilities (~0.89-0.97) and only moderate solubility, indicating that improving binding and motif targeting may negatively impact therapeutic safety. In contrast, PepMLM peptides were generally non-hemolytic and highly soluble, but had weaker predicted binding.
Before advancing these peptides to clinical studies, structural validation using AlphaFold or docking should confirm that the peptides bind to the intended region on SOD1. Second, in vitro assays (e.g., binding affinity measurements such as SPR or ITC) should verify the predicted interactions. Third, toxicity and stability assays should be performed to assess hemolysis, aggregation, and degradation. Finally, promising candidates would need to be optimized to balance binding strength with safety and pharmacological properties.
Peptide
Hemolysis
Solubility
Affinity
Motif
GHSYFRGCGTYW
0.95
0.83
7.13
0.64
TDSQMRKFGPFY
0.89
0.66
6.05
0.69
YYTMTCYTTIPY
0.91
0.75
7.28
0.82
SFGKTCVKTEQV
0.98
0.75
6.77
0.90
Week 6 HW: Genetic Circuits Design part I
My Homework
DNA Assembly
Answer these questions about the protocol in this week’s lab:
What are some components in the Phusion High-Fidelity PCR Master Mix and what is their purpose?
Phusion High-Fidelity PCR master mix contains Phusion DNA polymerase, deoxynucleotides and HF reaction buffer with MgCl2. This master mix is used for long or difficult PCR amplifications and applications where high sequence fidelity is critical, such as cloning, mutagenesis, or amplicon sequencing.
2. What are some factors that determine primer annealing temperature during PCR?
It is determined by temperature of melting of the primers which depends mainly on the GC content, length of the primer and sequence composition. Salt concentrations and secondary structures could affect primer annealing temperature as well.
3. There are two methods from this class that create linear fragments of DNA: PCR, and restriction enzyme digests. Compare and contrast these two methods, both in terms of protocol as well as when one may be preferable to use over the other.
When using PCR, primers must be designed to amplify the desired fragment (either the insert or the vector backbone). These primers can also include additional sequences such as overlaps for Gibson Assembly or restriction sites for downstream cloning. A high-fidelity DNA polymerase (e.g., Phusion) is typically used to minimize errors during amplification. PCR is highly flexible because it allows you to amplify any sequence regardless of the presence of restriction sites.
In contrast, restriction enzyme digestion relies on the presence of specific recognition sites in the DNA. The vector and insert must contain compatible restriction sites, and importantly, these sites should not be present within the fragment of interest. If unwanted restriction sites are present, the sequence may need to be modified (e.g., by site-directed mutagenesis or codon optimization). This makes restriction-based cloning more constrained but often more straightforward when suitable sites are available.
After generating linear fragments, the downstream workflow differs slightly between the two methods. For PCR products, it is usually necessary to purify the amplicon and often treat it with enzymes such as DpnI (to remove template DNA) or perform gel extraction to ensure specificity. For restriction digestion, fragments are typically purified after digestion, and if using traditional cloning, may require dephosphorylation of the vector to prevent self-ligation.
The assembly step also differs. PCR products are commonly used in seamless cloning methods such as Gibson Assembly, where overlapping regions allow fragments to anneal and be enzymatically joined. In contrast, restriction-digested fragments are usually ligated using DNA ligase, which joins compatible sticky or blunt ends.
In terms of when to use each method, PCR is preferable when flexibility is needed, such as when introducing mutations, adding overlaps, or working with sequences lacking suitable restriction sites. Restriction digestion is often preferred for routine cloning when appropriate sites are already available, as it can be more straightforward and reliable.
Regarding cost and time, both methods can be comparable depending on reagents, although restriction enzymes are often slightly cheaper. PCR may take longer due to amplification cycles, especially for large fragments, but it provides significantly more versatility.
4. How can you ensure that the DNA sequences that you have digested and PCR-ed will be appropriate for Gibson cloning?
After PCR, digestion and purification, DNA fragments should be analyzed by agarose gel electrophoresis to confirm the correct size of each fragment. DNA concentration can be measured (e.g., by Nanodrop or Qubit) to ensure proper stoichiometry. It is recommended sequencing the fragment before Gibson assembly to ensure that sequence is free of errors.
5. How does the plasmid DNA enter the E. coli cells during transformation?
It is not necessary to purify Gibson assembly reactions because chemical transformation was performed. Chemical competent cells contain salts such as CaCl2 and MgCl2. Positive ions neutralizes negative charges of DNA and phospholipids in the cell membrane allowing to create a channel during heat shock. Heat-shock creates temporary pores allowing plasmid DNA enter the cells during transformation.
6. Describe another assembly method in detail (such as Golden Gate Assembly)
    1. Explain the other method in 5 - 7 sentences plus diagrams (either handmade or online).
    2. Model this assembly method with Benchling or Asimov Kernel!
Golden Gate Assembly is a cloning method that uses Type IIS restriction enzymes, which cut DNA outside of their recognition sites. This allows the creation of custom overhangs that can be designed to guide the ordered assembly of multiple DNA fragments in a single reaction. During the process, DNA fragments and a vector are mixed with a Type IIS enzyme and DNA ligase in a one-pot reaction that cycles between digestion and ligation steps. Because the recognition sites are removed during assembly, the final construct is no longer susceptible to digestion, increasing the efficiency of correct assembly. This method enables seamless cloning without leaving extra sequences (scarless assembly) when designed appropriately. Golden Gate is particularly useful for assembling multiple fragments in a defined order, making it ideal for modular cloning and synthetic biology applications. Overall, it is a fast, efficient, and highly scalable method for constructing complex DNA assemblies.
I used the iGEM RFC1000 Type IIS assembly method, which relies on restriction enzymes such as SapI and BsaI to enable hierarchical DNA assembly. In my design, I focused on creating a Level 0 construct by cloning the CDS (amilCP) into the universal acceptor vector pSB1C00 using SapI. The CDS fragment was designed with SapI recognition sites and appropriate overhangs so that, after digestion, it could be ligated into the vector while removing the RFP cassette. Importantly, the inserted CDS is flanked by BsaI recognition sites and standardized fusion sites, which prepares it for downstream assembly. These fusion sites will generate specific overhangs during BsaI digestion, allowing correct and directional assembly into a Level 1 transcriptional unit.
Week 9 HW: Cell-Free Systems
My Homework
General homework questions
Explain the main advantages of cell-free protein synthesis over traditional in vivo methods, specifically in terms of flexibility and control over experimental variables. Name at least two cases where cell-free expression is more beneficial than cell production.
Cell-free protein synthesis offers significant advantages over in vivo systems due to its flexibility and precise control over experimental conditions. Components can be easily added, removed, or adjusted without affecting cell viability, enabling rapid optimization and high-throughput experimentation. This system allows incorporation of non-natural amino acids to create proteins with novel properties, which is difficult in living cells. It is also ideal for producing toxic proteins that would otherwise harm cells. Additionally, cell-free systems are fast, scalable, reproducible, and suitable for prototyping genetic circuits and biosensors, including portable and freeze-dried applications for field use.
Describe the main components of a cell-free expression system and explain the role of each component.
The following table was made based on the information provided in Cui., et al (2022).
Component Category
Specific Components
Function
Genetic template
DNA or mRNA template
Encodes the protein of interest; provides instructions for transcription/translation.
Transcription machinery
T7 RNA polymerase
Synthesizes mRNA from DNA template.
Translation machinery (core)
Ribosome (70S in bacteria: 30S + 50S)
Catalyzes protein synthesis by translating mRNA into polypeptides.
tRNA system
tRNAs
Deliver amino acids to ribosome according to codons.
Stabilize ribosome and enhance enzymatic activity.
Reducing agent
DTT
Prevents protein oxidation and maintains enzyme activity.
Why is energy provision regeneration critical in cell-free systems? Describe a method you could use to ensure continuous ATP supply in your cell-free experiment.
Energy provision and regeneration are critical in cell-free systems because many biochemical processes, especially protein synthesis, are highly ATP-dependent. ATP is continuously consumed during transcription, translation, and enzymatic reactions. Without regeneration, ATP would be rapidly depleted, leading to early termination of the reaction and low product yield. Additionally, supplying ATP in stoichiometric amounts is impractical due to its high cost, making regeneration systems essential for sustained and scalable cell-free reactions.
In the system described by Yadav et al., (2025) ATP is regenerated from pyruvate through a two-step enzymatic pathway. First, the enzyme pyruvate oxidase (Pox5) converts pyruvate + inorganic phosphate (Pi) + oxygen into acetyl phosphate, a high-energy intermediate. Then, acetate kinase (AckA) transfers the phosphate group from acetyl phosphate to ADP, producing ATP and acetate. This allows ATP to be regenerated in situ during the reaction using pyruvate as the energy source.
An additional enzyme, catalase (KatE), is required because the pyruvate oxidase reaction generates hydrogen peroxide (H₂O₂) as a byproduct. Catalase breaks down H₂O₂ into water and oxygen, preventing damage to proteins and maintaining system activity .
This ATP regeneration system was successfully tested in the PURE cell-free system, where it supported protein synthesis. Importantly, when this pyruvate-based system was combined with the traditional creatine phosphate/creatine kinase system, the highest protein yield was achieved (up to ~230 μg/mL), outperforming either system alone.
Compare prokaryotic versus eukaryotic cell-free expression systems. Choose a protein to produce in each system and explain why.
Prokaryotic and eukaryotic cell-free expression (CFE) systems differ mainly in cost, speed, and protein complexity. Prokaryotic systems (e.g., E. coli) are widely used because they are fast, inexpensive, and produce high protein yields, making them ideal for simple proteins. However, they often lack chaperones and post-translational modification (PTM) machinery, which limits proper folding and functionality of complex eukaryotic proteins. In contrast, eukaryotic systems (e.g. rabbit reticulocyte extracts) are pricier and slower to prepare, but they can correctly express proteins requiring PTMs such as disulfide bond formation, glycosylation, and membrane protein insertion, which are essential for many functional proteins.
For a prokaryotic system, a suitable protein is amilCP, a chromoprotein reporter that is simple, does not require PTMs, and can be easily produced. In contrast, the Buntru et al. (2014) study demonstrates that eukaryotic systems such as cell-free systems from Nicotiana tabacum are ideal for complex proteins such as full-length antibodies, which require correct folding, disulfide bond formation, and assembly of heavy and light chains; their system successfully produced functional antibodies. Another example from the same study is glucose oxidase (GOx), a glycosylated enzyme whose activity depends on proper folding and glycosylation, both achieved in the eukaryotic cell-free system.
How would you design a cell-free experiment to optimize the expression of a membrane protein? Discuss the challenges and how you would address them in your setup.
To optimize the expression of a membrane protein in a cell-free system, I would design the experiment by combining a CFPS (cell-free protein synthesis) system with lipid vesicles (like liposomes).
First, I would set up a basic CFPS reaction with:
DNA encoding the membrane protein
Cell extract, amino acids, energy system
Then, I would add liposomes or microsomes to the reaction so that the membrane protein can insert directly into a lipid bilayer during synthesis. This is important because membrane proteins need a membrane to fold correctly .
Next, I would optimize key conditions, such as:
Temperature and pH
Magnesium and salt concentrations
DNA concentration
Lipid composition of vesicles
The main challenges in expressing membrane proteins in cell-free systems include misfolding, low yield, improper membrane insertion, and lack of post-translational modifications. These problems occur because membrane proteins are hydrophobic and structurally complex, making them unstable in aqueous conditions and difficult to produce efficiently. To address this, lipid vesicles such as liposomes or microsomes are added to provide a membrane-like environment for proper folding and insertion, and reaction conditions (such as temperature, ions, and DNA concentration) are optimized to improve yield (Takeda, et al., 2015; Mayeux, et al., 2021; Kim, et al., 2025). Additionally, chaperones or cofactors can be included to assist folding. Importantly, the choice of system depends on the protein: prokaryotic cell-free systems (e.g., E. coli lysate + liposomes) are suitable for simpler membrane proteins, while eukaryotic systems (with microsomes) are better for complex proteins that require proper folding and post-translational modifications, such as receptors or GPCRs (Takeda, et al., 2015).
Imagine you observe a low yield of your target protein in a cell-free system. Describe three possible reasons for this and suggest a troubleshooting strategy for each.
First, RNase contamination can degrade mRNA and reduce protein production. This often comes from plasmid preparation kits. To fix this, RNase inhibitors should be added to the reaction (e.g., Murine RNase Inhibitor), and clean, nuclease-free reagents should be used .
Second, problems with the template DNA design and contamination can reduce translation efficiency. For example, incorrect regulatory elements, poor ribosome binding sites, or secondary structures at the 5′ end can interfere with translation initiation. To solve this, the DNA sequence should be verified and optimized, for example by modifying the 5′ region to eliminate secondary structures or improving the initiation sequence. Residual amounts of SDS, ethidium bromide and ammonium acetate often found in plasmid preparation and PCR product gel purification can inhibit translation.
Third, non-optimal template DNA concentration can affect yield. Too little DNA produces low mRNA levels, while too much DNA can overwhelm the translation machinery. Depending on the kit used, it is important to check the recommended amount of DNA that should be used.
Homework question from Kate Adamala
Design an example of a useful synthetic minimal cell as follows:
This idea is based on Chen, et al., (2024) & Yang, et al., (2025)
Pick a function and describe it.
a. What would your synthetic cell do? What is the input and what is the output?
Detect plant pathogen-associated signals in vivo and generate a visible signal in plant tissue.
Input: chitooligosaccharides (COs) or lipo-chitooligosaccharides (LCOs) from fungi/bacteria.
Output: production and release of betalain pigment (RUBY system), visible as purple coloration.
The RUBY system consists of three enzymes that synthesize betalain pigment, enabling direct visualization.
b. Could this function be realized by cell-free Tx/Tl alone, without encapsulation?
No. Encapsulation is required to incorporate membrane receptors and maintain compartmentalization for signal detection and controlled output.
c. Could this function be realized by genetically modified natural cell?
Yes, plants can express RUBY reporters. However, synthetic cells provide a non-living, deployable biosensor without genetic modification of the plant.
d. Describe the desired outcome of your synthetic cell operation.
In the presence of pathogen-derived molecules, the synthetic cell produces and releases betalain pigment, generating a visible purple signal in infected plant tissue.
Design all components that would need to be part of your synthetic cell.
a. What would be the membrane made of?
Phospholipids (POPC) + cholesterol.
b. What would you encapsulate inside? Enzymes, small molecules.
Cell-free Tx/Tl system (E. coli-based), RUBY genes (CYP76AD1, DODA, Glu-T), Energy mix (ATP, amino acids), Synthetic signal transduction module. The signal transduction module consists of a membrane-associated sensing system inspired by LysM receptor-like kinases that recognizes chitooligosaccharides (COs) or lipo-chitooligosaccharides (LCOs) outside the synthetic cell. Because full-length LysM receptors are complex eukaryotic transmembrane proteins that are difficult to express and fold correctly in an E. coli-based cell-free system, this design uses a simplified or engineered receptor module compatible with bacterial Tx/Tl. Upon ligand binding, the sensor undergoes a conformational change that activates a synthetic intracellular transcriptional regulator, which in turn induces expression of the RUBY genes. This coupling allows external pathogen-derived signals to be converted into internal gene expression, resulting in production of betalain pigment that can diffuse out of the synthetic cell and generate a visible signal in plant tissue.
c. Which organism your Tx/Tl system will come from? Is bacterial OK, or do you need a mammalian system for some reason? (hint: for example, if you want to use small molecule modulated promotors, like Tet-ON, you need mammalian)
Bacterial (E. coli-based), sufficient for enzyme production.
d. How will your synthetic cell communicate with the environment? (hint: are substrates permeable? or do you need to express the membrane channel?)
Detection occurs through a membrane-associated sensing module inspired by LysM receptors, which bind external COs/LCOs.
The signal is transduced internally via a synthetic transcriptional activator, inducing RUBY expression.
The betalain pigment diffuses or exits through membrane pores (e.g., α-hemolysin) into plant tissue.
Experimental details
a. List all lipids and genes. (bonus: find the specific genes; for example, instead of just saying “small molecule membrane channel” pick the actual gene.)
Lipids: POPC, cholesterol
Genes:
RUBY system: CYP76AD1, DODA, Glu-T
Synthetic sensing module (LysM-inspired)
α-hemolysin (optional pore)
b. How will you measure the function of your system?
Visual detection of purple pigment in plant tissue and quantification using imaging or spectrophotometry.
Homework question from Peter Nguyen
Freeze-dried cell-free systems can be incorporated into all kinds of materials as biological sensors or as inducible enzymes to modify the material itself or the surrounding environment. Choose one application field — Architecture, Textiles/Fashion, or Robotics — and propose an application using cell-free systems that are functionally integrated into the material. Answer each of these key questions for your proposal pitch:
Write a one-sentence summary pitch sentence describing your concept.
This idea is inspired by Rohde, Niehl & Ziebell (2025). I propose a wearable and attachable biosensing system using freeze-dried cell-free reactions to detect plant viruses like Tomato brown rugose fruit virus (ToBRFV) on clothing, tools, and agricultural surfaces through a visible color change.
How will the idea work, in more detail? Write 3-4 sentences or more.
Freeze-dried cell-free biosensors would be integrated into wearable fabrics (gloves, clothes, sleeves) and also into attachable patches or stickers that can be placed on tools (scissors, knives, trays) or greenhouse surfaces. These systems would contain RNA-sensitive modules (e.g., toehold switches or CRISPR-based detection) designed to recognize ToBRFV genomic RNA. When viral particles from contaminated plant sap contact the material and provide moisture, the system activates and produces a visible color signal. This allows real-time detection of contamination across multiple points of contact, helping growers identify and limit virus spread during routine activities.
What societal challenge or market need will this address?
ToBRFV spreads easily through mechanical transmission and can persist on hands, clothing, and tools, making outbreaks difficult to control. Current diagnostics are lab-based and do not monitor contamination during daily operations. This system addresses the need for rapid, on-site contamination detection across the entire workflow, improving hygiene practices, reducing crop losses, and enabling better disease management in greenhouse and field production.
How do you envision addressing the limitation of cell-free reactions (e.g., activation with water, stability, one-time use)?
Activation with water:
Sensors activate upon contact with plant sap, humidity, or by applying a simple spray buffer during inspections.
Stability:
Freeze-dried reactions are stabilized within protective coatings or hydrogels embedded in fabrics or patches.
One-time use:
Use replaceable biosensor patches that can be attached to clothing, tools, or surfaces and discarded after activation.
Versatility across materials:
Design sensors as modular stickers or strips that can be applied to different surfaces, not just textiles.
This approach turns everyday agricultural materials into active biosensing surfaces, enabling continuous monitoring of pathogens spread across the entire production system.
Homework question from Ally Huang
Freeze-dried cell-free reactions have great potential in space, where resources are constrained. As described in my talk, the Genes in Space competition challenges students to consider how biotechnology, including cell-free reactions, can be used to solve biological problems encountered in space. While the competition is limited to only high school students, your assignment will be to develop your own mock Genes in Space proposal to practice thinking about biotech applications in space!
For this particular assignment, your proposal is required to incorporate the BioBits® cell-free protein expression system, but you may also use the other tools in the Genes in Space toolkit (the miniPCR® thermal cycler and the P51 Molecular Fluorescence Viewer). For more inspiration, check out https://www.genesinspace.org/ .
Provide background information that describes the space biology question or challenge you propose to address. Explain why this topic is significant for humanity, relevant for space exploration, and scientifically interesting. (Maximum 100 words)
Space environments expose organisms to microgravity and increased radiation, which can alter microbial survival, gene expression, and evolution. Understanding how extremophiles respond to these conditions is important for astronaut health, planetary protection, and long-term space missions. Microbes that survive harsh Earth environments (e.g., deserts, Antarctic systems) are ideal models to study resilience in space. Cell-free systems provide a safe and low-resource method to analyze genetic responses without maintaining living cultures, making them well-suited for space biology experiments.
Name the molecular or genetic target that you propose to study. Examples of molecular targets include individual genes and proteins, DNA and RNA sequences, or broader -omics approaches. (Maximum 30 words)
Describe how your molecular or genetic target relates to the space biology question or challenge your proposal addresses. (Maximum 100 words)
Stress-response genes are directly involved in microbial survival under radiation and microgravity conditions. By monitoring these genes, we can assess how microbes adapt to space environments. Conserved genes such as 16S rRNA confirm microbial presence, while functional genes provide insight into biological responses to stress. This allows us to understand not only whether microbes survive in space, but how their molecular mechanisms change under these conditions.
Clearly state your hypothesis or research goal and explain the reasoning behind it. (Maximum 150 words)
We hypothesize that microbial DNA exposed to space conditions will show detectable differences in stress-response gene signatures that can be measured using a BioBits® cell-free system. If DNA from microbes exposed to radiation or simulated microgravity is amplified using miniPCR, the cell-free system can detect specific gene targets and produce a measurable fluorescent signal. By comparing samples exposed to space-like conditions with ground controls, we can identify changes in gene abundance or presence related to stress adaptation. The goal is to develop a portable system to monitor microbial responses in space, contributing to understanding microbial survival, evolution, and potential risks during long-duration missions.
Outline your experimental plan - identify the sample(s) you will test in your experiment, including any necessary controls, the type of data or measurements that will be collected, etc. (Maximum 100 words)
DNA samples from microbes exposed to simulated space conditions (radiation or microgravity analogs) and control samples will be tested. Target genes will be amplified using miniPCR. Amplified DNA will be added to BioBits® reactions programmed to detect specific sequences. Fluorescence will be measured using the P51 viewer. Differences in signal between exposed and control samples will indicate changes in stress-response gene detection, allowing assessment of microbial adaptation to space conditions.
References
Buntru, M., Vogel, S., Stoff, K., Spiegel, H., & Schillberg, S. (2015). A versatile coupled cell‐free transcription–translation system based on tobacco by‐2 Cell lysates. Biotechnology and Bioengineering, 112(5), 867–878. https://doi.org/10.1002/bit.25502
Chen, L., Cai, Y., Liu, X., Yao, W., Wu, S., & Hou, W. (2024). The ruby reporter for visual selection in soybean genome editing. aBIOTECH, 5(2), 209–213. https://doi.org/10.1007/s42994-024-00148-6
Cui, Y., Chen, X., Wang, Z., & Lu, Y. (2022). Cell-free pure system: Evolution and achievements. BioDesign Research, 2022, 9847014. https://doi.org/10.34133/2022/9847014
Kim, W., Han, J., Chauhan, S., & Lee, J. W. (2025). Cell-free protein synthesis and vesicle systems for programmable therapeutic manufacturing and delivery. Journal of Biological Engineering, 19(1). https://doi.org/10.1186/s13036-025-00523-x
Mayeux, G., Gayet, L., Liguori, L., Odier, M., Martin, D. K., Cortès, S., Schaack, B., & Lenormand, J.-L. (2021). Cell-free expression of the outer membrane protein oprf of pseudomonas aeruginosa for vaccine purposes. Life Science Alliance, 4(6). https://doi.org/10.26508/lsa.202000958
Rohde, M. J., Niehl, A., & Ziebell, H. (2025). A novel tobrfv cdna full-length infectious clone provides insights on virus-host range and inoculation strategies. Plant Disease, 109(10), 2123–2134. https://doi.org/10.1094/pdis-08-24-1665-re
Takeda, H., Ogasawara, T., Ozawa, T., Muraguchi, A., Jih, P.-J., Morishita, R., Uchigashima, M., Watanabe, M., Fujimoto, T., Iwasaki, T., Endo, Y., & Sawasaki, T. (2015). Production of monoclonal antibodies against GPCR using cell-free synthesized GPCR antigen and biotinylated liposome-based interaction assay. Scientific Reports, 5(1). https://doi.org/10.1038/srep11333
Yadav, S., Perkins, A. J., Liyanagedera, S. B., Bougas, A., & Laohakunakorn, N. (2025). ATP regeneration from pyruvate in the pure system. ACS Synthetic Biology, 14(1), 247–256. https://doi.org/10.1021/acssynbio.4c00697
Yang, X., Tannous, J., Rush, T. A., Del Valle, I., Xiao, S., Maharjan, B., Liu, Y., Weston, D. J., De, K., Tschaplinski, T. J., Lee, J. H., Morgan, M., Jacobson, D., Islam, M. T., Chen, F., Abraham, P. E., Tuskan, G. A., Doktycz, M. J., & Chen, J.-G. (2025). Utilizing plant synthetic biology to accelerate plant-microbe interactions research. BioDesign Research, 7(2), 100007. https://doi.org/10.1016/j.bidere.2025.100007
Week 12 HW: Bioproduction of Beta-Carotene and Lycopene
Bioproduction lab
Post-Lab questions
Which genes when transferred into E. coli will induce the production of lycopene and beta-carotene, respectively?
Three genes are responsible crtE, crtI, and crtB for the activation of the lycopene pathway and four genes (same as lycopene) plus one more gene crtY for the production of beta-caroteno from Erwinia herbicola in E.coli.
Why do the plasmids that are transferred into the E. coli need to contain an antibiotic resistance gene?
The antibiotic resistance gene allows the plasmid to replicate and produce the enzymes in E.coli through multiple cell divisions. Without it, E.coli will not produce the plasmid because it is not necessary for its survival.
What outcomes might we expect to see when we vary the media, presence of fructose, and temperature conditions of the overnight cultures?
Differences in the cell concentration and lycopene and beta carotene.
Generally describe what “OD600” measures and how it can be interpreted in this experiment.
OD600 measurements reflect the proportion of light absorbed by the concentration of cells that the light of 600 nm interacts with.
What are other experimental setups where we may be able to use acetone to separate cellular matter from a compound we intend to measure?
Acetone can be used to extract hydrophobic pigments or small molecules from cells, such as chlorophylls, carotenoids, or other nonpolar metabolites. In this lab, acetone disrupts cellular material and allows the carotenoid pigment to go into solution.
Why might we want to engineer E. coli to produce lycopene and beta-carotene pigments when Erwinia herbicola naturally produces them?
Because E.coli is a well-know characterized microorganism for bioproduction and genetic engineering and also has a faster growth compared to Erwinia herbicola.
You may need the following papers to answer these questions:
Gene expression pattern analysis of a recombinant Escherichia coli strain possessing high growth and lycopene production capability when using fructose as carbon source
Improvement of Biomass Yield and Recombinant Gene Expression in Escherichia coli by Using Fructose as the Primary Carbon Source
Let’s get in touch with our metabolic pathway
What are the enzymes of the carotene pathway?
The key enzymes involved in lycopene/carotene synthesis in E.coli through the MEP pathway are: crtE - Geranylgeranyl pyrophosphate (GGPP) synthase, crtB - Phytoene synthase and crtI - Phytoene desaturase. Other enzymes important in precursor supply include: DXS (1-deoxy-D-xylulose-5-phosphate synthase) and IDI (isopentenyl diphosphate isomerase).
Within this pathway, which is the rate determining step (the step that takes the longest)? Which enzyme is responsible for this step?
The papers suggest that precursor supply into the MEP pathway is one of the major bottlenecks. In particular, the DXS enzyme (1-deoxy-D-xylulose-5-phosphate synthase) is commonly considered a rate-limiting step because it controls carbon flux toward IPP and DMAPP production.
Notes for design of a DNA construct for bioproduction
The first thing to do is to decide what organism you are going to use for this (E. coli or S. cerevisiae) for production. Which would you choose and why (emphases on production differences)?
I would choose Escherichia coli for carotene/lycopene production because it grows rapidly, is easy to genetically engineer, and can achieve very high lycopene yields compared to other organisms. The articles showed that engineered E. coli grown on fructose reached high biomass and lycopene production while reducing acetate accumulation, which improves recombinant expression and overall productivity. In addition, E. coli has well-characterized metabolic pathways and many available molecular tools, making it an efficient platform for industrial bioproduction.
Now choose one of the enzymes and lets outline the parts of the construct for expression
For E. coli lets create a expression vector that works as a plasmid you choose E. coli let’s create a expression vector that works as a plasmids
Now, for making a functional construct there are a variety of biological parts needed for this, like ribosome binding sites, terminators, operators and promoters. The last ones are the most important in terms of enzyme or protein production. Let’s elaborate further on this biopart.
The function of a promoter is to initiate the transcription of the gene of interest. It establishes the rate and amount of transcripts produced in the cell.
What types of promoters do we have?
Constitutive, and inducible (mediated by transcription factors as repressor or activators, temperature and light).
If we wanted to turn off the transcription of a gene in response to a metabolite, what type of promoter would be most useful? What if we wanted this to increase in the presence of the metabolite?
If you wanted to turn OFF transcription in response to a metabolite, the best choice would be a repressible promoter and if we wanted to increase the transcription of a gene you will use an inducible promoter.
Now choose one of the genes of the metabolic pathway previously described (Carotene/lycopene) and choose one enzyme to make an expression construct. What promoter could you use for this? Why did you choose it?
I will use an inducible promoter to produce DXS enzyme that is going to activate according to cell concentration (quorum sensing system).
Origin of replication of plasmid
Also, call it ORI, is the place where DNA replication begins and it is usually a sequence rich of ATs for
What types of origin of replication do we have?
High-copy origins: produce many plasmid copies per cell. Example: pUC (~500-700 copies/cell). Medium-copy origins: around 15-40 copies/cell. Example: pBR322, pET, pGEX. Low-copy origins: around 5-10 copies/cell. Example: pSC101, p15A
(Extra) What are compatibility groups?
Compatibility groups refer to groups of plasmids that cannot stably coexist in the same bacterial cell because they use similar replication machinery. Plasmids with the same ori are usually incompatible and compete with each other, causing instability. Therefore, if two plasmids are used together, they should contain different compatible origins of replication.
Now for the previously chosen promoter and gene what will be the best origin or replication?
A medium- or low-copy-number origin, such as p15A or pSC101. Since DXS is involved in a metabolic pathway, excessive expression from a very high-copy plasmid could create metabolic burden and stress for the cells. A medium/low-copy origin provides more stable growth while still allowing controlled induction of expression through the quorum sensing promoter.
(Mandatory for Global listeners, Optional MIT/Harvard) Elaborate further on other bioparts like RBS, terminators, operators you would use for a correct design and further bioproduction?
SECTION 1: ABSTRACT Aster yellows phytoplasma (AYP) is a phloem-limited bacterial plant pathogen affecting garlic production in Minnesota. Because phytoplasmas are difficult to culture, diagnosis relies mainly on laboratory-based PCR, qPCR, and sequencing, which limits rapid field decision-making for growers. The overall goal of this project is to develop a proof-of-concept, field-deployable CRISPR-Cas12a diagnostic workflow for detecting phytoplasma and AYP in garlic. I hypothesize that combining simplified sample preparation, RPA isothermal amplification, CRISPR-Cas12a detection, and lateral-flow or fluorescence readout can enable faster plant disease detection while maintaining sensitivity comparable to qPCR. The first aim is to design and computationally evaluate RPA primers and Cas12a crRNAs targeting cpn60 and ribosomal protein (RP) sequences generated from phytoplasma-positive garlic samples. The second aim is to validate the CRISPR-Cas12a detection workflow using amplified targets and extracted nucleic acids, including preliminary testing with three literature-derived crRNAs that produced detectable fluorescence signal in phytoplasma-positive targets. The third aim is to translate the assay toward a portable detection platform using multiplex lateral flow and future probe-invasion logic. Methods include multilocus sequence analysis, crRNA design in Google Colab, BLAST/NUPACK screening, RPA, Cas12a reporter assays, LOD estimation, qPCR comparison, and field-compatible sample preparation optimization.
FIELD-DEPLOYABLE CRISPR-CAS12A DETECTION DEVICE FOR ASTER YELLOWS PHYTOPLASMA
SECTION 1: ABSTRACT
Aster yellows phytoplasma (AYP) is a phloem-limited bacterial plant pathogen affecting garlic production in Minnesota. Because phytoplasmas are difficult to culture, diagnosis relies mainly on laboratory-based PCR, qPCR, and sequencing, which limits rapid field decision-making for growers. The overall goal of this project is to develop a proof-of-concept, field-deployable CRISPR-Cas12a diagnostic workflow for detecting phytoplasma and AYP in garlic. I hypothesize that combining simplified sample preparation, RPA isothermal amplification, CRISPR-Cas12a detection, and lateral-flow or fluorescence readout can enable faster plant disease detection while maintaining sensitivity comparable to qPCR. The first aim is to design and computationally evaluate RPA primers and Cas12a crRNAs targeting cpn60 and ribosomal protein (RP) sequences generated from phytoplasma-positive garlic samples. The second aim is to validate the CRISPR-Cas12a detection workflow using amplified targets and extracted nucleic acids, including preliminary testing with three literature-derived crRNAs that produced detectable fluorescence signal in phytoplasma-positive targets. The third aim is to translate the assay toward a portable detection platform using multiplex lateral flow and future probe-invasion logic. Methods include multilocus sequence analysis, crRNA design in Google Colab, BLAST/NUPACK screening, RPA, Cas12a reporter assays, LOD estimation, qPCR comparison, and field-compatible sample preparation optimization.
SECTION 2: PROJECT AIMS
Aim 1: Design CRISPR-Cas12a crRNAs for cpn60 and RP targets to establish a proof-of-concept nucleic-acid detection workflow for phytoplasma-positive plant samples.
Aim 2: Test crRNA and RPA primers, evaluate invasion probes and determine assay specificity (off-targets effects), sensitivity and limit of detection.
Aim 3: Develop a low-cost, field-deployable CRISPR diagnostic for AYP detection.
SECTION 3: BACKGROUND
Background and Literature Context
Phytoplasmas are wall-less, phloem-limited bacterial plant pathogens that cannot be cultured in vitro, making biological characterization and disease management very challenging. They are transmitted primarily by sap-feeding insect vectors such as leafhoppers and psyllids, but they can also spread through vegetative propagation, which is relevant for garlic because cloves are used as planting material (Weintraub, & Beanland, 2006). Early and accurate detection prevents entering infected planting stock to production systems and spreading disease in the field. Current phytoplasma detection relies on nested PCR, qPCR, and sequencing, but these methods require laboratory infrastructure, trained personnel, and may not provide immediate results (Zao et al., 2021). AYP was first detected in garlic in Minnesota in 2012, with outbreaks recorded in 2017 and 2021, and spread to planting material in 2018 and 2022 (Mollov et al., 2014). In 2024, infestations were detected throughout Minnesota. However, there are no precise data on its incidence. AYP is a concern for production, because there are not available effective treatments for this emergent pathogen in Minnesota’s garlic crops, and current diagnostic methods are time-consuming and costly. There is a need to develop biotechnological tools for the detection and management of this plant pathogen.
There are some studies that use the CrisprCas12a system for detection of phytoplasma. Wei, Yang & Shih, (2026) describes a phytoplasma detection protocol using RPA-Cas12a system in which RPA first amplifies phytoplasma DNA and Cas12a/crRNA then recognizes the target and activates collateral cleavage of a reporter for fluorescence or lateral-flow readout. Lagner et al., (2025) develop a CRISPR-Cas12a phytoplasma detection system improving assay sensitivity by testing engineered Cas12a variants and modified reporters. The authors found that LbCas12a-Ultra combined with a 7-nt stem-loop reporter improved sensitivity by approximately 10-fold compared with standard wild-type LbCas12a and linear reporters. They also used multiple conserved 16S rRNA target sites to increase detection coverage across diverse phytoplasma groups. However, the study also recognized some limitations. Without a pre-amplification step, very low-titer phytoplasma samples may be missed increasing the risk of false negatives. Lateral flow (LFA) had an LOD between 10 pM and 100 pM, which is less sensitive than fluorescence-based readouts. The authors highlighted that additional validation with more phytoplasma samples, off-target screening, and further LOD improvement in LFA are needed before translating it to the field (Lagner et al., 2025).
Many CRISPR detection platforms rely on Cas12a trans-cleavage. In trans-cleavage assays, once Cas12a is activated by target recognition, it indiscriminately cleaves single-stranded DNA reporters. This produces strong signal amplification, but it also makes multiplexing difficult because all targets activate the same reporter pool. It can also create specificity problems because trans-cleavage does not always require perfect crRNA-target pairing, especially in PAM-distal regions. Many studies used lab-on-chip and orthogonal Cas for the multiplexing, however these strategies depend on complex chip design and construction and different Cas proteins according to the number of genes detected (Jain et al., 2023; Shen et al., 2023; Ding et al., 2020). The study of Lin et al., (2025) addressed this limitation by developing a Cas12a cis-cleavage-mediated lateral flow assay, called cc-LFA. Instead of relying only on collateral trans-cleavage, this method uses a “double-key” recognition system: first, Cas12a recognizes and cleaves the target DNA; second, the released PAM-distal sticky-end DNA fragment is recognized by a specific invasion probe. This design improves specificity and enables multiplexed detection because different crRNA/invasion-probe pairs can generate different target-specific outputs. The authors demonstrated multiplex detection of respiratory pathogens and HPV subtypes, supporting the idea that probe-invasion logic could be adapted to distinguish phytoplasma strains. However, the authors also reported that cc-LFA still requires further optimization for low-copy samples, especially samples with high Ct values, which is highly relevant for phytoplasma detection because phytoplasmas often occur at low and uneven titers in plant tissues.
Key Technology Limitations Identified
There are several limitations such as
i) sensitivity,

ii) specificity,

iii) multiplexing and

iv) field deployment.
i) Phytoplasmas are often present at low concentration in plant tissue, and their distribution can be uneven because they are phloem-limited. A field assay must have a comparable sensitivity, efficiency and LOD to qPCR (gold standard).
ii) Aster yellows phytoplasma belongs to a genetically diverse group, and closely related phytoplasmas may share conserved regions in 16S rRNA or other molecular markers. A test that only detects “phytoplasma positive” may not be sufficient for epidemiology or management if the goal is to distinguish AYP from other phytoplasma groups such as blueberry-associated phytoplasmas. Trans-cleavage-based Cas12a assays may generate signals even when target pairing is imperfect, which can increase the risk of false positives when closely related sequences are present.
iii) Many CRISPR-Cas12a assays are easy to design for one target, but become difficult when multiple targets such as phytoplasma strains and internal controls must be detected in the same reaction. This diagnostic tool should ideally include at least three layers of information: a plant/sample quality control, a universal phytoplasma target, and a specific AYP target using probe-invasion.
iv) A field-detection system should minimize sample processing, reduce contamination risk, integrate amplification and detection, and provide simple interpretation for growers. Current methods may require DNA extraction, pipetting, incubation, fluorescence readers, or interpretation of faint lateral-flow bands. This creates a gap between laboratory validation and real-world use by growers, extension specialists, or field researchers.
Novelty and Innovation of This Project
The final output of the project is to develop a CRISPR-Cas12a field-detection device with a sensitivity and LOD similar to qPCR, which can be used easily by the growers and able to detect phytoplasma and AYP from simple sample preparation. This field-detection device combines three steps simple sample preparation, isothermal amplification with RPA to increase sensitivity and Cas12a detection with probe-invasion logic for higher specificity and multiplexed output.
A major innovative direction is the use of double-key recognition for plant pathogen diagnostics. A standard Cas12a trans-cleavage assay asks only one main question: “Did Cas12a become activated?” In contrast, the proposed probe-invasion strategy asks two questions: “Did Cas12a recognize and cleave the correct target?” and “Does the released DNA fragment match the correct invasion probe?” This additional recognition step could reduce false positives from closely related phytoplasmas and increase specificity. LFA assay will be improved by adding a line for plant endogenous control which is an internal extraction/amplification control line that can identify inhibited samples from negative results.
Figure 1. Multiplex lateral flow assay for simultaneous detection of phytoplasma, AYP, an assay control line, and an endogenous plant internal extraction/amplification control. The endogenous control helps identify inhibited or low-quality samples, reducing false-negative interpretation.
Figure 2. The strip includes four lines: plant internal control, general phytoplasma, AYP-specific, and assay control. An AYP-positive sample shows all four lines; a phytoplasma-negative sample shows only the plant internal control and assay control; and a non-AYP phytoplasma sample shows the general phytoplasma line without the AYP-specific line. If the assay control line is missing, the test is invalid and should be repeated.
Why This Project Matters and Potential Impact
Aster yellows phytoplasma is an important agricultural pathogen because it can affect a wide range of hosts and can be difficult to manage once established in a field. In garlic, the problem is especially important because infected bulbils may be asymptomatic or show unclear symptoms, yet still contribute to disease spread through planting material. A field-deployable diagnostic tool could help growers, researchers, and extension programs make faster decisions about seed garlic quality, disease monitoring, and vector-associated risk.
This project matters because current phytoplasma diagnostics are often centralized in laboratories, which can delay management decisions. A rapid field test could allow earlier detection of infected plants or planting stock before the disease spreads further. The ability to distinguish general phytoplasma infection from AYP-specific infection would also improve epidemiological studies by helping researchers understand which phytoplasma groups are present in garlic production systems. If successful, the platform could be adapted to other crops and other phloem-limited pathogens, like some plant viruses creating a broader diagnostic framework for plant disease surveillance.
The project also has potential scientific impact because it connects plant pathology, CRISPR diagnostics, synthetic biology, and AI-assisted interpretation. Most current plant disease tests provide a simple positive/negative result. In contrast, this project aims to move toward a more informative diagnostic device that can classify pathogen identity, reduce ambiguous visual interpretation, and eventually connect results with a mobile app for data recording and disease mapping. This could shift phytoplasma detection from a purely laboratory-based process to a decentralized, data-connected surveillance system.
Ethical Implications
This project involves ethical considerations related to accuracy, responsible deployment, and agricultural decision-making. A false negative could lead a grower to plant infected garlic seed or fail to remove infected plants, allowing disease spread. A false positive could cause unnecessary economic loss if healthy planting material is discarded or if a farm is incorrectly associated with disease. Therefore, the ethical principles of non-maleficence and responsibility are central to this project: the technology should not harm growers through inaccurate results, overconfident interpretation, or premature deployment before validation.
Another ethical issue is justice. Field-deployable diagnostics should benefit small and medium growers, not only large operations with access to advanced laboratory testing. If the device is developed successfully, it should be affordable, easy to use, and accompanied by clear instructions so that non-specialists can interpret results appropriately. The project should also avoid overclaiming what the device can do. For example, an early prototype may be useful for research screening, but not yet validated for regulatory or commercial certification decisions.
To ensure ethical development, this project should include strong validation against qPCR, sequencing, and known positive and negative controls. The assay should be tested with multiple garlic tissues, different phytoplasma titers, healthy plant controls, non-target phytoplasmas, and plant-associated microbes to evaluate sensitivity and specificity. The mobile-app output should clearly report uncertainty, such as “positive,” “negative,” or “inconclusive,” rather than forcing a binary result when the signal is weak. In addition, any field deployment should include training, data privacy considerations, and recommendations that diagnostic results be confirmed by laboratory methods before major management or economic decisions are made.
Summary Gap Addressed by This Project
The current gap is that phytoplasma diagnostics need a system that is sensitive enough for low-titer plant samples, specific enough to distinguish closely related phytoplasmas, multiplexed enough to provide more than one diagnostic answer, and simple enough for field deployment. Existing RPA-Cas12a and LFA assays provide a strong foundation, but they still face limitations in sample preparation, false negative, visual interpretation, and multiplexed specificity. This project addresses that gap by proposing a next-generation field-deployable platform that integrates AIOD-style CRISPR-Cas12a detection in a simple sample preparation for reducing false negatives, engineered reporters, probe-invasion specificity, and future microfluidic/app-based readout for Aster yellows phytoplasma detection in garlic.
SECTION 4: EXPERIMENTAL DESIGN, TECHNIQUES, TOOLS, AND TECHNOLOGY
Experimental design overview
This final project is a continuation of my ongoing research on Aster yellows phytoplasma (AYP) in cultivated garlic in Minnesota. The broader research project focuses on understanding the genetic diversity, detection, epidemiology, and persistence of AYP in garlic. The HTGAA component extends this work toward the design and proof-of-concept validation of a field-deployable CRISPR-Cas12a diagnostic device for AYP detection. This device is envisioned as a portable system that combines simple sample preparation, isothermal DNA amplification using RPA, CRISPR-Cas12a detection, and lateral-flow or fluorescence-based readout.
The current AYP project is generating the genetic information needed to design the diagnostic assay. Specifically, multilocus sequence analysis using markers such as 16S rRNA, cpn60, and ribosomal protein (RP) genes will identify conserved and variable regions across AYP strains from garlic. In parallel, phytoplasma enrichment and whole-genome sequencing will provide additional genomic information to improve target selection. This is important because phytoplasmas are difficult to sequence directly from infected plant material due to their low abundance, dependence on the host plant matrix, and the overwhelming amount of host DNA in infected samples.
The DNA design component of this project will include the design of RPA primers, Cas12a crRNAs, fluorescent reporters, and probe-invasion oligonucleotides. These designed DNA/RNA components will be used to detect AYP specifically, distinguish AYP from other phytoplasma groups when possible, and reduce false-positive or false-negative results. This approach builds on recent CRISPR-Cas12a diagnostic systems for phytoplasma detection and on newer Cas12a cis-cleavage/probe-invasion strategies for multiplexed and highly specific nucleic acid detection (Wei et al., 2026; Lagner et al., 2025; Lin et al., 2025). Previous CRISPR-Cas12a phytoplasma work showed that LbCas12a-Ultra, stem-loop reporter design, and multiplexed target sites can improve detection, but the lateral-flow format still had a higher LOD than fluorescence-based detection, with reported LFA detection between approximately 10 pM and 100 pM target DNA (Lagner et al., 2025). The proposed project aims to improve this limitation by integrating RPA amplification, internal controls, and a double-recognition probe-invasion strategy.
Hypothesis
I hypothesize that a field-deployable AYP detection system can be made more sensitive and specific by combining:
RPA amplification of conserved AYP genomic regions,
CRISPR-Cas12a target recognition,
engineered reporter/probe design, and
probe-invasion-based confirmation of Cas12a cis-cleavage products.
This system should reduce false negatives by including an internal plant control and reduce false positives by requiring two recognition steps: Cas12a/crRNA recognition of the target sequence and invasion-probe recognition of the released PAM-distal DNA fragment.
Detailed Experimental Plan and Timeline
1. Compile and curate AYP sequence data from the ongoing garlic project
Timeline: 4 months
The first step will be to organize the sequence information already generated from the AYP garlic project. This will include 16S rRNA, cpn60, and ribosomal protein sequences obtained from positive garlic samples. Also, whole genome sequencing of around ten positive samples allow to characterize the phytoplasma strains and to design crRNAs more specific to AYP detection. Additional reference sequences from GenBank will be included to represent AYP subgroups, closely related phytoplasmas, blueberry stunt phytoplasma, and other relevant phytoplasma groups. This sequence dataset will serve as the foundation for diagnostic target selection.
Tools and techniques: GenBank, BLASTn, Geneious prime, MAFFT, MEGA, iPhyClassifier, cpnClassiPhyR, and multilocus sequence analysis.
Expected result: A curated sequence alignment showing conserved AYP regions suitable for broad detection and variable regions suitable for subgroup or strain-level discrimination.
3. Identify candidate genomic regions for CRISPR-Cas12a and RPA assay design
Timeline: Month five
Candidate diagnostic regions will be selected based on three criteria: conservation among garlic-associated AYP sequences, divergence from non-target phytoplasmas, and compatibility with RPA and Cas12a recognition. The goal is to identify at least two types of targets: one broad phytoplasma target and one AYP-specific target. A third optional target may be designed for a related phytoplasma group, such as blueberry stunt phytoplasma, to test whether the platform can discriminate among phytoplasma groups.
Tools and techniques: Multiple sequence alignment, BLAST specificity screening, PAM identification for Cas12a, and in silico off-target analysis.
Expected result: A short list of candidate target regions that can support RPA primer design and Cas12a crRNA design.
Design CRISPR-Cas12a crRNAs using a custom bioinformatic pipeline
I developed with help to ChatGPT a Google Colab pipeline to scan the curated cpn60 and RP sequences for Cas12a PAM sites, including TTTA, TTTC, and TTTG, on both forward and reverse strands. The pipeline extracts the downstream spacer sequence, scores candidate crRNAs based on conservation in target sequences, mismatch patterns in non-target sequences, GC content, and position in the amplicon. This computational design is the main DNA/RNA design component of my project.
Screen candidate crRNAs for specificity
The top crRNA candidates will be checked by BLAST against NCBI databases and against garlic-related sequences to identify possible off-target matches. Candidates that match garlic or non-target phytoplasmas too strongly will be deprioritized. Based on my preliminary results, some cpn60 and RP crRNAs appear conserved across multiple phytoplasmas rather than AYP-specific, so these may be useful for general phytoplasma detection, while future whole-genome sequencing data will be needed to design more AYP-specific crRNAs.
Evaluate crRNA secondary structure using NUPACK
The top crRNA spacers will be evaluated for predicted secondary structure. Strong hairpins or structures that interfere with crRNA-target binding will be avoided. The expected result is to prioritize crRNAs that are both computationally specific and structurally accessible.
5. Design RPA primers for isothermal amplification
Timeline: month six
RPA primers will be designed to amplify short diagnostic fragments containing the selected Cas12a target sites. Because RPA works under isothermal conditions and is compatible with portable detection, it is appropriate for a field-deployable device. Several primer pairs will be designed for each target region, and each primer set will be screened in silico for specificity, primer-dimer formation, secondary structure, and compatibility with the downstream Cas12a assay.
DNA design component: RPA forward and reverse primers.
Tools and techniques: Primer3, NCBI Primer-BLAST, IDT OligoAnalyzer, Multiple Primer Analyzer, and sequence alignment.
Expected result: At least 2–3 candidate RPA primer sets for each diagnostic target.
6. Validate CRISPR-Cas12a detection system using amplified targets
Timeline: month six
Each amplicon (generated by PCR) will be tested with the designed Cas12a/crRNA combinations. Fluorescence detection will be used first because it allows quantitative measurement of signal intensity over time. The best crRNA will be selected based on high signal with the AYP target, low background in negative controls, and minimal cross-reactivity with non-target phytoplasmas.
Tools and techniques: Cas12a reaction, crRNA screening, fluorescence plate reader, endpoint fluorescence measurement, and signal-to-noise analysis.
Expected result: At least one crRNA should generate a strong Cas12a signal for AYP-positive samples with low background in negative controls.
7. Validate CRISPR-Cas12a detection system using extracted nucleic acids
Timeline: month six
After validating the CRISPR-Cas12a system with amplified targets, the assay will be tested using total nucleic acids extracted directly from plant samples. This step is important because field samples contain plant DNA, possible PCR/RPA inhibitors, and variable phytoplasma concentrations. DNA extracted from phytoplasma-positive garlic samples, healthy garlic controls, and non-target plant/pathogen samples will be used as input for the RPA-Cas12a workflow. This validation will determine whether the assay can detect phytoplasma targets in a realistic sample matrix, not only in purified amplicons.
Tools and techniques: Total DNA extraction from garlic tissue, phytoplasma-positive garlic DNA, healthy garlic DNA, non-target plant DNA, RPA amplification from extracted nucleic acids, Cas12a/crRNA detection, fluorescent ssDNA reporter, fluorescence plate reader, endpoint fluorescence analysis, signal-to-noise analysis, inhibition assessment.
Expected result: Phytoplasma-positive extracted DNA samples should produce a detectable CRISPR-Cas12a signal after RPA amplification, while healthy garlic
DNA and no-template controls should remain close to background. Some samples with low phytoplasma titer or high inhibitor content may produce weak or delayed signal, which will help define the practical performance of the assay in real plant matrices.
8. Validate RPA amplification using phytoplasma-positive and negative samples
Timeline: month seven
The selected RPA primers will be tested using DNA from phytoplasma-positive garlic samples and healthy garlic controls. The first validation will confirm whether the designed primers can amplify the expected target region. Amplicons will be checked by gel electrophoresis, and selected products may be sequenced to confirm target identity.
Tools and techniques: RPA amplification, total DNA from garlic samples, positive AYP/phytoplasma DNA, healthy garlic DNA, no-template control, gel electrophoresis, DNA purification, Sanger sequencing or plasmid sequencing if needed.
Expected result: Successful amplification of the expected cpn60, RP target or other region in phytoplasma-positive samples, with no amplification or minimal nonspecific amplification in healthy garlic and no-template controls.
9. Optimize simplified sample preparation for field deployment
Timeline: month seven and eight
After validating the CRISPR-Cas12a system with extracted nucleic acids, I will optimize a simplified sample preparation method that does not require a conventional DNA extraction workflow. This step is essential because growers would not be able to perform column-based or CTAB-based nucleic acid extraction in the field. Instead, the goal is to develop a rapid sample preparation method that releases phytoplasma DNA from garlic tissue while minimizing inhibitors that could affect RPA amplification and Cas12a detection.
Different garlic tissues, such as leaves, cloves, basal plate, and roots, will be tested because phytoplasma distribution may vary across the plant. Simple preparation conditions may include crude tissue maceration, dilution, heat treatment, short incubation in extraction buffer, filtration, or direct use of clarified plant sap. These crude-prep inputs will then be tested in the RPA-Cas12a workflow and compared with purified DNA from the same samples.
Tools and techniques: Simple plant tissue maceration, crude sap preparation, rapid lysis buffer testing, heat-assisted sample preparation, dilution series to reduce inhibitors, filtration or clarification, RPA-Cas12a detection, fluorescence plate reader, lateral flow compatibility testing, qPCR comparison using purified DNA as reference.
Expected result: A simplified sample preparation method should allow detection of phytoplasma-positive garlic samples without full nucleic acid extraction. The expected signal may be lower than with purified DNA, but the optimized method should still produce a clear positive signal above background. The best preparation method will be selected based on signal intensity, reproducibility, speed, ease of use, and compatibility with field conditions.
10. Determine analytical sensitivity and limit of detection
Timeline: month nine
The limit of detection will be evaluated using serial dilutions of target DNA, purified amplicons, plasmid standards, or positive sample DNA. The goal is to identify the lowest target concentration that can be consistently detected by the RPA-Cas12a workflow. Fluorescence signal will be measured over time and compared with negative controls to define a positivity threshold.
Tools and techniques: Serial dilution, purified target amplicon or plasmid standard, RPA-Cas12a detection, fluorescence kinetics, endpoint RFU analysis, limit-of-detection estimation, positive/negative threshold calculation.
Expected result: A preliminary LOD value for the proof-of-concept assay. The expected result is that higher target concentrations will produce faster and stronger fluorescence signals, while low concentrations near the LOD will show delayed or weaker signal.
11. Compare CRISPR-Cas12a detection with qPCR
Timeline: month ten
The CRISPR-Cas12a assay will be compared with the current qPCR detection method used for phytoplasma detection. The same DNA samples will be tested by qPCR and by RPA-Cas12a to evaluate agreement between methods. This comparison will help determine whether the CRISPR assay can detect samples with high, medium, and low phytoplasma titers.
Tools and techniques: qPCR, CRISPR-Cas12a fluorescence assay, Cq-value comparison, positive/negative agreement analysis, sensitivity and specificity estimation, signal-to-noise comparison.
Expected result: Samples with strong qPCR amplification are expected to produce strong CRISPR-Cas12a signal. Samples with high Cq values or low phytoplasma concentration may show weaker or inconsistent CRISPR signal, helping define the practical sensitivity of the assay.
12. Test the assay across different garlic sample matrices
Timeline: month eleven
The assay will be tested using DNA extracted from different garlic tissues, such as leaves, cloves, basal plate, roots, and bulbils. This is important because phytoplasmas are phloem-limited and may be unevenly distributed in plant tissues. Testing different matrices will help identify which tissue type gives the most reliable detection signal.
Tools and techniques: Garlic tissue sampling, total DNA extraction, RPA amplification, CRISPR-Cas12a detection, qPCR comparison, tissue-specific detection analysis.
Expected result: Some tissues are expected to produce stronger and more consistent detection than others. The result will help define the best sample type for future field detection.
13. Design invasion probes after validating RPA primers and crRNAs
Timeline: month 12 and 13
Invasion probes will be designed only after the best RPA amplicon and crRNA combination has been selected. This is because the invasion probe depends on the Cas12a cis-cleavage product generated from a specific target. According to the probe-invasion strategy, Cas12a first cuts the target DNA and releases a PAM-distal fragment with a short sticky-end region. The invasion probe then binds to this exposed sticky end, creating a second specificity checkpoint.
Tools and techniques: Cas12a cis-cleavage site analysis, PAM-distal fragment prediction, invasion probe design, probe hybridization design, sequence complementarity analysis, NUPACK or similar structure prediction, literature-guided design from the cc-LFA paper.
Expected result: A candidate invasion probe that specifically recognizes the Cas12a-generated cleavage product. This should improve specificity because the assay would require both crRNA recognition and invasion probe binding.
14. Translate fluorescence detection into a lateral flow assay concept
Timeline: month 14
After fluorescence-based detection is validated, the assay will be adapted conceptually to a lateral flow assay format. The proposed LFA will include an assay control line, a plant internal control line, a general phytoplasma line, and an AYP-enriched or AYP-specific line. This format will help distinguish valid negatives, phytoplasma positives, AYP-like positives, and invalid tests.
Tools and techniques: Lateral flow assay design, labeled reporter probes, biotin/FAM or other tag-based detection, multiplex strip design, plant internal control design, assay control design, visual readout interpretation.
Expected result: A conceptual LFA design capable of reducing false negatives and improving interpretation. A valid negative result should show the plant internal control and assay control lines. A broad phytoplasma-positive sample should show the general phytoplasma line, and an AYP-positive sample should show both the phytoplasma and AYP-specific lines.
15. Use liquid handling automation to optimize assay conditions
Timeline: Throughout experimental optimization
A liquid handling robot can be used to automate the preparation of multiple RPA and CRISPR-Cas12a reaction conditions. This will help test different concentrations of Cas12a, crRNA, reporter, RPA input, magnesium concentration, incubation time, and temperature. Automation will reduce pipetting variability and allow more systematic optimization of the assay.
Expected result: More reproducible and quantitative optimization of the CRISPR-Cas12a assay. The robot should help identify conditions that maximize signal in positive samples while minimizing background in negative controls.
16. Final proof-of-concept implementation
Timeline: 1.5 years
The final proof-of-concept workflow will combine sample preparation, RPA amplification, CRISPR-Cas12a detection, and fluorescence or lateral flow readout. The initial version will likely detect broad phytoplasma or AYP-enriched targets using cpn60 and RP. Future whole-genome sequencing data will be used to identify more variable AYP-specific regions and improve diagnostic specificity.
Tools and techniques: Sample preparation, RPA, CRISPR-Cas12a, fluorescence readout, LFA concept, qPCR comparison, DNA design iteration, whole-genome-guided target discovery.
Expected result: A feasible workflow for field-deployable phytoplasma detection in garlic. The expected output is a validated proof-of-concept assay and a clear roadmap for improving specificity using WGS-derived crRNAs.
I will use cell-free reactions as the core detection system for my final project. In this project, the reaction is cell-free because it does not require living cells; instead, purified or pre-assembled components such as RPA reagents, Cas12a, crRNA, target DNA, and reporter probes are combined in vitro. The crRNA will guide Cas12a to the phytoplasma target sequence, and if the target is present, Cas12a will become activated and cleave the reporter to generate a fluorescence or lateral flow signal. This approach is useful for a field-deployable diagnostic because the reaction can potentially be simplified, miniaturized, and eventually freeze-dried for portable testing.
I will also use a liquid handling robot to help automate and optimize the CRISPR-Cas12a assay. The robot can prepare multiple reaction conditions in parallel, including different Cas12a concentrations, crRNA concentrations, reporter concentrations, RPA input volumes, incubation times, and controls. This will reduce pipetting variability and make it easier to compare conditions quantitatively. Using automation will help identify the reaction setup that gives the highest signal in phytoplasma-positive samples and the lowest background in negative controls.
SECTION 5: Results & Quantitative Expectations
1. What aspect of your final project did you choose to validate? (min. 2 sentences)
To validate a key aspect of my final project, I developed and tested a proof-of-concept fluorescence-based CRISPR-Cas12a detection assay for Aster yellows phytoplasma (AYP) using published phytoplasma 16S rRNA crRNAs. The validation focused on determining whether the Cas12a system could successfully recognize phytoplasma DNA targets and generate measurable fluorescence signals across a dilution series of amplified target DNA.
Multiple optimization plates were performed to evaluate assay performance, including comparison of different crRNAs (Cas site 1, Cas site 3, and Cas site 9), fluorescence gain settings, dilution ranges, and assay reproducibility. These experiments allowed preliminary determination of assay sensitivity, dynamic range, and analytical limit of detection (LOD).
Also, I validated the DNA design component of my final project. Specifically, I designed preliminary CRISPR-Cas12a crRNA candidates targeting the cpn60 and ribosomal protein (RP) molecular markers from phytoplasma-positive garlic samples and reference phytoplasma sequences. I chose to validate this aim computationally because crRNA design is a critical first step before experimental CRISPR-Cas12a testing. The goal was to determine whether cpn60 and RP contain suitable Cas12a target sites that could be used for a proof-of-concept phytoplasma detection assay.
2. Write down a detailed protocol of how you validated this aspect of your final project. (Numbered list or paragraph is fine)
Validation of Crisprcas12 system using crRNAs from literature
A 1.2 kb PCR product amplified from an AYP-positive garlic sample was used as the target DNA.
The amplicon concentration was estimated using Nanodrop and gel visualization.
Serial dilution series were prepared using nuclease-free water.
CRISPR-Cas12a reactions were assembled using IDT Alt-R LbCas12a Ultra, crRNA, fluorescence reporter, reaction buffer, and target DNA.
Three phytoplasma crRNAs were tested: Cas site 1, Cas site 3, and Cas site 9.
Negative controls included NTC (no target DNA), No-crRNA controls, and No-Cas controls.
Each reaction was prepared in a final volume of 50 µL containing 45 µL master mix and 5 µL target DNA.
Reactions were loaded into black Greiner 96-well half-area plates and sealed.
Plates were pre-heated at 37°C before kinetic fluorescence reading.
Fluorescence measurements were performed in a BioTek Synergy H1 plate reader using Ex/Em 485/528 nm with top optics.
Kinetic fluorescence was monitored every 2 minutes for 2 hours.
Plate 1 and Plate 2 initially used automatic gain settings, Plate 3 used fixed gain 35, and Plate 4 used fixed gain 90.
Data were normalized as ΔRFU = RFU(t) - RFU(0).
Mean ΔRFU values and standard deviations were calculated for each concentration and condition.
The preliminary LOD was estimated using the endpoint threshold formula: mean NTC + 3 * standard deviation of the NTC.
Design of crRNAs for phytoplasma and AYP detection
I curated available cpn60 and RP sequence datasets from my ongoing phytoplasma characterization work in garlic and from selected reference sequences.
These sequences came from phytoplasma-positive garlic samples and reference genomes/sequences relevant to Aster yellows phytoplasma and related phytoplasmas.
I organized the sequences into target and non-target datasets. The target dataset included phytoplasma sequences relevant to the current AYP detection project, while the non-target or priority off-target dataset included phytoplasmas that should not be detected by an AYP-specific assay, such as blueberry/Vaccinium-associated phytoplasmas and other non-AYP phytoplasmas.
I used a custom Google Colab pipeline to clean the FASTA files, remove exact duplicate sequences, and prepare the sequences for crRNA design.
The pipeline scanned both forward and reverse-complement strands for LbCas12a-compatible PAM sequences.
The PAM motifs used were:
TTTA
TTTC
TTTG
These represent real versions of the LbCas12a PAM motif TTTV, where V can be A, C, or G.
After each PAM site, the pipeline extracted candidate spacer sequences of 20–23 nucleotides.
Each candidate crRNA spacer was evaluated for basic design properties, including spacer length, GC content, homopolymer content, and target coverage.
The pipeline exported two types of BLAST-ready sequences:
spacer only
PAM + spacer
The spacer-only BLAST was used to evaluate general sequence similarity.
The PAM + spacer BLAST was used to evaluate more realistic Cas12a off-target risk because Cas12a recognition depends on both the PAM and the spacer sequence.
I performed BLAST screening for candidate crRNAs from both cpn60 and RP.
I first evaluated whether the candidate crRNAs matched multiple phytoplasmas.
I then performed additional BLAST searches excluding phytoplasmas to evaluate whether candidate crRNAs had potential off-target matches outside the phytoplasma group.
I also performed BLAST searches against garlic / Allium sativum-associated sequences to evaluate whether the candidates had similarity to the host plant or garlic-associated organisms.
The preliminary results showed that the pipeline successfully generated candidate crRNAs for both cpn60 and RP.
However, the BLAST results showed that many candidate crRNAs matched multiple phytoplasmas, indicating that these target sites are conserved across phytoplasma taxa.
Additionally, when screening against garlic-associated sequences, the top crRNA candidates also showed partial similarity to garlic or garlic-associated sequences.
Based on these results, I classified the current cpn60 and RP crRNAs as preliminary proof-of-concept candidates, not final AYP-specific crRNAs.
These candidates are still useful for validating the CRISPR-Cas12a detection workflow, but deeper specificity screening and future whole-genome-guided design will be needed to identify more specific AYP targets.
3. What synthetic biology techniques did you utilize in validating this aspect of your final project? You can refer to the list of techniques in question 8. (min. 4 sentences)
This validation incorporated several synthetic biology techniques discussed during HTGAA 2026. DNA design and sequence analysis were used to identify phytoplasma target regions suitable for Cas12a recognition and crRNA design. PCR amplification was used to generate target DNA templates for CRISPR-Cas12a detection and dilution series experiments. Cell-free CRISPR-Cas12a reactions were performed using purified Cas12a enzyme, crRNA, and a fluorescent reporter system. Finally, quantitative fluorescence analysis and computational data analysis were used to evaluate kinetic behavior, dynamic range, and preliminary analytical LOD.
For designing crRNAs, I used sequence-based DNA design to identify candidate nucleic-acid recognition elements for a CRISPR-Cas12a diagnostic assay. The designed biological components include Cas12a crRNA spacer sequences and future RPA primer targets.
Second, I used CRISPR guide RNA design principles, including PAM identification, spacer selection, GC-content evaluation, and off-target screening. This is a synthetic biology design process because the crRNA is a programmable nucleic-acid component that determines the specificity of the diagnostic system.
Third, I used computational screening and design automation through a Google Colab pipeline. The pipeline scans molecular marker sequences, identifies possible Cas12a target sites, ranks candidates, and exports sequences for downstream BLAST and NUPACK analysis.
Fourth, I used a design-build-test-learn framework. In this first design cycle, I designed crRNAs from available cpn60 and RP markers, tested them computationally by BLAST, learned that many target sites are conserved across phytoplasmas or have host-associated similarities, and identified the need to redesign future crRNAs using whole-genome sequencing data.
4. You must present data as part of your final project and include some analysis of that data. The data may be collected experimentally in the lab or generated as simulated data (e.g., using the Asimov Kernel or another simulation method). (min. 2 sentences)
Four optimization plates were performed to evaluate the CRISPR-Cas12a fluorescence assay. Plate 1 demonstrated that the assay chemistry was functional because positive reactions generated increasing fluorescence over time while controls remained close to baseline. Cas site 1 and Cas site 3 generated stronger fluorescence signals compared with Cas site 9 (Figures 3-6). Plate 2 evaluated a finer dilution range using Cas site 3. Several high-concentration wells produced detector overflow (OVRFLW), indicating that fluorescence exceeded the dynamic range of the plate reader when using automatic gain settings (Figures 7 and 8). Plate 3 tested a fixed gain of 35, but fluorescence signals became weak and difficult to separate from controls. Plate 4 used a fixed gain of 90 and generated the best kinetic separation between positive reactions and controls (Figures 9 and 10)). Strong concentration-dependent fluorescence activation was observed from 30 pM down to approximately 1.875 pM final target concentration in the reaction. Using a conservative threshold rule (mean NTC + 3 SD), the preliminary reliable LOD was estimated at approximately 1.875 pM final target concentration (Figure 11).
Figure 3. Kinetic fluorescence response of Cas site 1 across the corrected final target concentrations during the 120-minute CRISPR-Cas12a assay. The 150 pM and 15 pM conditions generated the strongest fluorescence accumulation over time, indicating efficient Cas12a collateral cleavage activity and robust target detection. In contrast, lower concentrations such as 150 fM and 15 fM remained close to the baseline signal observed for the controls. The NTC, No-Cas control, and No-crRNA control showed minimal fluorescence variation throughout the experiment, supporting the specificity of the assay and demonstrating that fluorescence activation was dependent on both the target DNA and the complete CRISPR-Cas12a reaction components.
Figure 4. Fluorescence kinetics obtained for Cas site 3 during the 2-hour incubation period. Similar to Cas site 1, the intermediate concentrations (150 pM and 15 pM) produced the highest ΔRFU values, demonstrating strong concentration-dependent fluorescence activation. The 1.5 pM concentration generated detectable but lower fluorescence accumulation, whereas femtomolar concentrations remained close to the control baseline. Overall, Cas site 3 showed robust assay performance and reproducible signal separation from the negative controls, supporting its potential utility as a sensitive crRNA target site for phytoplasma detection.
Figure 5. Fluorescence kinetics for Cas site 9. Compared to Cas site 1 and Cas site 3, Cas site 9 produced lower overall fluorescence intensity and slower signal accumulation, suggesting reduced crRNA efficiency or lower target accessibility. Nevertheless, the 150 pM and 15 pM conditions still generated clear fluorescence separation from the controls during the assay. Lower concentrations remained close to baseline fluorescence, indicating reduced sensitivity at the lower detection range. The controls remained relatively stable throughout the experiment, supporting target-dependent fluorescence activation mediated by Cas12a collateral cleavage.
Figure 6. This endpoint analysis summarizes the fluorescence signal measured after 120 minutes of incubation for the three evaluated crRNA target sites. Cas site 1 and Cas site 3 produced the strongest endpoint fluorescence values at intermediate concentrations (150 pM and 15 pM), while Cas site 9 generated lower overall endpoint fluorescence. Interestingly, the highest concentration (1.5 nM) did not produce the strongest fluorescence response, which may suggest partial reaction inhibition, signal saturation effects, or suboptimal enzyme-to-target stoichiometry at high target abundance. The lower concentrations (150 fM and 15 fM) remained near the control baseline, indicating that these concentrations are close to or below the preliminary analytical limit of detection of the assay under these experimental conditions.
Figure 7. Illustrates the early fluorescence kinetics of the CRISPR-Cas12a assay plate 2 during the first A) 10 and B) 20 minutes of the reaction. At 10 minutes, the highest target concentrations (30 pM and 15 pM final concentration) already showed strong fluorescence separation from the controls, indicating rapid Cas12a activation. By 20 minutes, intermediate concentrations such as 7.5 pM and 3.75 pM also became clearly distinguishable from the NTC, No-Cas, and No-crRNA controls. These data demonstrate that the assay is capable of generating detectable signals within a short incubation period for higher phytoplasma target concentrations.
Figure 8. Presents the extended kinetic analysis of plate 2 at 40 minutes and 2 hours. The highest target concentrations produced detector saturation (OVRFLW), indicating that fluorescence exceeded the dynamic range of the plate reader under those conditions. The 7.5 pM and 3.75 pM conditions produced strong fluorescence accumulation over time, while lower concentrations such as 1.88 pM generated slower but still detectable increases in ΔRFU. In contrast, concentrations of 0.94 pM and below remained close to the control baseline, suggesting that these concentrations are near or below the preliminary analytical limit of detection (LOD). The controls remained relatively stable throughout the experiment, demonstrating that fluorescence activation was target-dependent and associated with Cas12a collateral cleavage activity.
Figure 9. Complete kinetic fluorescence profiles obtained for Plate 4 using fixed gain 90. Strong concentration-dependent Cas12a activation was observed for the highest target concentrations (30 pM, 15 pM, 7.5 pM, and 3.75 pM), which generated rapid and continuous increases in ΔRFU over the 2-hour incubation period. Lower concentrations such as 1.875 pM produced slower but still detectable fluorescence accumulation, while concentrations below 0.94 pM remained close to the control baseline. Importantly, the NTC, No-crRNA, and No-Cas controls remained relatively stable throughout the experiment, indicating that fluorescence activation was target-dependent and associated with Cas12a collateral cleavage activity rather than nonspecific background fluorescence.
Figure 10. Low-concentration region of the assay to better visualize the preliminary analytical limit of detection (LOD) of the plate 4. The 1.875 pM condition consistently crossed the endpoint threshold (61.3 ΔRFU), indicating reliable target detection under these assay conditions. In contrast, the 0.94 pM condition produced weaker and more variable fluorescence accumulation that remained near the threshold boundary, suggesting borderline detection. Concentrations of 0.47 pM and 0.23 pM largely overlapped with the controls and did not show reproducible signal separation. The NTC, No-crRNA, and No-Cas controls remained close to baseline throughout the experiment, supporting the specificity of the fluorescence activation observed at higher target concentrations
Figure 11. Endpoint sensitivity analysis measured after 120 minutes of incubation of the plate 4. A strong inverse relationship between target dilution and endpoint ΔRFU was observed, demonstrating the quantitative behavior of the CRISPR-Cas12a assay across the tested concentration range. The dotted horizontal line represents the preliminary detection threshold calculated as the mean NTC signal plus three standard deviations (NTC + 3 SD = 61.3 ΔRFU). Based on this criteria, 1.875 pM was identified as the preliminary reliable analytical limit of detection because it consistently produced endpoint fluorescence above the threshold. Lower concentrations (0.94 pM and below) generated signals near or below the detection threshold, indicating reduced assay reliability at these concentrations.
Table 1. Summary statistics of plate 4
Gain 90 produced strong kinetic separation without the very low signal observed at gain 35.
The assay shows robust detection down to 1.875 pM final target concentration using the conservative 5/5 replicate threshold rule.
The 0.94 pM final concentration is borderline and should be repeated with more replicates or additional intermediate concentrations before calling it positive.
For a formal analytical LOD, repeat the low range around 3.75, 1.875, 0.94, and 0.47 pM with at least 8 to 20 replicates and calculate the concentration detected in ≥95% of replicates.
Graphs were generated with ChatGPT and Excel using real data.
The computational pipeline successfully generated preliminary CRISPR-Cas12a crRNA candidates for both cpn60 and RP targets. These candidates were exported as spacer-only and PAM+spacer sequences for BLAST-based specificity screening.
The main result was that candidate crRNAs from both cpn60 and RP matched multiple phytoplasmas. This suggests that the available cpn60 and RP regions contain short Cas12a target sites that are conserved across phytoplasma taxa. Therefore, these markers may be more appropriate for broad phytoplasma detection or AYP-enriched proof-of-concept detection, rather than strict AYP-specific diagnosis.
A second important result was that the top candidate crRNAs also showed partial BLAST hits to garlic-associated sequences when the search was limited to Allium sativum. This does not automatically mean that Cas12a would be activated by garlic DNA, because Cas12a requires proper PAM context and sufficient spacer complementarity. However, it is an important design warning because a diagnostic assay for garlic should avoid crRNAs with host-associated similarity whenever possible.
Table 2. Summary of preliminary crRNA design results for cpn60 and RP markers.
Marker
Pipeline result
BLAST specificity result
Current interpretation
Next step
cpn60
Candidate crRNAs were generated successfully.
Matches multiple phytoplasmas.
Useful as a broad phytoplasma proof-of-concept marker.
Deprioritize for AYP-specific detection.
RP
Candidate crRNAs were generated successfully.
Also matches multiple phytoplasmas in current candidates.
Potentially useful as an AYP-enriched/discriminatory marker, but not final.
Continue screening and compare with WGS targets.
At this stage, the most important result is not that I found a final AYP-specific crRNA, but that I validated the crRNA design workflow and identified a key biological limitation: cpn60 and RP contain conserved short Cas12a target sites that may not be sufficient for strict AYP specificity.
5. Did you encounter any unexpected challenge(s) when performing your validation? If so, describe the challenge(s) and strategies to overcome it. If not, discuss potential problems, difficulties, limitations, and/or alternative strategies to overcome challenges in your final project. (min. 4 sentences).
One major issue was fluorescence detector overflow caused by automatic gain settings in the plate reader. In Plate 2, some high-concentration wells saturated the detector and produced OVRFLW values that could not be used for quantitative analysis. To overcome this problem, subsequent experiments used fixed gain values to improve comparability between experiments. Another challenge was balancing assay sensitivity and background noise. Plate 3 used fixed gain 35, but the fluorescence signals were weak and difficult to separate from controls. Increasing the gain to 90 in Plate 4 significantly improved signal separation while still avoiding detector overflow at most concentrations. Additional limitations include fluorescence baseline drift, possible secondary structure effects from the long 1.2 kb amplicon, and limited sample availability for repeated optimization experiments. Future experiments will focus on testing shorter amplicons, engineered reporters, and larger replicate numbers near the LOD range.
One unexpected challenge was that many of the top cpn60 and RP crRNA candidates matched multiple phytoplasmas in BLAST. This means that the short Cas12a target regions within these molecular markers are more conserved than expected. As a result, these markers may not be ideal for designing a strictly AYP-specific assay.
A second challenge was that some candidates also showed partial similarity to garlic-associated sequences. This is important because the final diagnostic test will be used with garlic tissue, so crRNAs must be screened not only against other phytoplasmas, but also against the host plant and organisms commonly associated with garlic samples.
To overcome these limitations, I will classify the current cpn60 and RP candidates as proof-of-concept crRNAs rather than final diagnostic crRNAs. They can be used to test the CRISPR-Cas12a detection chemistry, optimize RPA amplification, evaluate reporter readout, and determine the general feasibility of the workflow.
For the next design cycle, I will use enriched phytoplasma whole-genome sequencing data to identify more variable or unique AYP genomic regions. These WGS-derived regions should provide better target specificity than cpn60 and RP alone. I will also expand the off-target screening pipeline to include non-target phytoplasmas, garlic host sequences, garlic-associated viruses, and relevant plant-associated microbes.
SECTION 6: ADDITIONAL INFORMATION
12. References
Ding, X., Yin, K., Li, Z., Lalla, R. V., Ballesteros, E., Sfeir, M. M., & Liu, C. (2020a). Ultrasensitive and visual detection of SARS-COV-2 using all-in-one dual CRISPR-CAS12A assay. Nature Communications, 11(1). https://doi.org/10.1038/s41467-020-18575-6
Jain, P., Rananaware, S., Vesco, E., Shoemaker, G., Anekar, S., Sandoval, L. S., Meister, K., Macaluso, N., & Nguyen, L. (2023). Programmable RNA Detection with CRISPR-CAS12A. https://doi.org/10.21203/rs.3.rs-2549171/v1
Lagner, J. R., Newberry, E. A., Rivera, Y., Zhang, L., Vakulskas, C. A., & Qi, Y. (2025). Amplification-free detection of plant pathogens by improved CRISPR-CAS12A systems: A case study on Phytoplasma. Frontiers in Plant Science, 16. https://doi.org/10.3389/fpls.2025.1544513
Lin, M., Qiu, Z., Hao, M., Qi, W., Zhang, T., Shen, Y., Xiao, H., Liang, C., Xie, L., Jiang, Y., Cheng, M., Tian, T., & Zhou, X. (2025). CAS12A cis-cleavage mediated lateral flow assay enables multiplex and ultra-specific Nucleic acid detection. Nature Communications, 16(1). https://doi.org/10.1038/s41467-025-60917-9
Mollov, D., Lockhart, B., Saalau-Rojas, E., & Rosen, C. (2014). First report of a 16sri (Aster yellows) group phytoplasma on garlic (allium sativum) in the United States. Plant Disease, 98(3), 419–419. https://doi.org/10.1094/pdis-07-13-0689-pdn
Shen, J., Chen, Z., Xie, R., Li, J., Liu, C., He, Y., Ma, X., Yang, H., & Xie, Z. (2023). CRISPR/CAS12A-assisted isothermal amplification for rapid and specific diagnosis of respiratory virus on an microfluidic platform. Biosensors and Bioelectronics, 237, 115523. https://doi.org/10.1016/j.bios.2023.115523
Wei, W., Yang, Y., Shih, J. (2026). Rapid and Sensitive Detection of Phytoplasma Diseases Using a CRISPR/Cas12a DETECTR Assay Combined with Isothermal Recombinase Polymerase Amplification. In: Janik, K., Tabarelli, M. (eds) Phytoplasma. Methods in Molecular Biology, vol 3008. Humana, New York, NY. https://doi.org/10.1007/978-1-0716-5104-9_6
Zhao, Y., Wei, W., Davis, R. E., Lee, I.-M., & Bottner-Parker, K. D. (2021). The agent associated with blue dwarf disease in wheat represents a new phytoplasma taxon, ‘candidatus phytoplasma tritici.’ International Journal of Systematic and Evolutionary Microbiology, 71(1). https://doi.org/10.1099/ijsem.0.004604
13. Create a supply list and budget for your project (bullet-point list)
What supplies, equipment, and budget is needed for your project to work?
Sample collection and preparation
Garlic tissue samples: leaves, cloves, basal plate, roots, and bulbils
RPA reagent kits or isothermal amplification reagents - $500–1,200
Synthesis of RPA primers for cpn60, RP, plant internal control, and future AYP-specific targets - $500
CRISPR-Cas12a detection
LbCas12a or LbCas12a-Ultra enzyme - $2000
Synthetic crRNAs for cpn60, RP, phytoplasma, AYP, and internal control targets - $1000
Fluorescent ssDNA reporters - $1000
Black 96-well fluorescence plates and optical seals - $500
Probe-invasion and lateral flow development
Invasion probe oligonucleotides with required modifications - $800
Lateral flow strips or custom LFA development materials: sample pads, conjugate pads, nitrocellulose membrane, absorbent pads, backing cards - $1,000
Labeled probes or reporter tags, such as biotin, FAM, digoxigenin, or other capture labels - $900
Streptavidin-gold nanoparticles or equivalent LFA conjugates - $800
Validation and controls
qPCR reagents for comparison with the CRISPR assay - $1000
Replicate testing materials for LOD, sensitivity, and specificity experiments - $500
Automation and equipment access
Liquid handling robot materials and supplies - $1000
Bioinformatics and design tools
Google Colab for crRNA design pipeline - $0
NCBI BLAST, GenBank, NUPACK, Primer-BLAST, and IDT OligoAnalyzer - $0
Geneious Prime for sequence analysis - existing institutional license
Estimated total budget
Minimum proof-of-concept budget: approximately $8,000
This would cover primer/crRNA design, RPA testing, fluorescence-based CRISPR-Cas12a validation, and basic LOD testing using existing lab equipment.
Expanded validation budget: approximately $12,000
This would include more crRNAs, more RPA primer sets, qPCR comparison, multiple garlic tissues, non-target controls, and better LOD/sensitivity testing.
Advanced LFA/probe-invasion prototype budget: approximately $20,000
This would include custom invasion probes, modified reporters, lateral flow materials, multiplex strip design, and optimization of a field-compatible readout.