Week 10 HW: Imaging and Measurement
For your final project:
- Please identify at least one (ideally many) aspect(s) of your project that you will measure. It could be the mass or sequence of a protein, the presence, absence, or quantity of a biomarker, etc. I intend to measure the presence of cyclotide activity using the GFP signal from a reporter construct. I also intend to measure the extent of membrane lysis caused by the presence of my cyclotides. Controls to make sure the system is working.
- Please describe all of the elements you would like to measure, and furthermore describe how you will perform these measurements. A. eGFP reporter signal (cyclotide activity screen)
What is measured
- Fluorescence intensity of eGFP as a function of time (e.g., every 2–5 minutes for 30–120 minutes) and the final endpoint value.
How it will be measured
- Spectrophotometer/plate reader fluorescence mode (preferably plate reader).
- Record:
- baseline fluorescence (t = 0)
- fluorescence time-course
- endpoint fluorescence
What is reported (recommended metrics)
- Initial rate (slope of fluorescence increase)
- Time-to-onset (lag time)
- Endpoint fluorescence (plateau)
- Percent change relative to control
Critical controls (so results can be interpreted)
- No DNA template (background fluorescence from reagents)
- No cyclotide/extract (baseline expression)
- IPTG positive control (confirms LacI system is responsive)
- Sample-only control (extract + no reporter) to detect autofluorescence or quenching
- “Vehicle” control (buffer used for extract prep)
How cyclotide “activity” is interpreted
B. Liposome membrane lysis (direct membrane disruption)
This is to confirm the activity of candidate cyclotide.
What is measured
Quantifiable proxy for liposome leakage/lysis using dye or haemoglobin-leakage: fluorescence increase/decrease as dye is released or dequenched
- Turbidity/optical density shift: absorbance change as vesicles break/aggregate (less specific than dye leakage)
How it will be measured (spectrophotometer/plate reader)
- Fluorescence is read over time after adding cyclotide extract/fraction.
- Calculate percent leakage:
- 0% leakage = buffer control
- 100% leakage = detergent/lysis control (e.g., a known surfactant that fully disrupts membranes)
What is reported
- % leakage at fixed time (e.g., 10 min, 30 min)
- Leakage kinetics (rate)
- EC50-like comparison between extracts/fractions (if doing dilutions)
Critical controls
- Buffer-only (no lysis baseline)
- Positive lysis control (complete disruption reference)
- Extract-only without dye liposomes (to check optical interference)
C. Hemolysis assay (biological relevance / toxicity proxy)
What is measured
- Release of hemoglobin from red blood cells after exposure to cyclotide extracts.
How it will be measured
- Spectrophotometric absorbance of supernatant after incubation and pelleting intact cells.
- Report % hemolysis relative to:
- Negative control: isotonic buffer (0% hemolysis)
- Positive control: complete lysis condition (100% hemolysis)
What to report
- % hemolysis vs concentration (dose–response)
- Compare “membrane lysis in liposomes” vs “hemolysis” (helps show whether the effect is general membrane destruction or selective)
Critical controls
- Buffer-only
- Full lysis control
- Extract blank (color/background absorbance correction)
- What are the technologies you will use (e.g., gel electrophoresis, DNA sequencing, mass spectrometry, etc.)? Describe in detail.
I would apply DNA construct design and in silico editing to assemble the LacI–sfGFP plasmid in Benchling. I would also use basic bioproduction techniques, including bacterial transformation, plasmid preparation, and Sanger sequencing for verification. For functional testing, I would use cell‑free reactions (TXTL) to measure GFP expression directly from the plasmid. Optionally, I might also use basic data analysis / modeling (e.g., in a notebook) to quantify fold‑change and compare time courses between induced and uninduced reactions.
Waters Part I — Molecular Weight
Calculated MW from the eGFP sequence (with LE + His6 tag)
Using the provided sequence (includes “LEHHHHHH”), the theoretical intact mass is about 28.006 kDa (28,006.6 Da, average mass).
Compute pI/Mw - Results
- Theoretical pI/Mw (average)
Sequence:
10 20 30 40 50 60
MVSKGEELFT GVVPILVELD GDVNGHKFSV SGEGEGDATY GKLTLKFICT TGKLPVPWPT
70 80 90 100 110 120
LVTTLTYGVQ CFSRYPDHMK QHDFFKSAMP EGYVQERTIF FKDDGNYKTR AEVKFEGDTL
130 140 150 160 170 180
VNRIELKGID FKEDGNILGH KLEYNYNSHN VYIMADKQKN GIKVNFKIRH NIEDGSVQLA
190 200 210 220 230 240
DHYQQNTPIG DGPVLLPDNH YLSTQSALSK DPNEKRDHMV LLEFVTAAGI TLGMDELYKL
EHHHHHH
Theoretical pI/Mw: 5.90 / 28006.60
- MW using the adjacent charge-state approach (from Figure 1)
Using adjacent peaks in the intact ESI spectrum (e.g., 933.804 and 903.715 m/z are adjacent charge states), the charge is 30+ for the 933.804 peak, giving an intact mass near 28.0 kDa.
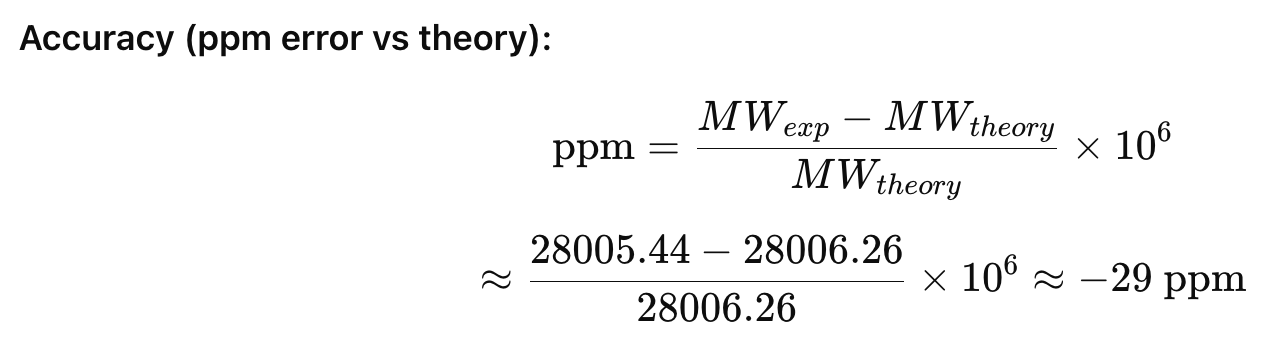
Using multiple adjacent pairs and averaging gives MW of 28,005.44 Da (28.005 kDa)**.
- Accuracy (ppm error vs theory):

- Charge state of the zoomed-in peak (~1473 m/z) in the intact spectrum
Yes. The isotope spacing in the zoom is consistent with ~19+ (\Delta m/z \approx 1/z)).
Waters Part 2 — Secondary and Tertiary Structure
- Difference between native vs denatured conformations and how MS shows it
-Denatured proteins are unfolded/extended and typically pick up more charges This shifts the envelope to lower m/z and also broader charge-state distributions. -Native proteins remain compact and usually show fewer charges, giving a narrower distribution at higher m/z. In Figure 2, the denatured spectrum shows many higher-charge peaks, while the native spectrum concentrates into fewer, lower-charge states at higher m/z.
- Charge state of the native peak at 2800 m/z
Using the native spectrum mass (28 kDa), a peak near 2800 m/z corresponds to about 10+ This is consistent with the native envelope shown.
Waters Part III — Peptide Mapping (Primary Structure)
- How many Lys (K) and Arg (R) are in eGFP?
K = 20, R = 6 (total cleavage residues = 26).
- How many peptides from tryptic digestion?
Trypsin rules are cuts occur after K/R unless followed by P), this gives a total of 27 tryptic peptides.
- How many chromatographic peaks between 0.5 and 6 min (>10% rel. abundance)?
From Figure 5a, there are 21 prominent peaks in the specified range (0.61, 0.79, 1.20, 1.43, 1.80, 1.85, 1.93, 2.17, 2.26, 2.54, 2.78, 3.27, 3.53, 3.59, 3.70, 4.30, 4.48, 4.64, 4.87, 5.06, 5.43).
- Does peak count match predicted peptide count?
No. There are 27 predicted peptides for 21 chromatographic peaks . This can happen because some peptides are not abundant or elute together. Ionisation extent may also vary.
Identify m/z, charge z, and compute singly charged mass for the peptide in Figure 5b
Major peak: m/z 525.767
Isotope spacing is 0.5 Th and z = 2+
!(Equation)[Singlycharged.png]
- Identify the peptide and calculate ppm error
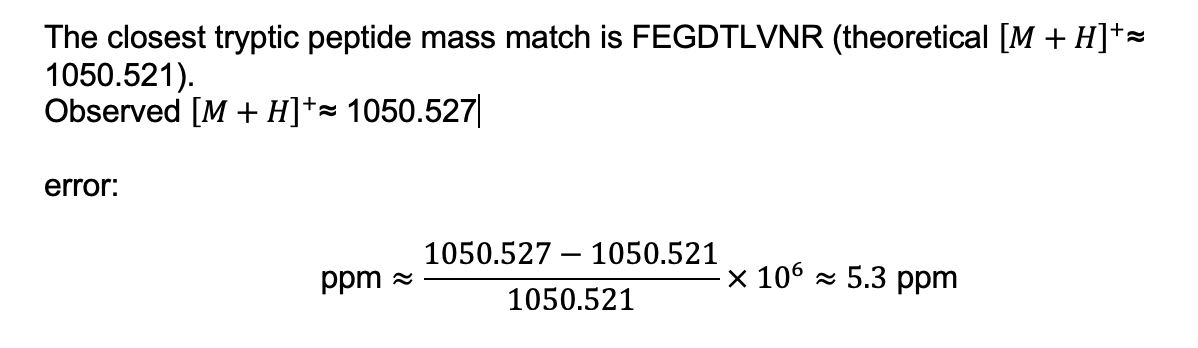
Mass spectrum for the peptide is in Figure 5b.
- % sequence confirmed by peptide mapping
The coverage map reports 88% identified.
- Waters Part IV — Oligomers (KLH CDMS)
Using the reported subunit masses (7FU = 340 kDa; 8FU = 400 kDa), the expected oligomer masses are:
7FU decamer: 10 × 340 kDa = 3.40 MDa, consistent with the 3.4 MDa peak.
8FU didecamer (these can be interpreted as 2 decamers; 20-mer): 20 × 400 kDa = 8.0 MDa, consistent with the 8.33 MDa peak.
8FU 3-decamer (30-mer): 30 × 400 kDa = 12.0 MDa, consistent with the 12.67 MDa peak.
8FU 4-decamer (40-mer): 40 × 400 kDa = 16.0 MDa, expected near 16 MDa; this is not a strong labeled peak in the provided spectrum.
Waters Part V — Did I make GFP?
Theoretical molecular weight (from sequence): 28.006 kDa
Observed intact LC–MS molecular weight (from Part I ): 28.005 kDa
Mass error: −29 ppm (observed slightly lower than theoretical)