Week 10 HW: Advanced Imaging and Measurement Technology
Homework: Final Project
For your final project:
- Please identify at least one (ideally many) aspect(s) of your project that you will measure. It could be the mass or sequence of a protein, the presence, absence, or quantity of a biomarker, etc.
Answer
One of the aspects I will measure is the expression levels and enzymatic activity of the four colorimetric reporters in response to known concentrations of their respective target metals in a cell-free system. The colorimetric reporters are LacZ (Blue, for lead detection), Crtl (Orange, for arsenic detection), BpsA(Purple, for mercury detection) ad MelA(Brown, for cadmium detection)
- Please describe all of the elements you would like to measure, and furthermore, describe how you will perform these measurements.
- What are the technologies you will use (e.g., gel electrophoresis, DNA sequencing, mass spectrometry, etc.)? Describe in detail
Answer
I would measure the expression levels and enzymatic activity of the four colorimetric reporters by performing a series of serial dilutions of each target metal with cell-free reactions containing the two dual plasmids I would design. In a 384-well plate format using the Echo525 acoustic liquid handler. The reporter output will be quantified by absorbance spectroscopy on the Spark Plate Reader to capture all four reporter absorbance peaks simultaneously.
Homework: Waters Part I — Molecular Weight
We will analyze an eGFP standard on a Waters Xevo G3 QTof MS system to determine the molecular weight of intact eGFP and observe its charge state distribution in the native and denatured (unfolded) states. The conditions for LC-MS analysis of intact protein cause it to unfold and be detected in its denatured form (due to the solvents and pH used for analysis).
Question 1. Based on the predicted amino acid sequence of eGFP (see below) and any known modifications, what is the calculated molecular weight? You can use an online calculator like the one at https://web.expasy.org/compute_pi/
eGFP Sequence: MVSKGEELFTG VVPILVELDG DVNGHKFSVS GEGEGDATYG KLTLKFICTT GKLPVPWPTL VTTLTYGVQC FSRYPDHMKQ HDFFKSAMPE GYVQERTIFF KDDGNYKTRA EVKFEGDTLV NRIELKGIDF KEDGNILGHK LEYNYNSHNV YIMADKQKNG IKVNFKIRHN IEDGSVQLAD HYQQNTPIGD GPVLLPDNHY LSTQSALSKD PNEKRDHMVL LEFVTAAGIT LGMDELYKLE HHHHHH
Note: This contains a His-purification tag (HHHHHH) and a linker (the LE before it).
Answer
Using the Expasy online calculator, the predicted amino acid sequence of eGFP has a molecular weight of 28006.60 Daltons and a theoretical pl of 5.90.
Question 2. Calculate the molecular weight of the eGFP using the adjacent charge state approach described in the recitation. Select two charge states from the intact LC-MS data (Figure 1) and:
Answer
The two charge states I selected from Figure 1 are 933.7349 and 903.7148. 933.7349 represents m/zn and 903.7148 represents m/zn+1.
- Determine z for each adjacent pair of peaks (n,n+1).
Answer
m/zn = 933.7349
m/zn+1 = 903.7148
z = m/zn+1 / m/zn - m/zn+1
putting the values into the formula
z = 903.7148 / (933.7349 - 903.7148)
z = 903.7148 / 30.0201
z = 30.103
Z is aproximalty = 30
Therefore, the charge state at n is 30 and the charge state at n+1 is 31
- Determine the MW of the protein using the relationship between m/zn, MW, and z.
Answer
m/zn = zn × H / zn
MW = (m/zn)
MW = (m/zn - H )× z
MW = (933.7349 - 1.00728) × 30
MW = 27,981.8286
- Calculate the accuracy of the measurement using the deconvoluted MW from 2.2 and the predicted weight of the protein from 2.1.
Answer
Accuracy = | MWexperiment - MWtheory| / MWtheory × 1,000,000
MWexperiment = 27981.8286
MWtheory = 28006.60
Accuracy = 27,981.8286 - 28006.60 / 28006.60 × 1,000,000
Accuracy = - 0.00088448 × 1,000,000
Accuracy = -884.48
- Can you observe the charge state for the zoomed-in peak in the mass spectrum for the intact eGFP? If yes, what is it? If no, why not?
Answer
Homework: Waters Part II — Secondary/Tertiary structure
We will analyze eGFP in its native, folded state and compare it to its denatured, unfolded state on a quadrupole time-of-flight MS. We will be doing MS-only analysis (no liquid chromatography, also known as “direct infusion” experiments) on the Waters Xevo G3-QToF MS.
Question 1. Based on learnings in the lab, please explain the difference between native and denatured protein conformations. For example, what happens when a protein unfolds? How is that determined with a mass spectrometer? What changes do you see in the mass spectrum between the native and denatured protein analyses (Figure 2)?
Answer
A native protein conformation refers to the properly folded, functional, and most thermodynamically stable three-dimensional shape of a protein under physiological conditions. However, a denatured protein conformation refers to the unfolded, disordered, inactive state of a protein. When a protein unfolds, it loses its secondary, tertiary, and quaternary structures, which make up its specific 3D shape, while its primary amino acid sequence remains intact. This exposes previously buried residues and increases its surface area.
A mass spectrometer can determine the differences in protein conformation by measuring the number of charges a protein acquires during ionization. In a native conformation, the protein remains compact and has fewer exposed sites for protonation, resulting in lower charge states, a narrow charge distribution, and sharp peaks at higher m/z ratios. While in a denatured conformation, the unfolded protein has exposed sites for protonation, resulting in higher charge states, a broader charge distribution, and peaks at lower m/z ratios.
In Figure 2, the denatured eGFP shows several closely spaced peaks reflecting high charge states of the unfolded protein. The native eGFP shows a few narrow, sharp peaks reflecting low charge states of the compact protein.
Question 2. Zooming into the native mass spectrum of eGFP from the Waters Xevo G3 QTof MS (see Figure 3), can you discern the charge state of the peak at ~2800 m/z? What is the charge state? How can you tell?
Answer
You cannot discern the charge state at 2800 m/z just by zooming in, but you can calculate it by using the difference in isotope spacing of the charge peaks at ~2800 m/z and dividing 1 by the answer.
Spacing = 2799.6365 - 2799.4199 = 0.2166
z = 1/ spacing = 1 / 0.2166
z = 4.616
The charge state of the peak at ~ 2800 is 4.
Homework: Waters Part III — Peptide Mapping - primary structure
We will digest the eGFP protein standard into peptides using trypsin (an enzyme that selectively cleaves the peptide bond after Lysine (K) and Arginine (R) residues. The resulting peptides will be analyzed on the Waters BioAccord LC-MS to measure their molecular weights and fragmented to confirm the amino acid sequence within each peptide – generating a “peptide map”. This process is used to confirm the primary structure of the protein.
There are a variety of tools available online to calculate protein molecular weight and predict a list of peptides generated from a tryptic digest. We will be using tools within the online resource Expasy (the bioinformatics resource portal of the Swiss Institute of Bioinformatics (SIB)) to predict a list of tryptic peptides from eGFP.
Question 1. How many Lysines (K) and Arginines (R) are in eGFP? Please circle or highlight them in the eGFP sequence given in Waters Part I question 1 above. (Note: adding the sequence to Benchling as an amino acid file and clicking biochemical properties tab will show you a count for each amino acid).
Answer
MVSKGEELFTG VVPILVELDG DVNGHKFSVS GEGEGDATYG KLTLKFICTT GKLPVPWPTL VTTLTYGVQC FSRYPDHMKQ HDFFKSAMPE GYVQERTIFF KDDGNYKTRA EVKFEGDTLV NRIELKGIDF KEDGNILGHK LEYNYNSHNV YIMADKQKNG IKVNFKIRHN IEDGSVQLAD HYQQNTPIGD GPVLLPDNHY LSTQSALSKD PNEK RDHMVL LEFVTAAGIT LGMDELYKLE HHHHHH
eGFP contains 20 lysine (K) residues and 6 Arginine (R) residues.
Question 2. How many peptides will be generated from tryptic digestion of eGFP? Navigate to https://web.expasy.org/peptide_mass/
Answer
I used https://web.expasy.org/peptide_mass/ to digest the eGFP protein into peptides using trypsin.
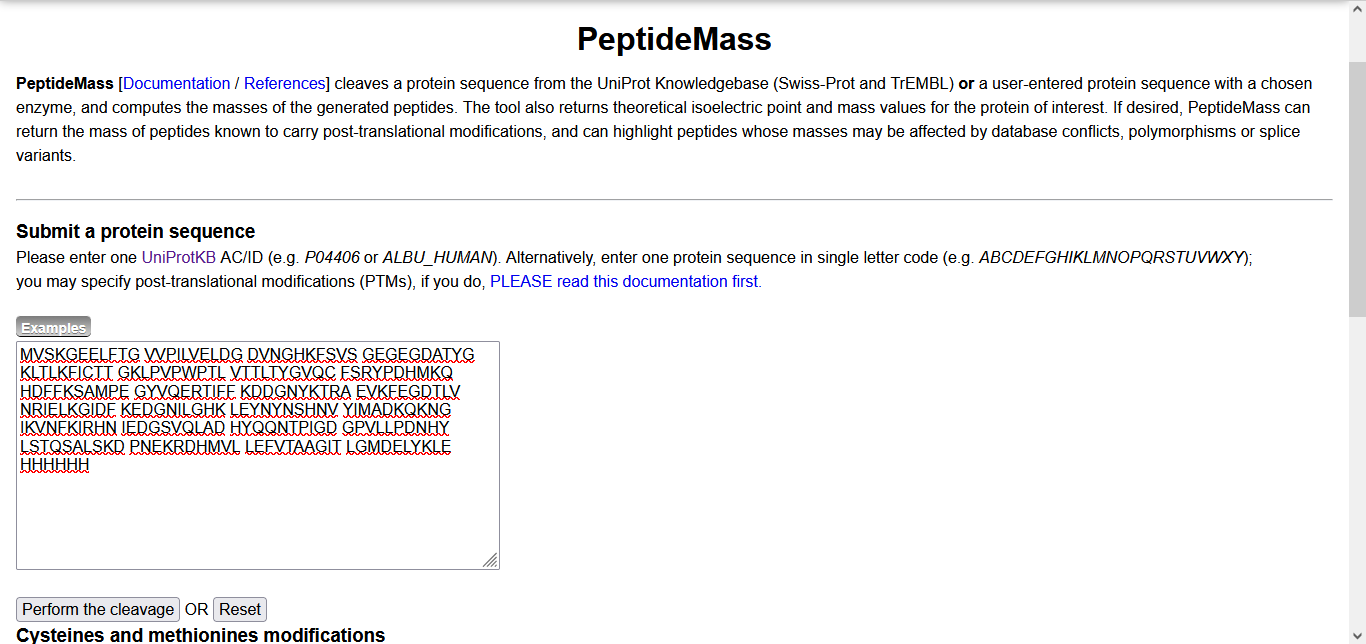
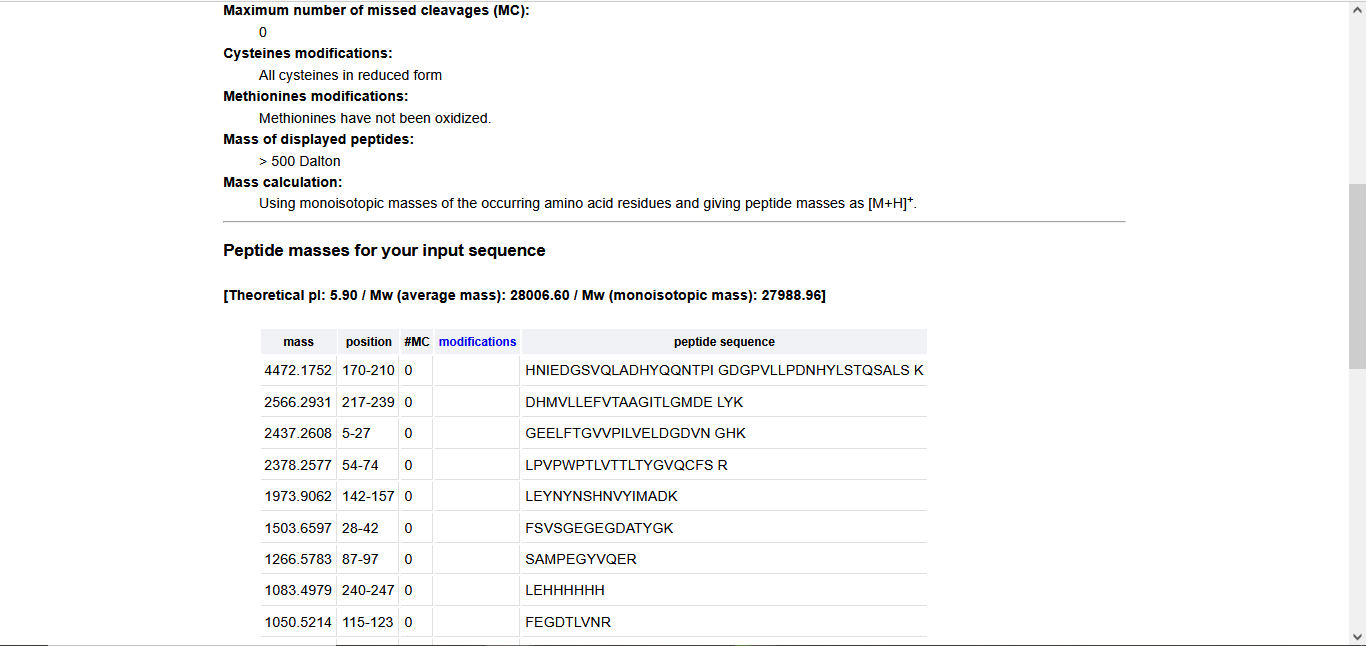
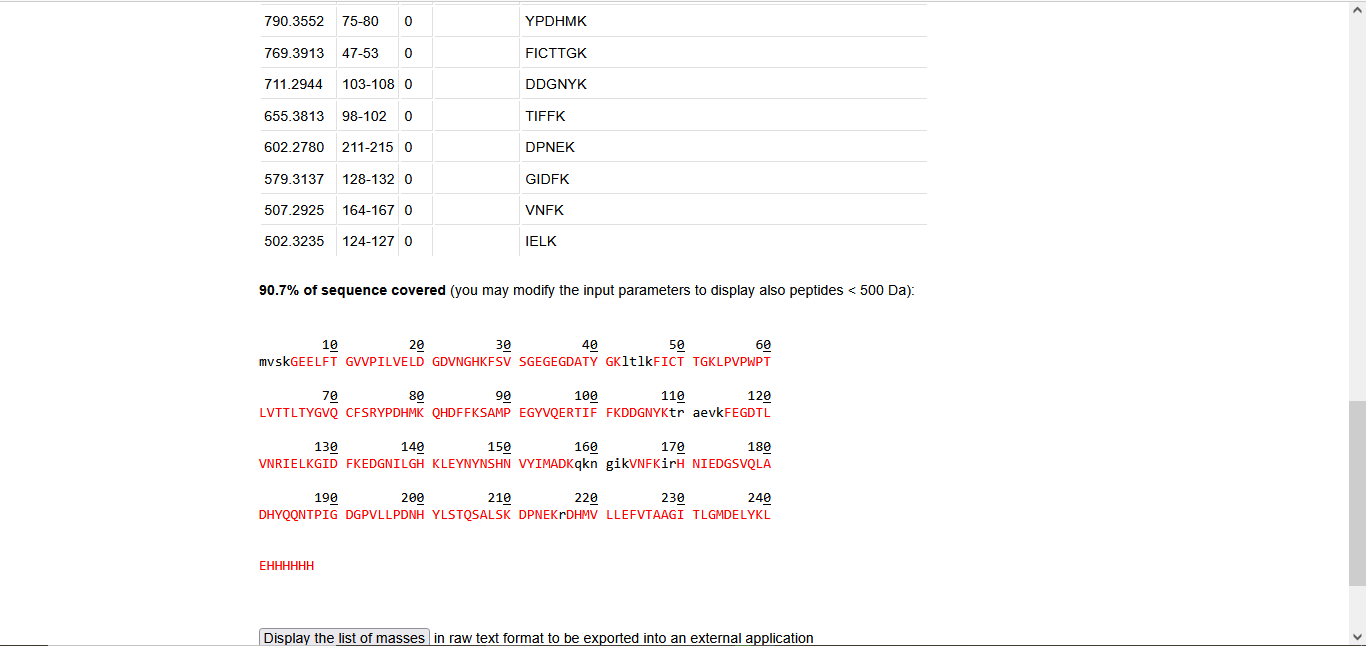
There were 19 monoisotopic peptides larger 500 daltons generated from tryptic digestion of eGFP.
Question 3. Based on the LC-MS data for the Peptide Map data generated in lab (please use Figure 5a as a reference) how many chromatographic peaks do you see in the eGFP peptide map between 0.5 and 6 minutes? You may count all peaks that are >10% relative abundance.
Answer
Based on Figure 5a, there are 25 peaks between 0.5 and 6 minutes in the eGFP peptide map.
Question 4. Assuming all the peaks are peptides, does the number of peaks match the number of peptides predicted from question 2 above? Are there more peaks in the chromatogram or fewer?
Answer
The number of peaks and peptides is not identical. There are more peaks in the chromatogram.
Question 5. Identify the mass-to-charge (m/z) of the peptide shown in Figure 5b. What is the charge (z) of the most abundant charge state of the peptide (use the separation of the isotopes to determine the charge state). Calculate the mass of the singly charged form of the peptide (|M+H|+) based on its m/z, and z.
Answer
The most abundant peak of Figure 5b is 252.76712, and the second most abundant peak is 526.25918.
using the zoomed-in insert, the isotope peaks are:
- monoisotopic 525.76712 m/z
- +1 isotope 526.25918 m/z
- +2 isotope 526.76845 m/z
- +3 isotope 527.26098 m/z
finding the spacing between consecutive isotope peaks:
526.25918 - 525.76712 = 0.49206
526.76845 - 526.25918 = 0.50927
527.26098 - 526.76845 = 0.49253
average spacing = (0.49206 + 0.50927+ 0.49253)/3 = 0.4979 = 0.5
Z = 1/ average spacing = 1/0.5 = 2
Therefore, the charge of the most abundant charge state is 2.
For the singly charged mass
|M+H|+ = (m/z × z) - (z-1) × 1.00728
m/z = 525.76712
z = 2
mass of a proton = 1.00728
|M+H|+ = (525.76712 × 2) - (2-1) × 1.00728 = 1050.52696 Daltons = 1050.527 Daltons
Therefore, the mass of the singly charged form of the peptide is 1050.527 Daltons.
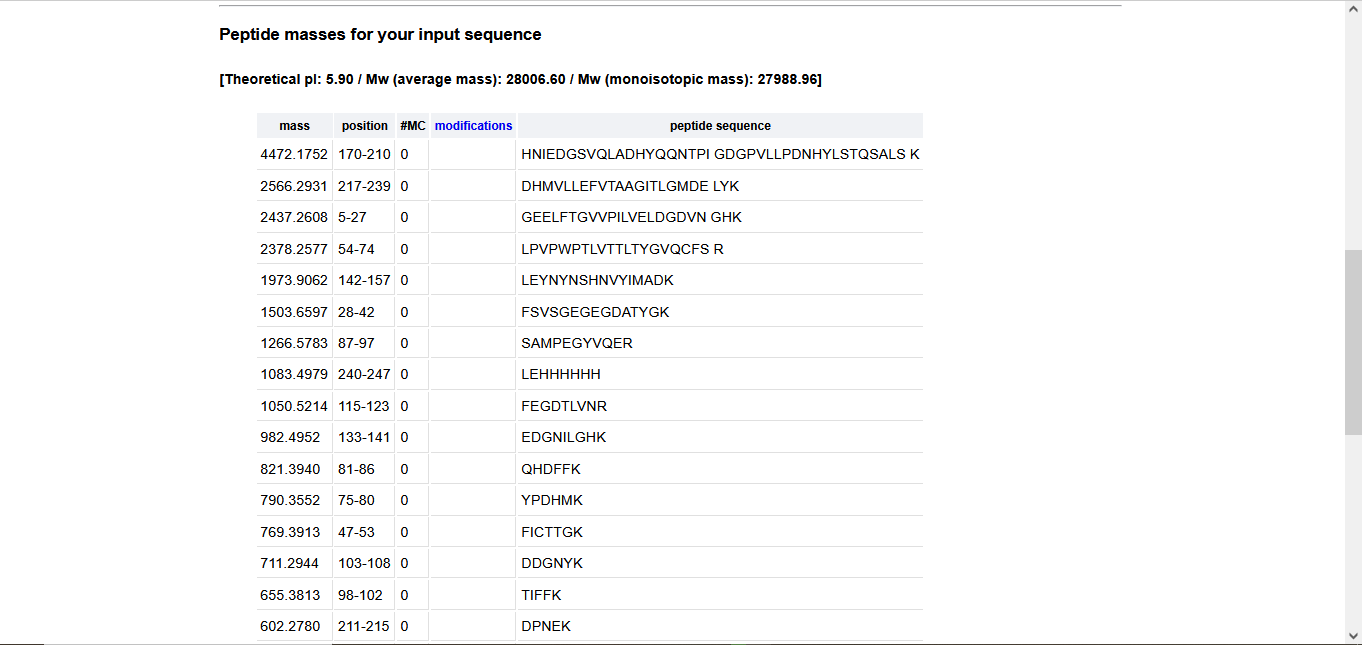
Question 6. Identify the peptide based on comparison to expected masses in the PeptideMass tool. What is the mass accuracy of measurement? Please calculate the error in ppm.
Answer
Accuracy = | MWexperiment - MWtheory| / MWtheory
Using 1050.5214 | 115-123 | FEGDTLVNR as the therotical molecular weight and |M+H|+ = 1050.527 Daltons as the experimantal molecular weight.
Accuracy = |1050.527 - 1050.5214| / 1050.5214 × 1,000,000 = 5.330 ppm
Question 7. What is the percentage of the sequence that is confirmed by peptide mapping?
Answer
The percentage of the sequence confirmed by peptide mapping is 88%.
Homework: Waters Part IV — Oligomers
We will determine Keyhole Limpet Hemocyanin (KLH)’s oligomeric states using charge detection mass spectrometry (CDMS). CDMS single-particle measurements of KLH allow us to make direct mass measurements to determine what oligomeric states (that is, how many protein subunits combine) are present in solution. Using the known masses of the polypeptide subunits (Table 1) for KLH, identify where the following oligomeric species are on the spectrum shown below from the CDMS (Figure 7):
7FU Decamer
8FU Didecamer
8FU 3-Decamer
8FU 4-Decame
Answer Using Table 1 and Figure 7, the masses of the oligomeric states are :
- 7FU Decamer is 3.40 MDa
- 8FU Didecamer is 8.33 MDa
- 8FU 3-Decamer is 12.67 MDa
- 8FU 4-Decame is 20 MDa
Homework: Waters Part V — Did I make GFP?
Please fill out this table with the data you acquired from the lab work done at the Waters Immerse Lab in Cambridge, or else the data screenshots in this document if you were unable to have lab work done at Waters.
Answer
Our node did not visit Waters Immerse Lab, so I am just filling the table with the data from my previous calculations for eGFP.
| Theoretical | Observed | PPM Mass Error | |
|---|---|---|---|
| Molecular weight (kDa) | 28006.60 | 27981.8286 | -884.48 |