Week 4: Protein Design Part I
Part A. Conceptual Questions
Q1: How many molecules of amino acids do you take with a piece of 500 grams of meat? (on average an amino acid is ~100 Daltons)
1 Da equals 1.66053906892(52)×10−27 kg, so 1 aa is 1.66053906892(52)×10−25 kg. The average protein fraction in meat is ~20%. Therefore, the total amount of protein is 100g. The number of aa in 100g = 0.1kg of protein is ~6×10²³ or Avogadro number, 1 mole.
Q2: Why do humans eat beef but do not become a cow, eat fish but do not become fish?
To become another organism, we need to use its DNA to produce proteins within us. However, DNA, RNA, and proteins, we consume are broken down and absorbed, and so only their building blocks and not the information their sequences carry is used in our body.
Q3: Why are there only 20 natural amino acids?
The set of 20 amino acids has been established through evolution, and it would be impossible to change already fixed codons because a change would corrupt thousands of proteins.
Q4: Can you make other non-natural amino acids? Design some new amino acids.
Yes. Some design strategies can include adding an azide to a sidechain for the aa to react in click chemistry reactions or an isotope.
Q5: Where did amino acids come from before enzymes that make them, and before life started?
The production of amino acids does not require enzymes. Enzyme-independent production of amino acids was possible in the early Earth atmosphere, in hydrothermal vents, and through the Strecher Synthesis. Additionally, amino acids reach Earth with meteorite material.
Q6: If you make an α-helix using D-amino acids, what handedness (right or left) would you expect?
The resulting helix will be left-handed.
Q7: Can you discover additional helices in proteins?
Yes. Several other types (4+) of helices have been identified beyond α-helices.
Q8: Why are most molecular helices right-handed?
Most polymer molecules are right-handed because they are comprised from left-handed monomers. In helices, left-handed monomers would occupy more space near the backbone, which is energetically inefficient.
Q9: Why do β-sheets tend to aggregate? What is the driving force for β-sheet aggregation?
They aggregate due to exposed NH group being hydrogen donors and C=O groups being acceptors on the edge of a sheet, so edges form hydrogen bonds (the driving force); due to hydrophobic sides associating with each other; due to steric compatibility of identical sheets; due to matching electrostatic periodicity in sheets; due to low configurational entropy cost of aggregations.
Q10: Why do many amyloid diseases form β-sheets? Can you use amyloid β-sheets as materials?
Yes, β-sheets are used as materials (Kevlar, peptide hydrogels as tissue engineering scaffolds).
Due to stress, mutations, and aging, proteins partially unfold. β-sheets with an alternation of hydrophobic and hydrophilic sites ease aggregation and then the growth of stable aggregates. Sequences with alternating hydrophobic and hydrophilic residues get exposed and form β-sheet conformation due to thermodynamic stability. These sheets bind and stack due to hydrogen bonds and hydrophobic interactions, and the oligomers then grow to exceptionally stable fibers.
Q11: Design a β-sheet motif that forms a well-ordered structure.
In the week 5 homework, one of the generated binders produced a beta sheet structure upon co-folding it with the target (SODI), and so while a well-ordered structure is more of an empirical claim, I chose to analyze the binder I previously got and potentially improve it in silico.
PepMLM-generated binder to human SOD1: HLYYVAGVRWKK (Peptide 2, Psudo Perplexity 30.9)
To find out whether it is stably folded into beta sheets even when no target template is present, the peptide was folded separately (without SOD1) in AlphaFold3. Three folds (the highest-ranked model considered per seed) confirmed that the hairpin structure is reproducible. In all the folds, average pLDDT was uniformly high (>90%), and the Expected Position Error graphs showed uniformly low Error (Figure 1).
 Peptide 2 + SOD1 ipTM = 0.39, pTM = 0.88, Seed 1713765441 |  Fold 1 ipTM = - , pTM = 0.03, Seed 1006183688 | 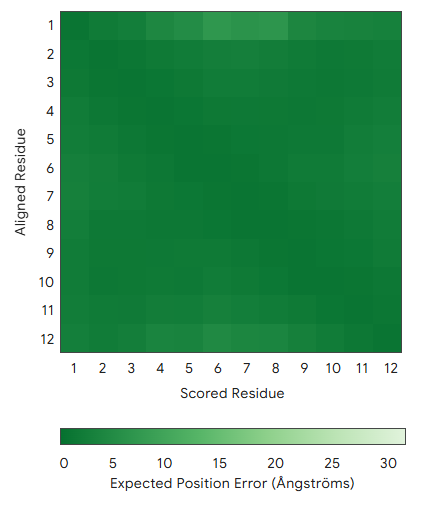 Fold 1, Expected Position Error ipTM = 0.39, pTM = 0.86 , Seed 1006183688 |
 Fold 2 ipTM = -, pTM = 0.03, Seed 82777850 |  Fold 3 ipTM = 0.74, pTM = 0.86, Seed 1025749217 | 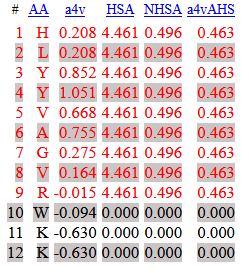 AGGRESCAN output |
To explore this hairpin structure further and predict its intermolecular behavior, adding this to the confidence metrics observed in AlphaFold3, the peptide was analyzed in the AGGRESCAN web interface (Conchillo-Solé, O., de Groot, N. S., Avilés, F. X., Vendrell, J., Daura, X., & Ventura, S. (2007). AGGRESCAN: a server for the prediction and evaluation of" hot spots" of aggregation in polypeptides. BMC bioinformatics, 8(1), 65). This analysis would inform whether the strands are prone to intermolecular β-aggregation.
AGGRESCAN results highlighted 1 hot-spot consisting of 9 residues, peak aggregation propensity at Y4 (1.051) and Y3 (0.852), and a3vSA = 0.268: net aggregation-prone on average (Fig 1, last insert, and Figure 2).
To find out whether changing Ala to Asn (to make an Asn-Gly turn instead of Ala-Gly turn (Griffiths-Jones et al. 1998)) improves net aggregation propensity, the modified sequence was analyzed in AlphaFold3:
HLYYVAGVRWKK -> HLYYVNGVRWKK HLYYVAGVRWKK, highest ranked model parameters: chain_pair_pae_min = 0.76, fraction_disordered 1.00, ranking_score = 0.53. HLYYVNGVRWKK: highest ranked model parameters: chain_pair_pae_min = 0.76, fraction_disordered 1.00, ranking_score = 0.53.
The folding results are identical, and the two sequences can both fold to the same hairpin. Thermodynamic stability can be more informative to confirm if the modification influenced the stability of the structure. Other methods (e.g. adding cross-strand pairs, cation or aromatic) may further reinforce the structure.
(Ref.
Griffiths-Jones, S., Maynard, A., & Sharman, G. (1998). NMR evidence for the nucleation of a β-hairpin peptide conformation in water by an Asn-Gly type I′ β-turn sequence. Chemical Communications, (7), 789-790.)
Part B: Protein Analysis and Visualization
1. Protein choice
I chose alpha-synuclein (SNCA) Uniprot P37840 because its toxic form accumulates in Parkinson’s disease, and the mechanisms of alpha-synuclein aggregation are still being investigated.
The protein is comprised of 3 domains: an amphipathic N-terminal domain (1-60), a hydrophobic NAC domain (61-95), and an acidic C-terminus (96-140). Three isoforms produced by alternative splicing are: isoform 1 of 140 aa canonical, isoform 2 of 112 aa, and isoform 3 of 126 aa. The protein is normally a monomer, with the highest concentration in the brain and concentrated in the presynaptic terminals of nerve cells. The ’non A-beta component of Alzheimer disease amyloid plaque’ domain (NAC domain) is hydrophobic and is involved in fibril formation. The C-terminus may regulate aggregation and determine the diameter of the filaments.
2. Protein Sequence and Its Analysis
MDVFMKGLSKAKEGVVAAAEKTKQGVAEAAGKTKEGVLYVGSKTKEGVVHGVATVAEKTKEQVTNVGGAVVTGVTAVAQKTVEGAGSIAAATGFVKKDQLGKNEEGAPQEGILEDMPVDPDNEAYEMPSEEGYQDYEPEA• SNCA is 140 aa long. The most common aa are A (Alanine) and V (Valine).
Amino Acid Frequencies:
V: 19 (13.57%)

A: 19 (13.57%)

G: 18 (12.86%)

E: 18 (12.86%)

K: 15 (10.71%)

T: 10 (7.14%)

D: 6 (4.29%)

Q: 6 (4.29%)

P: 5 (3.57%)

M: 4 (2.86%)

L: 4 (2.86%)

S: 4 (2.86%)

Y: 4 (2.86%)

N: 3 (2.14%)

F: 2 (1.43%)

I: 2 (1.43%)

H: 1 (0.71%)
• 250 homologs were identified with the Uniprot’s BLAST tool
• Alpha-synuclein is a member of the synuclein family, which also includes beta- and gamma-synuclein.
3. Protein Structure
Protein Data Bank PDB Structure Page: micelle-bound human alpha-synuclein, 1XQ8 | pdb_00001xq8 and disease-relevant fiber structure, 6A6B | pdb_00006a6b
The structure of the monomer was solved with NMR and published in 2005. The structure of the fiber was solved with EM, with a resolution of 3.07 Å and published in 2018. No other molecules other than SNCA are present in the structures.
The protein belongs to the Synuclein structure classification family (Structural Classification of Proteins).
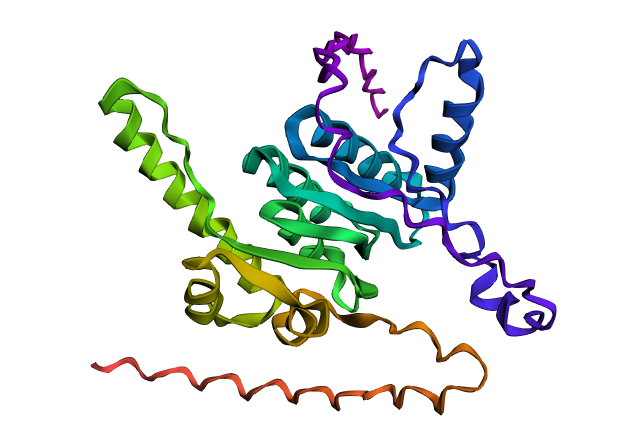
4. Visualization
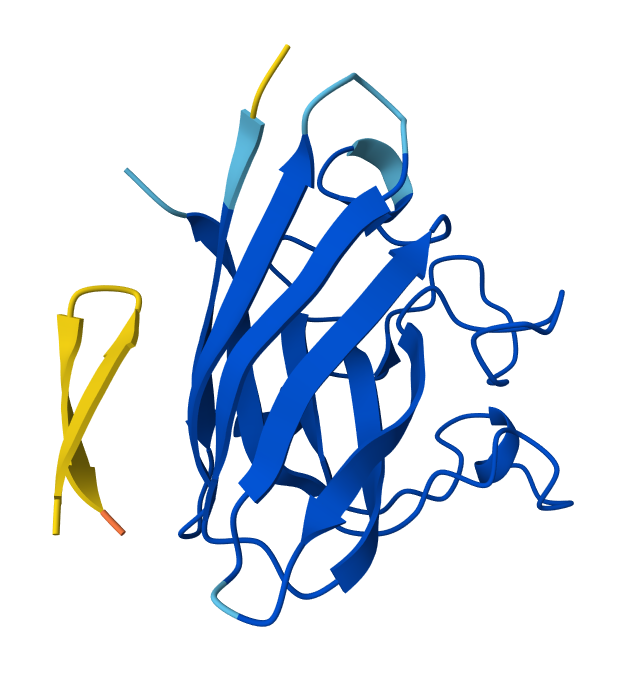
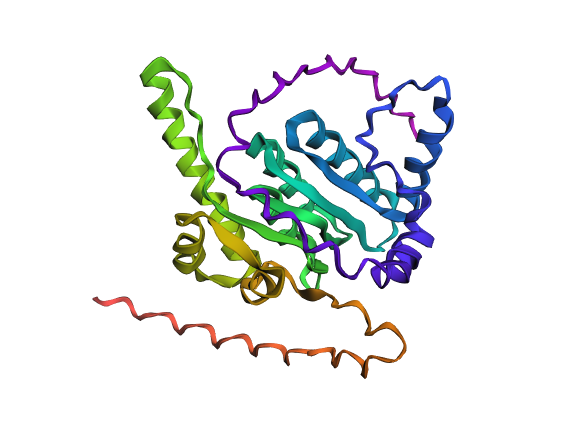
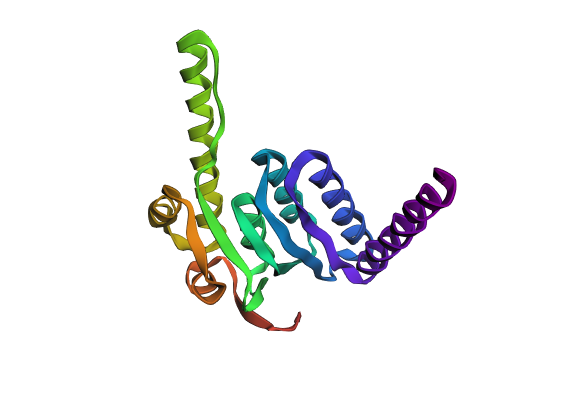
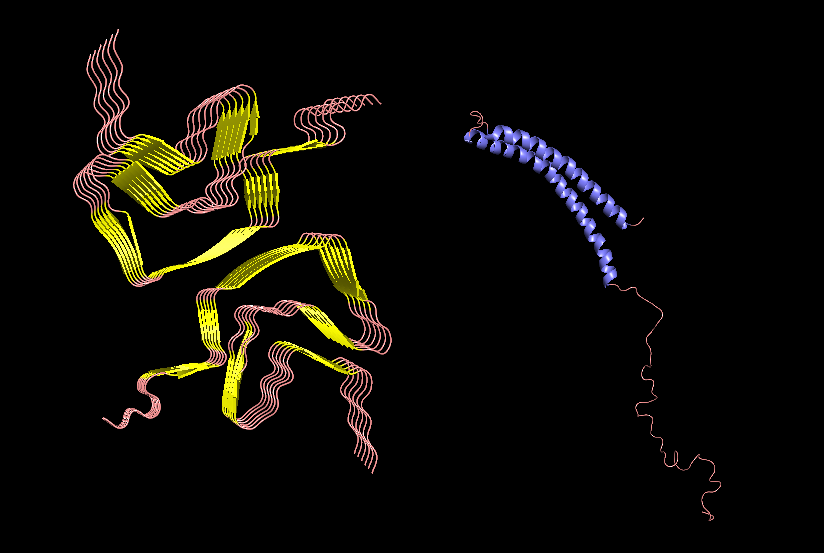 PyMol Cartoon visualization of an SCNA aggregate (6A6B) EM structure and of an SNCA monomer (1XQ8) NMR structure. Colours by secondary structure.
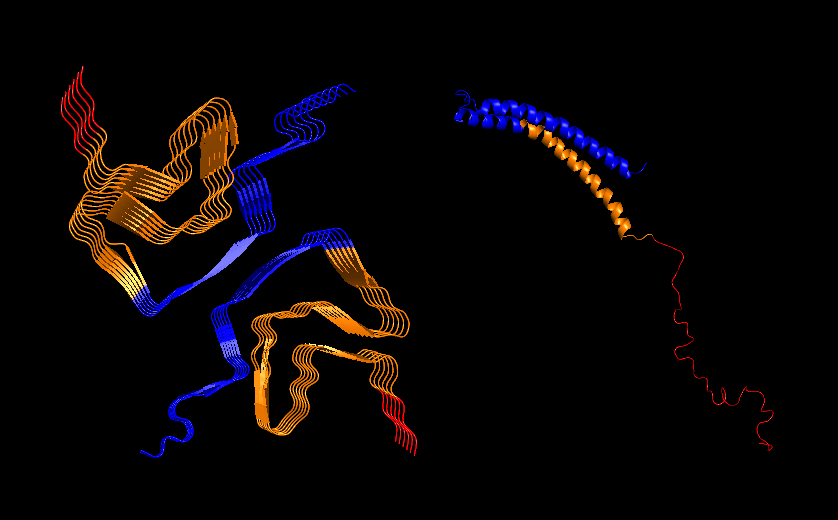 PyMol Cartoon visualization of the same structures. Blue (37–60) - N-terminal region, Orange (61–95) - NAC region, Red (96–99)- C-terminal region.
Part C. Using ML-Based Protein Design Tools
I chose human mitochondrial protease ClpP, the protease component of the ClpXP complex that cleaves peptides and various proteins in an ATP-dependent process. ClpP binds the NAC domain of SCNA, and this binding inhibits the protease.
MWPGILVGGARVASCRYPALGPRLAAHFPAQRPPQRTLQNGLALQRCLHATATRALPLIPIVVEQTGRGERAYDIYSRLLRERIVCVMGPIDDSVASLVIAQLLFLQSESNKKPIHMYINSPGGVVTAGLAIYDTMQYILNPICTWCVGQAASMGSLLLAAGTPGMRHSLPNSRIMIHQPSGGARGQATDIAIQAEEIMKLKKQLYNIYAKHTKQSLQVIESAMERDRYMSPMEAQEFGILDKVLVHPPQDGEDEPTLVQKEPVEAAPAAEPVPASTC1. Protein Language Modeling
1. Deep Mutational Scan
Esm2_t6_8M_UR50D (the shallowest one and using fewer parameters) model was used to generate an unsupervised deep mutational scan of ClpP protein based on language model likelihoods.
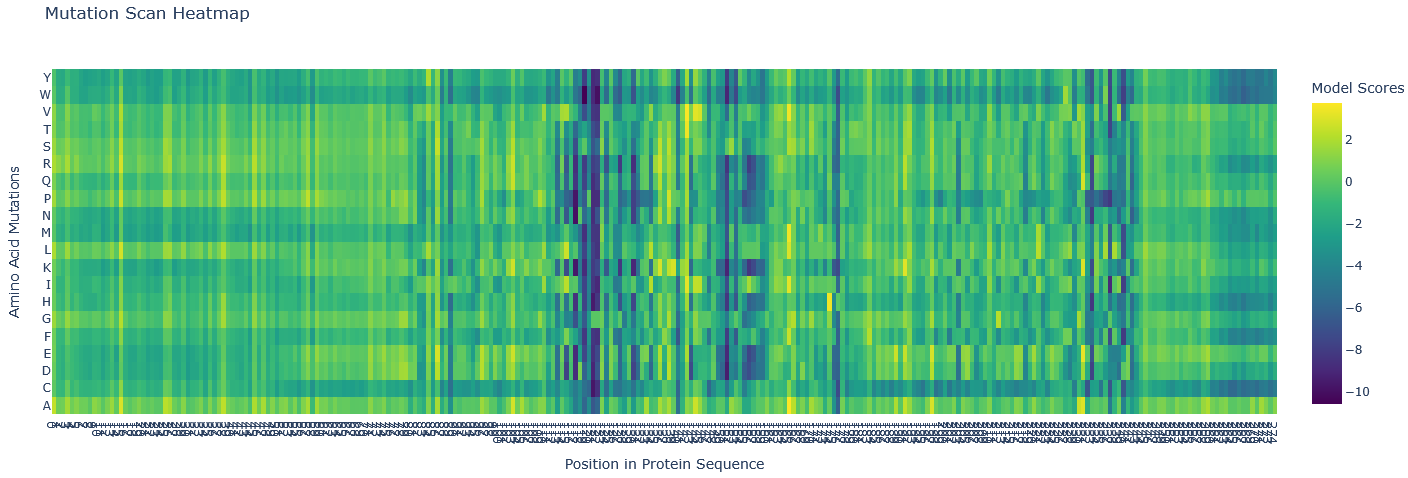
Most mutations are neutral (green/as likely as wildtype). There are several blue regions (121-122, 151,153, and 176) in which all mutations score highly unlikely, so these are structurally and functionally important, not likely to mutate, and these are probably part of active centres of the protease.
The mutation scan mapped the active site neighbourhood. The active sites mentioned in UniPort are TYR 153 and GLU 178. The sites with almost all aa unlikely are: HIS 122, TYR 153, PRO 176, ILE 121, ASN 151.
2. Latent Space Analysis
The provided sequence dataset was used to embed proteins in a reduced dimensionality space. To place ClpP into the resulting latent space map, its ESM2 embedding was first generated. Then, this new embedding was combined with the existing dataset’s embeddings, and the t-SNE algorithm on this combined set was re-run.
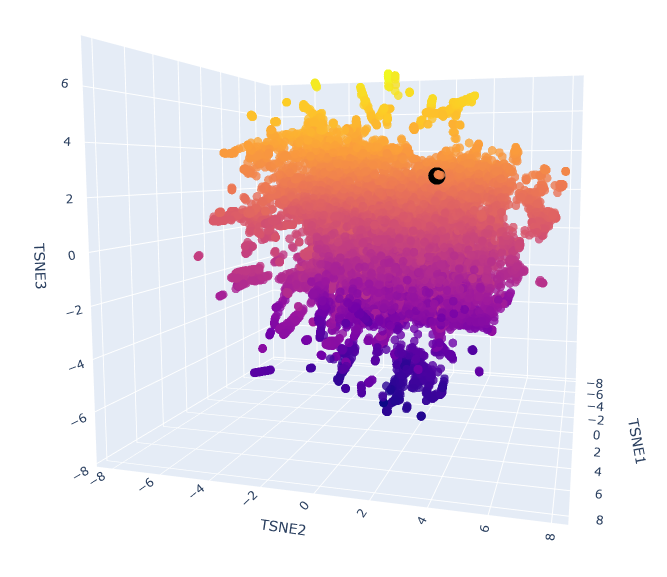 Esm2_t6_8M_UR50D latent space with embedded human ClpP Q16740 (black).
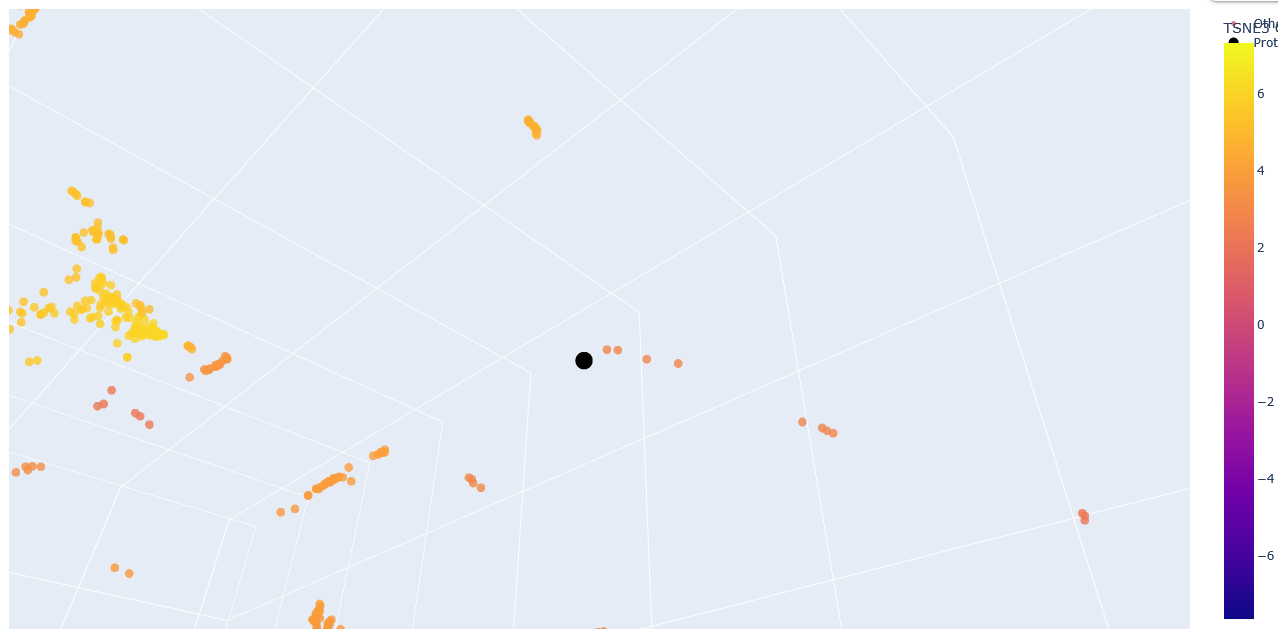 Zoom-in into the Esm2_t6_8M_UR50D latent space with embedded human ClpP Q16740 (black).
The neighbours are all ClpP homologs; therefore, the 6-layer model is correctly identifying sequence homology. Larger models like esm2_t33_650M or esm2_t36_3B are needed to capture more nuanced functional information.
C2. Protein Folding
Folding the original sequence
 ClpP folded with ESMFold.
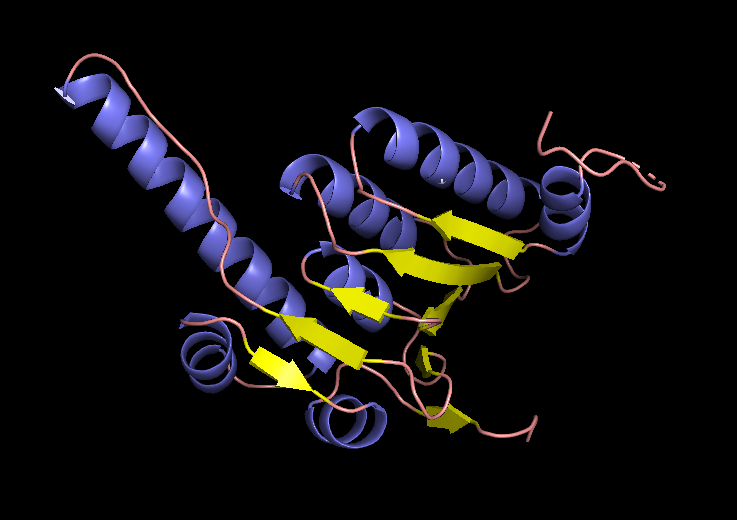 EM structure of the ClpP subunit visualized with Pymol (1TG6 | pdb_00001tg6).
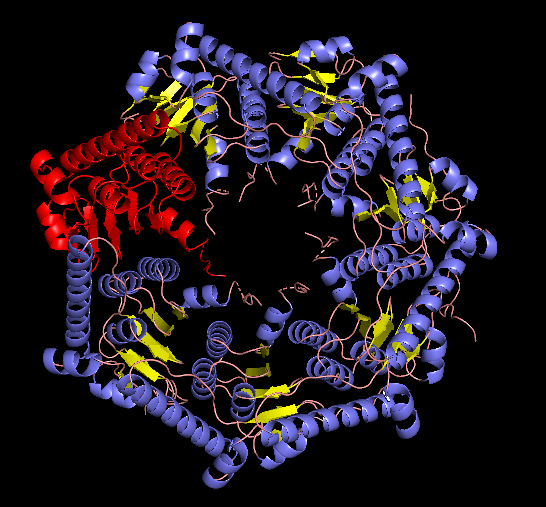 EM structure of the ClpP with the subunit highlighted, visualized with Pymol (1TG6 | pdb_00001tg6).
Resilience of the structure to changes in the original sequence
To test the resilience of the predicted fold, I changed 5 positions (121, 122, 151, 153, 176) that are highly unlikely to mutate to Tryptophane.
121 Ser (S)→ Trp (W)

122 Pro (P)→ Trp (W)

151 Ala (A)→ Trp (W)

153 Ser (S)→ Trp (W)

176 Met (M)→ Trp (W)
MWPGILVGGARVASCRYPALGPRLAAHFPAQRPPQRTLQNGLALQRCLHATATRALPLIPIVVEQTGRGERAYDIYSRLLRERIVCVMGPIDDSVASLVIAQLLFLQSESNKKPIHMYINSPGGVVTAGLAIYDTMQYILNPICTWCVGQAASMGSLLLAAGTPGMRHSLPNSRIMIHQPSGGARGQATDIAIQAEEIMKLKKQLYNIYAKHTKQSLQVIESAMERDRYMSPMEAQEFGILDKVLVHPPQDGEDEPTLVQKEPVEAAPAAEPVPASTMWPGILVGGARVASCRYPALGPRLAAHFPAQRPPQRTLQNGLALQRCLHATATRALPLIPIVVEQTGRGERAYDIYSRLLRERIVCVMGPIDDSVASLVIAQLLFLQSESNKKPIHMYINWWGGVVTAGLAIYDTMQYILNPICTWCVGQWAWMGSLLLAAGTPGMRHSLPNSRIWIHQPSGGARGQATDIAIQAEEIMKLKKQLYNIYAKHTKQSLQVIESAMERDRYMSPMEAQEFGILDKVLVHPPQDGEDEPTLVQKEPVEAAPAAEPVPAST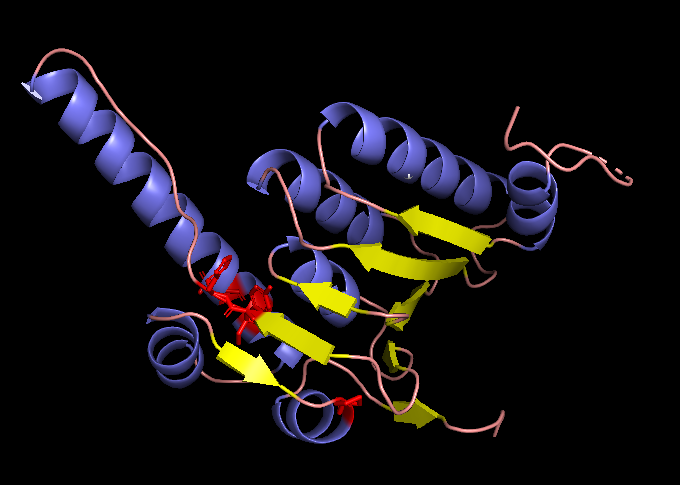 The changed residues (positions 121, 122, 151, 153, 176) highlighted in red within the original subunit structure visualized with PyMol.
The modified sequence was then folded with EMSFold.
 A fold of the modified ClpP sequence generated with ESMFold.
A fold of the original ClpP sequence generated with ESMFold.
C3. Protein Generation
As an input, I used the ClpP subunit isolated previously from (1TG6 | pdb_00001tg6):
EM structure of the ClpP subunit visualized with Pymol (1TG6 | pdb_00001tg6).
A sequence generated with inverse folding with ProteinMPNN
GAAPVLAXXXXXXXXXATLEEALLAQRVVLVRGPIDAALAAKVVAQLDALEAESPTAPITLLIDSPGGDYDAGLAILDRIRAIPNPVRTWAVGQAASMGALLLASGTPGLRFSTPDARIAIHKVSGTASGSPEELAEQKAALEAKNEELADLLSEYTGQSLETIKEAMKEVNYLTPEEAKEFGLLDHVLAEPPThe generated sequence (with the Xs changed to As) was then folded with EMS fold to compare with the fold predicted from the original sequence and with the published ClpP structure.
 A fold of the ProteinMPNN-generated ClpP sequence predicted by ESMFold.
ESMFold inference for a sequence with length 193. ptm: 0.861 plddt: 90.378.
A fold of the ProteinMPNN-generated ClpP sequence predicted by ESMFold.
ESMFold inference for a sequence with length 193. ptm: 0.861 plddt: 90.378.
The original ClpP subunit structure, Q16740.
A fold of the original ClpP sequence predicted with ESMFold.
Part D. Group Brainstorm on Bacteriophage Engineering
Our group (Abhishek Udawat, Tammy Sisodiya, Nour Abdelrahman, Nurlenden Rihan, and myself) focused on targeting increased stability as a goal for engineering the L Protein.
- Protein Language Models (ESM2) and the analysis of sequence alignment (BLAST/ ClustalOmega) will identify conserved and variable sites and therefore inform a mutagenesis strategy.
- Analyses of mutated sequences Alphafold-Multimer will reveal a change in pLDDT, ipTM, which may indicate higher stability of the tail.
Engineering Plan
- Review the guidelines.
- Isolate the soluble N-terminus and the middle part of the protein non-overlapping with the coat or the replicase sequence.
- Evaluate the mutational scan in ESM2 to identify candidate substitutions.
- Check BLAST results of sequence alignment (the layout of conserved and variable sites).
- Define a specific strategy (e.g., conservation, creating salt bridges to create a helix, etc.).
- Create several mutants.
- Compare AF-Multimer outputs.