Week 10 HW: Imaging and Measurement (Mass Spectrometry)
Waters Part I — Molecular Weight
Theoretical molecular weight Based on the 247 aa sequence (including the initiator methionine, linker, and His-tag), the calculated average molecular weight is 28006.60 Da. Chromophore maturation (an autocatalytic post-translational modification where residues T66-Y67-G68 undergo cyclization resulting in −18.02) Da and oxidation (resulting in −2.02 Da) contribute to a 20.04 Da mass loss. The corrected predicted mass would therefore be 27,986.56 Da.
Experimental molecular weight
- z for adjacent peaks: z = m/z(n+1) / (m/z(n) - m/z(n+1)). Two peaks were chosen, m/z(n+1)=875.4421 and m/z(n)=903.7148, therefore, z = 875.4421/(903.7148-875.4421) = 30.9642 ~ 31 charges the 28kDa eGFP protein carries. z(n) = 31; z(n+1) = 32.
- MW = z × (m/z(n) − 1.00728): MW = 31*(903.7148-1.00728)= 31*902.70752 = 27983.93312 Da
- Accuracy = |MWexp - MWtheor|/MWtheor: Accuracy = (27,983.93312 - 27,986.56)/ 27,986.56 = 93 ppm, which exceeds the 50 ppm mass error tolerance (referenced in Waters application note for another intact protein processed with Xevo™ G3 QT, https://www.waters.com/nextgen/us/en/library/application-notes/2024/lc-ms-analysis-of-intact-lysine-conjugated-adcs-using-the-acquity-premier-uplc-and-xevo-g3-qtof-mass-spectrometer.html), which means the measurement isn’t reliable.
Individual peaks cannot be resolved in the zoomed-in peak as the difference between those peaks is too low and cannot represent a charge. The zoomed-in peaks are isotope peaks within the charge state envelope.
(To calculate the theoretical MW, Expasy calculator https://web.expasy.org/compute_pi/ or Biopython can be used)
Waters Part II — Secondary/Tertiary structure
- The mass spectrum shifts toward lower m/z when a denatured protein is evaluated, and shifts toward higher m/z when a native protein is evaluated. In the case of denatured protein, charge envelopes become broader as many charge states are observed.
- The charge state of the peak at ~2800 ….
Waters Part III — Peptide Mapping - primary structure
Lysine (K) and Arginine (R) in the eGFP: 20 Lysines and 6 Arginines.
Theoretical digest produced 19 peptides (Expasy output):
Selected enzyme:Trypsin Maximum number of missed cleavages (MC): 0 Cysteines modifications: All cysteines in reduced form Methionines modifications: Methionines have not been oxidized. Mass of displayed peptides: > 500 Dalton Mass calculation: Using monoisotopic masses of the occurring amino acid residues and giving peptide masses as [M+H]+.
[Theoretical pI: 5.90 / Mw (average mass): 28006.60 / Mw (monoisotopic mass): 27988.96]
| count | mass | #MC | modifications | peptide sequence |
|---|---|---|---|---|
| 1 | 4472.1752 | 170-210 | 0 | HNIEDGSVQLADHYQQNTPI GDGPVLLPDNHYLSTQSALS K |
| 2 | 2566.2931 | 217-239 | 0 | DHMVLLEFVTAAGITLGMDE LYK |
| 3 | 2437.2608 | 170-210 | 0 | GEELFTGVVPILVELDGDVN GHK |
| 4 | 2378.2577 | 54-74 | 0 | LPVPWPTLVTTLTYGVQCFS R |
| 5 | 1973.9062 | 142-157 | 0 | LEYNYNSHNVYIMADK |
| 6 | 1503.6597 | 28-42 | 0 | FSVSGEGEGDATYGK |
| 7 | 1266.5783 | 87-97 | 0 | SAMPEGYVQER |
| 8 | 1083.4979 | 240-247 | 0 | LEHHHHHH |
| 9 | 1050.5214 | 115-123 | 0 | FEGDTLVNR |
| 10 | 982.4952 | 133-141 | 0 | EDGNILGHK |
| 11 | 821.3940 | 81-86 | 0 | QHDFFK |
| 12 | 790.3552 | 75-80 | 0 | YPDHMK |
| 13 | 769.3913 | 47-53 | 0 | FICTTGK |
| 14 | 711.2944 | 103-108 | 0 | DGNYK |
| 15 | 655.3813 | 98-102 | 0 | TIFFK |
| 16 | 602.2780 | 211-215 | 0 | DPNEK |
| 17 | 579.3137 | 128-132 | 0 | GIDFK |
| 18 | 507.2925 | 164-167 | 0 | VNFK |
| 19 | 502.3235 | 124-127 | 0 | IELK |
90.7% of sequence covered ():

        10         20         30         40         50         60
mvskGEELFT GVVPILVELD GDVNGHKFSV SGEGEGDATY GKltlkFICT TGKLPVPWPT

        70         80         90        100        110        120
LVTTLTYGVQ CFSRYPDHMK QHDFFKSAMP EGYVQERTIF FKDDGNYKtr aevkFEGDTL

       130        140        150        160        170        180
VNRIELKGID FKEDGNILGH KLEYNYNSHN VYIMADKqkn gikVNFKirH NIEDGSVQLA

       190        200        210        220        230        240
DHYQQNTPIG DGPVLLPDNH YLSTQSALSK DPNEKrDHMV LLEFVTAAGI TLGMDELYKL


EHHHHHH
If peaks of >10% abundance are considered, ~ 19 peaks can be counted, about the same number as the peptides:
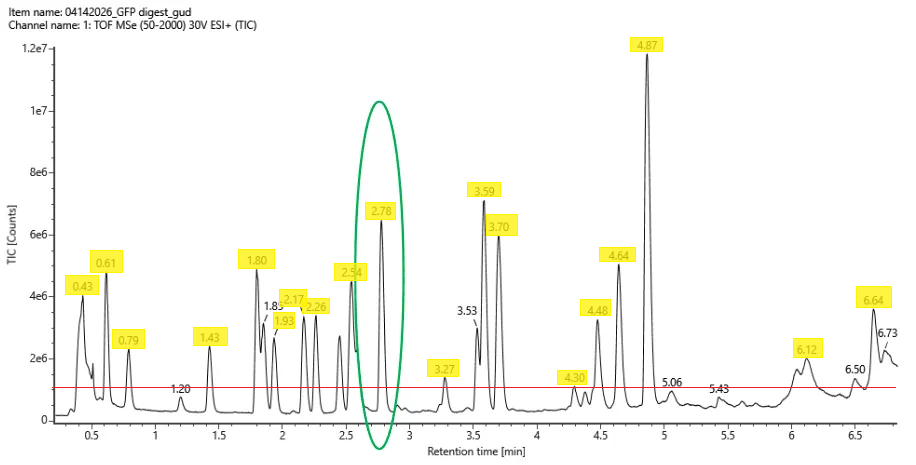 Chromotogram with peaks that are >10% relative abundance highlighted. Red line marks the 10% cutoff.
The mass-to-charge (m/z) of the peptide shown in Figure 5b.
The isotope spacing is= 1/z; the peaks are spaced ~0.5 m/z apart (525.76712, 526.25918), therefore z = +2.
The mass of the singly charged form of the peptide ([M+H]+) based on m/z=525.76712 and z=2: M neutral =(m/z x z)-(z x 1.0073)= 525.76712 x 2 – 2 x 1.0073 = 1,051.53424 - 2.0146 = 1,049.51964 m/z, the singly charged form [M+H]⁺= = M+1.0073 = 1,049.51964 + 1.0073 = 1,050.52694 Da
- Identification of the peptide
The peptide is FEGDTLVNR, with the mass of 1050.5214 Da.
Accuracy = |MWexp - MWtheor|/MWtheor: Accuracy = (1,050.52694 – 1050.5214)/ 1050.5214 = 5.27ppm, which is within the 10 ppm mass error tolerance for peptide evaluation.
- The percentage of the sequence that is confirmed by peptide mapping is 88% (see Figure 6).
Bonus Peptide Map Questions
The Fragment Ion Calculator tool http://db.systemsbiology.net/proteomicsToolkit/FragIonServlet.html provided the following results:
Sequence: FEGDTLVNR, pI: 4.37029
| Mass - Mono | Mass - Average | |
|---|---|---|
| (M) | 1049.51422 | 1050.13629 |
| (M+H)+ | 1050.52149 | 1051.14356 |
| (M+2H)2+ | 525.76441 | 526.07544 |
| (M+3H)3+ | 350.84538 | 351.05273 |
| (M+4H)4+ | 263.38586 | 263.54138 |
| Seq | # | B | Y | # (+1) |
|---|---|---|---|---|
| F | 1 | 148.07574 | 1050.52149 | 9 |
| E | 2 | 277.11833 | 903.45308 | 8 |
| G | 3 | 334.13979 | 774.41049 | 7 |
| D | 4 | 449.16673 | 717.38902 | 6 |
| T | 5 | 550.21441 | 602.36208 | 5 |
| L | 6 | 663.29848 | 501.31440 | 4 |
| V | 7 | 762.36689 | 388.23034 | 3 |
| N | 8 | 876.40982 | 289.16192 | 2 |
| R | 9 | 1032.51093 | 175.11900 | 1 |
Based on the ion masses, 7 y ions can be identified in the spectrum:
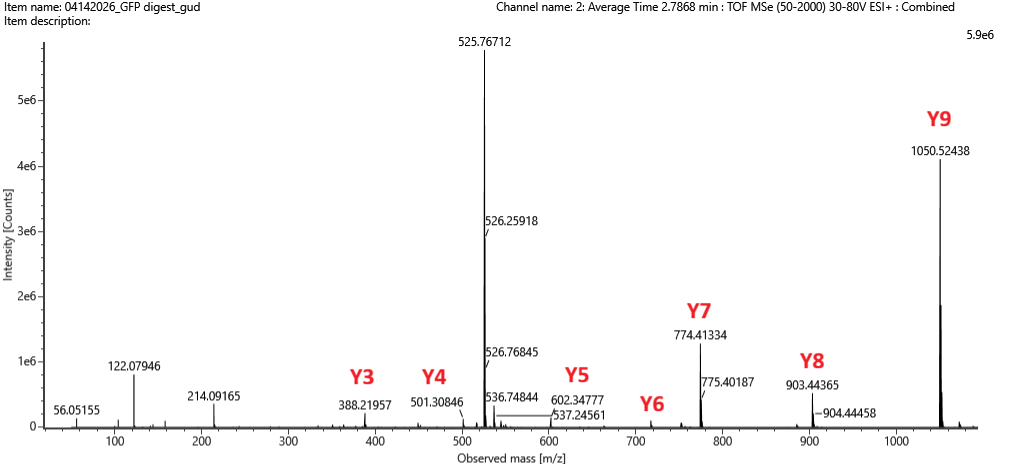 Figure 5c. Fragmentation spectrum of the peptide eluting at retention time 2.78 minutes in Figure 5a.
No b ions were identified on the spectrum. Claude explains why:
- b and y ions are not produced equally — the chemistry of fragmentation strongly favors one series over the other depending on the peptide
- Arginine (R) at the C-terminus — your peptide ends in R, which is highly basic and strongly attracts the charge. This means the C-terminal fragments (y-ions) tend to retain the charge and be detected, while the complementary b-ions lose the charge and become invisible. This is actually a well-known rule: tryptic peptides ending in R or K almost always show dominant y-ion series with weak or absent b-ions
Several peaks do not match with any b or y ions.
Claude explains what these peaks might refer to:
536.74844 and 525.76712 - these are spaced ~11 m/z apart and are in the 500s range, which strongly suggests these are doubly charged ions (z=+2) of larger fragments or possibly the precursor isotope peaks.
214.09165 - The most likely explanation is an internal fragment ion. These form when two bond breaks happen in the same fragmentation event, releasing a small piece from the middle of the peptide. They are named by the residues they contain. T + L = 101.05 + 113.08 = 214.13 (very close ✅)
86.09155, 122.08946 - immonium ions, which are small diagnostic ions produced as side products of fragmentation. They are specific to individual amino acids. 86.09155 — immonium ion of Leucine (L), which is indeed in the sequence. 122.08946 — immonium ion of Phenylalanine (F), the first residue in the sequence.
The y ions found in the fragmentation spectrum are consistent with the predicted sequence (FEGDTLVNR). Figure 6 depicting the % of aa coverage of peptides positively identified using their calculated mass and fragmentation, confirms that the sequence of this peptide (FEGDTLVNR) matched.
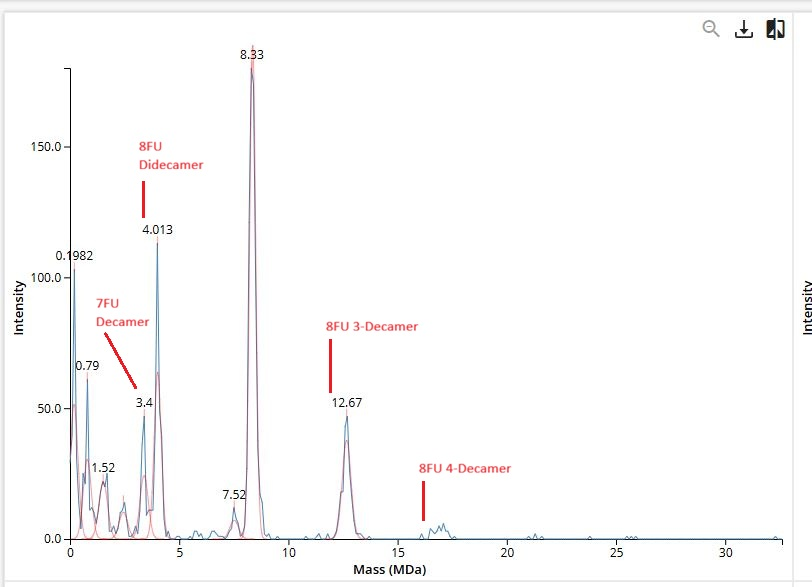
Waters Part IV — Oligomers