Week 10 HW: Imagin and Measurement
Waters Part I — Molecular Weight
We will analyze an eGFP standard on a Waters Xevo G3 QTof MS system to determine the molecular weight of intact eGFP and observe its charge state distribution in the native and denatured (unfolded) states. The conditions for LC-MS analysis of intact protein cause it to unfold and be detected in its denatured form (due to the solvents and pH used for analysis).
1. Based on the predicted amino acid sequence of eGFP (see below) and any known modifications, what is the calculated molecular weight? You can use an online calculator like the one at https://web.expasy.org/compute_pi/
- Using the link, the result obtained was:
- Theoretical pI/Mw of eGFP: 5.90 / 28006.60
2. Calculate the molecular weight of the eGFP using the adjacent charge state approach described in the recitation. Select two charge states from the intact LC-MS data (Figure 1) and:
- Determine z for each adjacent pair of peaks (n,n+1) using:
z = m / zn+1 m / zn - m / zn+1
For this part, I chose this adjacent pair of peaks:
- n= 1037.4423
- n+1= 1000.4302
The formula would be:
z = 1000.4302 1037.4423 - 1000.4302
z = 1000.4302 37.0121
z = 27.0298
z = ≈27 kDa
Determine the MW of the protein using the relationship between m/zn, MW, z:
For this part, I will use the equation given in the presentation to determine MW. First I will determine n, to then determine MW
- n
n = m / zn+1 - 1 m / zn - m / zn+1
n = 1000.4302 - 1 10037.4423 - 1000.4302
n = 999.4302 37.0121
n = 27
- MW
MW = (n * m / zn+1) - n
MW = (27 * 1037.4423) - 27
MW = 28010.9421 - 27
MW = 27983.9421
MW = ≈27984 Da
- When we compare results between Theoretical MW (28006.60) and Experimental MW (27984) we recognize a slight varietion, meening that the achieved results are very precise and coherent between them. The final result of MW will be, as mentioned before, 27984 Da.
- Calculate the accuracy of the measurement using the deconvoluted MW from 2.2 and the predicted weight of the protein from 2.1 using:
Accuracy = (MW experiment - MW theory) MW theory
Accuracy = 27984 - 28006.60 28006.60
Accuracy = -22.6 28006.60
Accuracy = -8.07 * 10-4
Accuracy = ≈-0.0807%
- The final Accuracy number -0.0807% shows that the difference between the MW Experimental and MW Theoretical is slightly different by a minimal percentage. This shows a high accuracy in charge-state assignment and peak selection.
Can you observe the charge state for the zoomed-in peak in the mass spectrum for the intact eGFP? If yes, what is it? If no, why not?
Yes, it can be observed, and also it is shown that there are other peaks inside the peaks. This is because the protein is charged with multiple protons, creating a charge-state envelope (like a membrane that changes constantly). When we zoom in, we can see the isotopical peaks.
Waters Part II — Secondary/Tertiary structure
We will analyze eGFP in its native, folded state and compare it to its denatured, unfolded state on a quadrupole time-of-flight MS. We will be doing MS-only analysis (no liquid chromatography, also known as “direct infusion” experiments) on the Waters Xevo G3-QToF MS.
1. Based on learnings in the lab, please explain the difference between native and denatured protein conformations. For example, what happens when a protein unfolds? How is that determined with a mass spectrometer? What changes do you see in the mass spectrum between the native and denatured protein analyses (Figure 2)?
The main difference between native and denatured protein conformation is that native proteins are those that are in their natural, functional 3D conformation, specifically conformed into secondary, tertiary, and quaternary structures. While, on the other hand, denatured proteins are those that have lost their 3D structure, unfolding into random inactive polypeptide chains due to stress ( heat, pH, chemicals). Although they retain their primary amino acid sequence.
- Charge states:
- Native: because of the compact structure, it hides the charge sites, showing fewer peaks with lower charge-states (higher value of m/zn)
- Denatured: because of the loss of the 3D structure, protonized sites are exposed, therefore the result is a distribution of multiply and higher charges (lower value of m/zn).
- Quaternary conservation complex
- Native: the native mass spectrometer allows for observing the complex in its structure because the non-covalent interactions (hydrogen bridges, hydrofobic interactions) are kept intact.
- Denatured: it dissociates into individual subunits, or it is observed as a fully unfolded polypeptide chain.
- Presence in additions (ligands/salt)
- Native: it shows a peak corresponding to the protein linked to small ligands, metals, or subunits, which confirms a functional state.
- Denatured: ligands are lost due to the denaturalized state.
- Solven conditions
- Native: Native MS uses neutral pH (6.5-7.5) and aqueous buffer.
- Denatured: Denaturing MS uses acidic conditions (for example: TFA, Formic acid) and organic solvents (for example: Acetonitrile)
In the Figure shown (Figure 2), the charge states clearly show how the native protein has very specific peaks; therefore, it is more compact, while the denatured protein shows a broad presence of peaks in all its analyses, therefore, it evidences the presence of an unfolded structure exposing its protonized sites. Also, charges in the denatured protein are a lot higher and consecutive than in the native protein.
2. Zooming into the native mass spectrum of eGFP from the Waters Xevo G3 QTof MS (see Figure 3), can you discern the charge state of the peak at ~2800 m/z? What is the charge state? How can you tell?
To determine the charge state, we should use adjacent peaks, such as:
- m1: 2544.8552
- m2: 2544.7637
The formula we will use is:
z = m2 - 1 m1 - m2
z = 2544.7637 - 1 2544.8552 - 2544.7637
z = 2543.7637 0.0915
z = 27800.7
Waters Part III — Peptide Mapping - primary structure
We will digest the eGFP protein standard into peptides using trypsin (an enzyme that selectively cleaves the peptide bond after Lysine (K) and Arginine (R) residues. The resulting peptides will be analyzed on the Waters BioAccord LC-MS to measure their molecular weights and fragmented to confirm the amino acid sequence within each peptide – generating a “peptide map”. This process is used to confirm the primary structure of the protein.
There are a variety of tools available online to calculate protein molecular weight and predict a list of peptides generated from a tryptic digest. We will be using tools within the online resource Expasy (the bioinformatics resource portal of the Swiss Institute of Bioinformatics (SIB)) to predict a list of tryptic peptides from eGFP.
1. How many Lysines (K) and Arginines (R) are in eGFP? Please circle or highlight them in the eGFP sequence given in Waters Part I question 1 above. (Note: adding the sequence to Benchling as an amino acid file and clicking biochemical properties tab will show you a count for each amino acid).
In the sequence, we can identify:
- Lysines (K): 19
- Arginines (R): 6
2. How many peptides will be generated from tryptic digestion of eGFP?
- Navigate to https://web.expasy.org/peptide_mass/
- Copy/paste the sequence above into the input box in the PeptideMass tool to generate expected list of peptides.
- Use Figure 4 below as a guide for the relevant parameters to predict peptides from eGFP.
- Click “Perform the Cleavage” button in the PeptideMass tool and report the number of peptides generated when using trypsin to perform the digest.
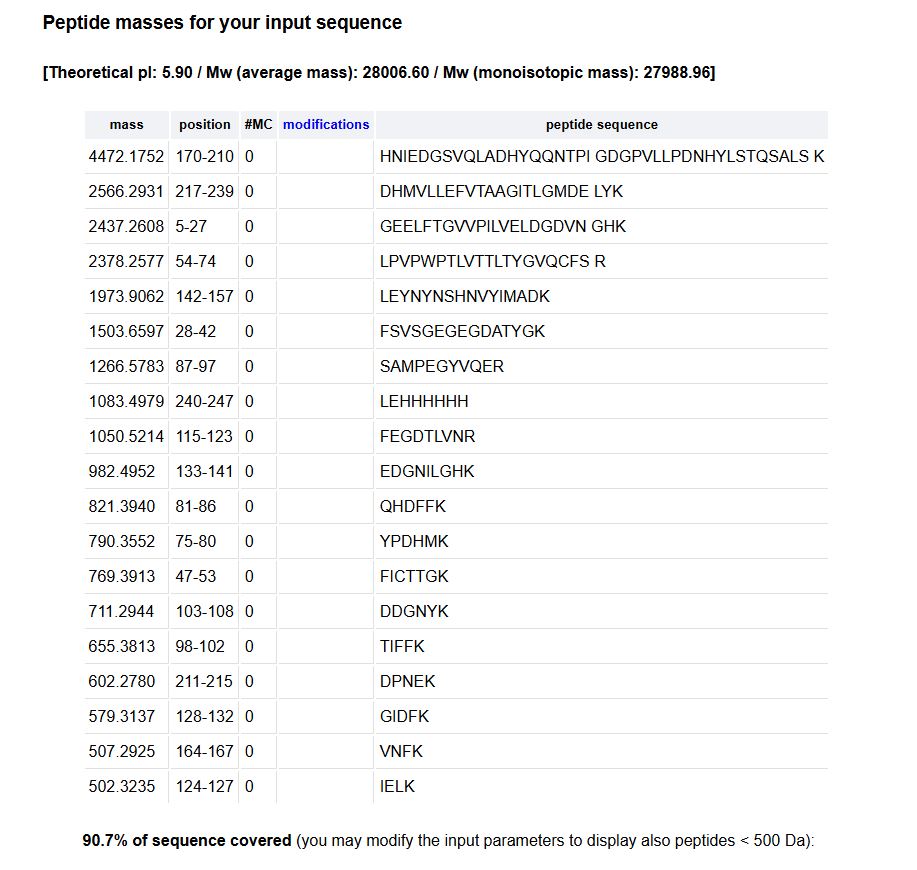
When the cleavage is performed, the number of peptides is: 19
3. Based on the LC-MS data for the Peptide Map data generated in lab (please use Figure 5a as a reference) how many chromatographic peaks do you see in the eGFP peptide map between 0.5 and 6 minutes? You may count all peaks that are >10% relative abundance.
According to the map data, the number of peaks clearly identified and that are >10% relative abundance, is 17:
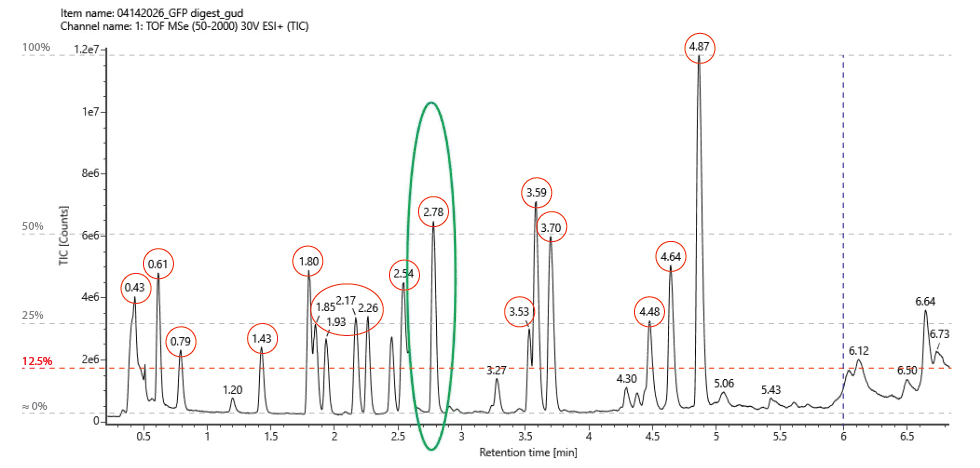
4. Assuming all the peaks are peptides, does the number of peaks match the number of peptides predicted from question 2 above? Are there more peaks in the chromatogram or fewer?
- Predicted peptides: 19
- Chromatogram peaks: 17
If we assume that the peaks in the chromatogram are peptides, then we would have fewer than the predicted number in theory.
5. Identify the mass-to-charge (m/z) of the peptide shown in Figure 5b. What is the charge (z) of the most abundant charge state of the peptide (use the separation of the isotopes to determine the charge state)? Calculate the mass of the singly charged form of the peptide ([M+H]+) based on its m/z and z.
- m/z1 = 525.76712
- m/z2 = 526.25918
To identified the z charge we will first have to know the variation between m/z1 and m/z2 for that we will use this formula:
Δm/z = m/z2 - m/z1
Δm/z = 526.25918 - 525.76712
Δm/z ≈ 0.49
After that, we will use the formula above to identified the z charge:
1/z = Δm/z
1/z ≈ 0.49
z ≈ 1 / 0.49
z ≈ 2
For the next part, we will use the formula:
MW = (n x m/z n) - n
MW = (2 x 525.76712) - 2
MW = (2 x 525.76712) - 2
MW = 1051.53424 - 2
MW = ≈1049.52
We now have M, and we already know H (1.007):
(M + H)+ = 1049.52 + 1.007
(M + H)+ = 1050.52
By calculating z from the isotop spacing, we can know that the peptide has a z charge of 2+ at m/z= 525.76. On the other hand, the single correspond ion was at m/z= 1050.52. These values confirm that both signals correspond to the same peptide detected in different stages. And this occurs because peptides can have different numbers of protons during electrospray ionization, depending on the presence of protonable amino acids.
6. Identify the peptide based on comparison to expected masses in the PeptideMass tool. What is mass accuracy of measurement? Please calculate the error in ppm. Recall that Accuracy = (MW experiment - MW theory)MW theory
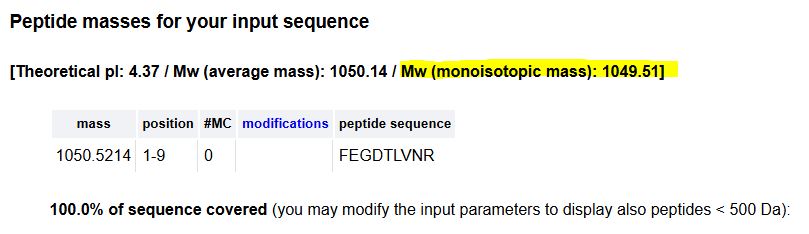
- MW theory = 1049.51
- MW experiment = 1049.52
Accuracy = (MW experiment - MW theory) MW theory
Accuracy = (1049.52 - 1049.51) 1049.51
Accuracy = 0.01 1049.51
Accuracy = 9.52e-6 x 10⁶
Accuracy ≈ 9.5 ppm
7. What is the percentage of the sequence that is confirmed by peptide mapping? (see Figure 6)
The percentage of the sequence confirmed by the pepitde mapping is 88%
Waters Part IV — Oligomers
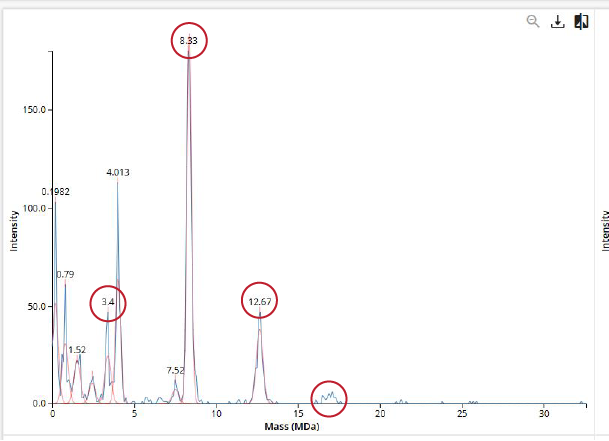
We will determine Keyhole Limpet Hemocyanin (KLH)’s oligomeric states using charge detection mass spectrometry (CDMS). CDMS single-particle measurements of KLH allow us to make direct mass measurements to determine what oligomeric states (that is, how many protein subunits combine) are present in solution. Using the known masses of the polypeptide subunits (Table 1) for KLH, identify where the following oligomeric species are on the spectrum shown below from the CDMS (Figure 7):
- 7FU Decamer - 8FU Didecamer - 8FU 3-Decamer - 8FU 4-Decamer
| Polypeptide Subunit Name | Subunit Mass |
|---|---|
| 7FU Decamer | 340 kDa |
| 8FU Didecamer | 400 kDa |
To calculate the Subunit masses, we have to understand:
- Decamer = 10 subunits
- FU = protein subunits of KLH
| Polypeptide Subunit Name | Decamer × Subunit Mass | Total Subunit Mass |
|---|---|---|
| 7FU Decamer | 10 × 340 kDa | 3.4 MDa |
| 8FU Didecamer | 20 × 400 kDa | 8.0 MDa |
| 8FU 3-Decamer | 30 × 400 kDa | 12.0 MDa |
| 8FU 4-Decamer | 40 × 400 kDa | 16.0 MDa |