Week 10 HW: Advanced Imaging & Measurement Technology
Homework: Final Project
1. Which aspect(s) of your project will you measure?
The main goal is to measure how well my custom DNA construct actually stays stuck to the 3D-printed scaffold. I also need to measure the bioactivity of the produced protein — essentially checking if it actually triggers bone-growing signals like it’s supposed to. Finally, I’ll be measuring the retention time, which tells me how much longer my “anchored” version stays on the scaffold compared to a standard version that usually just washes away.
2. Which elements will you measure and how?
- DNA Adsorption — I’ll measure how much DNA the scaffold can actually “soak up” and hold onto over time.
- Protein Expression — Instead of using live animals right away, I’ll use a cell-free protein synthesis system to see if the DNA I designed successfully produces the chimeric peptide.
- Osteogenic Bioactivity — To prove this grows bone, I’ll use an alkaline phosphatase assay, a classic lab test to see if bone-building cells are being activated.
3. What technologies will you use?
- Benchling & DNA Synthesis — I’ll start by designing the DNA “blueprint” in Benchling and ordering the physical gene block from Twist Bioscience.
- PCR & Gel Electrophoresis — To confirm the DNA was manufactured correctly and is the right size, I’ll amplify it with PCR and run it on an agarose gel to visualize the bands.
- Ceramic 3D Printing — I’ll use specialized ceramic printing to create calcium phosphate scaffolds that mimic the structure of real human bone.
- Opentrons OT-2 — To keep things precise and automated, I’ll write a Python script for this liquid-handling robot to load the DNA onto the scaffolds automatically.
Homework: Waters Part I — Molecular Weight
1. Calculated molecular weight of eGFP from the sequence
Using the Expasy Compute pI/Mw tool (web.expasy.org/compute_pi) on the provided eGFP sequence (including the LE linker and the HHHHHH His-tag):
Theoretical MW: 28,006.60 Da
2. MW from the adjacent charge state approach
Protein molecules in the mass spec pick up extra protons. I can use the spacing between two adjacent peaks to work out the charge state, and from that the intact mass.
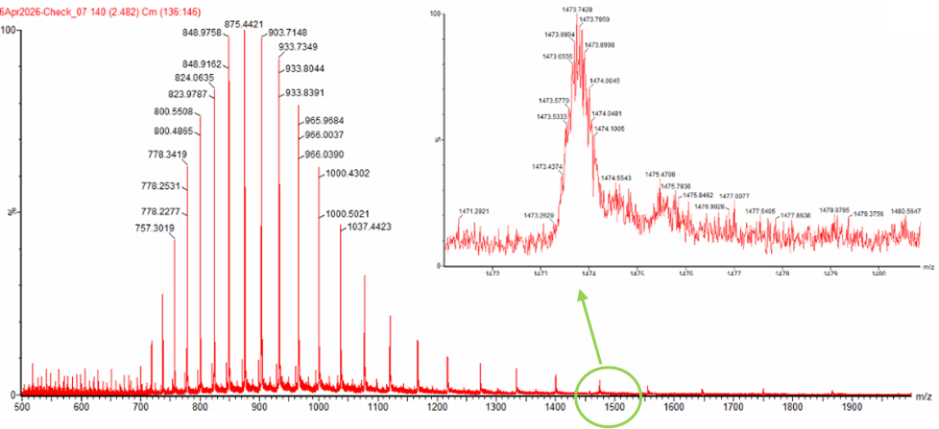
Figure 1. Mass Spectrum of intact eGFP protein from the Waters Xevo G3 LC-MS (30,000 resolution), with individual charge state peaks labeled with $m/z$ values.
Selected peaks: $m_1 = 903.71$ and $m_2 = 875.44$.
Step 2.1 — Determine the charge $z$:
$$z = \frac{m_2 - 1.008}{m_1 - m_2} = \frac{875.44 - 1.008}{903.71 - 875.44} \approx \mathbf{31}$$
Step 2.2 — Determine MW:
$$MW = z \times (m_1 - 1.008) = 31 \times (903.71 - 1.008) \approx \mathbf{27{,}983.76\ \text{Da}}$$
Step 2.3 — Mass error (ppm):
$$\text{Error} = \frac{27{,}983.76 - 28{,}006.60}{28{,}006.60} \times 10^{6} \approx \mathbf{-815\ \text{ppm}}$$
3. Can you observe the charge state for the zoomed-in peak?
No. At such a high charge state (+31), the isotope spacing is only $1/31 \approx 0.03$ $m/z$. The instrument can’t cleanly resolve peaks that close together, so the isotopes blend into a single smooth envelope instead of appearing as individual lines.
Homework: Waters Part III — Peptide Mapping (Primary Structure)
1. How many Lysines (K) and Arginines (R) are in eGFP?
Counting the tryptic cleavage sites in the sequence:
| Residue | Count |
|---|---|
| Lysine (K) | 20 |
| Arginine (R) | 6 |
| Total cleavage sites | 26 |
2. How many peptides from tryptic digestion?
Trypsin acts like molecular scissors cutting after every K and R. 26 cut sites → 27 peptides.
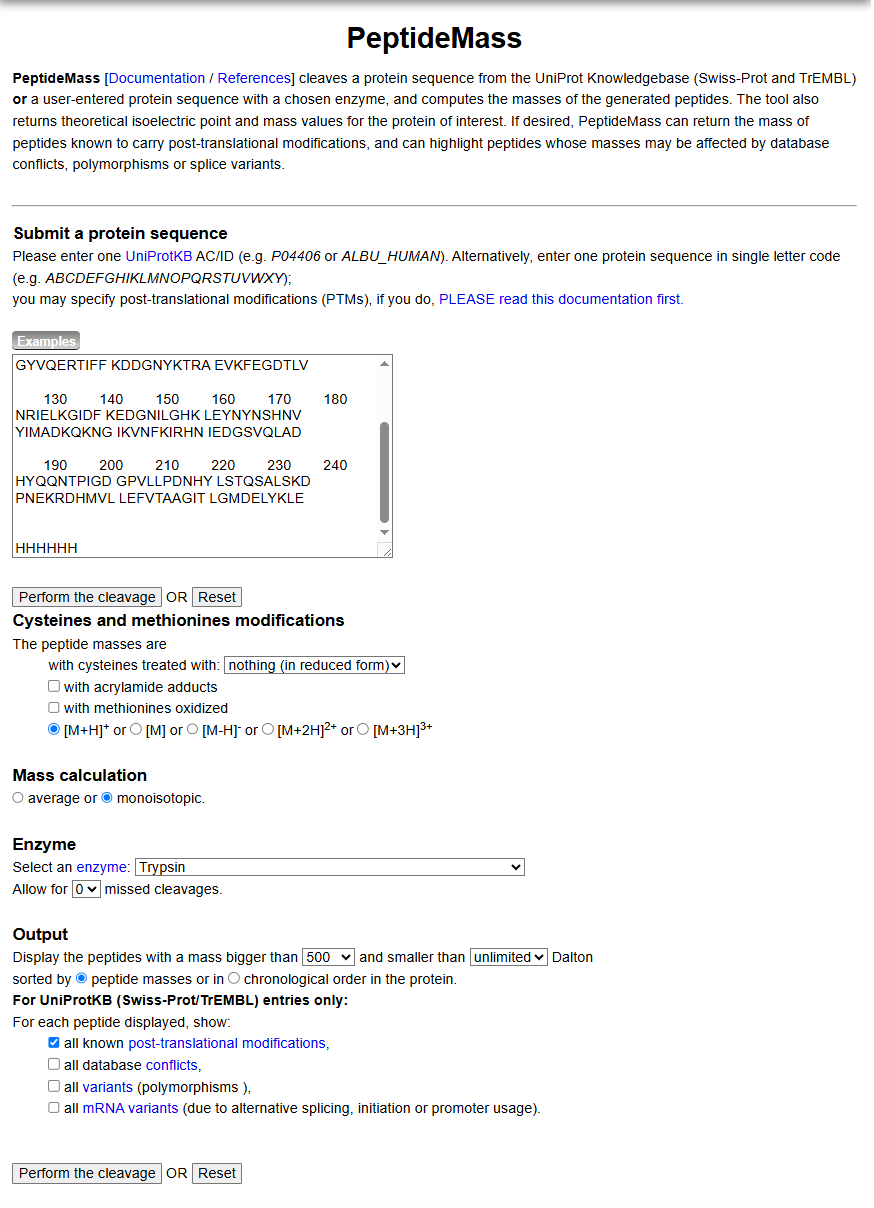
Figure 4. Example conditions for predicting the number of tryptic peptides from the eGFP standard in the Expasy PeptideMass tool.
3. How many chromatographic peaks in Figure 5a (>10% abundance)?
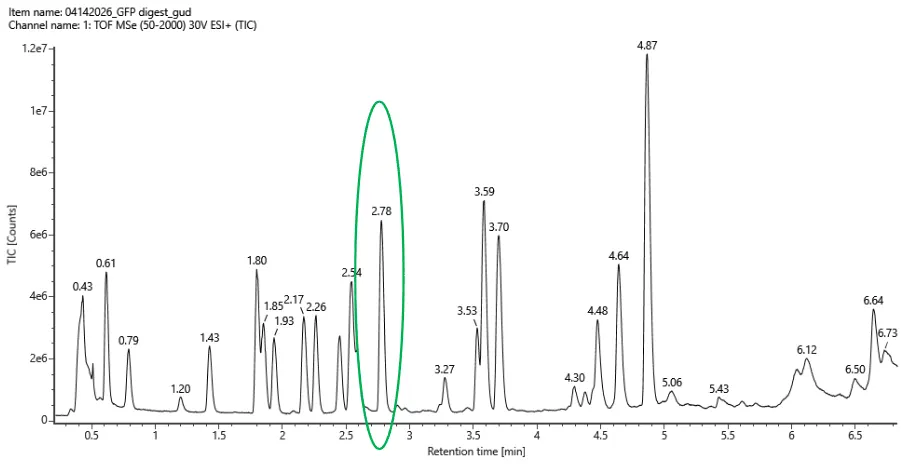
Figure 5a. Total ion chromatogram (TIC) of the eGFP peptide map. The peak at 2.78 min is circled; its MS data appears in Figure 5b.
Counting peaks that stand clearly above baseline between 0.5–6 min: 21 peaks.
4. Does the number of peaks match the prediction?
No — I predicted 27 but only count 21. This usually happens because:
- some peptides are so small they elute in the void volume (too fast to be separated),
- some peptides co-elute (very close in hydrophobicity, so they come off the column at the same time),
- and some may be below the 10% abundance threshold.
5. $m/z$ and charge of the peptide in Figure 5b
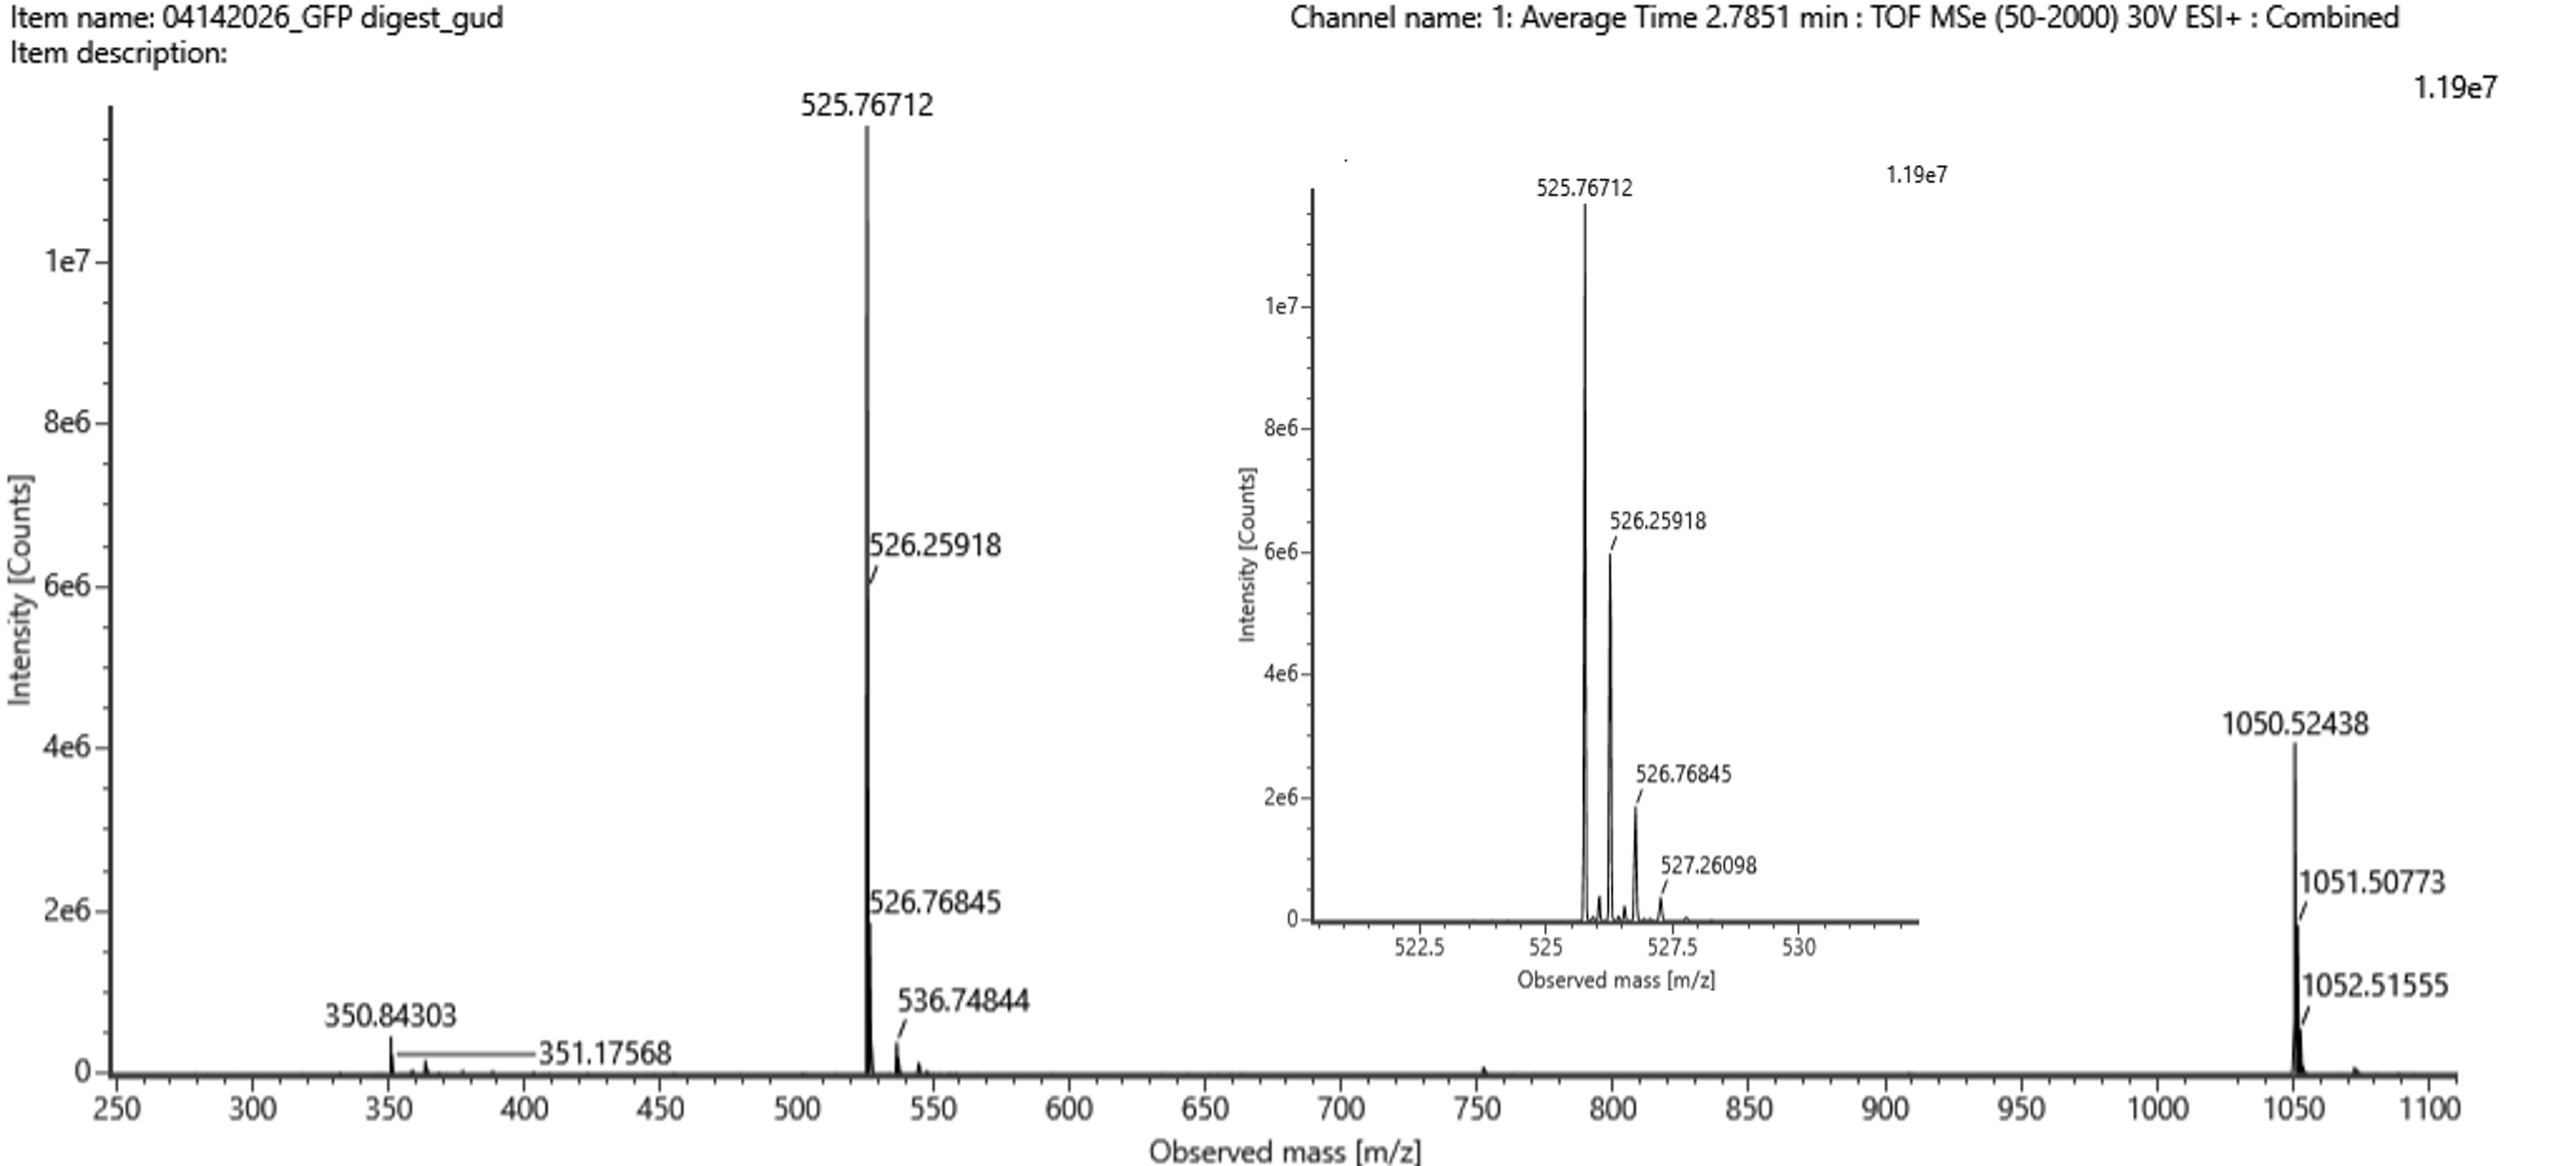
Figure 5b. Mass spectrum for the 2.78-min peak; inset zooms into $m/z$ 525.76 to show the isotopes.
- Peak: $m/z = 525.76$
- Charge — the isotope spacing is $\approx 0.5$, so $z = 1 / 0.5 = \mathbf{+2}$
- Singly-charged mass:
$$[M+H]^+ = (525.76 \times 2) - 1.008 \approx \mathbf{1050.51\ \text{Da}}$$
6. Peptide identity and mass accuracy
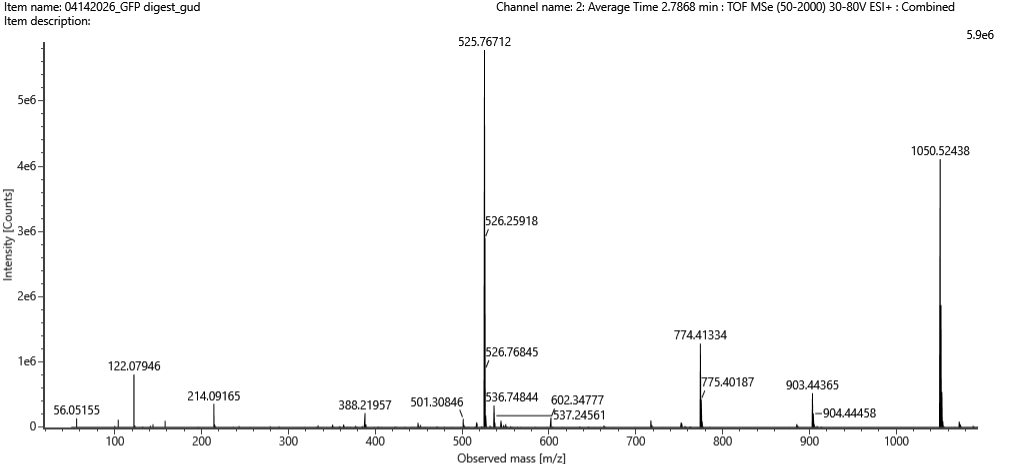
Figure 5c. Fragmentation spectrum of the peptide eluting at 2.78 min.
This matches the predicted tryptic peptide FEGDTLVNR.
$$\text{Error (ppm)} = \frac{|1050.526 - 1050.521|}{1050.521} \times 10^{6} \approx \mathbf{4.7\ \text{ppm}}$$
A sub-5-ppm error is well within the spec of a high-resolution LC-MS, so the match is confident.
7. Percentage of sequence confirmed
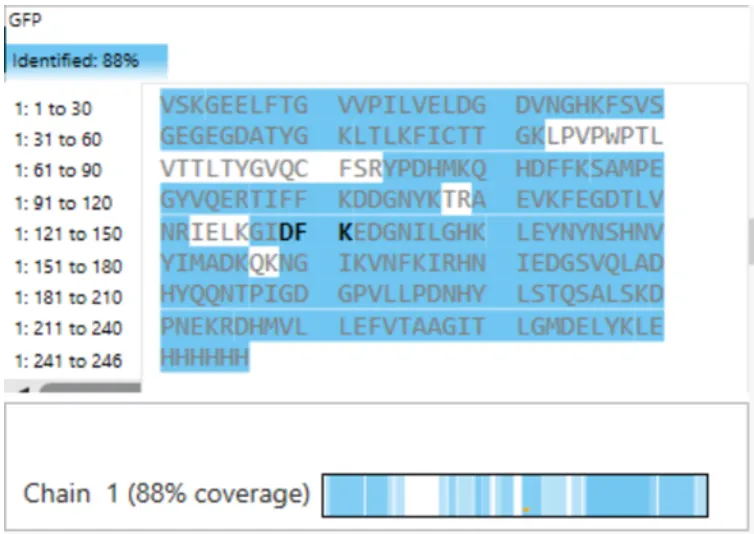
Figure 6. Amino acid coverage map of eGFP from the BioAccord LC-MS peptide identification data.
From the coverage map: 88% of the eGFP sequence was identified by peptide mapping.
Homework: Waters Part IV — Oligomers
Using the known subunit masses (7FU = 340 kDa, 8FU = 400 kDa), I identified the following oligomeric states on the CDMS spectrum:
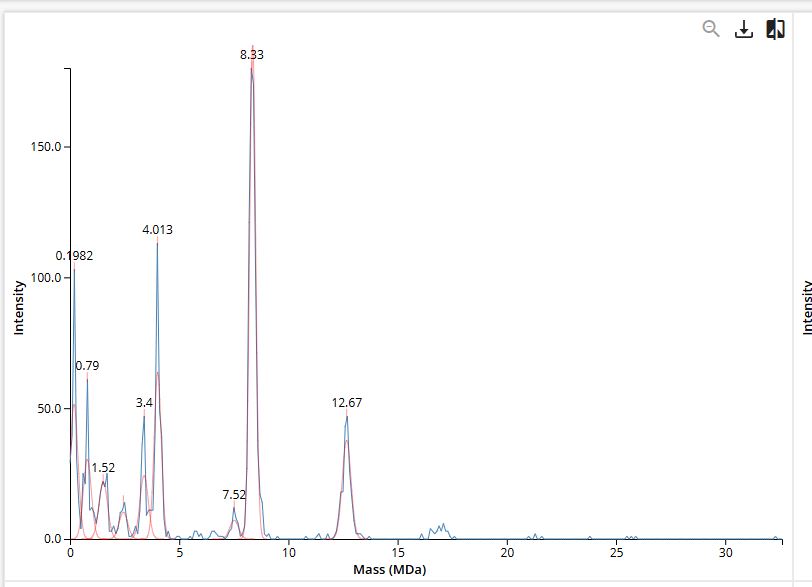
Figure 7. Mass spectrum of Keyhole Limpet Hemocyanin (KLH) acquired on the CDMS.
| Oligomer | Subunits | Calculation | Peak on spectrum |
|---|---|---|---|
| 7FU Decamer | 10 × 340 kDa | 3.4 MDa | ~3.4 M Da |
| 8FU Decamer | 10 × 400 kDa | 4.0 MDa | ~4.0 M Da |
| 8FU Didecamer | 20 × 400 kDa | 8.0 MDa | ~8.0 M Da |
| 8FU 3-Decamer | 30 × 400 kDa | 12.0 MDa | ~12.0 M Da |
Homework: Waters Part V — Did I make GFP?
Final summary of the intact LC-MS measurement against theoretical values:
| Measurement | Theoretical | Measured | Result |
|---|---|---|---|
| Intact Protein Weight | 28.006 kDa | 27.983 kDa | ✅ Match (~815 ppm) |
| Sequence Coverage | 100% | 88% | ✅ High confidence |
| Peptide Mass $[M+H]^+$ | 1050.521 Da | 1050.526 Da | ✅ Very accurate (~4.7 ppm) |
Conclusion: the intact mass, the peptide-map coverage, and the MS/MS identification of FEGDTLVNR all agree with the expected eGFP standard — so yes, the protein is eGFP.