Week 6 — Genetic Circuits Part I: Assembly Technologies
Assignment: DNA Assembly
Question 1 — Components of the Phusion High-Fidelity PCR Master Mix and Their Purpose
The Phusion HF PCR Master Mix is a pre-formulated 2X concentrate containing all enzymatic and chemical components needed for PCR. Only template, primers, and nuclease-free water need to be added by the researcher. Its key components are:
Phusion DNA Polymerase is the core enzyme — a novel Pyrococcus-like polymerase fused to a processivity-enhancing domain. It possesses both 5’→3’ polymerase activity for DNA synthesis and 3’→5’ exonuclease activity for proofreading, which corrects misincorporated bases in real time. This gives Phusion an error rate more than 50-fold lower than Taq polymerase. This fidelity is essential in this lab because precise single-codon mutations are being introduced into the amilCP chromophore region — any additional errors would produce non-functional or incorrectly coloured variants.
dNTPs (deoxynucleotide triphosphates) are the four nucleotide building blocks — dATP, dCTP, dGTP, and dTTP — that the polymerase incorporates into the growing DNA strand. They are supplied at a balanced concentration to prevent depletion-driven errors during extension.
HF Reaction Buffer is a proprietary buffer that optimises pH and ionic conditions for Phusion activity. It contains MgCl₂ at a final concentration of 1.5 mM, which serves as an essential cofactor for polymerase activity and also stabilises the primer-template duplex during annealing. The HF buffer is the recommended default for high-fidelity cloning applications.
Nuclease-free water is added by the researcher to bring the reaction to its final volume, ensuring no contaminating nucleases degrade the template or PCR product.
Phusion generates blunt-ended products, which is directly compatible with the Gibson Assembly step that follows — Gibson’s 5’ exonuclease chews back from blunt ends to create single-stranded 3’ overhangs needed for annealing.
Question 2 — Factors That Determine Primer Annealing Temperature During PCR
Annealing temperature (T_a) is typically set 2–5°C below the melting temperature (T_m) of the lower-T_m primer in the pair. Several factors determine what that T_m is.
GC content is the dominant factor. G–C base pairs form three hydrogen bonds versus two for A–T pairs, so primers with higher GC content have a higher T_m and can anneal at higher temperatures. For Phusion specifically, NEB’s own T_m calculator is recommended because Phusion’s annealing behaviour differs from standard Taq-based rules.
Primer length has a direct effect — longer primers form more hydrogen bonds and therefore have a higher T_m. The lab protocol specifies a binding region of 18–22 bp for the core annealing portion of each primer. Primer pairs should have T_m values within 5°C of each other so both anneal efficiently at the same thermocycler step.
Primer sequence and secondary structure also matter. Even two primers of identical length and GC content can differ in T_m if one forms hairpins or self-dimers, which reduce the effective primer concentration available for annealing. Runs of more than three consecutive G or C bases in the last five positions at the 3’ end should be avoided to prevent non-specific binding, while a GC clamp of one or two terminal G/C bases is beneficial for stable annealing.
The 5’ overhang region does not contribute to T_m calculation. In this lab, the Color Forward primer carries a 21 bp 5’ overhang tail encoding mUAV homology for Gibson assembly plus the chromophore mutation. Only the 3’ binding portion contributes to annealing. This is why the protocol uses different thermocycler programs for the backbone PCR (anneal 57°C) versus the insert PCR (anneal 53°C) — the insert primer’s binding region is shorter and therefore has a lower T_m.
Salt and Mg²⁺ concentration also influence T_m — higher Mg²⁺ stabilises the duplex. The HF buffer’s fixed 1.5 mM MgCl₂ is already optimised for Phusion and does not need to be adjusted.
Question 3 — PCR vs. Restriction Enzyme Digests: Compare and Contrast
Both methods produce linear DNA fragments suitable for downstream assembly, but they differ substantially in mechanism, precision, and applicability.
PCR uses a thermostable polymerase, primers, dNTPs, and buffer in a thermocycler to exponentially amplify a defined region. The fragment boundaries are set entirely by primer design, allowing the researcher to precisely define endpoints and to add extra sequence at primer 5’ ends — such as assembly overhangs, restriction sites, or mutations. In this lab, both the backbone and the orange color insert were generated by PCR from the mUAV plasmid template. The Color Forward primer carries the orange chromophore codon (GTTGGA replacing TGTCAG) built directly into its sequence, simultaneously amplifying the insert and introducing the mutation. PCR takes approximately 90 minutes and produces large amounts of product from nanogram quantities of template. Phusion generates blunt ends, which are directly compatible with Gibson Assembly.
Restriction enzyme digestion cuts double-stranded DNA at defined recognition sequences. Fragment boundaries are determined by wherever recognition sites naturally occur or were previously engineered into the construct. Type II enzymes cut within their palindromic recognition sequence and generate either sticky ends (3’ or 5’ overhangs) or blunt ends depending on the enzyme. Digestion is typically done at 37°C for 30–60 minutes and requires microgram quantities of plasmid DNA. The recognition sequence scar remains at the junction of the assembled product.
| Feature | PCR | Restriction Enzyme Digest |
|---|---|---|
| Fragment boundary control | Fully programmable via primers | Fixed by recognition site locations |
| Introduce mutations | Yes — via mismatch primers | No |
| Template requirement | Nanograms | Micrograms |
| End type | Blunt (Phusion) | Sticky or blunt depending on enzyme |
| Sequence scar at junction | None if designed correctly | Recognition site scar remains |
| Speed | ~90 minutes | 30–60 minutes |
When to prefer PCR: PCR is preferred when fragment boundaries do not align with existing restriction sites, when a mutation needs to be introduced (as in this lab — the orange codon swap), when assembly overhangs need to be added, or when template DNA is scarce.
When to prefer restriction digest: Restriction digestion is preferred when compatible restriction sites already flank the insert in a plasmid, when generating large fragments over 5 kb that are difficult to PCR accurately, or for simple one-insert subcloning where the recognition sites are already in place. In practice, Gibson Assembly has largely replaced restriction-ligation for multi-part assemblies, but restriction digestion remains valuable for diagnostic verification and straightforward subcloning.
Question 4 — Ensuring DNA Fragments Are Appropriate for Gibson Cloning
Gibson Assembly requires adjacent fragments to share overlapping sequences of 20–40 bp at their junctions. The 5’ exonuclease in the Gibson master mix chews back these ends to expose single-stranded 3’ overhangs that anneal, are filled in by polymerase, and sealed by ligase. Several steps ensure fragments are properly prepared.
Primer design for correct overlaps. Overlap regions must be explicitly designed into the primers. In this lab, the Backbone Reverse primer and the Color Forward primer share a 21 bp overlap region spanning the junction between backbone and insert. The Backbone Forward and Color Reverse primers define the other junction. Overlaps must be in the correct 5’→3’ orientation on each strand and must cover precisely the desired junction sequence — any offset causes misassembly. This can be verified computationally in Benchling by simulating the Gibson assembly and confirming that the expected circular product is formed with the correct sequence at each junction.
DpnI digestion of the PCR template. Both PCR reactions use the methylated mUAV plasmid as template. Carryover template would appear as background colonies expressing wild-type purple amilCP. DpnI specifically cleaves methylated GATC sequences present in bacterially propagated plasmid but absent from unmethylated PCR products, selectively destroying the parental template while leaving PCR amplicons intact. The protocol adds 1 µL DpnI after PCR and incubates at 37°C for 30–60 minutes.
DNA cleanup and quantification. PCR reactions contain polymerase, primers, dNTPs, and buffer salts that inhibit Gibson Assembly. The Zymo Clean and Concentrator protocol removes these by binding DNA to a silica column, washing with wash buffer, and eluting into nuclease-free water. Concentration is then measured by Nanodrop or Qubit — the protocol expects at least 30 ng/µL. Both fragments must be quantified to calculate volumes for the 2:1 molar ratio of insert to vector required for optimal Gibson Assembly efficiency.
Gel electrophoresis verification. Running a diagnostic agarose gel confirms that a single clean band of the expected size is present for each fragment, with no smearing and no residual template. The backbone fragment (~3 kb) and the color insert fragment (~0.3 kb) should be clearly distinguishable. The protocol specifically instructs students to calculate their predicted digest on Benchling and verify the expected band size before running the gel.
Correct fragment orientation. All fragments must be in the correct 5’→3’ orientation with matching overlaps at each junction. The assembled product must cover the full desired sequence — promoter, partial gene, mutation, and terminators — in the correct order to produce a functional expression cassette.
Question 5 — How Plasmid DNA Enters E. coli During Transformation
E. coli cells are not naturally competent — their cell wall and membrane present a strong barrier to exogenous DNA. Transformation requires making cells artificially permeable, and the two methods used in this class differ in how they achieve membrane disruption.
Chemical transformation (heat shock) uses cells made chemically competent by washing with ice-cold CaCl₂ solution. The divalent Ca²⁺ ions neutralise the negative charges on both the phospholipid membrane and the DNA backbone, reducing the electrostatic repulsion that would otherwise prevent DNA from approaching the cell surface. Cells are incubated with plasmid DNA on ice, allowing DNA to associate loosely with the cell surface. A heat shock at 42°C for 30 seconds then causes a rapid disruption in membrane fluidity, creating transient pores through which plasmid DNA enters by diffusion. Cells are immediately returned to ice to reseal the membrane, then transferred to SOC medium at 37°C for 1 hour to allow membrane repair and antibiotic resistance gene expression before plating on selective media.
Electroporation applies a high-voltage electric pulse across the cell suspension, transiently destabilising the lipid bilayer and creating hydrophilic pores. DNA passes through these pores by electrophoretic force and diffusion. This method achieves higher transformation efficiency than heat shock but requires electrocompetent cells prepared in low-salt buffer to prevent arcing during the pulse.
In this lab, chemical transformation with heat shock is used. Only cells that successfully take up the assembled plasmid — which carries the chloramphenicol resistance gene from the mUAV backbone — will survive on selective plates. These colonies can then be screened visually for colour, with orange colonies indicating successful chromophore swap and purple or white colonies indicating failed or background assemblies. Successful transformed cells are visible after 1–2 days of incubation at 37°C.
Question 6 — Golden Gate Assembly
Part A — Description of Golden Gate Assembly
Golden Gate Assembly is a one-pot, scarless DNA cloning method that exploits the unique cutting properties of Type IIS restriction enzymes, most commonly BsaI or BsmBI. Unlike conventional Type II enzymes such as EcoRI or BamHI which cut within their palindromic recognition sequence and leave behind a sequence scar at the junction, Type IIS enzymes bind a non-palindromic recognition sequence but cut the DNA at a fixed distance outside that site — meaning the recognition sequence itself is removed from the product after digestion. By flanking each DNA part with inward-facing Type IIS sites, researchers can design the resulting 4-base 5’ overhang to be any arbitrary sequence they choose, programming the exact junction sequence between adjacent parts with single-base precision.
Because the final assembled product no longer contains any Type IIS recognition sites — they are consumed during digestion — the ligation product cannot be re-cut by the enzyme. This makes the reaction essentially irreversible and strongly drives the equilibrium toward the desired assembled product. The digestion and ligation steps are run simultaneously in a single tube by cycling between 37°C for restriction enzyme activity and 16°C for ligase activity, iteratively producing and ligating correct overhangs across many cycles. This makes Golden Gate ideal for assembling many ordered fragments — up to 35 have been reported — in a single reaction without the need for sequence homology-based overlap design. Compared to Gibson Assembly, Golden Gate is more modular because standardised parts libraries can be maintained in entry vectors and recombined in different configurations, and it works with both linear and circular DNA inputs without requiring a prior linearisation step.
Part B — Benchling Model Walkthrough
The following is a step-by-step description of how Golden Gate Assembly was modelled in Benchling to demonstrate replacement of the amilCP chromophore region with the orange codon variant (TGTCAG → GTTGGA) using BsaI-mediated Type IIS cloning.
Overview of the Model
The assembly uses two parts and two junctions:
- Part 1 — the mUAV backbone with the chromophore region removed, flanked by inward-facing BsaI sites
- Part 2 — the orange chromophore insert flanked by inward-facing BsaI sites
The two junctions are defined by unique 4-base overhangs:
- Junction 1 — overhang ACAG (left junction, backbone left end meets insert right end)
- Junction 2 — overhang ATCA (right junction, backbone right end meets insert left end)
Step 1 — Setting Up the Project Folder
A new folder named Week 6 — Golden Gate Model was created inside the existing HTGAA project in Benchling. All sequence files and the assembly were saved here.
Step 2 — Importing the mUAV Wildtype Plasmid
A new DNA sequence was created by importing GenBank accession MG252981.1 directly into Benchling using the Import from NCBI function. The imported sequence was renamed mUAV_wildtype_amilCP.
Key features were confirmed on the plasmid map: the amilCP coding sequence, transcription promoter, RBS, terminator, chloramphenicol resistance gene, and origin of replication.
The chromophore region was located using the Find Sequence function by searching for TGTCAG. The amilCP gene contains three occurrences of this sequence. To identify the correct chromophore-determining position, the reading frame of each occurrence was checked — only the occurrence at position 181 within the amilCP gene (offset 180 from the ATG start codon, divisible by 3) sits on a codon boundary and correctly encodes Cys-Gln (TGT·CAG). The other two occurrences straddle codon boundaries and do not encode the chromophore amino acids. The two incorrect annotations were deleted and the correct one was renamed CP site — wildtype TGT·CAG (Cys-Gln, chromophore-forming) and coloured red.
Step 3 — Creating Part 1 — The Backbone Fragment
A new linear sequence was created and named Part1_Backbone_GoldenGate. The mUAV sequence was split at the chromophore position — everything before the TGTCAG codon was taken as the left backbone half and everything after it as the right backbone half. These two halves were joined seamlessly (as if the chromophore codon was deleted) and flanked with BsaI sites as follows:
Where:
GGTCTCis the BsaI recognition sequenceais a single spacer baseACAGis the left 4-base overhangATCAis the right 4-base overhangGAGACCis the reverse complement BsaI recognition sequence
Both BsaI sites were annotated in blue. During the restriction site check, an unexpected third BsaI site was discovered at position 2046 — a pre-existing internal BsaI site embedded in a synthetic part cassette in the promoter/RBS region 79 bases upstream of the amilCP start codon. This site required domestication.
Domestication of the Internal BsaI Site
The internal site at position 2046 had the sequence GGTCTC. A single C→T substitution at position 2051 changed this to GGTCTT, which BsaI does not recognise. This change sits in a non-coding intergenic region and does not affect any amino acid sequence or known regulatory element. After this mutation, running the BsaI restriction site check confirmed exactly two BsaI sites remained — one at each designed terminus.
The domestication mutation was annotated in yellow: Domestication mutation — C→T at position 2051.
Step 4 — Creating Part 2 — The Orange Chromophore Insert
A new linear sequence was created and named Part2_OrangeInsert_GoldenGate. The sequence was designed as follows:
Breaking this down:
GGTCTC— BsaI recognition site (left, forward)a— spacer baseATCA— left overhang, compatible with Part 1 right endGTTGGA— orange chromophore codon replacing wildtype TGTCAGACAG— right overhang, compatible with Part 1 left enda— spacer baseGAGACC— BsaI recognition site (right, reverse complement)
Three annotations were added:
- Left BsaI site in blue:
BsaI site — Left (leaves ATCA overhang) - Orange chromophore codon in orange:
CP site — orange variant GTTGGA (Val-Gly) - Right BsaI site in blue:
BsaI site — Right (leaves ACAG overhang)
Design Note on Overhang Order
During assembly simulation, an initial error was encountered — Benchling reported that the sticky ends of Part 1 (ATCA) and Part 2 (ACAG) were incompatible. This occurred because Benchling reads parts sequentially around the circle: Part 1 then Part 2 then back to Part 1. The junction order is therefore:
The initial Part 2 design had the overhangs reversed (ACAG on the left, ATCA on the right). Correcting them — placing ATCA on the left and ACAG on the right of Part 2 — resolved the error. This is an important Golden Gate design lesson: overhangs must be assigned according to the sequential reading direction of the circular assembly, not simply matched by name.
Step 5 — Running the Assembly Simulation
An assembly was created in Benchling using Assembly by Cloning with BsaI as the enzyme. Part 1 and Part 2 were added to the fragments table in order. The constructs table was filled with the expected output named OrangeAmilCP_assembled_plasmid with circular topology and expected size of approximately 2,459 bp.
The simulation produced a circular plasmid of 2,459 bp. The assembled construct was confirmed correct by:
- Locating
GTTGGAat the chromophore position inside amilCP ✅ - Confirming BsaI is absent from the restriction enzyme map of the assembled product — both recognition sites were consumed during digestion and do not appear in the final sequence ✅
- Verifying plasmid size matches the expected value ✅
The absence of BsaI sites in the assembled product is the defining feature confirming the reaction is irreversible — the ligated product cannot be re-cut, strongly favouring accumulation of the correct assembled plasmid.
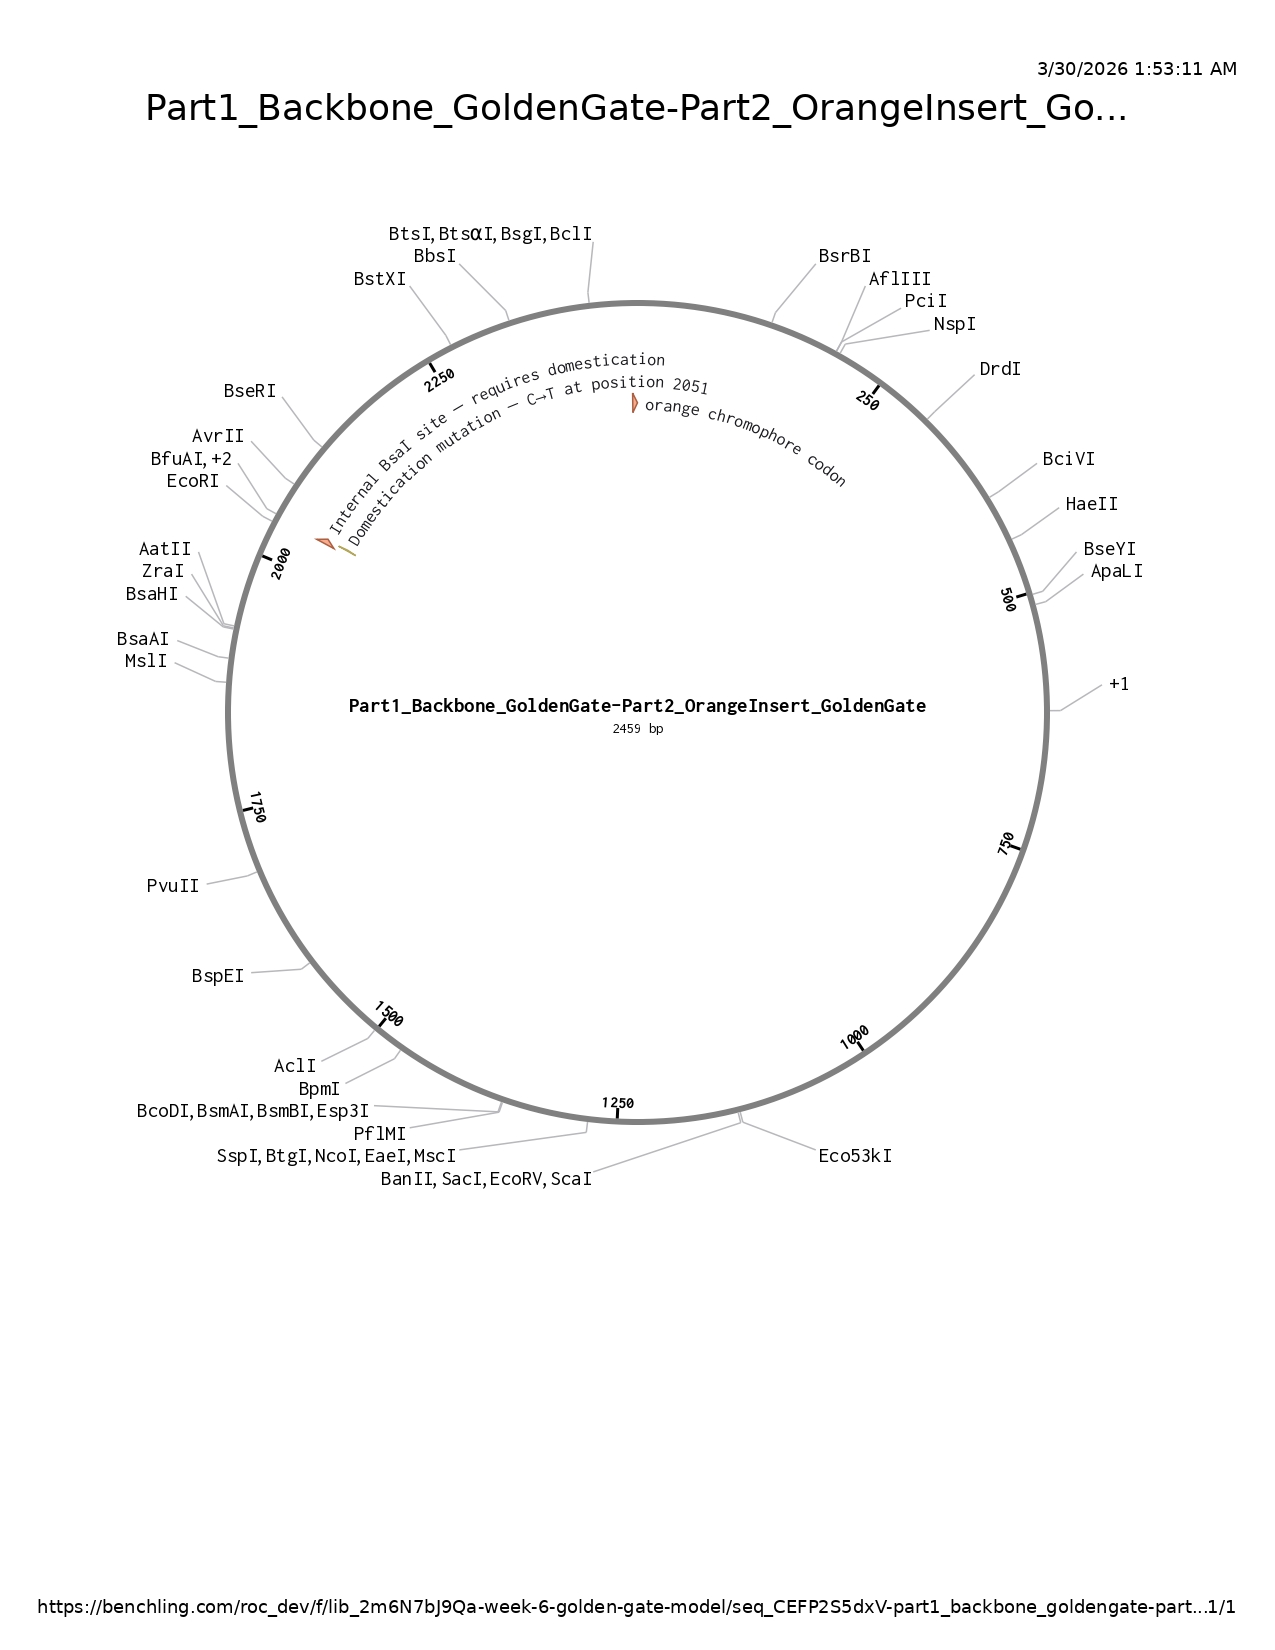
Figure: Assembled circular plasmid map (2,459 bp) showing the orange chromophore codon annotation, the domestication mutation annotation, and the absence of BsaI sites in the restriction enzyme map. The construct combines Part 1 (mUAV backbone) and Part 2 (orange insert) at the ATCA and ACAG junctions.
Assignment: Asimov Kernel
Task 1 — Repository
A new repository named HTGAA-2026-Week6 was created in Asimov Kernel with the description: Week 6 homework — Genetic Circuits Part I. Repressilator recreation and custom construct designs. All notebooks and constructs for this assignment were saved within this repository.
Task 2 — Notebook Entry
A blank notebook entry titled Week 6 Homework — Genetic Circuit Design and Simulation was created inside the repository. This notebook was used to document all construct designs, simulator results, and observations throughout the assignment.
Task 3 — Exploring the Bacterial Demos Repository
The Bacterial Demos repository was opened and several pre-built constructs were explored. For each construct the Info panel (accessed via the i icon on the right side of the canvas) was read to understand how the parts work together, and the Simulator was run using the play button to observe the dynamic behaviour of each circuit.
The key observation across the demos is that different circuit topologies produce fundamentally different behaviours — a single constitutive promoter produces a flat steady-state line, a two-node mutual repression circuit produces a bistable switch, and a three-node negative feedback loop produces sustained oscillations. The topology of the connections between parts, not the individual parts themselves, determines the circuit behaviour.
Task 4 — Repressilator Recreation
What the Repressilator Is
The repressilator is a synthetic genetic oscillator built from three genes arranged in a cyclic repression loop, first described by Elowitz and Leibler in 2000. The circuit logic is:
- LacI protein represses the promoter driving TetR expression
- TetR protein represses the promoter driving cI expression
- cI protein represses the promoter driving LacI expression
This three-node negative feedback loop never reaches a stable equilibrium because each repressor periodically degrades and is outcompeted by the next in the cycle. The result is sustained oscillation — the three repressor proteins take turns being at high concentration, cycling in sequence. A GFP reporter placed under the control of a TetR-repressed promoter blinks green in synchrony with the oscillations.
Parts Used
| Part | Role |
|---|---|
| pLac promoter | Drives TetR expression. Repressed by LacI |
| pTet promoter | Drives cI expression. Repressed by TetR |
| pCI promoter | Drives LacI expression. Repressed by cI |
| TetR | Repressor. Represses pTet |
| cI | Repressor. Represses pCI |
| LacI | Repressor. Represses pLac |
| GFP | Reporter driven by pTet |
All parts were sourced from the Characterized Bacterial Parts repository using the search function in the right panel of the Kernel canvas. Each part was dragged and dropped onto the canvas, connected in the correct order, and the repression connections were drawn between each repressor and its target promoter to complete the three-node loop.
Simulation Results
Running the simulator on the recreated repressilator construct produced oscillating waves for all three repressor proteins and for GFP. The proteins cycle sequentially — when LacI is at peak concentration it represses TetR production, causing TetR levels to fall. As TetR falls, pTet is derepressed and cI production rises. Rising cI represses pCI, causing LacI levels to fall. As LacI falls, pLac is derepressed and TetR rises again, completing one full oscillation cycle. GFP oscillates in phase with pTet derepression, producing periodic fluorescence pulses.
The simulation output of the recreated construct matched the Repressilator construct found in the Bacterial Demos repository — the same oscillation period, the same wave shape, and the same sequential phase offset between the three proteins — confirming the circuit was assembled correctly from parts.
Task 5 — Three Original Constructs
Construct 1 — Constitutive Expression Circuit
Design logic: A single strong constitutive promoter (J23119) drives continuous GFP expression. There is no regulatory input — no repressor, no inducer requirement — so the promoter is always fully active.
Parts: J23119 constitutive promoter → GFP reporter
Expected behaviour: GFP levels rise from zero and plateau at a steady high level set by the balance between production rate and dilution or degradation. No oscillation, no switching — a flat steady state.
Simulator results: The simulation showed a single monotonically rising line that reached a plateau and remained stable, exactly as predicted. This circuit establishes the maximum expression level achievable in this chassis and serves as a positive reference point for comparing regulated circuits.
Biological interpretation: Constitutive expression circuits like this are useful as positive controls in experiments, as baseline reporters, and as drivers of metabolic pathway genes where constant high-level production is desired. The J23119 promoter is one of the strongest characterised constitutive promoters in the Anderson promoter library and is widely used in synthetic biology chassis engineering.
Construct 2 — Negative Autoregulation Circuit
Design logic: LacI represses the pLac promoter that drives its own expression. This creates a negative feedback loop — as LacI accumulates it slows its own production, creating a self-correcting system.
Parts: pLac promoter → LacI repressor, with a repression arrow from LacI back to pLac
Expected behaviour: LacI levels rise initially when concentration is low and pLac is fully active. As LacI accumulates it progressively represses pLac, slowing production. The system reaches a steady state faster than a constitutive circuit would, and at a lower final concentration. The steady state is also more robust to perturbations because any increase in LacI above the setpoint is immediately corrected by increased repression.
Simulator results: The simulation showed LacI rising and settling at a stable plateau. The rise time was faster and the plateau lower than a constitutive pLac circuit without feedback, consistent with the known behaviour of negative autoregulation.
Biological interpretation: Negative autoregulation is one of the most enriched transcriptional network motifs found in E. coli, where it functions to speed up gene expression response times and reduce cell-to-cell expression noise. The faster response time arises because early in the response — when protein levels are low — the promoter is fully active and drives rapid initial production. The noise reduction arises because the feedback loop continuously corrects deviations from the steady-state setpoint.
Construct 3 — Toggle Switch
Design logic: Two genes mutually repress each other. Only one can be highly expressed at a time, producing a bistable system with two stable steady states that can be switched between by a transient external signal.
Parts: pLac promoter → TetR repressor (represses pTet); pTet promoter → LacI repressor (represses pLac); GFP reporter driven by pTet
Expected behaviour: The system settles into one of two stable states depending on initial conditions. In State A, TetR dominates — TetR is high, repressing pTet and keeping LacI low, which in turn keeps pLac active. In State B, LacI dominates — LacI is high, repressing pLac and keeping TetR low, which in turn keeps pTet active. GFP driven by pTet reports which state the switch is in: bright in State B (LacI dominant, pTet active), dark in State A (TetR dominant, pTet repressed).
Simulator results: Running the simulator with default initial conditions showed the system converging to one stable state. Running the simulator again with initial LacI concentration set high and TetR set low caused the system to converge to the opposite stable state, confirming bistability. In both runs, once the dominant repressor reached threshold, the system committed to that state and did not spontaneously switch — demonstrating the memory property of the toggle switch.
Biological interpretation: The genetic toggle switch was first demonstrated experimentally by Gardner et al. in 2000 and represents one of the foundational synthetic biology circuits. It functions as a binary memory device — the circuit remembers which state it was last pushed into and maintains that state indefinitely until an external signal (such as addition of IPTG to relieve LacI repression, or aTc to relieve TetR repression) flips it to the opposite state. Toggle switches have practical applications in cell fate decision circuits, biosensors with memory, and therapeutic gene regulation systems.
Submitted as part of HTGAA Spring 2026 — Week 6 homework Peter Olawumi