HTGAA 2026 – DNA Gel Art Lab Report Lab Partner: Alexandra Valdepeñas Objective The objective of this laboratory exercise was to create DNA get art using available restriction enzyme, prepare restriction digests, cast and run agarose gel, perform electrophoresis and compare observed DNA fragment patterns to the envisioned gel design.
Subsections of Labs
Week 1 Lab: Pipetting
Week 2 HW: DNA Read, Write, and Edit
HTGAA 2026 – DNA Gel Art Lab Report
Lab Partner: Alexandra Valdepeñas
Objective
The objective of this laboratory exercise was to create DNA get art using available restriction enzyme, prepare restriction
digests, cast and run agarose gel, perform electrophoresis and compare observed DNA fragment patterns to the envisioned gel design.
Part 0: We agreed to the following design:
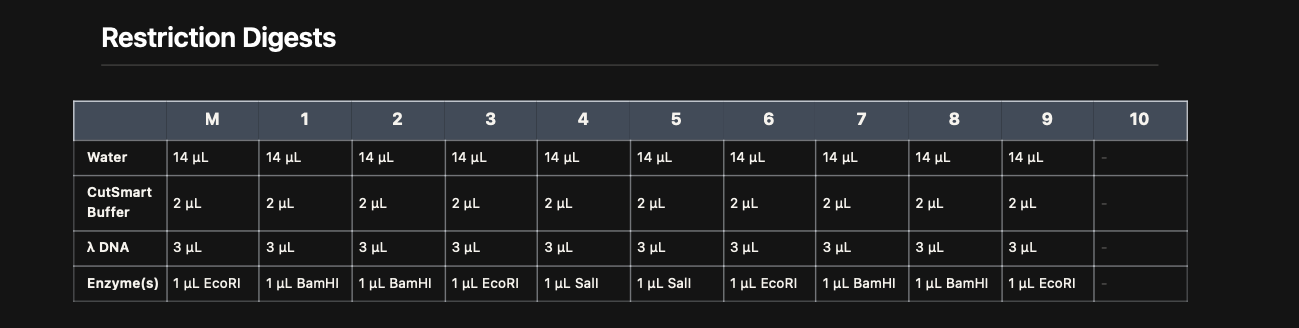
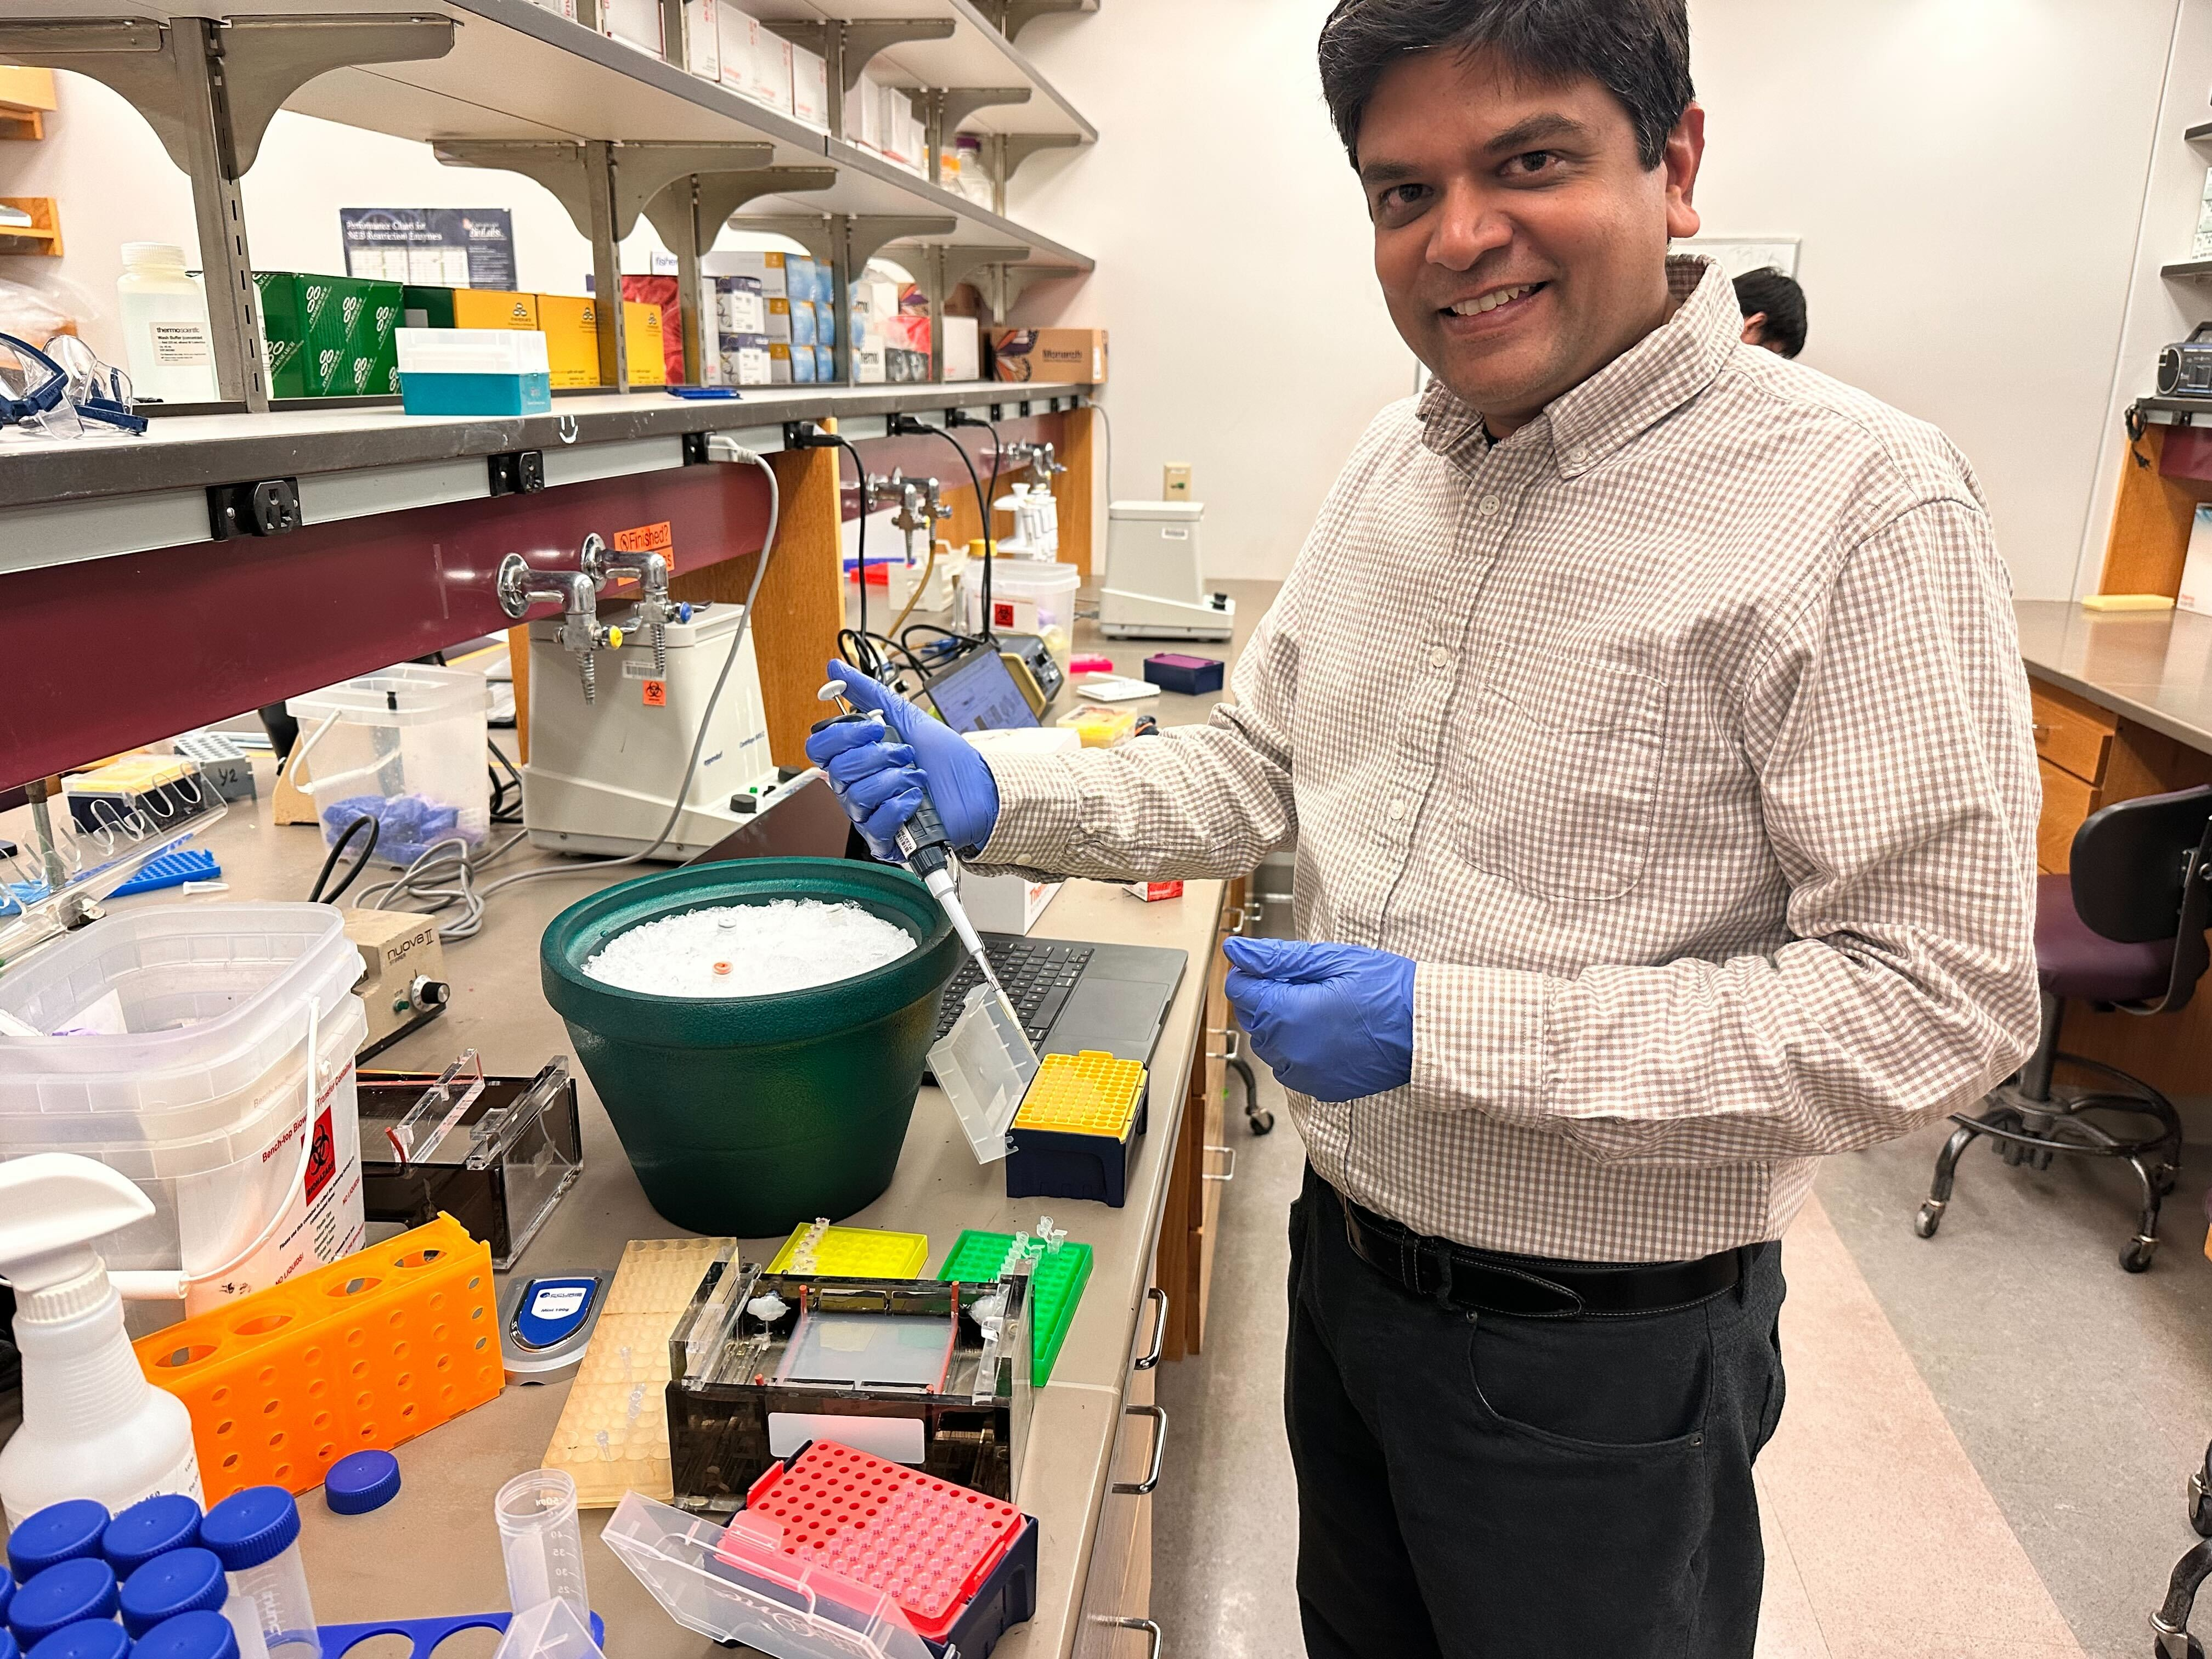
Part I: Restriction Digest Setup
Restriction enzyme reactions were prepared using Lamda DNA, CutSmart buffer,
and specific enzymes (EcoRI, BamHI, SalI) according to the virtual digest table.
Digest Reaction Map
Each reaction contained:
14 µL water\
2 µL CutSmart buffer\
1 µL restriction enzyme
3 µL λ DNA\
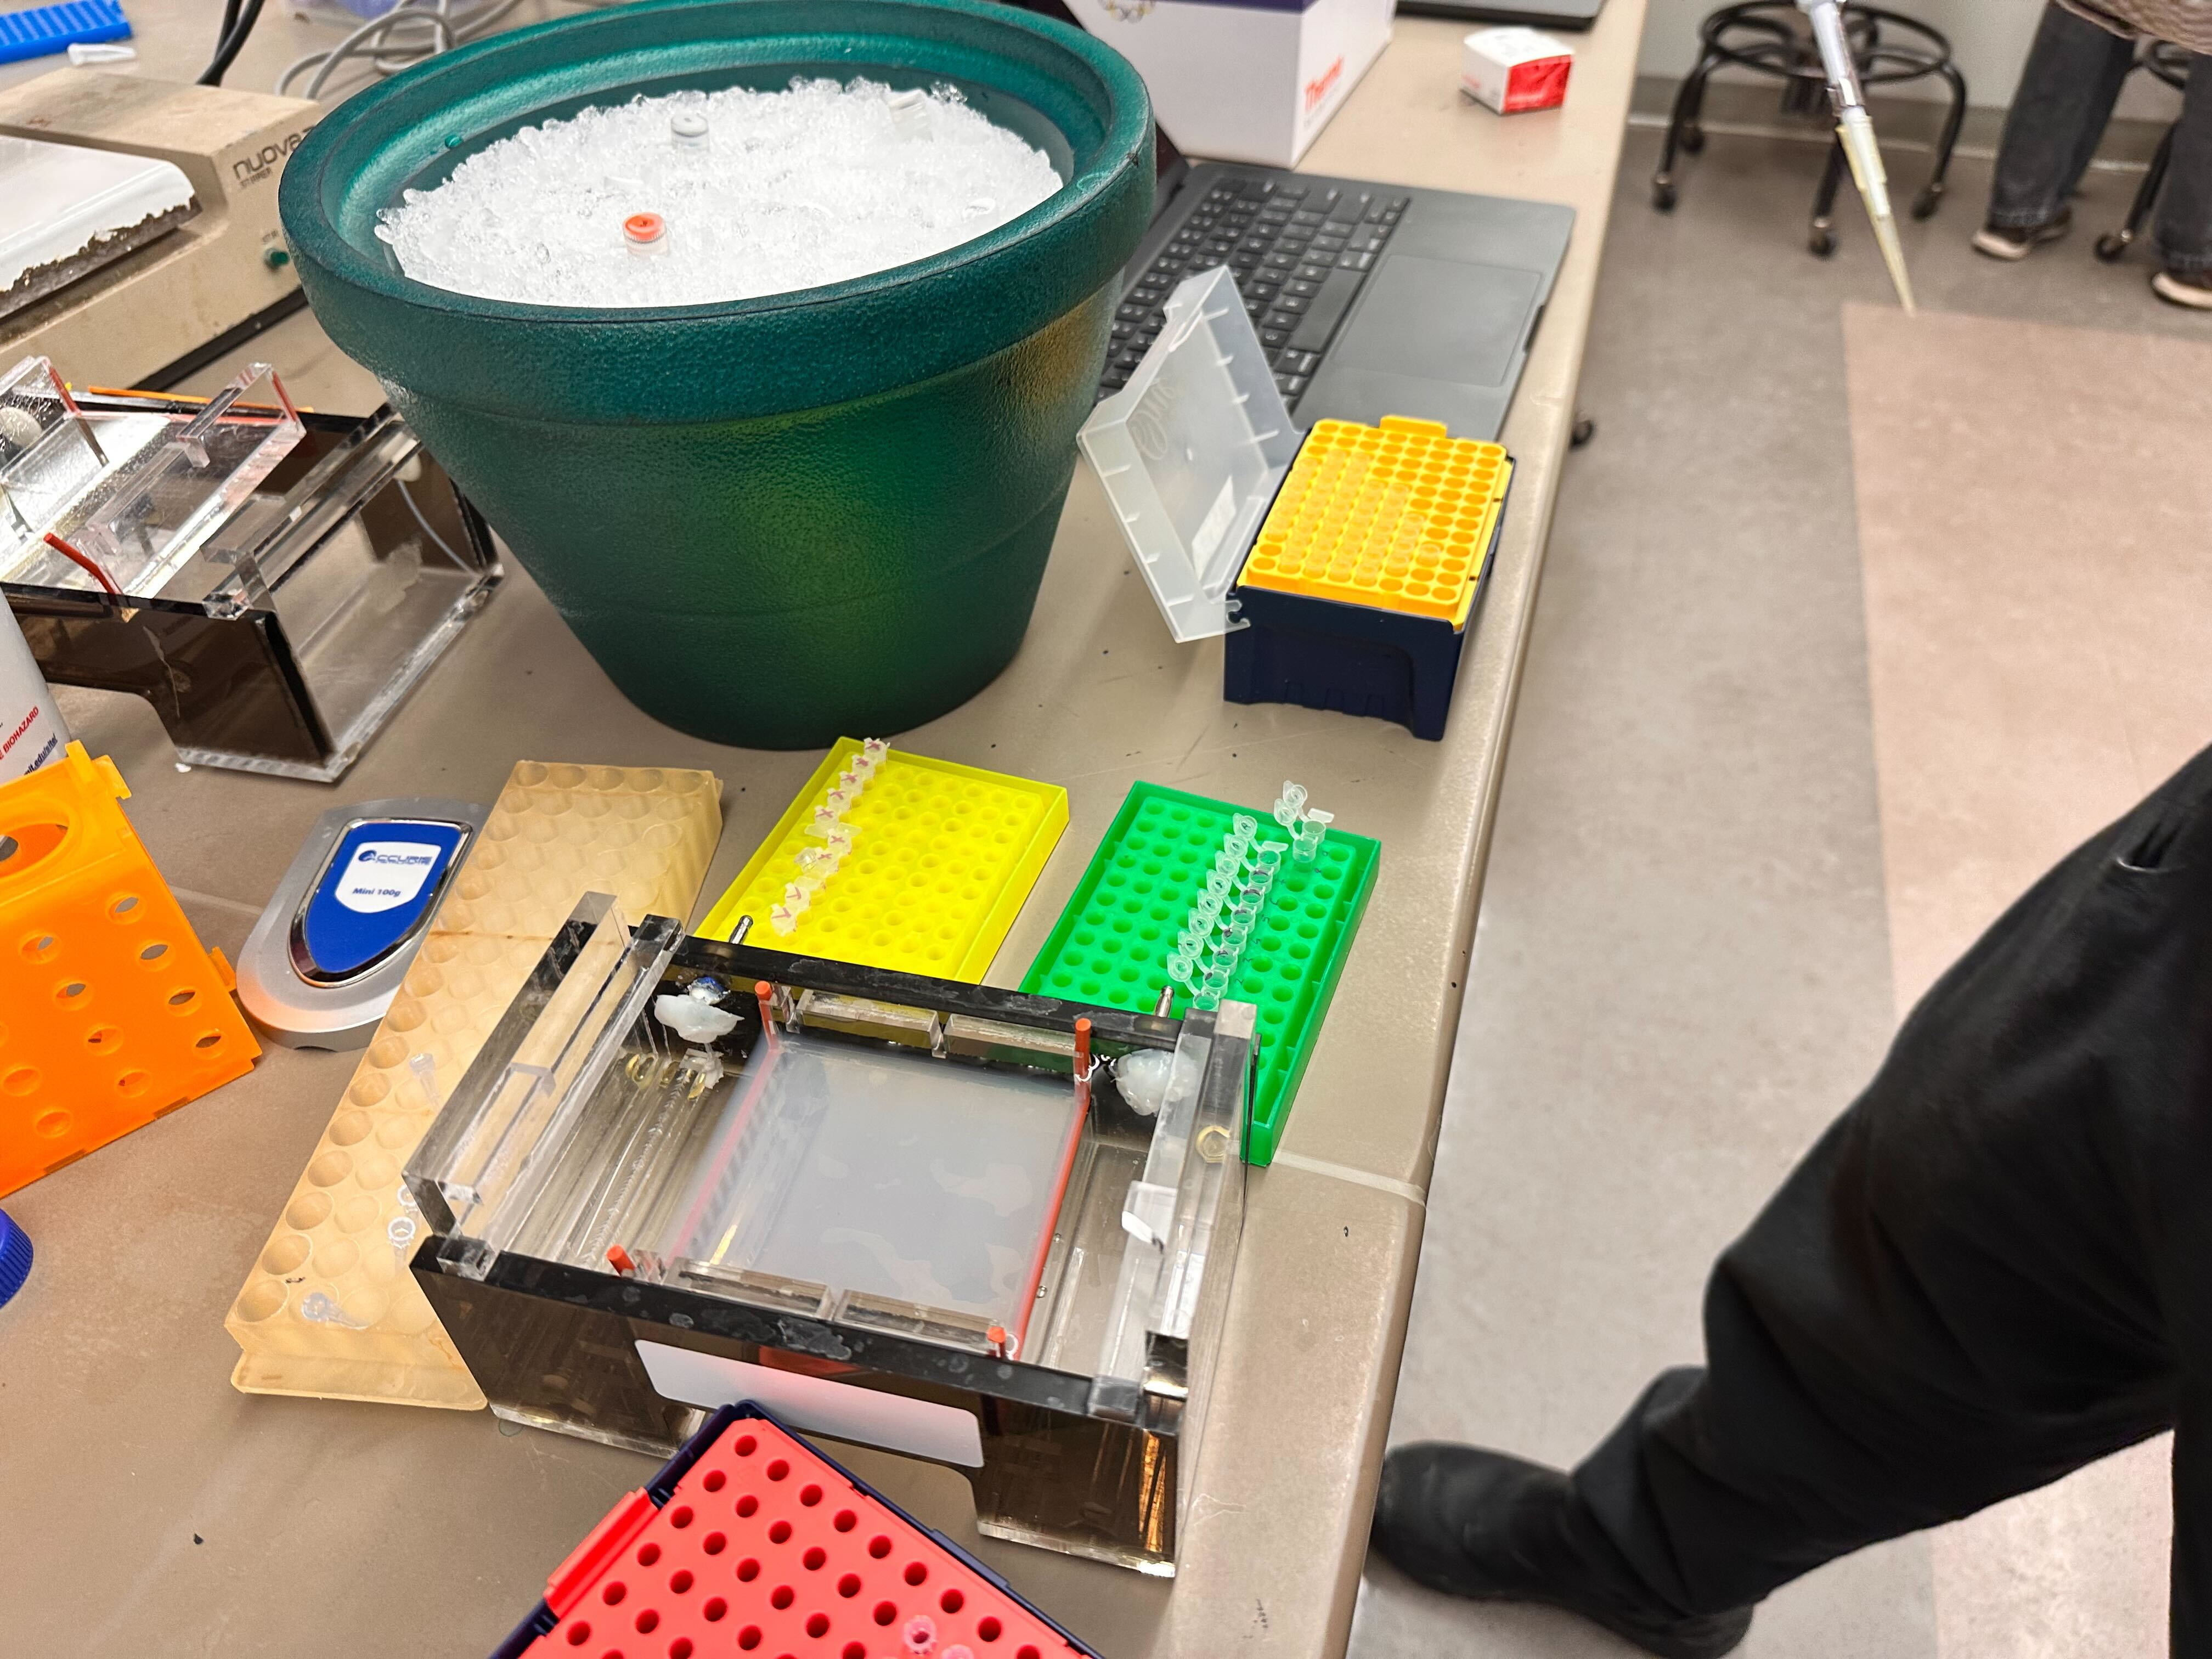
The reagents were stored in an ice bucket and carefully pipetted.
Part II: Gel Preparation
Agarose was weighed and dissolved in buffer by heating until fully
melted, then poured into a casting tray with comb inserted.
Part III: Sample Preparation
Digested DNA samples were carefully mixed with loading dye
The total reaction volume was 20 µL.
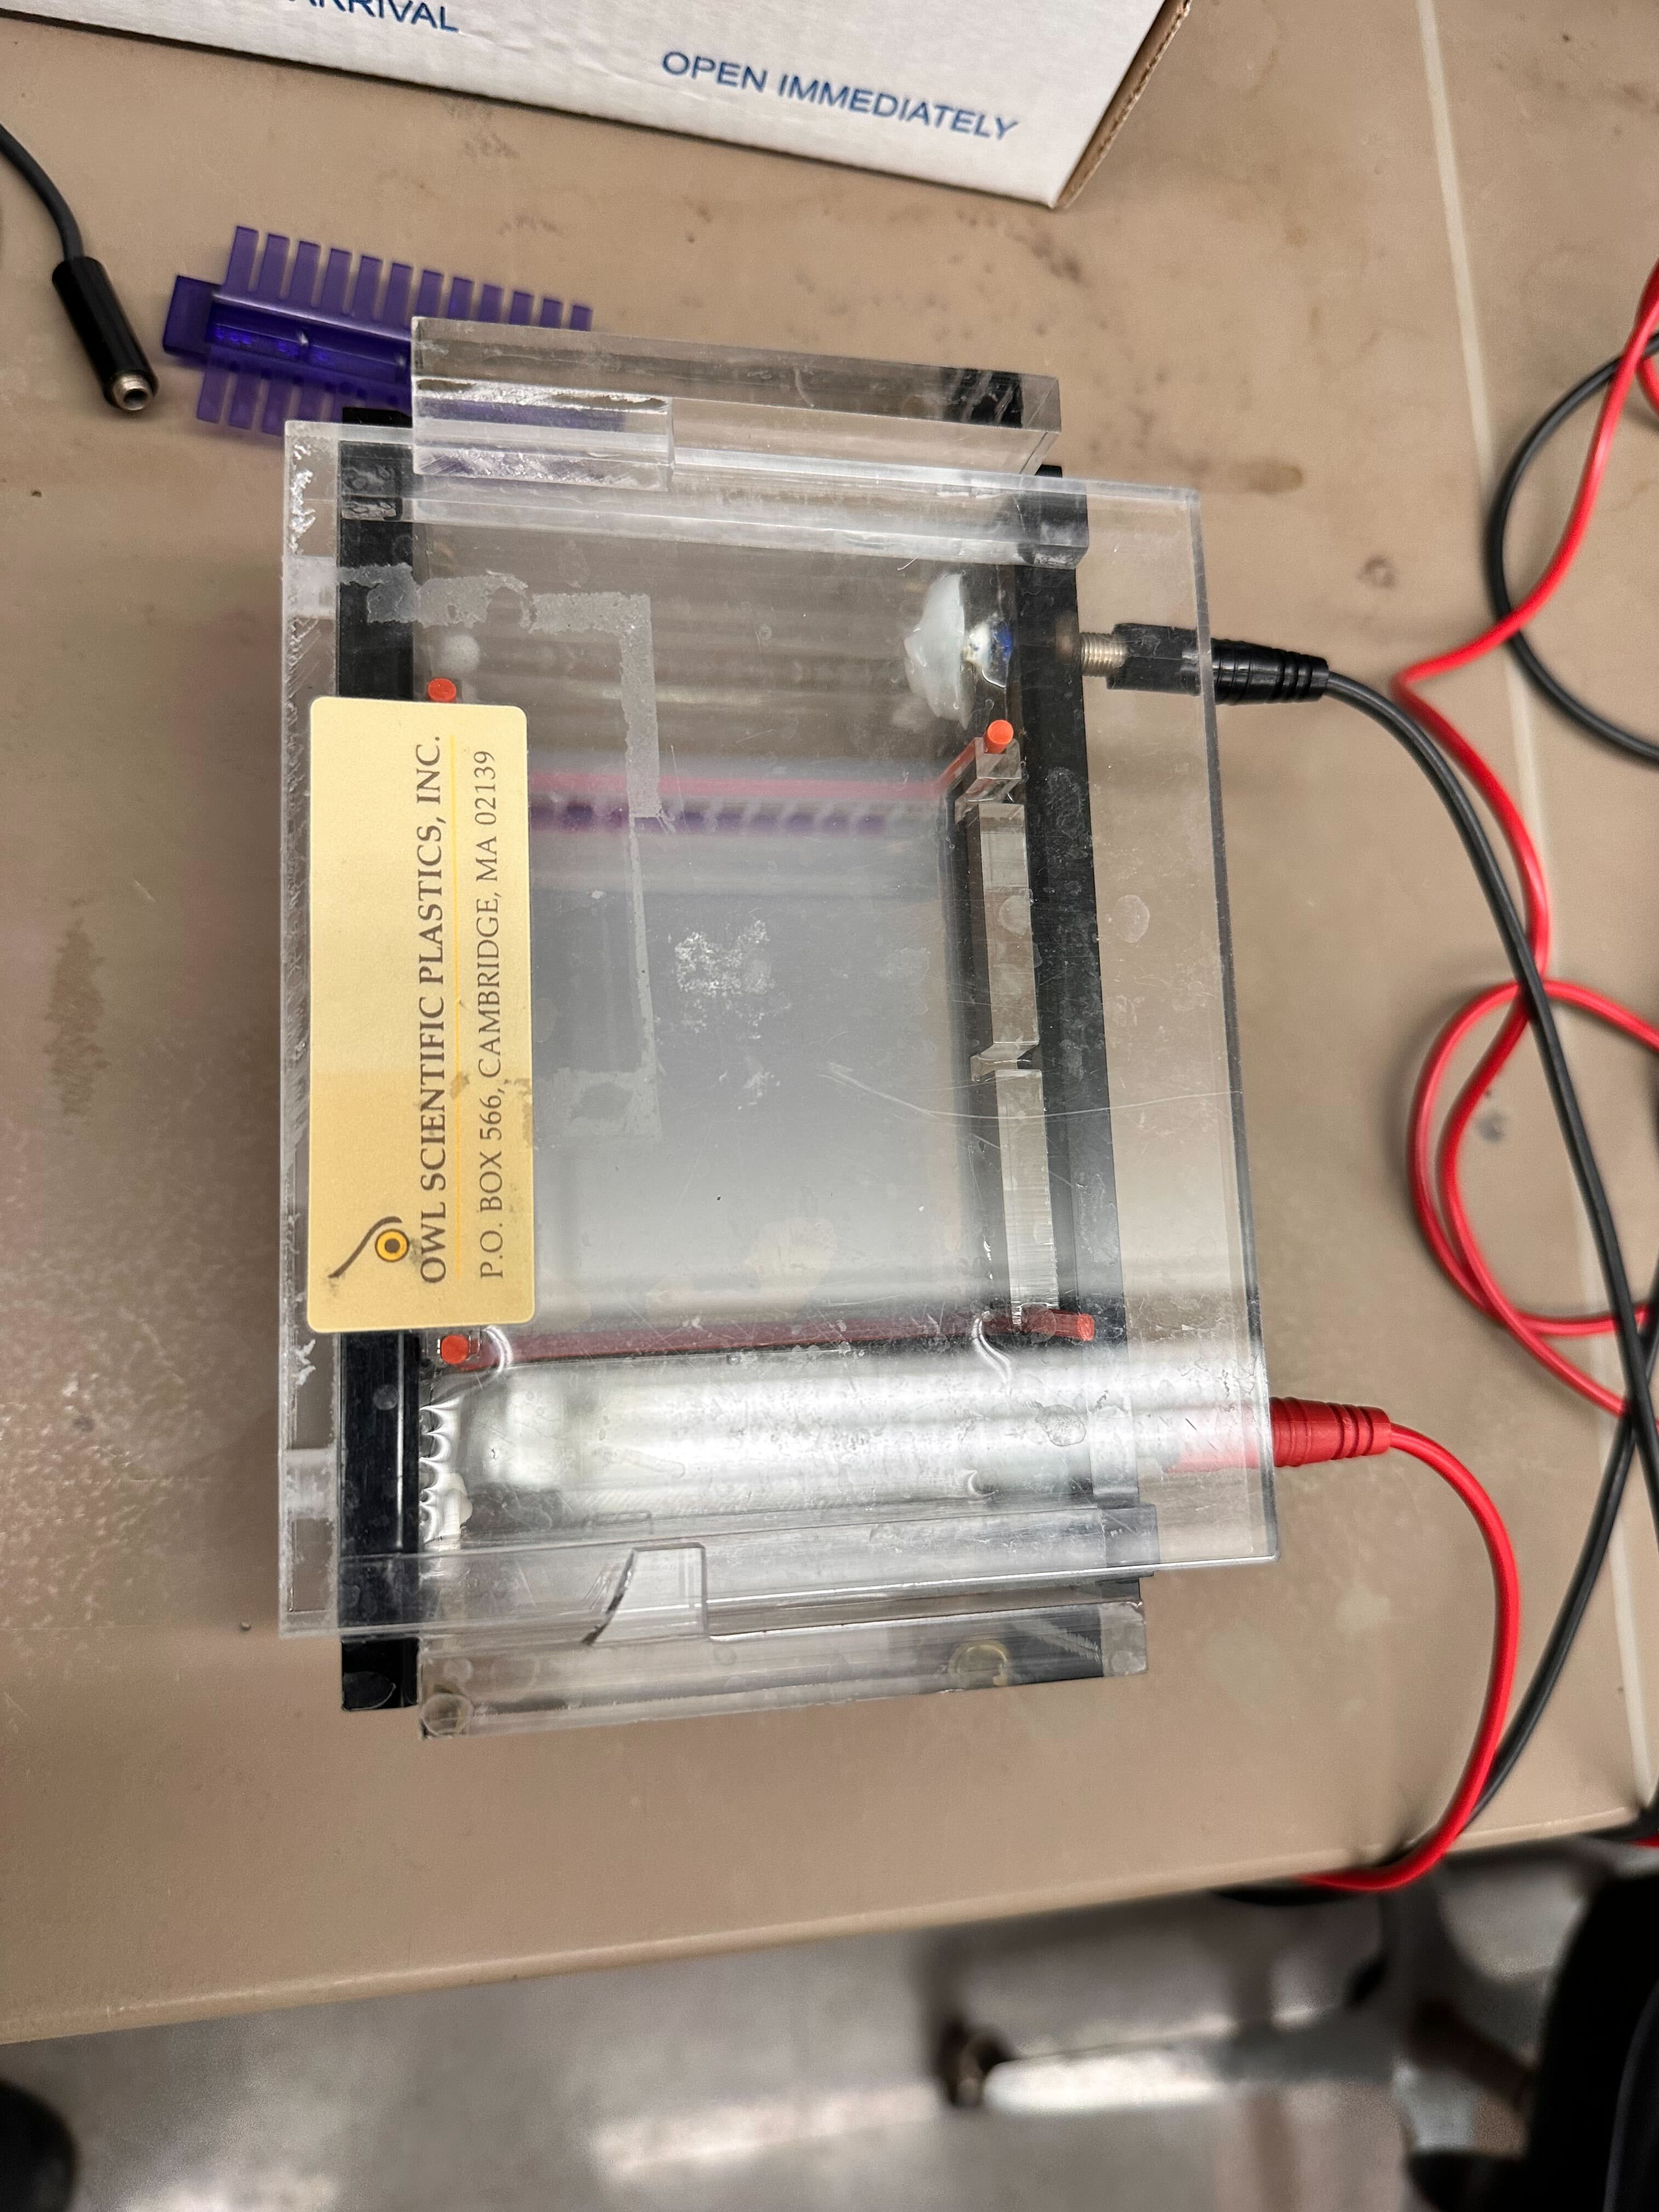
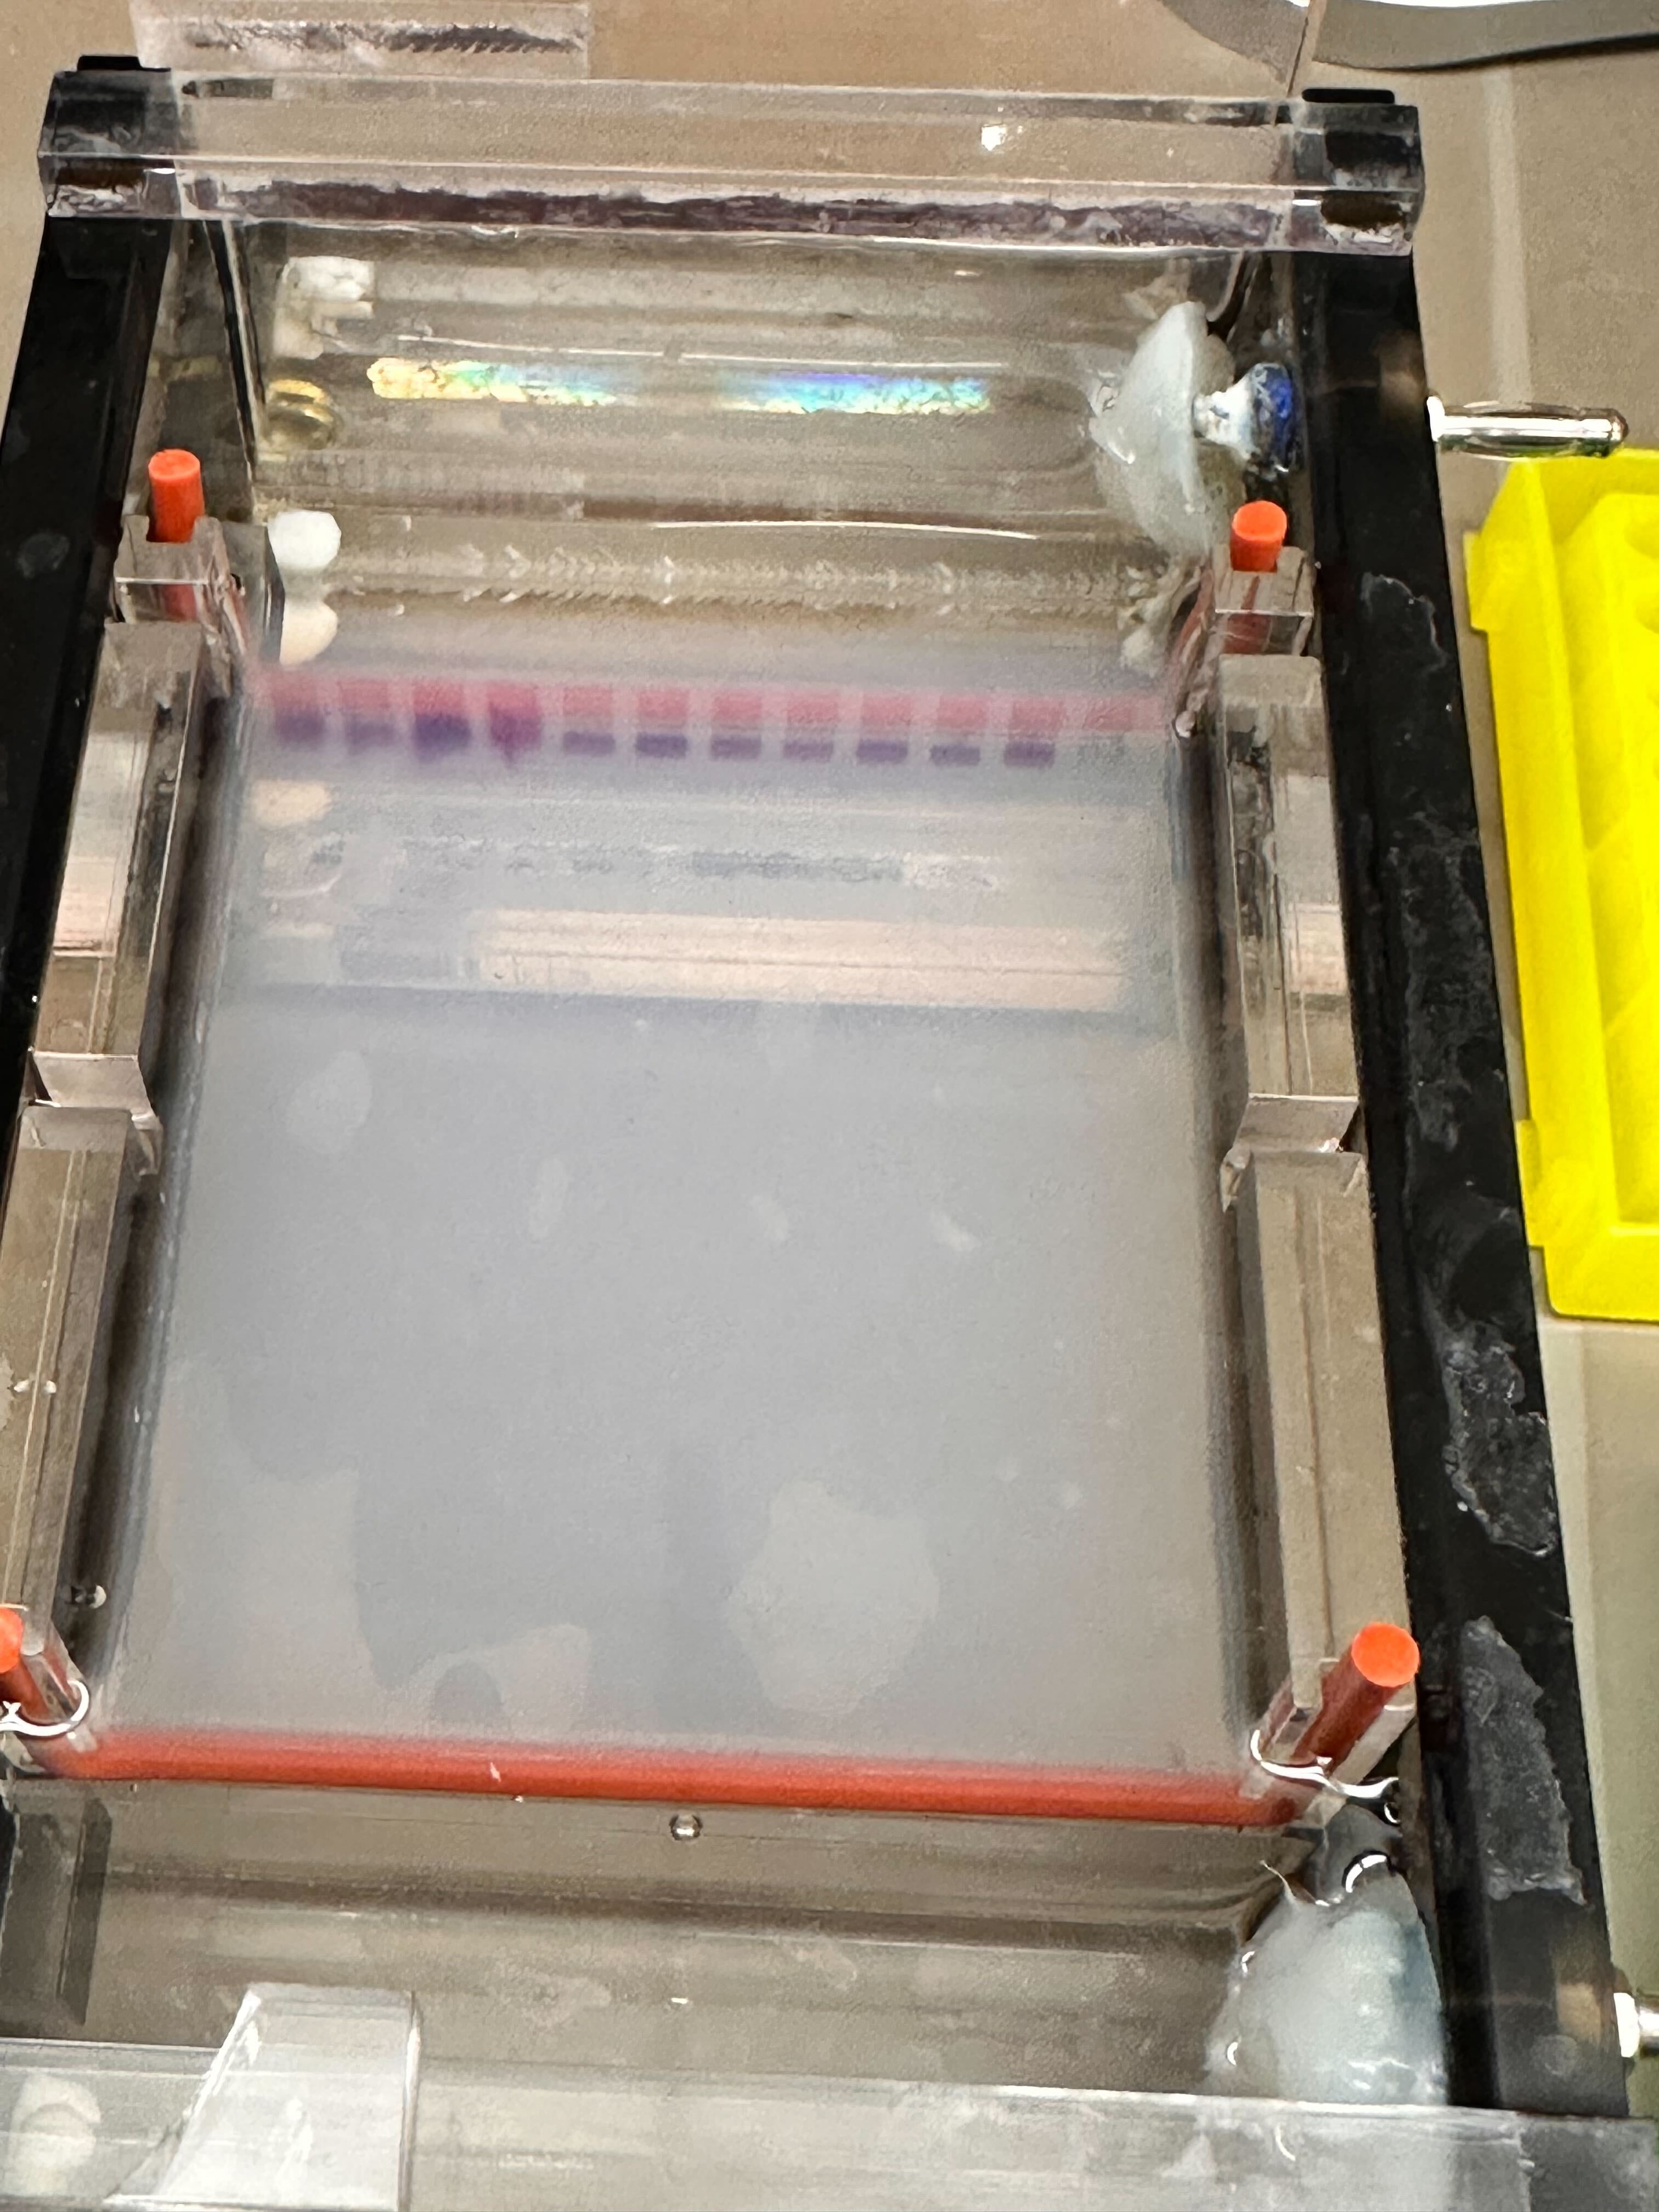
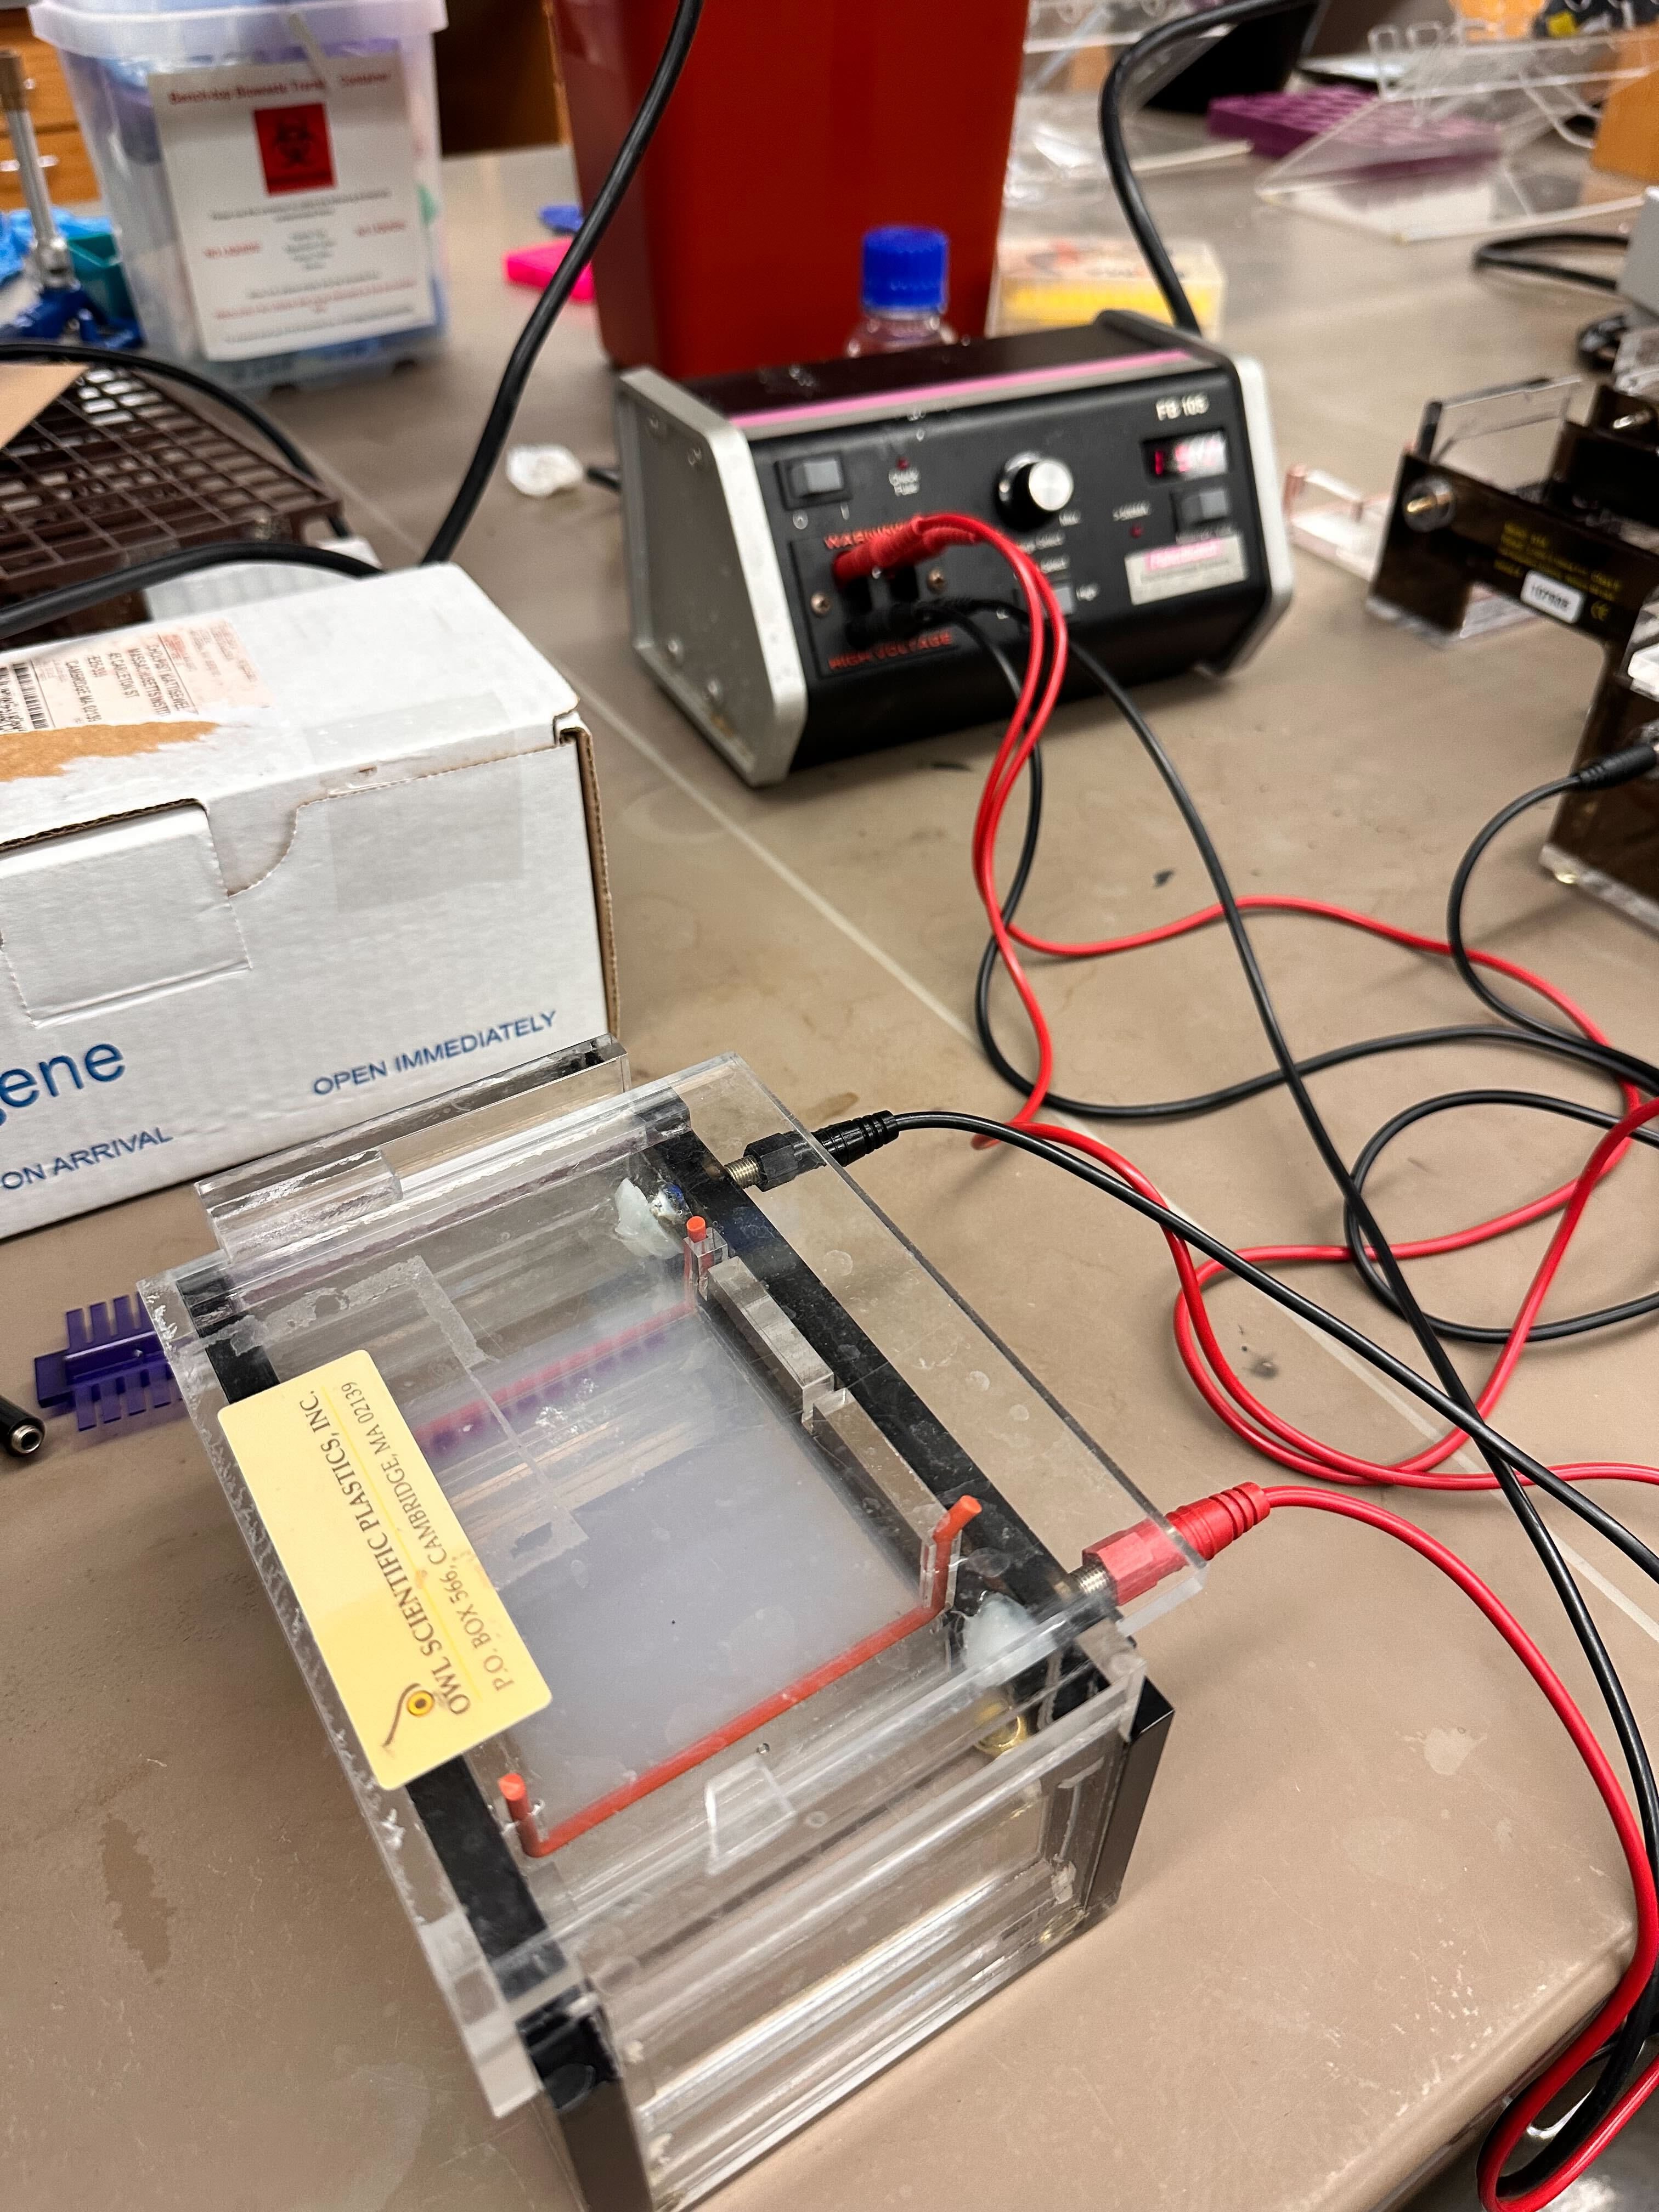
Part IV: Loading and Electrophoresis
The gel was placed into the electrophoresis chamber and submerged in
buffer. Samples were loaded carefully into wells using micropipettes.
The chamber was connected to a power supply and run until adequate
separation occurred.
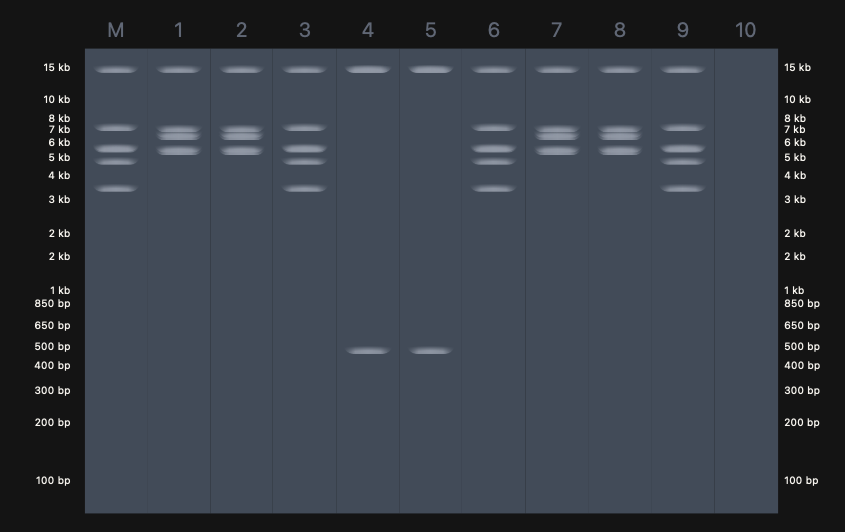
Expected Result (Design)
The predicted fragment pattern based on known λ DNA restriction maps is
shown below.
This design reflects: - Specific fragment sizes unique to EcoRI, BamHI,
and SalI digests\
Clear separation of fragments across molecular weight ranges\
Distinct band counts per lane corresponding to enzyme cut frequency
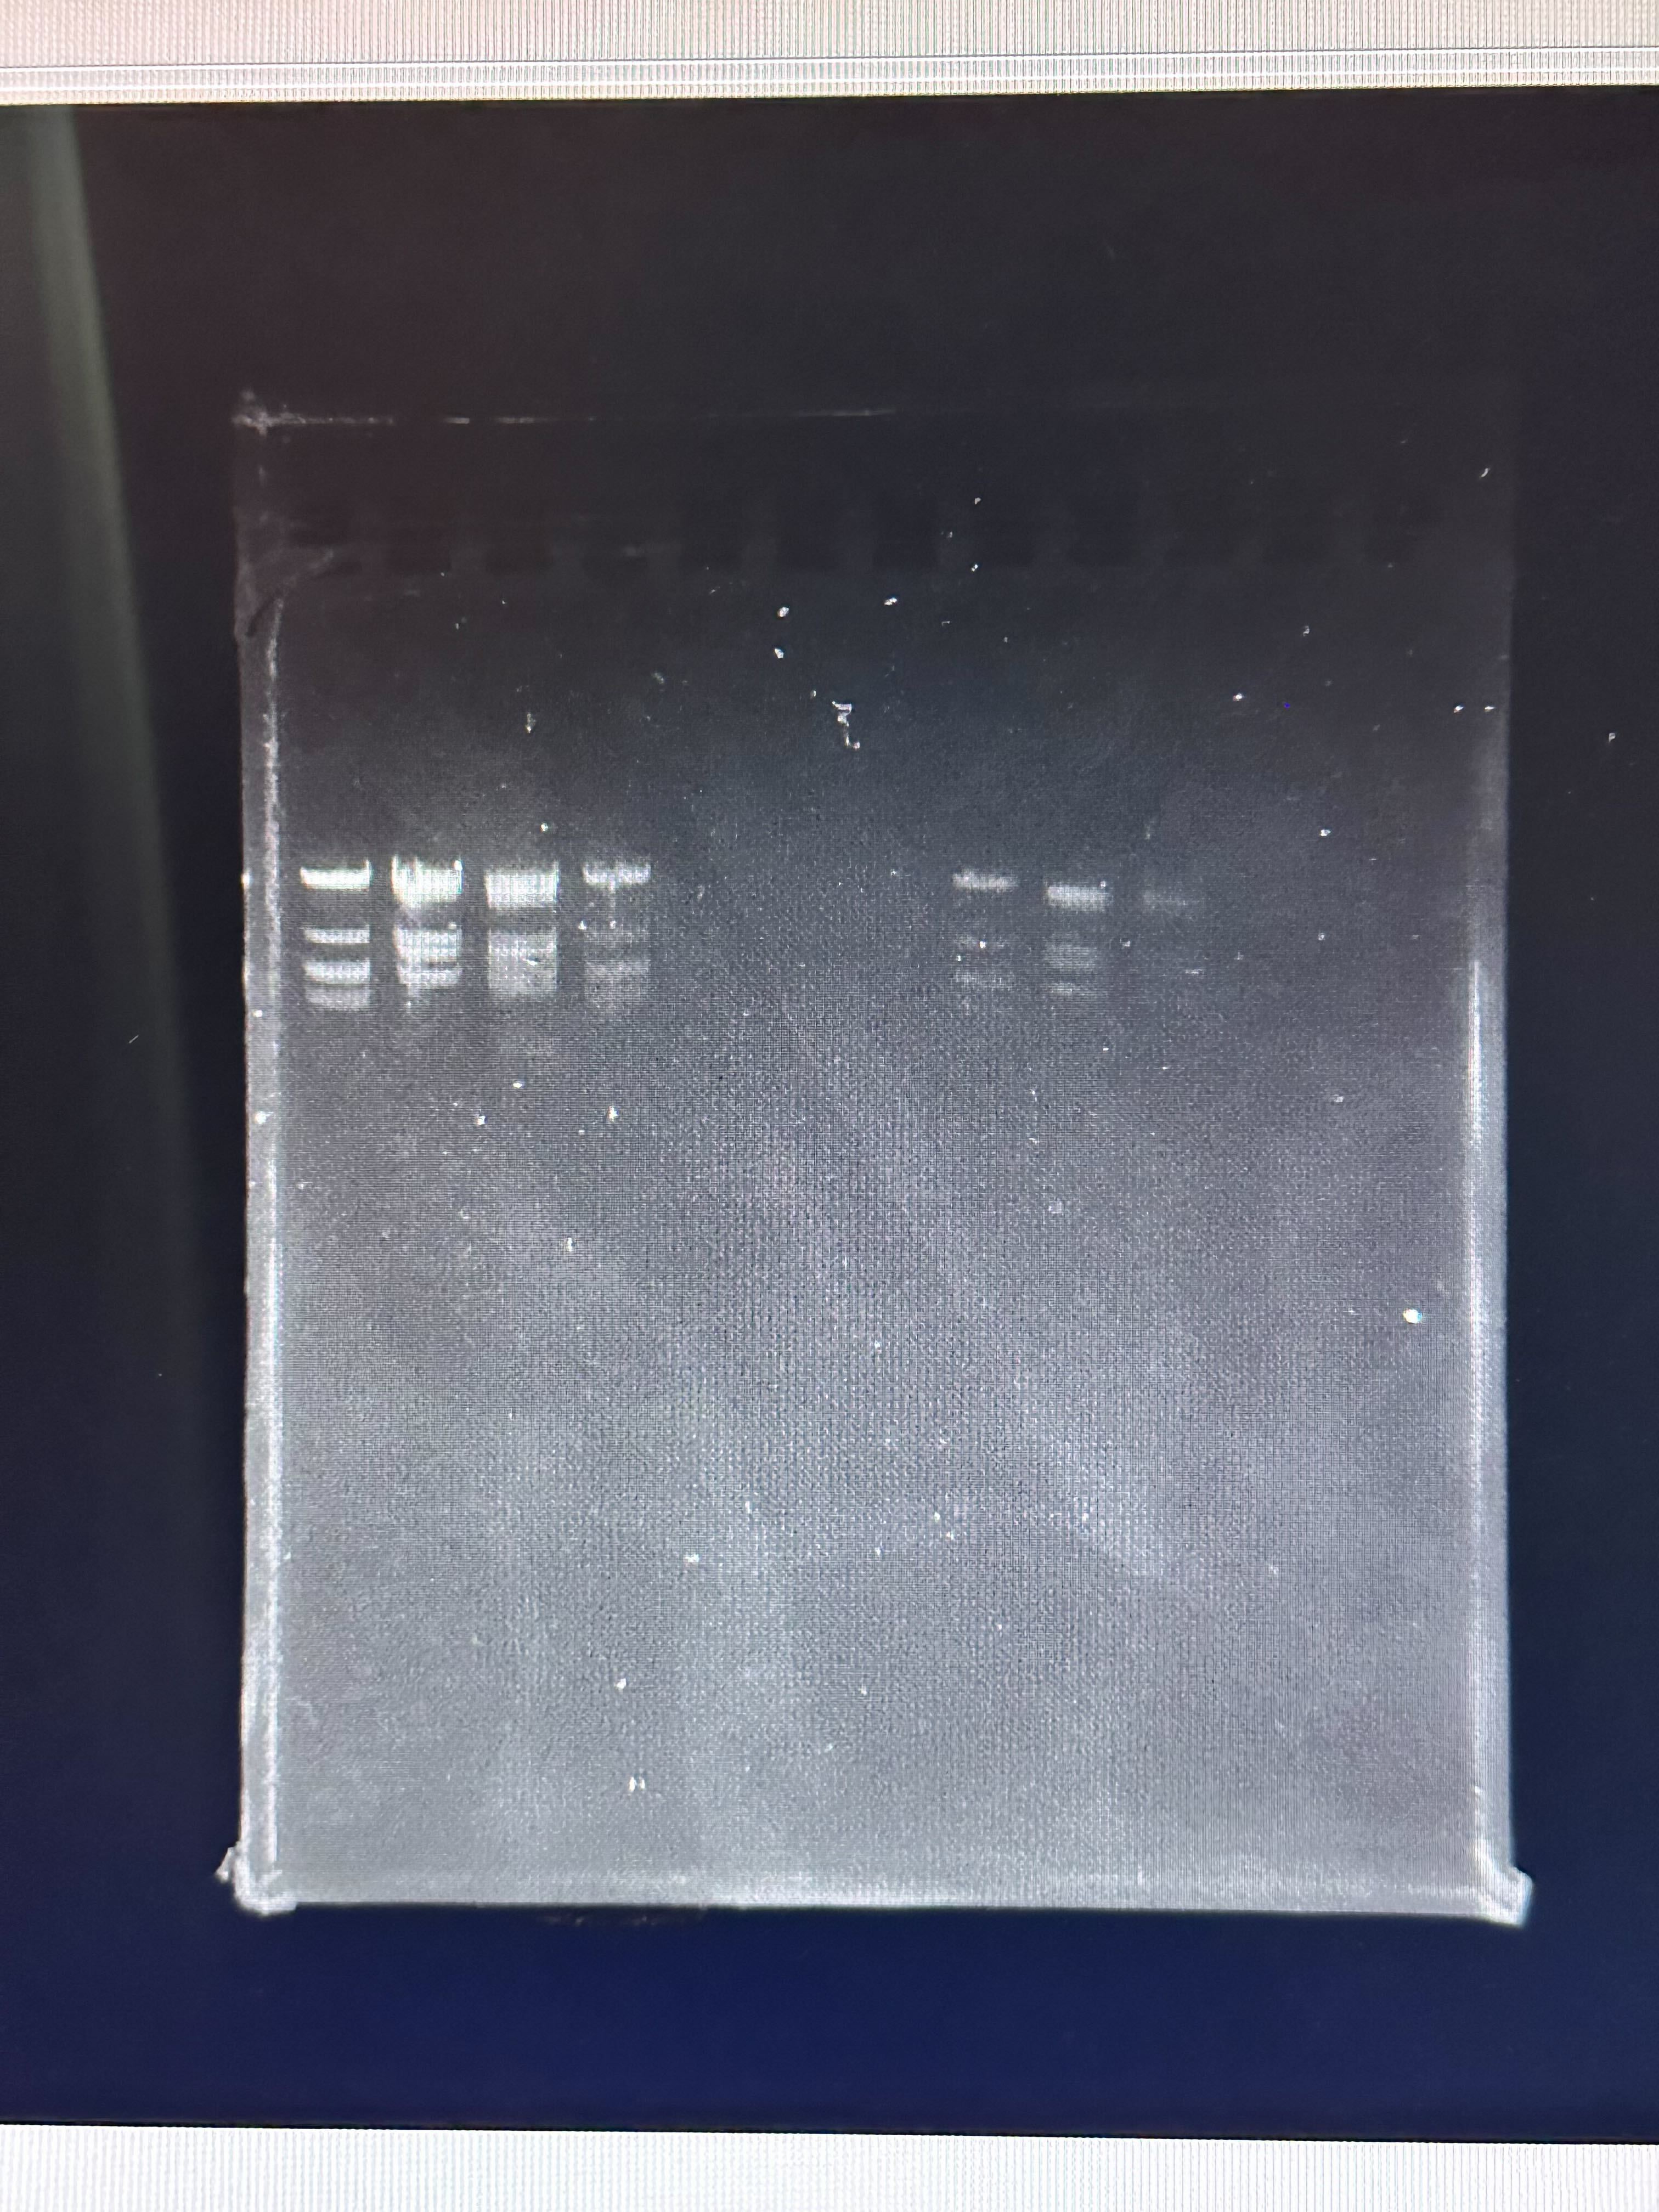
Observed Result
The final gel image obtained experimentally is shown below.
Compare it with our desired art:
Comparison and Analysis
Differences Observed
Band Intensity Variation
Some expected bands were faint or absent.
Uneven intensity suggests incomplete digestion or uneven DNA
loading.
Missing or Merged Bands
Some closely sized fragments appear merged.
Likely due to insufficient gel resolution or short run time.
Smearing
Slight smearing suggests partial degradation, overloading, or
suboptimal buffer conditions.
Incomplete Digestion
If enzyme activity was suboptimal (temperature, incubation time,
or enzyme degradation), uncut or partially cut DNA would appear
as unexpected higher molecular weight bands.
Gel Concentration Effects
Agarose percentage affects resolution. If not optimized for
fragment size range, smaller fragments may not separate clearly.
Running Conditions
Voltage too high can cause band distortion.
Insufficient run time reduces separation between fragments.
Why the Final Result Did Not Fully Match the Desired Design
The discrepancy between the predicted and observed gel likely results
from a combination of:
Gel percentage not optimized for expected fragment sizes
Limited electrophoresis duration
Potential enzyme inactivation or improper incubation conditions
The theoretical design assumes complete digestion, perfect
stoichiometry, and optimal gel resolution. In practice, small deviations
in enzymatic efficiency, buffer composition, or electrophoresis
parameters produce visible differences in band clarity and separation.
Conclusion
The experiment successfully demonstrated restriction digestion and
agarose gel electrophoresis. While the observed banding pattern
approximated the expected design, experimental variability led to
differences in band intensity and resolution. These discrepancies
highlight the importance of precise enzymatic handling, incubation
control, gel optimization, and electrophoresis parameters in molecular
biology workflows.