week-10-hw-Imaging-and-Measurement
Homework: Final Project
1. Identify at least one aspect of your project that you will measure.
Answer:
- The expression level of the L lactate dehydrogenase Gene
- The concentration of lactic acid
- Cell growth
2. What technologies will you use (e.g., gel electrophoresis, DNA sequencing, mass spectrometry)?
Answer: RNA sequencing, RT qPCR, and OD600 etc.
Homework: Waters Part 1 — Molecular Weight
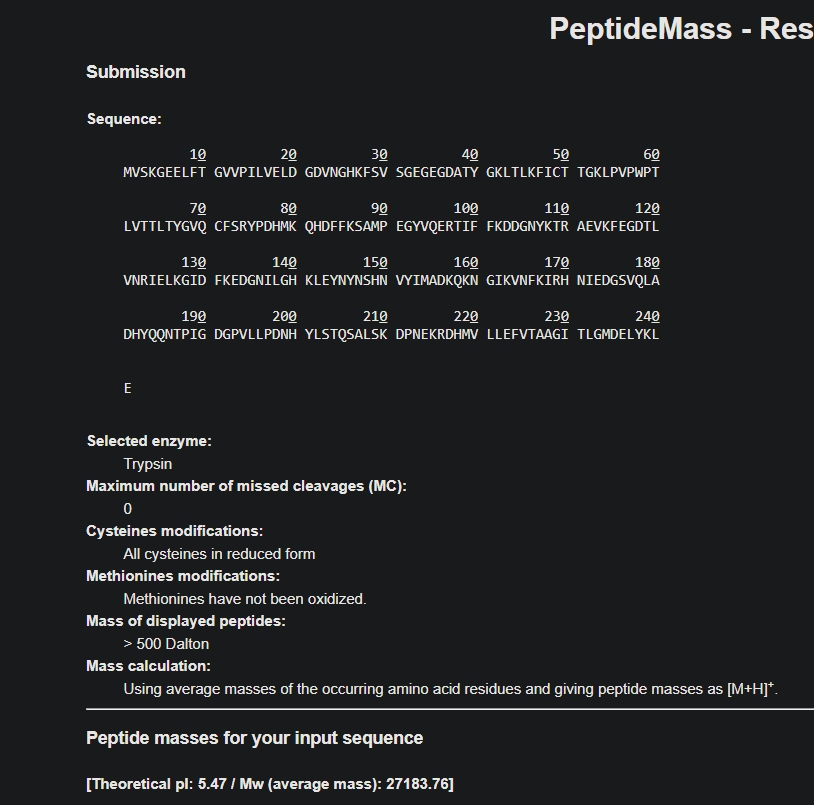
1. Based on the predicted amino acid sequence of eGFP, what is the calculated molecular weight?
Answer: 27183.76 kda (after removing the H tag)
2. Select two charge states from the BioAccord data and determine z for each.
Answer: I chose the peaks 903.7148 and 933.7349.
3. Calculate the MW of the protein using the relationship between m/z, MW, and z.
Answer:
z = (903.7148-1)/(933.7349-903.7148) = 30.07
Mw = 30.07 * (933.7319-1) = 28047.25 kda
4. Calculate the mass accuracy of the measurement.
Answer: Mass Accuracy = (|28047.25-27183.76| / 28047.25) * 1000000 = 35464.8 PPM
Homework: Waters Part 3 — Peptide Map
1. How many Lysines (K) and Arginines (R) are in eGFP?
Answer: 20 and 6
2. How many peptides will be generated from tryptic digestion of eGFP?
Answer: 19
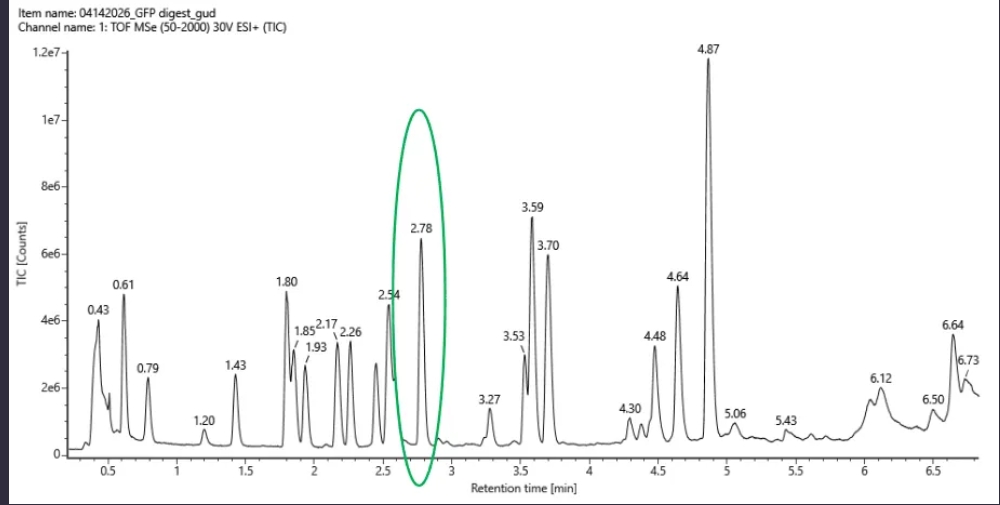
3. Based on LC-MS data, how many chromatographic peaks do you see between 0.5 and 6 minutes?
Answer: 19
4. Does the number of peaks match the number of peptides predicted?
Answer: Yes
5. Identify the m/z of the peptide shown in Figure 3b. What is the charge (z) of the most abundant charge state of the peptide? Calculate the mass of the singly charged form of the peptide ([M+H]+).
Answer:
Identify m/z
- Observed peak: 525.76
Determine charge state (z)
- Isotope spacing ≈ 0.5 Da
- Charge state: z = 2
Calculate singly charged mass ([M+H]+)
$$ M = (m/z \times z) - (z - 1) \times H^+ $$
$$ M = (525.76 \times 2) - (1 \times 1.0073) $$
$$ M \approx 1050.51 , \text{Da} $$
Final Answer
- m/z of peptide: 525.76
- Charge state: z = 2
- [M+H]+ mass: ~1050.5 Da
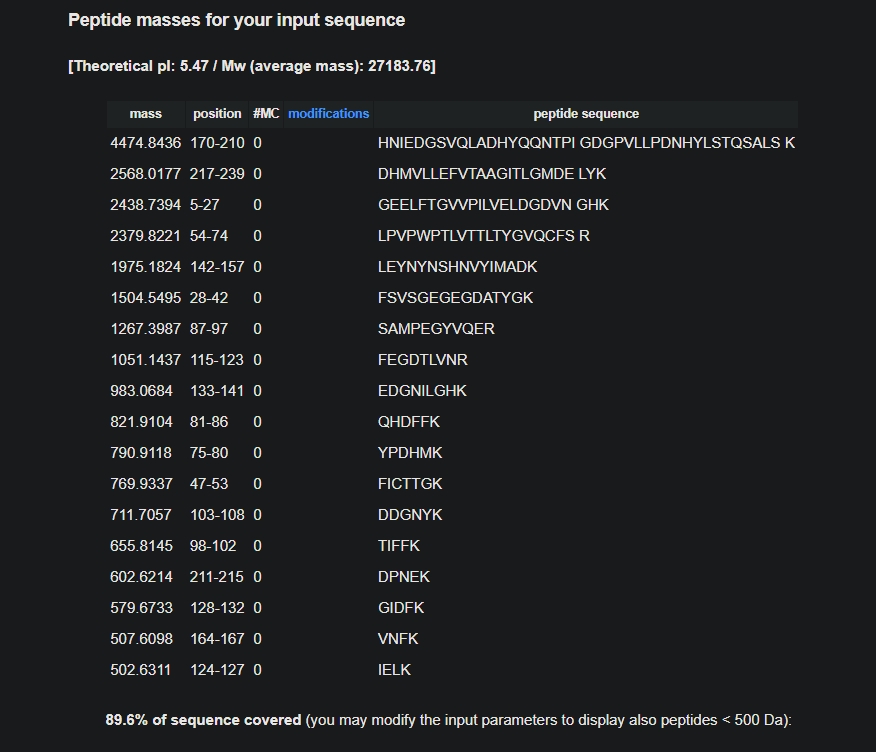
6. Identify the peptide based on MS/MS fragmentation spectrum. What is the mass accuracy of the measurement? What percentage of the sequence is confirmed by peptide mapping?
Answer:
Identify the peptide
- From the PeptideMass output, the peptide with experimental m/z ~1050.5 Da corresponds to the theoretical peptide:
- FEGDTLVNR
- Theoretical mass: 1051.1437 Da
Calculate mass accuracy (error in ppm)
Formula:
[ \text{Accuracy (ppm)} = \frac{|MW_{exp} - MW_{theory}|}{MW_{theory}} \times 10^6 ]
Values:
- (MW_{exp} = 1050.51)
- (MW_{theory} = 1051.1437)
Calculation:
[ \text{Accuracy} = \frac{|1050.51 - 1051.1437|}{1051.1437} \times 10^6 ]
[ \text{Accuracy} \approx \frac{0.6337}{1051.1437} \times 10^6 ]
[ \text{Accuracy} \approx 603 , \text{ppm} ]
Sequence coverage
- Peptide mapping confirms 89.6% of the sequence is covered by identified peptides
Final Answer
- Identified peptide: FEGDTLVNR
- Mass accuracy (error): ~603 ppm
- Sequence coverage: 89.6%
Homework: Waters Part 3 — Oligomers
**1. We will determine Keyhole Limpet Hemocyanin (KLH)’s oligomeric states using charge detection mass spectrometry (CDMS). CDMS single-particle measurements of KLH allow us to make direct mass measurements to determine what oligomeric states (that is, how many protein subunits combine) are present in solution. Using the known masses of the polypeptide subunits (Table 1) for KLH, identify where the following oligomeric species are on the spectrum shown below from the CDMS:
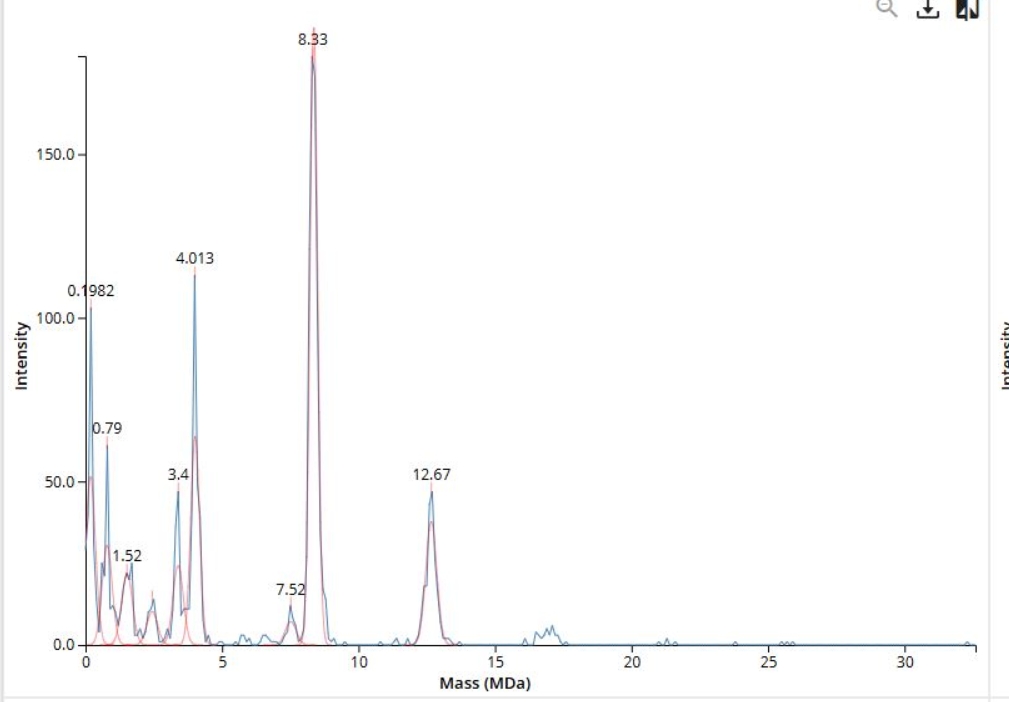
7FU Decamer 8FU Didecamer 8FU 3-Decamer 8FU 4-Decamer
| Polypeptide Subunit Name | Subunit Mass |
|---|---|
| 7FU | 340 kDa |
| 8FU | 400 kDa |
Answer:
Known Subunit Masses
- 7FU = 340 kDa
- 8FU = 400 kDa
Oligomer Mass Calculations
- 7FU Decamer = 3.40 MDa
- 8FU Didecamer = 8.00 MDa
- 8FU 3-Decamer = 12.00 MDa
- 8FU 4-Decamer = 16.00 MDa
Match to Spectrum Peaks
- 3.40 MDa → 7FU Decamer
- 8.33 MDa → 8FU Didecamer
- 12.67 MDa → 8FU 3-Decamer
- ~16.0 MDa → 8FU 4-Decamer (expected beyond shown range)
Final Answer
- 7FU Decamer: 3.40 MDa peak
- 8FU Didecamer: 8.33 MDa peak
- 8FU 3-Decamer: 12.67 MDa peak
- 8FU 4-Decamer: ~16.0 MDa (expected)
Homework: Waters Part 4 — Did I make GFP?
| Theoretical | Observed/Measured on Intact LC-MS | PPM Mass Error | |
|---|---|---|---|
| Molecular Weight (kDa) | 27183.76 | 28047.25 | 35464.8 |
Due to such a large error, I conclude that I did not make GFP.