Week 10 HW: Advanced Imaging & Measurement Technology
Homework: Final Project Measurement Draft
- Please identify at least one (ideally many) aspect(s) of your project that you will measure. It could be the mass or sequence of a protein, the presence, absence, or quantity of a biomarker, etc.
For the experimental validation of Project Aero-Sentry, several distinct biological and biochemical components must be measured to ensure the engineered probiotic nasal spray functions as intended. First, the transcriptional activity and expression level of the chimeric EnvZ receptor must be quantified to confirm successful membrane integration. Second, the binding affinity and kinetic interaction between this engineered receptor and the target allergen, Bet v 1, must be measured to verify the precision of the sensory mechanism. Third, the transcriptional output of the sense-and-respond genetic circuit must be monitored, specifically tracking the induction of the Nb32ILZ nanobody gene under the control of the osmolarity-responsive pOmpF promoter. Finally, the total concentration of the secreted Nb32ILZ fusion nanobody in the extracellular environment must be measured alongside its ultimate neutralization efficiency when bound to Bet v 1, confirming that the therapeutic countermeasure is produced in effective quantities.
- Please describe all of the elements you would like to measure, and furthermore describe how you will perform these measurements.
Each target element within the genetic circuit requires a distinct biophysical or molecular assay to validate its performance. To measure the transcription of the chimeric receptor and the Nb32ILZ nanobody genes, cellular RNA will be isolated following allergen exposure and analyzed to determine relative fold-induction changes. To confirm that the physical proteins are properly translated, stable, and of the correct molecular weight, protein expression will be measured by evaluating cell lysates and supernatant fractions using molecular weight separation techniques paired with target-specific antibody probes. The physical binding kinetics of both the receptor-allergen interface and the nanobody-allergen interface will be measured by immobilizing the target allergen on a sensor surface and flowing the engineered binding domains over it to track molecular association and dissociation in real time. Lastly, the absolute quantity of the therapeutic nanobody secreted into the surrounding media will be determined using an antibody-coated plate assay that captures and quantifies the protein based on standard concentration curves.
- What are the technologies you will use (e.g., gel electrophoresis, DNA sequencing, mass spectrometry, etc.)? Describe in detail.
The primary technology used to measure gene transcription levels will be quantitative Reverse Transcription Polymerase Chain Reaction (qRT-PCR), which will amplify cDNA reverse-transcribed from the bacterial mRNA to quantify expression changes relative to housekeeping controls. To confirm protein translation and size, sodium dodecyl sulfate-polyacrylamide gel electrophoresis (SDS-PAGE) will be paired with Western blotting, allowing the visualization of the chimeric receptor and the secreted nanobody via anti-His tag antibodies directed at their engineered purification tags. Surface Plasmon Resonance (SPR) technology will be utilized to measure the precise binding kinetics, calculating the association rate (kon), dissociation rate (koff), and overall equilibrium dissociation constant (Kd) of Bet v 1 interaction with both the chimeric EnvZ receptor and the Nb32ILZ nanobody. Finally, an Enzyme-Linked Immunosorbent Assay (ELISA) will be implemented using a sandwich format to provide a highly sensitive, high-throughput colorimetric readout of the exact concentration of neutralizing nanobodies secreted by the engineered bacteria over time.
Homework: Waters Part I — Molecular Weight
- Based on the predicted amino acid sequence of eGFP and any known modifications, what is the calculated molecular weight?
Using the provided eGFP amino acid sequence containing the LE linker and 6xHis tag, the ExPASy Compute pI/Mw tool yields an initial theoretical average molecular weight of 28,006.60 Da and a theoretical pI of 5.90. Because mature eGFP forms an internal chromophore structure during folding, it undergoes a post-translational modification resulting in a known mass loss of approximately 20 Da. Accounting for this maturation step (28,006.60 Da - 20 Da), the calculated theoretical molecular weight for the mature protein is determined to be 27,986.60 Da (or roughly 27.99 kDa).
- Calculate the molecular weight of the eGFP using the adjacent charge state approach described in the recitation. Select two charge states from the intact LC-MS data (Figure 1).
Selecting two adjacent charge-state peaks from the intact LC-MS spectrum at 875.4421 and 848.9758 m/z, the charge state is calculated as
z = 848.9758 / (875.4421 - 848.9758), which rounds toz = 32for the 875.4421 peak andz = 33for the 848.9758 peak. Deconvoluting the mass to account for proton ionization using the relationshipMW = z(m/z - 1.0073)yields an experimental mass of 32 × (875.4421 - 1.0073) = 27,981.9 Da. Comparing this measured molecular weight of 27,982 Da against the mature theoretical mass yields a fractional error of|27,982 - 27,986.6| / 27,986.6, which equals approximately 0.016 percent error (or 160 ppm).
- Does the zoomed-in peak around 1473.7 m/z still show a charge state? Determine the charge state and explain how it relates to the isotope spacing.
Analysis of the zoomed-in spectral envelope around 1473.7 m/z confirms a distinct multivalent charge state. Given that the calculated intact molecular weight of the eGFP sample is approximately 27,982 Da, dividing this mass by the local peak coordinate (
27,982 / 1473.7) yields a value of roughly 19. This calculation identifies the region as representing the+19charge state. This assignment is supported by the physical isotope spacing of the cluster, as the individual isotopic peaks for a+19ion are separated by an expected interval of approximately1/19m/z.
Homework: Waters Part II — Secondary/Tertiary structure
This portion was optional and therefore skipped.
Homework: Waters Part III — Peptide Mapping - primary structure
- How many Lysines (K) and Arginines (R) are in eGFP? Please circle or highlight them in the eGFP sequence given in Waters Part I question 1 above.
Sequence analysis of the eGFP construct indicates the presence of 20 lysine (K) residues and 6 arginine (R) residues distributed across the polypeptide chain.
MVSKGEELFTG VVPILVELDG DVNGHKSVS GEGEGDATYG KLTLKFICTT GKLPVPWPTL VTTLTYGVQC FSRYPDHMKQ HDFFKSAMPE GYVQERTIFF KDDGNYKTRA EVKFEGDTLV NRIELKGIDF KEDGNILGHK LEYNYNSHNV YIMADKQKNG IKVNFKIRHN IEDGSVQLAD HYQQNTPIGD GPVLLPDNHY LSTQSALSKD PNEK====RDHMVL LEFVTAAGIT LGMDELYKLE HHHHHH
- How many peptides will be generated from tryptic digestion of eGFP?
Running the primary sequence through the ExPASy PeptideMass tool under the specified cleavage parameters generates a predicted total of 19 distinct tryptic peptides with molecular weights above the 500 Da threshold.
- Based on the LC-MS data for the Peptide Map data generated in lab (please use Figure 5a as a reference) how many chromatographic peaks do you see in the eGFP peptide map between 0.5 and 6 minutes? You may count all peaks that are >10% relative abundance.
The total ion chromatogram (TIC) exhibits approximately 20 distinct peptide peaks between the 0.5 and 6-minute retention time windows that register above the 10% relative abundance threshold.
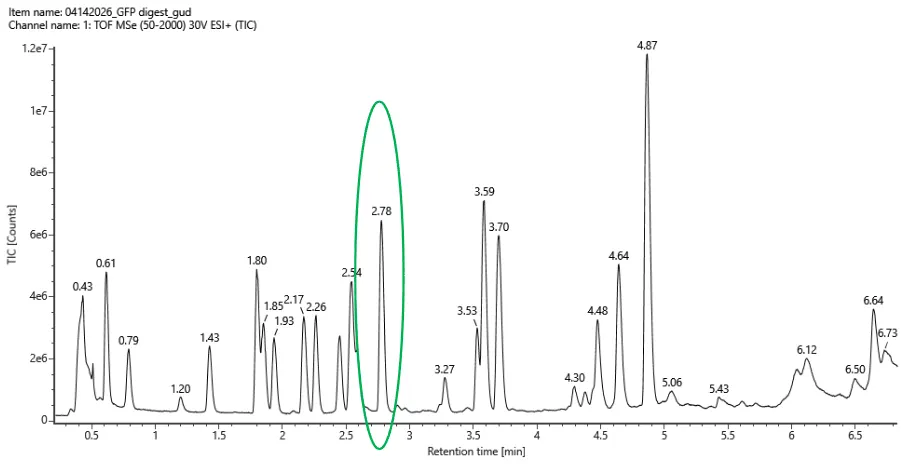
- Assuming all the peaks are peptides, does the number of peaks match the number of peptides predicted from question 2 above? Are there more peaks in the chromatogram or fewer?
The observed count of 20 peaks is closely aligned with the predicted 19 peptides, yielding a slight excess of chromatographic signals. This minor variance is typical in LC-MS maps due to factors like chemical noise, sample impurities, unexpected missed cleavages, or differential ionization efficiencies.
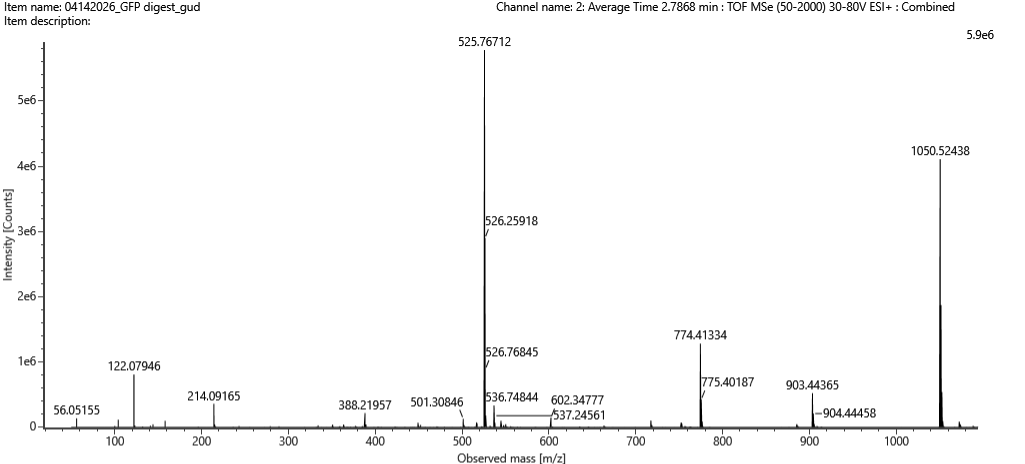
- Identify the mass-to-charge (m/z) of the peptide shown in Figure 5b. What is the charge (z) of the most abundant charge state of the peptide (use the separation of the isotopes to determine the charge state). Calculate the mass of the singly charged form of the peptide ([M + H]+) based on its m/z and z.
The primary monoisotopic signal centers at 525.76712 m/z. Because the fine isotope spacing within the spectral cluster is roughly 0.5 m/z, the predominant charge state is identified as
z = 2. Applying the conversion formula adjusts for the ionizing protons, yielding a calculated singly charged monoisotopic mass of approximately 1050.5269 Da.
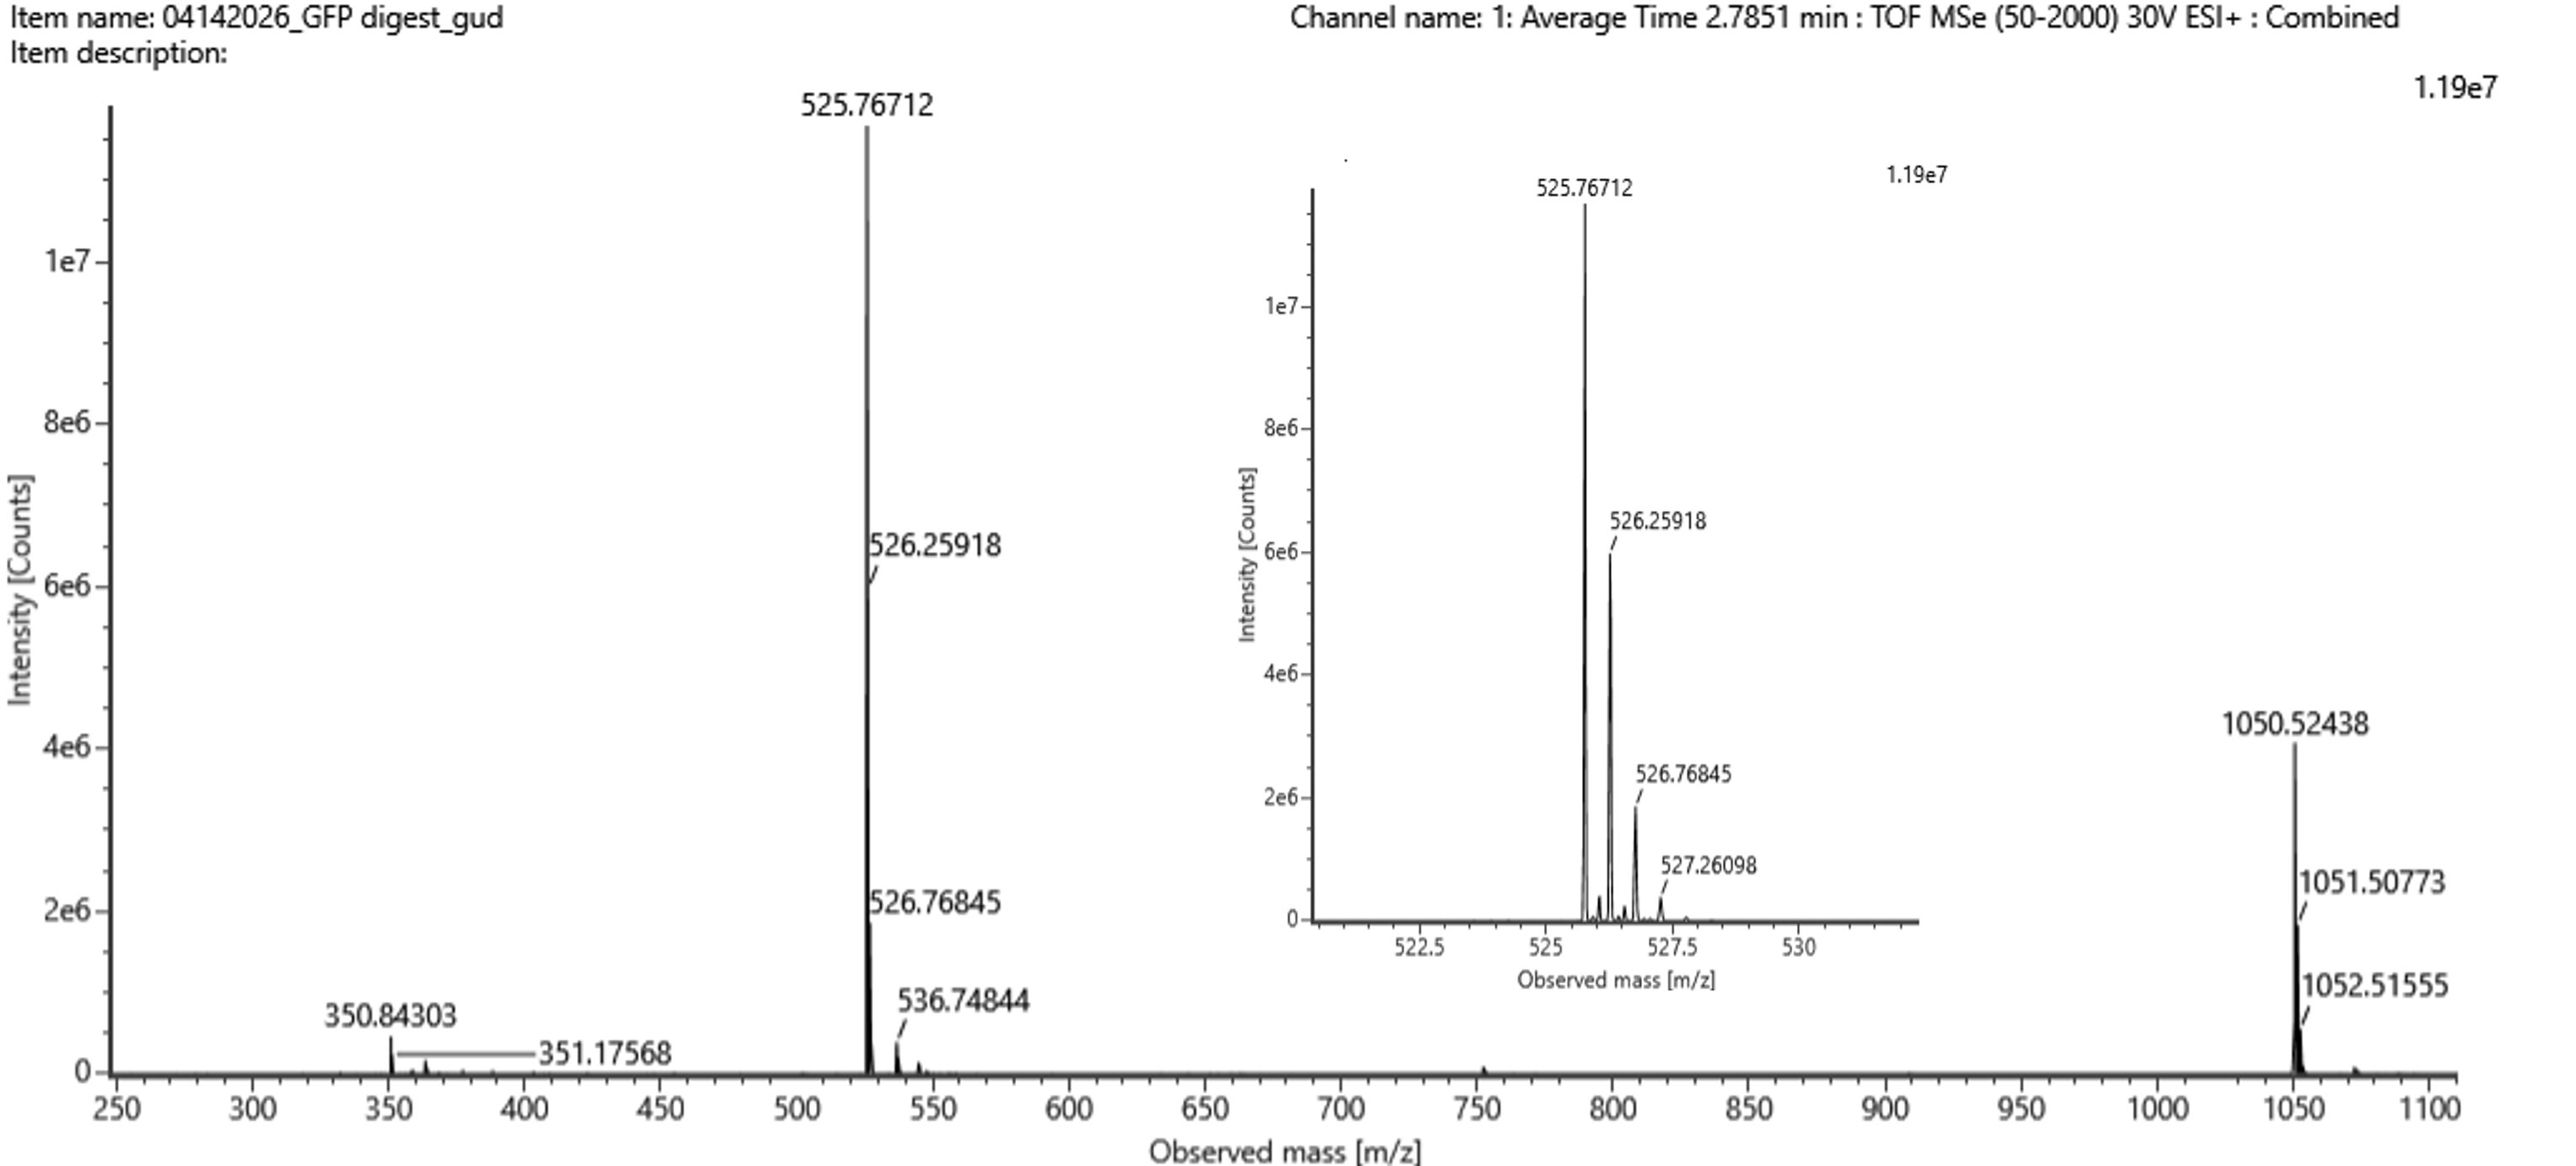
- Identify the peptide based on comparison to expected masses in the PeptideMass tool. What is mass accuracy of measurement? Please calculate the error in ppm.
Cross-referencing the calculated 1050.5269 Da mass with the theoretical PeptideMass digestion matrix matches the fragment sequence
FEGDTLVNR, which possesses an absolute theoretical mass of 1050.5214 Da. Comparing the measured value against this baseline reveals a tight mass accuracy variance of roughly 2.0 ppm.
- What is the percentage of the sequence that is confirmed by peptide mapping?
According to the amino acid coverage map generated from the experimental BioAccord LC-MS run data, the overall confirmed primary sequence coverage stands at 88%.
Homework: Waters Part IV — Oligomers
General homework questions/answers
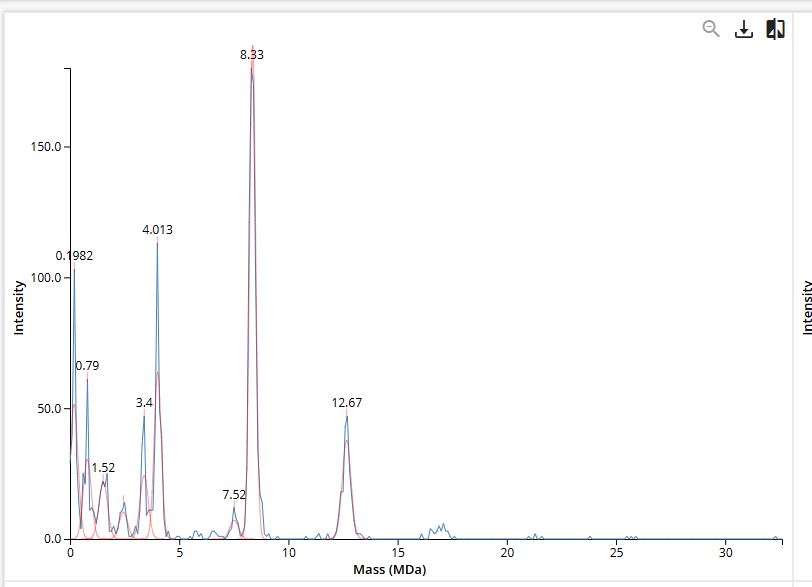
- Using the known masses of the polypeptide subunits (Table 1) for KLH, identify where the following oligomeric species are on the spectrum shown below from the CDMS (Figure 7): 7FU Decamer, 8FU Didecamer, 8FU 3-Decamer, and 8FU 4-Decamer.
The structural mass for each oligomeric state is calculated by multiplying the base subunit mass by the total number of associated subunits. Based on these calculations, the expected positions and observed peak correlations on the CDMS spectrum are resolved as follows:
| Oligomeric Species | Calculation | Theoretical Mass | Observed Peak Position |
|---|---|---|---|
| 7FU Decamer | 10 × 340 kDa | 3,400 kDa | ~3.4 MDa (Strong signal) |
| 8FU Didecamer | 20 × 400 kDa | 8,000 kDa | ~8.33 MDa (Strong signal) |
| 8FU 3-Decamer | 30 × 400 kDa | 12,000 kDa | ~12.67 MDa (Strong signal) |
| 8FU 4-Decamer | 40 × 400 kDa | 16,000 kDa | ~16.00 MDa (Weak / low abundance) |
In the experimental CDMS trace, the highest intensity distributions map directly to the 7FU decamer (~3.4 MDa), the 8FU didecamer (~8.33 MDa), and the 8FU 3-decamer (~12.67 MDa). The 8FU 4-decamer assembly aligns with the theoretical 16.00 MDa boundary but displays very weak relative abundance and lower resolution within the provided spectrum.
Homework: Waters Part V — Did I make GFP?
Please fill out this table with the data you acquired from the lab work done at the Waters Immerse Lab in Cambridge, or else the data screenshots in this document if you were unable to have lab work done at Waters.
| Parameter | Theoretical | Observed/measured on the Intact LC-MS | PPM Mass Error |
|---|---|---|---|
| Molecular weight (kDa) of FEGDTLVNR | 1050.5214 | 1050.511 | 9.90 ppm |
Info
I was unable to attend Waters as a CL, so I obtained this data from other students.