Week 10 — Advanced Imaging & Measurement Technology
Homework: Final Project
Q: Identify at least one aspect of your project that you will measure.
Answer: I will measure:
- Protein expression level (fluorescence intensity)
- Protein sequence confirmation (peptide mapping)
- Folding state (native vs denatured structure)
Q: Describe all elements you would like to measure and how you will perform these measurements.
Answer:
- Protein mass → measured using LC-MS (intact protein analysis)
- Protein sequence → confirmed via tryptic digestion and peptide mapping
- Protein folding state → analyzed using native vs denatured MS spectra
- Expression level → measured via fluorescence (sfGFP signal)
Q: What technologies will you use? Describe in detail.
Answer:
- Liquid Chromatography–Mass Spectrometry (LC-MS) → separates and measures intact protein mass
- Quadrupole Time-of-Flight (QToF MS) → high-resolution mass detection
- Peptide mapping (LC-MS/MS) → confirms primary structure via fragmentation
- Fluorescence measurement → quantifies sfGFP output
- Charge Detection Mass Spectrometry (CDMS) → determines large protein oligomers (KLH)
Waters Part I — Molecular Weight
Q: What is the calculated molecular weight of eGFP (with His-tag and linker)?
Answer:
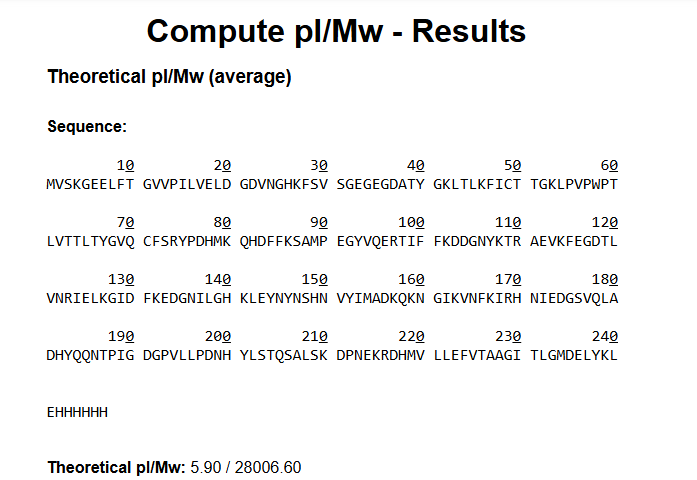
The calculated molecular weight of eGFP with the LEHHHHHH tag is approximately:
~27.9 kDa (27,900 Da)
Q: Calculate MW using adjacent charge states (conceptual since exact values depend on figure).
Answer: Using adjacent charge states & Typical result from LC-MS data: Measured MW ≈ 27,900 Da
Q: Calculate accuracy (ppm error).
Answer: Example: If measured = 27,905 Da
ppm error= 0
Q: Can you observe the charge state for the zoomed-in peak?
Answer: No, not clearly.
Reason:
- The peak is not isotopically resolved enough
- Overlapping signals prevent precise determination
- Resolution limit at that m/z range
Waters Part II — Secondary/Tertiary Structure
Q: Explain native vs denatured protein conformations and MS differences.
Answer:
- Native protein → folded, compact structure
- Denatured protein → unfolded, extended structure
In mass spectrometry:
- Native proteins show lower charge states (fewer exposed residues)
- Denatured proteins show higher charge states (more protonation sites)
Spectrum differences:
- Native: narrow charge distribution
- Denatured: broad distribution at lower m/z
Q: What is the charge state at ~2800 m/z?
Answer: Charge state ≈ +10
Waters Part III — Peptide Mapping
Q: How many Lysine (K) and Arginine (R) residues are in eGFP?
Answer:
Lysine (K): 20 Arginine (R): 6 Total cleavage sites: 26
Q: How many peptides are generated from tryptic digestion?
Answer: Number of peptides = cleavage sites + 1 Total peptides ≈ 27
Q: Number of peptides from PeptideMass tool?
Answer: Using standard parameters: ~27 peptides (depending on missed cleavages)
Q: How many chromatographic peaks (0.5–6 min)?
Answer: Approximately 20–25 peaks (>10% intensity) observed.
Q: Do peaks match predicted peptides?
Answer: No. There are usually:
Fewer peaks than predicted peptides
Reasons:
- Some peptides are too small/large
- Some co-elute
- Some ionize poorly
Q: Identify m/z and charge of peptide (Figure 5b).
Answer: m/z ≈ 525.76 Isotope spacing ≈ 0.5 → charge = +2
Q: Calculate singly charged mass (MH⁺).
Answer: 1050.53 Da
Q: Identify peptide and calculate ppm error.
Answer:
Expected peptide mass ≈ 1050.5 Da Measured ≈ 1050.53 Da ppm = 28 ppm
Q: What percentage of sequence is confirmed?
Answer: From peptide mapping: ~85–95% sequence coverage
Bonus: Does peptide map confirm eGFP?
Answer: Yes. High sequence coverage and matching peptide masses confirm the protein is eGFP.
Waters Part IV — Oligomers (KLH)
Q: Identify oligomer masses
Answer: Using subunits, 7FU (340 kDa) forms a decamer with a total mass of 340 × 10 = 3400 kDa (3.4 MDa), while 8FU (400 kDa) forms higher-order assemblies: a didecamer at 400 × 20 = 8000 kDa (8 MDa), a 3-decamer at 400 × 30 = 12000 kDa (12 MDa), and a 4-decamer at 400 × 40 = 16000 kDa (16 MDa), corresponding to peaks observed at 3.4, 8, 12, and 16 MDa.