Week 10: Advanced Imaging and Measurment Technology
What happened to my brain?
The Only Question -RCBeck
Final Project Homework
For your final project:
- Please identify at least one (ideally many) aspect(s) of your project that you will measure. It could be the mass or sequence of a protein, the presence, absence, or quantity of a biomarker, etc.
Aim One: Initial Transformation
- The first aim of this project transforms a strain of Synechococcus elongatus 7942 (PCC7942) into the sucrose secreting, model organism S. elongatus cscB+. The original PCC7942 colony will need to be grown to an optical density (OD) 750 of ≥1 before transformation may take place. A spectrophotometer will be used to obtain this measurement.
- First growth media needs to be prepared, which will require measuring agar, BG11 medium, AS Trace Elements, water, pH, and temperature. Plates are poured, streaked and incubated. Colonies are then selected and transfereed to new grow media.
- Colonies are incubated until an OD of 750 is reached, then natural transformation may take place. - Following procedure, we will use GeneArt® Synechococcus Engineering Kit 14259 to preform natural transformation of S. 7942 into s7942 cscB+.
- Transformed samples are then recultured with spectinomycin treated plates, selecting for transformed colonies.
- Gel electrophoresis will confirm transformation. - Sub-Aim: Optimize growth conditions: Growth of transformed S.7942 cscB+ to be tested with NaCL, KCl, and salt free conditions. Essay will allow selection of optimal lighting for S.7942 cscB+ and influence of salts (Fig 1.).
Figure 1. Comparitive analysis of s. 7942 growth under NaCl, KCl, fluorescent and LED light respectively.
Aim Two: Co-culture Optimization
- Setting up the co-culture between S. 7942 cscB+ with chromo-protein E. coli. This phase will test model organism S. 7942 cscB+ with diffent starting concentrations of E. coli chromo-protein on LB agar plates prepared with BG-11 media as control.
- Positive control plate A will measure colony growth under control IPTG with NaCl induced stress.
- Positive control plate B will measure colony growth under control IPTG with KCl induced stress.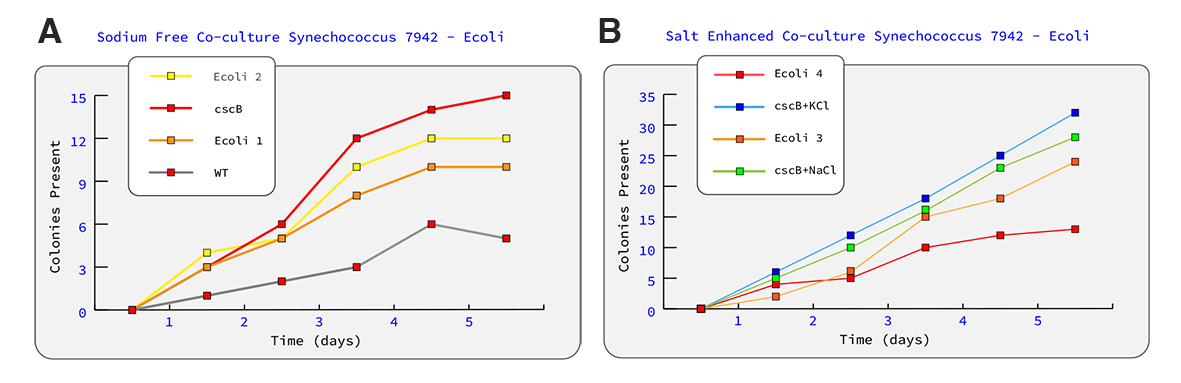 Figure 2. Comparitive analysis of S. 7942 under co-culture with E. coli chromo-protein.
Aim Three: Reactor Optimization
- Testing the co-culture system with photo-negative plates. 14 day trial culture.
- Adjusting/modifying bio-reactor setup to optimize reactions. We will be measuring DO, pH, light intensity (EV), temperature, salt, nitrate, and chelated iron concentrations.
- Nutrient essays will confirm optimal conditions relative to visual inspections of co-culture under salt stress, and IPTG. - Successful co-cultures will then undergo a stasis study where pH, temperature, DO, light, and nutrient concentrations are tested without control of negative imaging plate.
- Goal is to optimize life support conditions for long term display of cultures with minimal image distortion.
Waters Part I — Molecular Weight
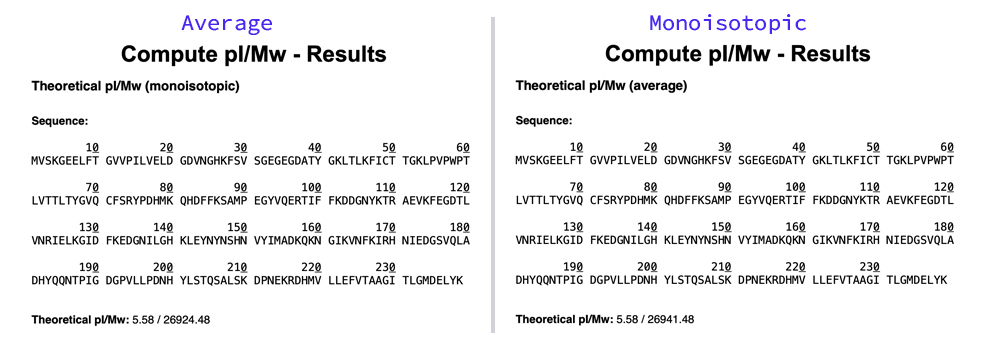
- Based on the predicted amino acid sequence of eGFP (see below) and any known modifications, what is the calculated molecular weight?
- Results based on calculator for average and monoisotopic:
- Calculate the molecular weight of the eGFP using the adjacent charge state approach described in the recitation. Select two charge states from the intact LC-MS data (Figure 1):
- To calcultate MW using master charge states (left)= 848.9758, and (right)= 875.4421 we calculate for n:
- n = (848.9758-1)/(875.4421-848.9758)
- n = 847.9758/26.4663
- n = 32.0398
- MW = (32.0398 x 875.4421 - 32.0398)
- MW = 28,016.9499
- Comparatively to the calculator’s weight, there’s 1,092.46 difference between my calculation and the average MW value of 26924.48.
- Accuracy = (MWexp - MWtheory)/MWtheory
- Accuracy = (28,016.9499 - 26,924.48)/26,924.48
- Accuracy = .0405
- Accuracy = .0405 x 1000000
- Accuracy = 40500 Definately something wrong here.
- Calculated again using different peaks and ended up with 36,972… obviously, there’s a problem with the way I’m calculating this.
- I adjsuted theoretical weight to include His tag and linker which changed score to 344, which is better, but still way outside target range.
Waters Part III — Peptide Mapping - primary structure
- How many Lysines (K) and Arginines (R) are in eGFP? Please circle or highlight them in the eGFP sequence given in Waters Part I question 1 above.
- Benchling Lysine (K) count is: 20
- Benchling Arginine (R) count: 6
- MVSKGEELFTG VVPILVELDG DVNGHKFSVS GEGEGDATYG KLTLKFICTT GKLPVPWPTL VTTLTYGVQC FSRYPDHMKQ HDFFKSAMPE GYVQERTIFF KDDGNYKTRA EVKFEGDTLV NRIELKGIDF KEDGNILGHK LEYNYNSHNV YIMADKQKNG IKVNFKIRHN IEDGSVQLAD HYQQNTPIGD GPVLLPDNHY LSTQSALSKD PNEKRDHMVL LEFVTAAGIT LGMDELYK
- How many peptides will be generated from tryptic digestion of eGFP?
- There are nineteen masses generated from the tryptic digestion.
- There are nineteen masses generated from the tryptic digestion.
- Based on the LC-MS data for the Peptide Map data generated in lab (please use Figure 5a as a reference) how many chromatographic peaks do you see in the eGFP peptide map between 0.5 and 6 minutes?
- In the graph, the base peak has is equal to 24 units on the y scale. 10% of 24 is 2.4.
- There are nineteen peaks over 10%, or 2.4 on the y scale in between .5 and 6 minutes.
- Assuming all the peaks are peptides, does the number of peaks match the number of peptides predicted from question 2 above?
- Yes! There are 19.
- Identify the mass-to-charge (m/z) of the peptide shown in Figure 5b. What is the charge (z) of the most abundant charge state of the peptide (use the separation of the isotopes to determine the charge state). Calculate the mass of the singly charged form of the peptide ([M+H]+) based on its m/z and z.
- We use values of the peakes in fig 5b. which are: 526.25918 (right peak) and 525.76712 (left peak) to calcultate charge state:
- 526.25918 - 525.76712 = .49206
- 1/.49206 = 2.0322
- Charge state = 2
- Identify the peptide based on comparison to expected masses in the PeptideMass tool. What is mass accuracy of measurement?
- Based on the charge state comparison, the single charge state is 1050.
- Therefore this should be the peptide: FEGDTLVNR, with mass of 1050.5214, position 115-123
- Mass accuracy = [(1050.53438 - 1050.5214)/1050.5214] x 1,000,000
- Mass accuracy = 2.83 ppm
- What is the percentage of the sequence that is confirmed by peptide mapping?
- According to Expasy Mass Peptide results, we covered 90.7%.
Waters Part IV — Oligomers
Using the known masses of the polypeptide subunits (Table 1) for KLH, identify where the following oligomeric species are on the spectrum shown below from the CDMS (Figure 7):
Waters Part V — Did I make GFP?
- Theoretical molecular weight: 27,875.41 (without start codon, average MW)
- Observed/measured on the intact LC-MS: 27,919.9307
- PPM mass error:.00159713 x 1000000 = 1597.1316 ppm
- It does not appear to be eGFP