Week 10 — Imaging and measurement
Homework: Waters Part I — Molecular Weight
We will analyze an eGFP standard on a Waters Xevo G3 QTof MS system to determine the molecular weight of intact eGFP and observe its charge state distribution in the native and denatured (unfolded) states. The conditions for LC-MS analysis of intact protein cause it to unfold and be detected in its denatured form (due to the solvents and pH used for analysis).
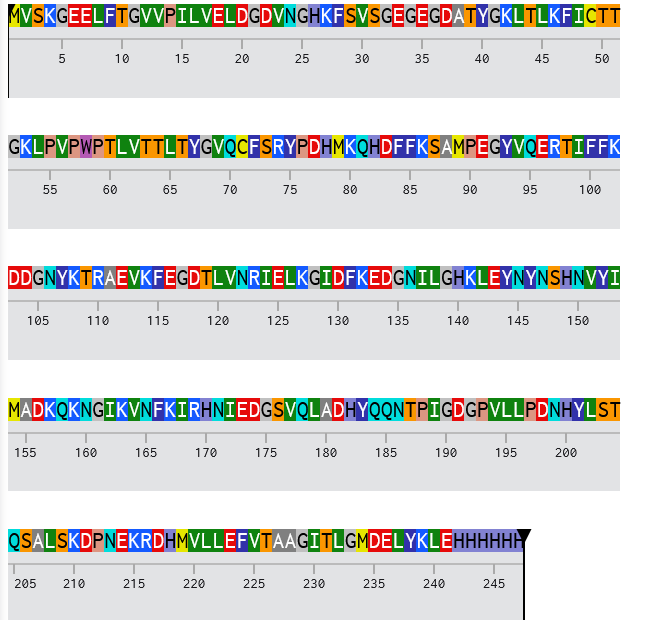
1. Based on the predicted amino acid sequence of eGFP (see below) and any known modifications, what is the calculated molecular weight? You can use an online calculator like the one at https://web.expasy.org/compute_pi/
eGFP Sequence: MVSKGEELFTG VVPILVELDG DVNGHKFSVS GEGEGDATYG KLTLKFICTT GKLPVPWPTL VTTLTYGVQC FSRYPDHMKQ HDFFKSAMPE GYVQERTIFF KDDGNYKTRA EVKFEGDTLV NRIELKGIDF KEDGNILGHK LEYNYNSHNV YIMADKQKNG IKVNFKIRHN IEDGSVQLAD HYQQNTPIGD GPVLLPDNHY LSTQSALSKD PNEKRDHMVL LEFVTAAGIT LGMDELYKLE HHHHHH Note: This contains a His-purification tag (HHHHHH) and a linker (the LE before it).
After inputting into the eGFP sequence into the online calculator I get:
Theoretical pI/Mw: 5.90 / 28006.60
2. Calculate the molecular weight of the eGFP using the adjacent charge state approach described in the recitation. Select two charge states from the intact LC-MS data (Figure 1) and:
I. Determine for each adjacent pair of peaks using:
From figure 1 I picked:
m/zn: 933.7349
m/zn+1: 903.7148
Plugging in values:
z = 903.7148/(933.7349 - 903.7148)
z = 31.1037
II. Determine the MW of the protein using the relationship between m/z_n , MW, and z.
Using derivation of deconvolution for ’n’':
Top
m/zn+1 903.7148
minus 1
Top 902.7148
Bottom
m/zn 933.7349
m/zn - m/zn+1 30.0201
Therefore,
n = Top/Bottom ~ 30.07035
Therefore,
MW = (n x m/zn – n)
{(30.0703462) * (933.7349)} - 30.07035
MW = 28047.66 Da
III. Calculate the accuracy of the measurement using the deconvoluted MW from 2.2 and the predicted weight of the protein from 2.1 using:
Accuracy = |28047.66 - 28006.60|Da/(28006.60)Da
= 0.001466131 (0.15%)
3. Can you observe the charge state for the zoomed-in peak in the mass spectrum for the intact eGFP? If yes, what is it? If no, why not?
No, it is difficult to determine charged state from zoomed-in peak by itself. The isotropic peaks are not clear, therefore the space needed to identify z cannot be found.
Homework: Waters Part II — Secondary/Tertiary structure
Homework: Waters Part III — Peptide Mapping - primary structure
We will digest the eGFP protein standard into peptides using trypsin (an enzyme that selectively cleaves the peptide bond after Lysine (K) and Arginine (R) residues. The resulting peptides will be analyzed on the Waters BioAccord LC-MS to measure their molecular weights and fragmented to confirm the amino acid sequence within each peptide – generating a “peptide map”. This process is used to confirm the primary structure of the protein.
There are a variety of tools available online to calculate protein molecular weight and predict a list of peptides generated from a tryptic digest. We will be using tools within the online resource Expasy (the bioinformatics resource portal of the Swiss Institute of Bioinformatics (SIB)) to predict a list of tryptic peptides from eGFP.
- How many Lysines (K) and Arginines (R) are in eGFP? Please circle or highlight them in the eGFP sequence given in Waters Part I question 1 above. (Note: adding the sequence to Benchling as an amino acid file and clicking biochemical properties tab will show you a count for each amino acid).
After adding to benchling, I got counts & frequencies for each amino acid:
| Amino Acid | Code | Count | Percentage |
|---|---|---|---|
| Ala | A | 8 | 3.2% |
| Arg | R | 6 | 2.4% |
| Asn | N | 13 | 5.3% |
| Asp | D | 18 | 7.3% |
| Cys | C | 2 | 0.8% |
| Gln | Q | 8 | 3.2% |
| Glu | E | 17 | 6.9% |
| Gly | G | 22 | 8.9% |
| His | H | 15 | 6.1% |
| Ile | I | 12 | 4.9% |
| Leu | L | 22 | 8.9% |
| Lys | K | 20 | 8.1% |
| Met | M | 6 | 2.4% |
| Phe | F | 12 | 4.9% |
| Pro | P | 10 | 4.0% |
| Ser | S | 10 | 4.0% |
| Thr | T | 16 | 6.5% |
| Trp | W | 1 | 0.4% |
| Tyr | Y | 11 | 4.5% |
| Val | V | 18 | 7.3% |
| Pyl | O | 0 | 0.0% |
| Sec | U | 0 | 0.0% |
Lysines (K) and Arginines (R) highlighted:
MVSKGEELFTG VVPILVELDG DVNGHKFSVS GEGEGDATYG KLTLKFICTT GKLPVPWPTL VTTLTYGVQC FSRYPDHMKQ HDFFKSAMPE GYVQERTIFF KDDGNYKTRA EVKFEGDTLV NRIELKGIDF KEDGNILGHK LEYNYNSHNV YIMADKQKNG IKVNFKIRHN IEDGSVQLAD HYQQNTPIGD GPVLLPDNHY LSTQSALSKD PNEK RDHMVL LEFVTAAGIT LGMDELYKLE HHHHHH
- How many peptides will be generated from tryptic digestion of eGFP?
(i) Navigate to https://web.expasy.org/peptide_mass/
(ii) Copy/paste the sequence above into the input box in the PeptideMass tool to generate expected list of peptides.
(iii) Use Figure 4 below as a guide for the relevant parameters to predict peptides from eGFP.
(iv) Click “Perform the Cleavage” button in the PeptideMass tool and report the number of peptides generated when using trypsin to perform the digest.
Number of peptides generated: 19
| Mass (Da) | Position | #MC | Modifications | Peptide Sequence |
|---|---|---|---|---|
| 4472.1752 | 170–210 | 0 | HNIEDGSVQLADHYQQNTPIGDGPVLLPDNHYLSTQSALSK | |
| 2566.2931 | 217–239 | 0 | DHMVLLEFVTAAGITLGMDELYK | |
| 2437.2608 | 5–27 | 0 | GEELFTGVVPILVELDGDVNGHK | |
| 2378.2577 | 54–74 | 0 | LPVPWPTLVTTLTYGVQCFSR | |
| 1973.9062 | 142–157 | 0 | LEYNYNSHNVYIMADK | |
| 1503.6597 | 28–42 | 0 | FSVSGEGEGDATYGK | |
| 1266.5783 | 87–97 | 0 | SAMPEGYVQER | |
| 1083.4979 | 240–247 | 0 | LEHHHHHH | |
| 1050.5214 | 115–123 | 0 | FEGDTLVNR | |
| 982.4952 | 133–141 | 0 | EDGNILGHK | |
| 821.3940 | 81–86 | 0 | QHDFFK | |
| 790.3552 | 75–80 | 0 | YPDHMK | |
| 769.3913 | 47–53 | 0 | FICTTGK | |
| 711.2944 | 103–108 | 0 | DDGNYK | |
| 655.3813 | 98–102 | 0 | TIFFK | |
| 602.2780 | 211–215 | 0 | DPNEK | |
| 579.3137 | 128–132 | 0 | GIDFK | |
| 507.2925 | 164–167 | 0 | VNFK | |
| 502.3235 | 124–127 | 0 | IELK |
3. Based on the LC-MS data for the Peptide Map data generated in lab (please use Figure 5a as a reference) how many chromatographic peaks do you see in the eGFP peptide map between 0.5 and 6 minutes? You may count all peaks that are >10% relative abundance
Count peaks that are long (tiny peaks are (e.g. 1.20 impurities due to non-specificity to his-tag column/misses a cleavage)
Given relative abundance and using 4.87 as reference, there are about 20 peaks including peak at 5.43 which is borderline
4. Assuming all the peaks are peptides, does the number of peaks match the number of peptides predicted from question 2 above? Are there more peaks in the chromatogram or fewer?
It is roughly the same; ~19–20 observed vs. 19 predicted. There are approximately the same number, with perhaps slightly more peaks than predicted peptides. Missed cleavages (trypsin doesn’t cut every K/R every time), non-specific cleavages, oxidation or other modifications producing multiple forms of the same peptide, or contaminants.
5. Identify the mass-to-charge () of the peptide shown in Figure 5b. What is the charge (z) of the most abundant charge state of the peptide (use the separation of the isotopes to determine the charge state). Calculate the mass of the singly charged form of the peptide ([M+H]+) based on its m/z and z.
Highest peak is 525.76712
Average spacing:
| Peak Pair | Difference (m/z) |
|---|---|
| 526.25918 − 525.76712 | 0.49206 |
| 526.76845 − 526.25918 | 0.50927 |
| 527.26098 − 526.76845 | 0.49253 |
| Average | 0.497953 |
| Rounded Average (m/z) | 0.5 |
Therefore, Z = 1/delta(m/z) = 1/0.5 = 2
With MW = (n × m/z) – n = (2 x 525.7612) – 2 = 1049.53424Da
Therefore, approximating H = 1
[M+H]+1 = 1049.53424 + 1 Da = 1050.53424 Da
6. Identify the peptide based on comparison to expected masses in the PeptideMass tool. What is mass accuracy of measurement? Please calculate the error in ppm. (Recall that Accuracy = (MWexperiment – MWtheory)/ MWtheory )
MW_Experiment = 1049.53424
MW_Theory = 1050.5215 – 1 = 1049.525
Accuracy = {|1049.53424 – 1049.514|Da/1049.525 Da} x 106 = 12.13886519 ~12.14ppm
7. What is the percentage of the sequence that is confirmed by peptide mapping? (see Figure 6)
88%
Bonus Peptide Map Questions
8. Can you determine the peptide sequence for the peptide fragmentation spectrum shown in Figure 5c? (HINT: Use your results from Question 2 above to match the peptide molecular weight that is closest to that shown in Figure 5b. Copy and paste its sequence into this tool online to predict the fragmentation pattern based on its amino acid sequence: http://db.systemsbiology.net/proteomicsToolkit/FragIonServlet.html. What is the sequence of the eGFP peptide that best matches the fragmentation spectrum in Figure 5c?
After pasting FEGDTLVNR, I get:
| Residue | Position | b-ion (m/z) | y-ion (m/z) |
|---|---|---|---|
| F | 1 | 148.07574 | 1050.52149 |
| E | 2 | 277.11833 | 903.45308 |
| G | 3 | 334.13979 | 774.41049 |
| D | 4 | 449.16673 | 717.38902 |
| T | 5 | 550.21441 | 602.36208 |
| L | 6 | 663.29848 | 501.31440 |
| V | 7 | 762.36689 | 388.23034 |
| N | 8 | 876.40982 | 289.16192 |
| R | 9 | 1032.51093 | 175.11900 |
| Ion Species | Monoisotopic Mass | Average Mass |
|---|---|---|
| (M) | 1049.51422 | 1050.13629 |
| (M+H)+ | 1050.52149 | 1051.14356 |
| (M+2H)²+ | 525.76441 | 526.07544 |
| (M+3H)³+ | 350.84538 | 351.05273 |
| (M+4H)⁴+ | 263.38586 | 263.54138 |
The predicted y-ions for FEGDTLVNR (y3=388.23, y4=501.31, y5=602.36, y7=774.41, y8=903.45) match the peaks in figure 5c.
9. Does the peptide map data make sense, i.e. do the results indicate the protein is the eGFP standard? Why or why not? Consult with Figure 6, which depicts the % amino acid coverage of peptides positively identified using their calculated mass and fragmentation pattern.
The data confirms it’s eGFP because there is 88% sequence coverage; detected peptides map across most of the eGFP sequence. Also, there are fragmentation matches; b/y ions confirm the amino acid order.
Homework: Waters Part IV — Oligomers
We will determine Keyhole Limpet Hemocyanin (KLH)’s oligomeric states using charge detection mass spectrometry (CDMS). CDMS single-particle measurements of KLH allow us to make direct mass measurements to determine what oligomeric states (that is, how many protein subunits combine) are present in solution. Using the known masses of the polypeptide subunits (Table 1) for KLH, identify where the following oligomeric species are on the spectrum shown below from the CDMS (Figure 7):
• 7FU Decamer
• 8FU Didecamer
• 8FU 3-Decamer
• 8FU 4-Decamer
| Polypeptide Subunit Name | Subunit Mass |
|---|---|
| 7FU | 340 kDa |
| 8FU | 400 kDa |
Table 1: KLH Subunit Masses
Convert to Kilo-DA**
| Oligomer (FU Decamer) | Multiply | Theoretical Mass (MDa) |
|---|---|---|
| 7FU Decamer | 10 × 340 kDa = 3,400 kDa | 3.4 |
| 8FU Didecamer | 20 × 400 kDa = 8,000 kDa | 8.0 |
| 8FU 3-Decamer | 30 × 400 kDa = 12,000 kDa | 12.0 |
| 8FU 4-Decamer | 40 × 400 kDa = 16,000 kDa | 16.0 |
Homework: Waters Part V — Did I make GFP?
Please fill out this table with the data you acquired from the lab work done at the Waters Immerse Lab in Cambridge, or else the data screenshots in this document if you were unable to have lab work done at Waters.
Two peaks (m/z):
(i) 2545.0388
(ii) 2799.4929
Average distance between peaks is approximately = 0.092
Z= 1/0.092 = 10.86956522. Therefore taking 10 as charge state for peak (ii)
| Z | m/z | MW = (z × m/z) − z | Round |
|---|---|---|---|
| 10 | 2799.4929 | 27984.9290 | 27984.93 |
| 11 | 2545.0388 | 27984.4268 | 27984.43 |
MW_Experiment = 27,984.00
MW_Theory = 28,007.00
PPM = Accuracy = {|27,984.00 – 28,007.00|Da/28,007.00 Da} x 106 = 821.2232656 ~ 821ppm
| Measurement | Theoretical | Observed / Measured on the Intact LC-MS | PPM Mass Error |
|---|---|---|---|
| Molecular weight (kDa) | 28.007 / 27.984 | 28.007 / 27.984 | 821 |