Class Assignment — DUE BY START OF FEB 10 LECTURE (1) First, describe a biological engineering application or tool you want to develop and why. This could be inspired by an idea for your HTGAA class project and/or something for which you are already doing in your research, or something you are just curious about.
Homework Week 2 Part 1: Benchling & In-silico Gel Art Import the Lambda DNA. Simulate Restriction Enzyme Digestion with the following Enzymes:
EcoRI
HindIII
BamHI
KpnI
EcoRV
SacI
SalI
Create a pattern/image in the style of Paul Vanouse’s Latent Figure Protocol artworks.
Homework Week 3 Assignment: Python Script for Opentrons Artwork
One of the great parts about having an automated robot is being able to precisely mix, deposit, and run reactions without much intervention, and design and deploy experiments remotely. For this week, we’d like for you to do the following:
Find and describe a published paper that utilizes the Opentrons or an automation tool to achieve novel biological applications.
Part A. Conceptual Questions Answer any NINE of the following questions from Shuguang Zhang: (i.e. you can select two to skip)
How many molecules of amino acids do you take with a piece of 500 grams of meat? (on average an amino acid is ~100 Daltons)
Assuming the meat is a red meat like beef, there would be approximately 20-25g of protein per 100g of meat [1, 2].
Part A: SOD1 Binder Peptide Design (From Pranam) Superoxide dismutase 1 (SOD1) is a cytosolic antioxidant enzyme that converts superoxide radicals into hydrogen peroxide and oxygen. In its native state, it forms a stable homodimer and binds copper and zinc.
Mutations in SOD1 cause familial Amyotrophic Lateral Sclerosis (ALS). Among them, the A4V mutation (Alanine → Valine at residue 4) leads to one of the most aggressive forms of the disease. The mutation subtly destabilizes the N-terminus, perturbs folding energetics, and promotes toxic aggregation.
Assignment: DNA Assembly 1. What are some components in the Phusion High-Fidelity PCR Master Mix and what is their purpose?
The template DNA is the mUAV plasmid at Used at 20 ng/µL, with 0.8 µL added to the reaction. The primers are “colour forward” and “colour reverse”. Give that the stock concentration is 5 µL, using 2.5 µL of each primer in a total reaction volume of 25 µL results in a final primer concentration of 0.5 µM.
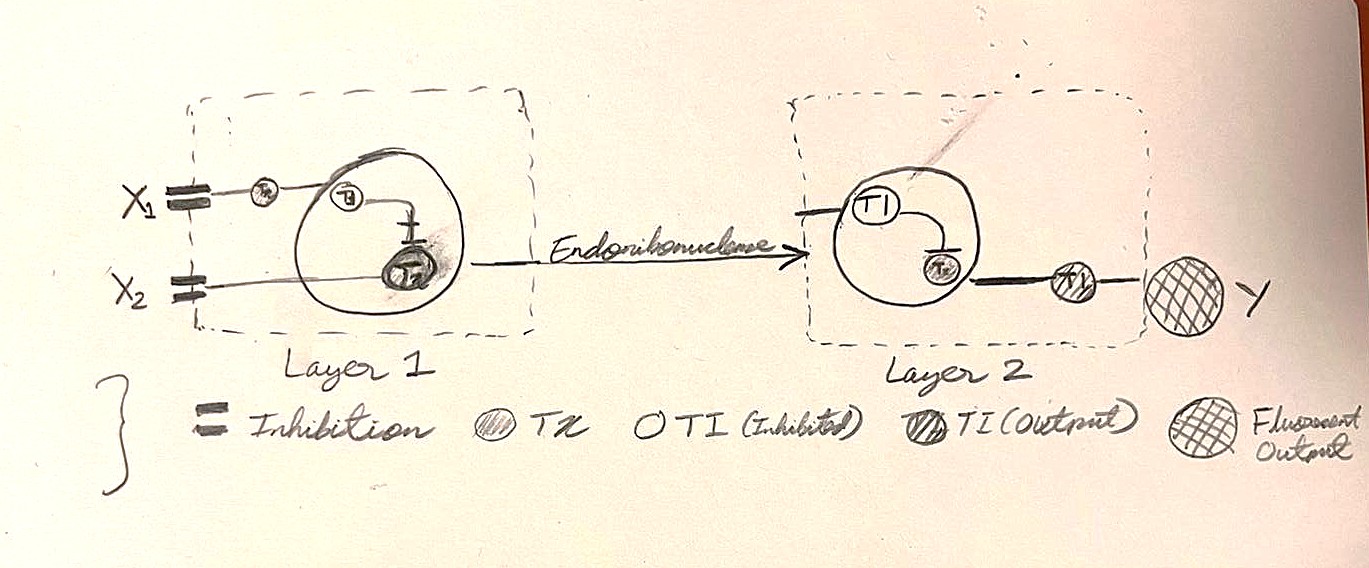
Assignment Part 1: Intracellular Artificial Neural Networks (IANNs)
What advantages do IANNs have over traditional genetic circuits, whose input/output behaviors are Boolean functions?
The advantages of IANNs over traditional circuits include:
(i) Continuous processing which allows them to constantly measure changes in concentration gradients of cellular inputs rather than just their absolute presence or absence.
(ii) Relatively easier to scale up. That is, new inputs can be programmed by integrating additional weighted connections to existing nodes without completely rewiring the circuit.
Explain the main advantages of cell-free protein synthesis over traditional in vivo methods, specifically in terms of flexibility and control over experimental variables. Name at least two cases where cell-free expression is more beneficial than cell production.
Advantages of cell-free protein synthesis (CFPS) over traditional in-vivo methods:
(i) Greater flexibility and control: Given that cells do not need to stay “alive” and the absence of a cell wall, it is possible to manipulate cells in real time; add chaperones, cofactors etc [1].
Homework: Waters Part I — Molecular Weight
We will analyze an eGFP standard on a Waters Xevo G3 QTof MS system to determine the molecular weight of intact eGFP and observe its charge state distribution in the native and denatured (unfolded) states. The conditions for LC-MS analysis of intact protein cause it to unfold and be detected in its denatured form (due to the solvents and pH used for analysis).
Homework: Week 11 — Bioproduction & Cloud Labs
Part A: The 1,536 Pixel Artwork Canvas | Collective Artwork
Contribute at least one pixel to this global artwork experiment before the editing ends on Sunday 4/19 at 11:59 PM EST.
• A personalized URL was sent to the email address associated with your Discourse account, and you can discuss the artwork on the Discourse.
• If you did not have a chance to contribute, it’s okay, just make sure you become a TA this fall! 😉
Subsections of Homework
Week 1 HW: Principles and Practices
Class Assignment — DUE BY START OF FEB 10 LECTURE
(1) First, describe a biological engineering application or tool you want to develop and why. This could be inspired by an idea for your HTGAA class project and/or something for which you are already doing in your research, or something you are just curious about.
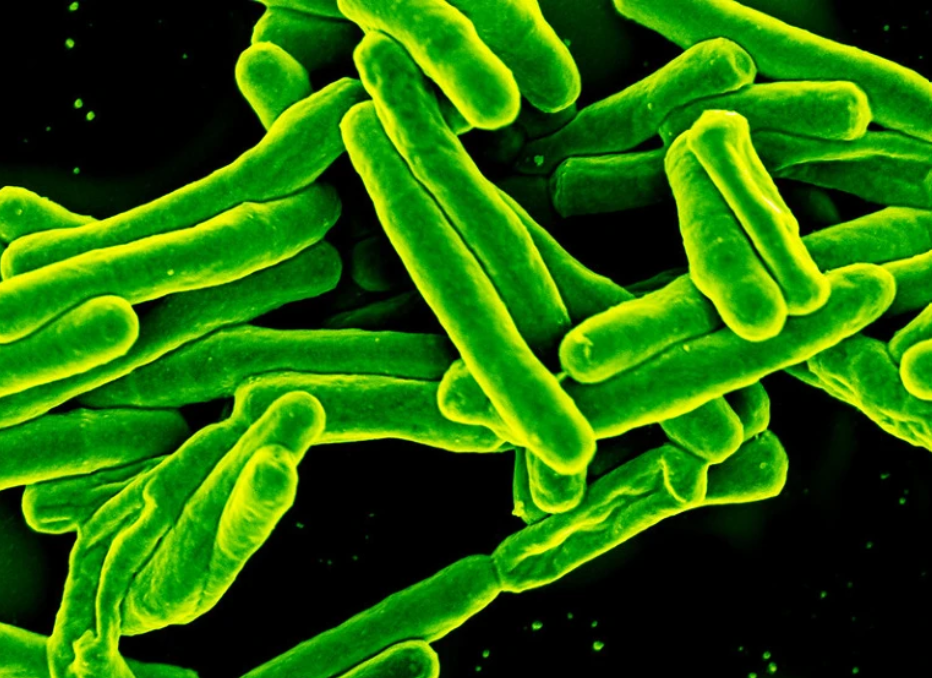
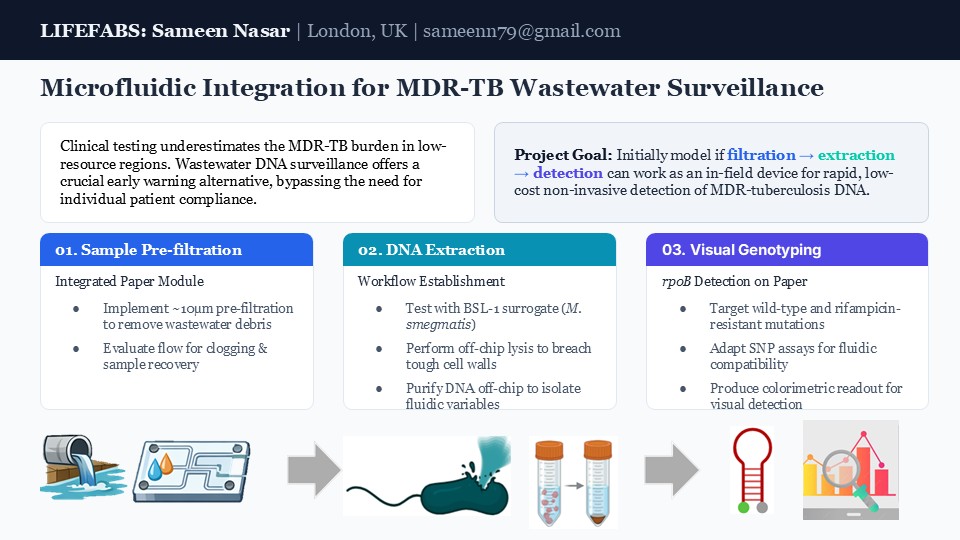
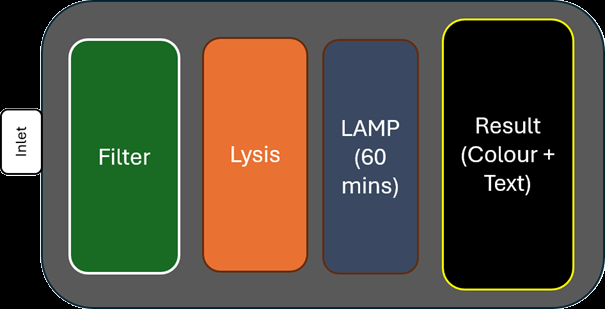
By leveraging biological engineering tools, such as CRISPR systems, I would like to develop highly specific nucleic acid biosensors and synthetic circuits to detect M. tuberculosis and resistance mutations with high precision and speed.
The inspiration for this comes from working on my MSc project, where I studied the genomic epidemiology of multi-drug-resistant tuberculosis (MDR-TB) using WGS data. My work focused on downstream analyses (phylogenetics, transmission clustering, regression, and machine learning), with particular attention to population structure and epidemiological interpretation. However, when working on my project, I found that genomic data of MDR-TB is geographically imbalanced, limiting the representativeness of global MDR-TB patterns and, ultimately, timely detection and treatment. This is especially true in high burden countries. As a result, I would like to explore the application of biosensors and genetic circuitry to add an additional layer of surveillance alongside traditional methods; biosensor or genetic circuit engineered to detect specific MDR-TB resistance markers or lineage-specific sequences, potentially using luminescence as a real-time readout to provide rapid, high-throughput signals.
Brief on the biology and possible mechanism for the tool: 🛠️ 🧬
Unlike many other bacteria that can share drug‑resistance genes with each other through horizontal gene transfer, Mycobacterium tuberculosis mainly becomes drug resistant through mutations in its own DNA (Single Nucleotide Polymorphisms (SNPs), insertions/deletions (indels)) [1]. Simultaneously, the ability of M. tuberculosis to persist within human hosts exposes it to prolonged immune pressure, driving adaptive changes in virulence‑associated loci such as phoR, mymA and the mce1 operon that can influence how different lineages transmit or interact with particular human populations [2¬–4].
As a result, the proposed bio-engineering tool could take the form of a bio-sensor, where CRISPR-based device could be programmed to recognise TB resistance mutations or an engineered genetic circuit that only produces a light or electrical signal when multiple resistance signatures are present. Such a device would convert the presence of specific mutations into a measurable output that can be rapidly read and fed into surveillance models.
(2) Next, describe one or more governance/policy goals related to ensuring that this application or tool contributes to an “ethical” future, like ensuring non-malfeasance (preventing harm). Break big goals down into two or more specific sub-goals. Below is one example framework (developed in the context of synthetic genomics) you can choose to use or adapt, or you can develop your own. The example was developed to consider policy goals of ensuring safety and security, alongside other goals, like promoting constructive uses, but you could propose other goals for example, those relating to equity or autonomy.
Governance Goal 1: Prevent harm or misuse
As genomic data can be geo-located and time-stamped, there are risks for community stigmatization and political duress. Therefore, to mitigate against these risks, the governance goal should implement frameworks that: (i) Require ethical review and oversight of bio-sensor data and its secondary uses (ii) Establish strict guidelines on the limits of how precise location data can be shared or publicized (iii) Establish clear accountability mechanisms for state and private actors
Governance Goal 2: Promote equity in data collection, analysis and development
To prevent further exacerbation of inequities biological data collection and usage, the framework will implement mechanisms that ensure: (i) Control of locally generated data by implementing country (ii) Inclusion of implementing country as equal partners in analysis and interpretation (iii) Prioritization of under-sampled regions to improve representativeness and combining outputs with timely access to treatment and care.
(3) Next, describe at least three different potential governance “actions” by considering the four aspects below (Purpose, Design, Assumptions, Risks of Failure & “Success”). Try to outline a mix of actions (e.g. a new requirement/rule, incentive, or technical strategy) pursued by different “actors” (e.g. academic researchers, companies, federal regulators, law enforcement, etc). Draw upon your existing knowledge and a little additional digging, and feel free to use analogies to other domains (e.g. 3D printing, drones, financial systems, etc.).
Purpose: What is done now and what changes are you proposing?
Design: What is needed to make it “work”? (including the actor(s) involved - who must opt-in, fund, approve, or implement, etc)
Assumptions: What could you have wrong (incorrect assumptions, uncertainties)?
Risks of Failure & “Success”: How might this fail, including any unintended consequences of the “success” of your proposed actions?
Governance Action 1: Regulation and creation of standards for early-stage bio-sensor development
Purpose:
Early-stage bio-sensor development research is guided by bio/genetic engineering but requires safety and bio-security risks.
I am proposing specific standards and regulatory requirements for early-stage biosensor design, ensuring safety, transparency, and responsible innovation before deployment. This could be in the form of new regulatory support or reference diagnostics.
Design:
Actors may include public health agencies, national regulators in science, and diagnostic developers. Establish validation criteria, accuracy thresholds, metadata standards, and geolocation safeguards. In addition, embed standards into existing public health TB surveillance programmes.
Assumptions:
This initiative assumes that regulators will be quick to evaluate bio-sensor technologies. Also assumes public health surveillance will be quick to agree and implement technology across the existing surveillance system.
Risk of failure:
Bureaucracy may hinder technological innovation and deployment.
Unintended consequences include a premature reliance on bio-sensor technology which could lead to false positive cases and mis-directed public health strategies.
Governance Action 2: Pre-sequencing rapid signal regulatory pathways
Purpose:
Currently, bio-sensor outputs such as CRISPR signals and genomic data are not integrated in low to middle-income countries
Therefore, I would like to propose the creation of formal pathways that enable rapid biosensor signals to feed into surveillance systems before whole genome sequencing (WGS), with defined quality, privacy, and data use standards.
Design:
Actors include public health agencies, national regulators in science, and diagnostic developers. Actors may also include international bodies such as the WHO. There may be potential to expand the WHO’s ‘attributes and principles on genomic data-sharing platforms supporting surveillance of pathogens’ [5–7].
Assumptions:
This assumes developers implement required standards and metadata. Also assumes public health agencies can incorporate new signal streams effectively.
Risk of failure:
Disagreements about implementation into existing surveillance pathways.
State agencies may lack technical expertise to train workers to evaluate, interpret and act on rapid biosensor signals. This could lead to misinterpretation and/or delayed action
Governance Action 3: Ethical data access and sharing standards (with local and community engagement requirements)
Purpose:
Many genomic and bio-engineering projects lack consistent standards for privacy, consent, equity, and local engagement.
A proposed change could be the mandatory implementation of ethical standards for data access combined with mandatory local/community engagement, ensuring transparency, and equitable benefit-sharing.
Design:
Develop standardised model data agreements which specify permissible uses, benefit-sharing obligations, and consent mechanisms. Furthermore, advisory boards and steering committees can be established to ensure engagement, feedback, and regular assessment of processes.
Assumptions:
This assumes that communities where the technology is planned to be implemented will agree to engage meaningfully.
It also assumes that cross-country coordination on ethical standards will be possible.
Risk of failure:
Strict data provisions may slow down implementation, collection and action.
There may be failure to engage communities as they may view the initiative to engage them as superficial.
(4) Next, score (from 1-3 with, 1 as the best, or n/a) each of your governance actions against your rubric of policy goals. The following is one framework but feel free to make your own:
Does the option:
Option 1
Option 2
Option 3
Regulation and creation of standards for early-stage bio-sensor development
Pre-sequencing rapid signal regulatory pathways
Ethical data access and sharing standards
🦠🛡️Enhance Biosecurity
• By preventing incidents
1
2
2
• By helping respond
2
3
2
🧪Foster Lab Safety
• By preventing incidents
2
2
2
• By helping respond
3
3
2
🌱Protect the environment
• By preventing incidents
1
2
2
• By helping respond
2
1
1
⚖️Other considerations
• Minimizing costs and burdens to stakeholders
1
1
1
• Feasibility
2
2
2
• Not impede research
2
2
2
• Promote constructive applications
1
1
1
5. Last, drawing upon this scoring, describe which governance option, or combination of options, you would prioritize, and why. Outline any trade-offs you considered as well as assumptions and uncertainties. For this, you can choose one or more relevant audiences for your recommendation, which could range from the very local (e.g. to MIT leadership or Cambridge Mayoral Office) to the national (e.g. to President Biden or the head of a Federal Agency) to the international (e.g. to the United Nations Office of the Secretary-General, or the leadership of a multinational firm or industry consortia). These could also be one of the “actor” groups in your matrix.
Based on the inputs and ranking in the matrix above, I would prioritize the following:
(i) Regulation and creation of standards for early-stage bio-sensor development
(ii) Ethical data access and sharing standards with local community engagement
Together both these actions would address both the technical and social foundations required for responsible deployment of biosensors. Standards would ensure that biosensors are developed safely, setting incentive structures to develop lab safety protocols and enforce biosecurity. Local community engagement, training, and capacity building will help build trust, protect rights, and enable effective use of surveillance data across settings.
References
Richard M. Jones, Kristin N. Adams, Hassan E. Eldesouky, and David R. Sherman “The evolving biology of mycobacterium tuberculosis drug resistance.” Frontiers in Cellular and Infection Microbiology 2022.
Sebastien Gagneux “Ecology and evolution of mycobacterium tuberculosis.” Nature Reviews Microbiology 2018.
Qingyun Liu, Jianhao Wei, Yawei Li, Mei Wang, Jun Su, et al. “Mycobacterium tuberculosis clinical isolates carry mutational signatures of host immune environments.” Science Advances 2020.
Á. Chiner-Oms, L. Sánchez-Busó, J. Corander, S. Gagneux, S. R. Harris, et al. “Genomic determinants of speciation and spread of the mycobacterium tuberculosis complex.” Science Advances 2019.
World Health Organization. Attributes and principles of genomic data-sharing platforms supporting surveillance of pathogens with epidemic and pandemic potential. World Health Organization; 2025.
Carter L, Yu MA, Sacks J, Barnadas C, Pereyaslov D, Cognat S, et al. Global genomic surveillance strategy for pathogens with pandemic and epidemic potential 2022–2032. Bulletin of the World Health Organization. 2022 Apr 1;100(04):239–9A.
Trump BD, Florin MV, Perkins E, et al. Biosecurity for Synthetic Biology and Emerging Biotechnologies: Critical Challenges for Governance. 2021 Sep 8. In: Trump BD, Florin MV, Perkins E, et al., editors. Emerging Threats of Synthetic Biology and Biotechnology: Addressing Security and Resilience Issues [Internet]. Dordrecht (DE): Springer; 2021. Chapter 1. Available from: https://www.ncbi.nlm.nih.gov/books/NBK584259/ doi: 10.1007/978-94-024-2086-9_
Assignment (Week 2 Lecture Prep)
Homework Questions from Professor Jacobson
Nature’s machinery for copying DNA is called polymerase. What is the error rate of polymerase? How does this compare to the length of the human genome. How does biology deal with that discrepancy?
The error rate of polymerase is 1 error per 10⁶ nucelotides, where this can range from expected error frequency from 1 error per 104 to approximately 106 [1].
The human genome has 3 x 10⁹ base pairs, this is around 3 billion nucleotides. This is much larger (approx. 3000 times) than 10⁶-nucleotide error rate of polymerase. Biology deals with this through a process of proofreading; cells use polymerase proofreading and mismatch repair to reduce errors to just a few per genome per replication [2].
How many different ways are there to code (DNA nucleotide code) for an average human protein? In practice what are some of the reasons that all of these different codes don’t work to code for the protein of interest?
Average Human Protein: 1036 bp
As 1 codon = 3 nucleotides
∴ Total amino acids = 1036/3 ~ 345
Given 3 nuclotide-codons and 1 codon codes for 1 amino acid, there are 3345 different ways to code for an average human protein.
Given 3345 DNA sequences code for the same protein, only some of it works due to codon preferences and bias, repetitive or unstable sequences, and mRNA folding [3].
References
Kunkel TA, Bebenek K. DNA replication fidelity. In: Brenner S, Miller JH, editors. DNA Replication and Human Disease. Bethesda (MD): National Center for Biotechnology Information (US); 2002. Available from: [https://www.ncbi.nlm.nih.gov/books/NBK9940/](https://www.ncbi.nlm.nih.gov/books/NBK9940/]
Alberts B, Johnson A, Lewis J, Raff M, Roberts K, Walter P. Molecular Biology of the Cell. 4th ed. New York: Garland Science; 2002. ISBN: 0-8153-3218-1, 0-8153-4072-9.
Lin J, Chen Y, Zhang Y, Lin H, Ouyang Z, et al. Deciphering the role of RNA structure in translation efficiency. BMC Bioinformatics. 2022;23:559
Homework Questions from Dr. LeProust
What’s the most commonly used method for oligo synthesis currently?
Oligonucleotide synthesis is the chemical process of making short fragments of DNA or RNA with a defined sequence, typically using step‑by‑step addition of nucleotide building blocks on a solid support [1]. For enzyme-free synthesis, the process involves sequentially adding nucleotide units to a growing chain, typically using solid- or liquid-phase synthesis [2].
The most common method is solid phase oligo phosphoramidite synthesis. As it is now automated and uses high quality short sequences, it is widely used in biotech companies around the world [3–4].
Why is it difficult to make oligos longer than 200nt via direct synthesis?
As length is increased, chemical synthesis becomes less efficient. As a result, there is a loss in product yield, greater rate of error accumulation (higher substitution or deletion rates), and an increased difficulty in purifying the final product due to the introduction of truncated and mis-incorporated oligos [5].
Why can’t you make a 2000bp gene via direct oligo synthesis?
As oligosynthesis adds one nucleotide at a time, increasing length will lead to a greater accumulation of errors (substitutions/deletions). The truncated or defective sequences become increasingly difficult to purify [6]. Therefore, direct synthesis of a 2000bp gene is not practical despite surface-based methods and capture-based purification [7].
References
Beaucage SL, Caruthers MH. Deoxynucleoside phosphoramidites—A new class of key intermediates for deoxypolynucleotide synthesis. Tetrahedron Letters. 1981;22(20):1859–62. doi:10.1016/S0040-4039(01)90461-7.
Kosuri S, Church GM. Large-scale de novo DNA synthesis: technologies and applications. Nat Methods. 2014;11:499–507. doi:10.1038/nmeth.2918.
Pichon M, Hollenstein M. Controlled enzymatic synthesis of oligonucleotides. Commun Chem. 2024;7:138. doi:10.1038/s42004-024-01216-0.
Yin Y, Arneson R, Yuan Y, Fang S. Long oligos: direct chemical synthesis of genes with up to 1728 nucleotides. Chem Sci. 2025;16:1966–73. doi:10.1039/D4SC06958G.
Homework Question from George Church
Choose ONE of the following three questions to answer; and please cite AI prompts or paper citations used, if any.
1. [Using Google & Prof. Church’s slide #4] What are the 10 essential amino acids in all animals and how does this affect your view of the “Lysine Contingency”?
Essential amino acids are defined as the amino acids that the animal body cannot synthesize, and therefore must obtain from diet. The essential amino acids in animals are are: isoleucine, leucine, lysine, threonine, tryptophan, methionine, histidine, valine, and phenylalanine. In addition, cysteine and tyrosine are often described as conditionally essential because they cannot be synthesized de novo in animals and are instead produced from methionine and phenylalanine, respectively [1].
Given lysine is one of essential amino acids that is universal for all animals, the “Lysine Contingency” is not an exclusive real control mechanism. Even if it hypothetically existed and could be removed, animals could easily source it from food, either meats, beans, or grains.
References
Hou Y, Wu G. Nutritionally essential amino acids. Adv Nutr. 2018;9(6):849–851. doi:10.1093/advances/nmy054
Week 2 HW: Read, write & edit
Homework Week 2
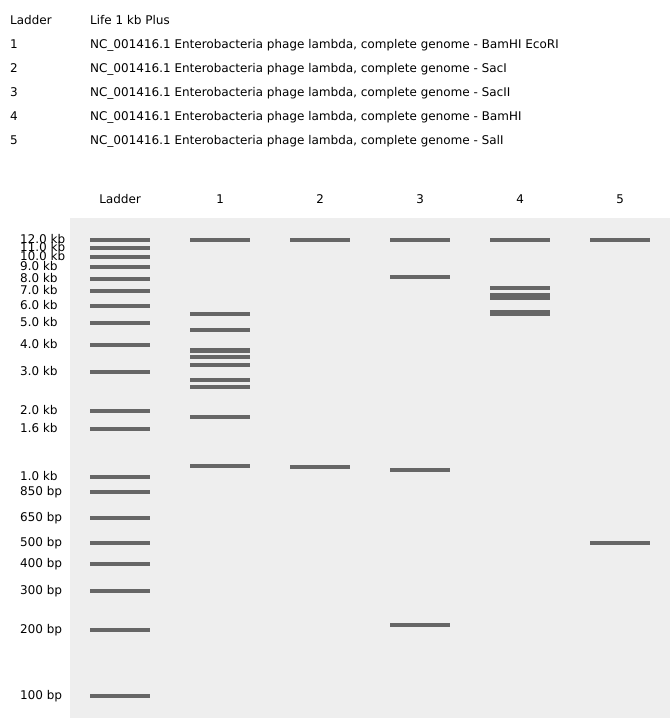
Part 1: Benchling & In-silico Gel Art
Import the Lambda DNA.
Simulate Restriction Enzyme Digestion with the following Enzymes:
EcoRI
HindIII
BamHI
KpnI
EcoRV
SacI
SalI
Create a pattern/image in the style of Paul Vanouse’s Latent Figure Protocol artworks.
You might find Ronan’s website a helpful tool for quickly iterating on designs!
Playing around with the digest enzymes
Getting an “S”, well…sort of:
Part 3: DNA Design Challenge
3.1. Choose your protein.:
In recitation, we discussed that you will pick a protein for your homework that you find interesting. Which protein have you chosen and why? Using one of the tools described in recitation (NCBI, UniProt, google), obtain the protein sequence for the protein you chose.
[Example from our group homework, you may notice the particular format — The example below came from UniProt]
I have chosen Tumor Necrosis Factor- Alpha (TNF-α).
Why:
Reasons for choosing this protein include my interest in dermatology and chronic diseases. It is a key inflammatory cytokine in many skin and insulin resistant conditions. I am interested in psoriasis, particularly plaque psoriasis and its relation to insulin resistance and diabetes [1]. This is because this is something my Mum has suffered from the last couple of years, recently developing some pre-diabetes.
Moller DE. Potential role of TNF-α in the pathogenesis of insulin resistance and type 2 diabetes. Trends Endocrinol Metab. 2000 Aug;11(6):212-217. doi:10.1016/S1043-2760(00)00272-1.
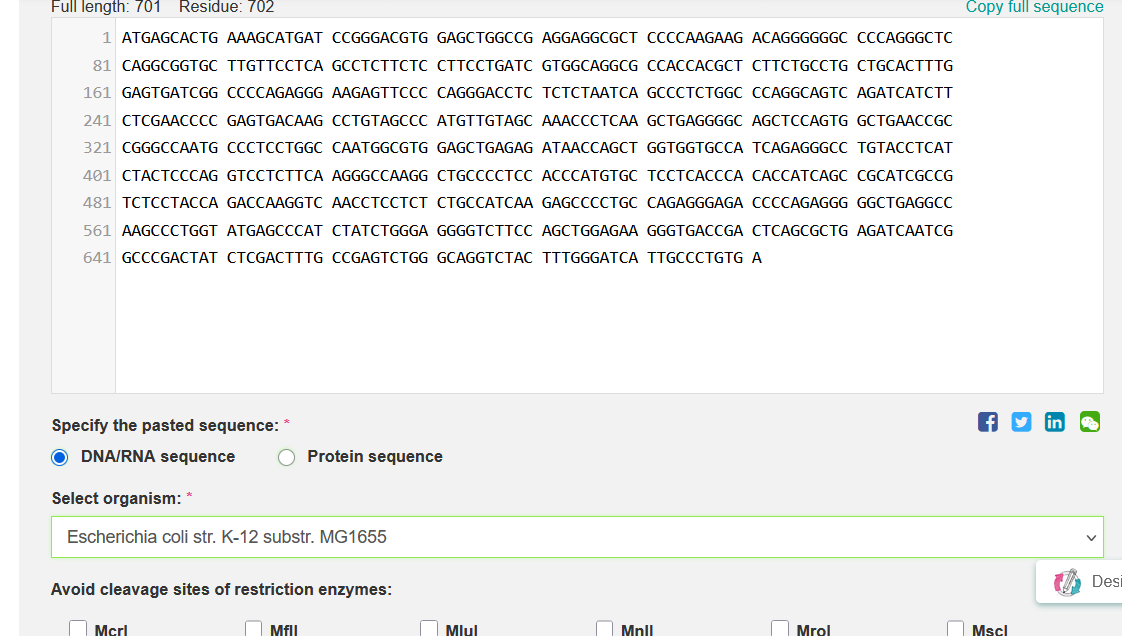
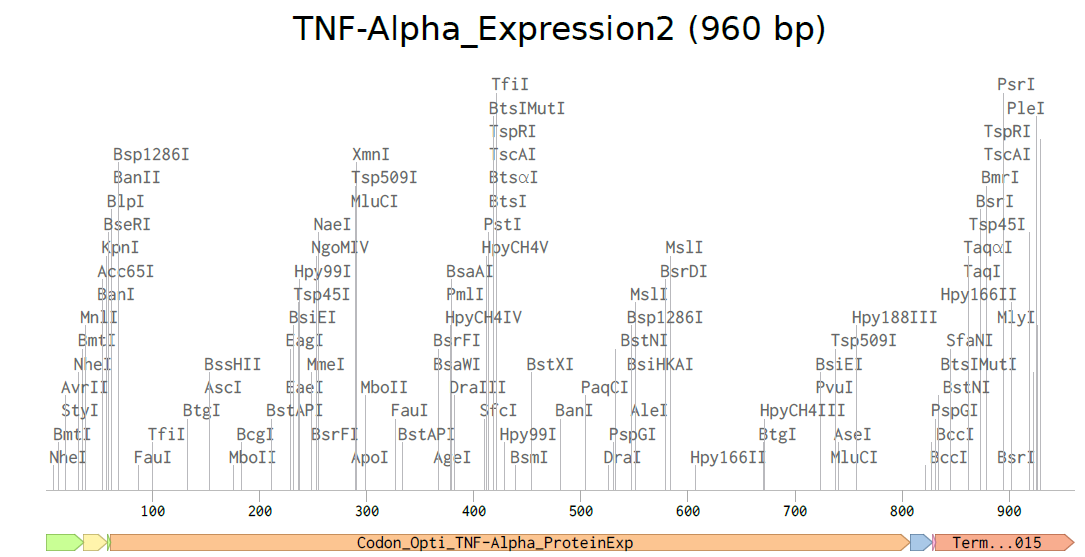
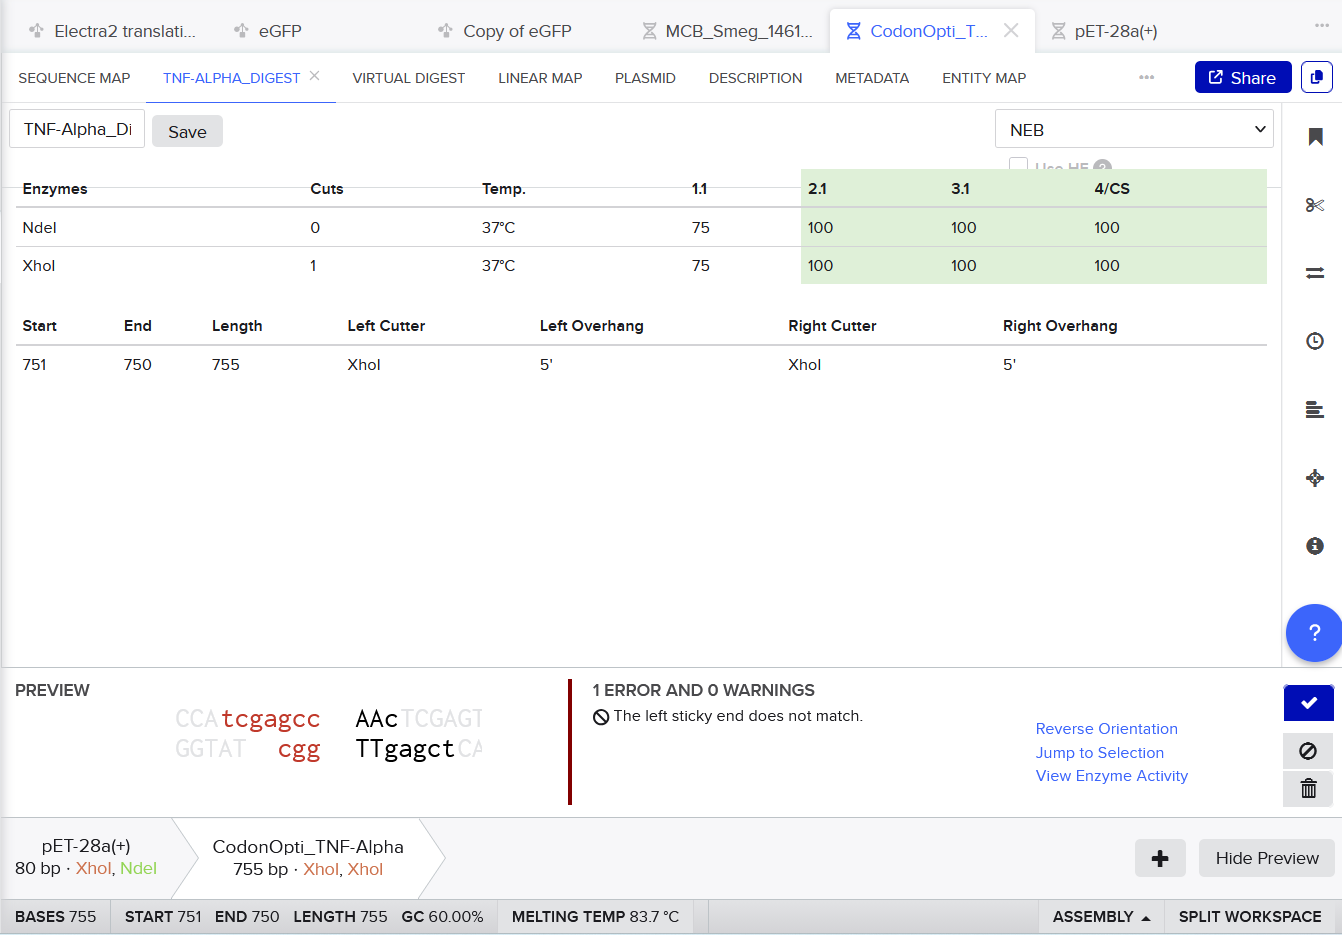
3.2. Reverse Translate: Protein (amino acid) sequence to DNA (nucleotide) sequence.
To obtain the nucleotide sequence encoding TNF-α, I retrieved the validated human mRNA record (NCBI RefSeq: NM_000594.4) from NCBI. From this record, I extracted the coding sequence (CDS), which corresponds to the protein sequence NP_000585.2. Only the CDS was used for downstream codon optimization. See below:
3.3. Codon optimization.Once a nucleotide sequence of your protein is determined, you need to codon optimize your sequence. You may, once again, utilize google for a “codon optimization tool”. In your own words, describe why you need to optimize codon usage. Which organism have you chosen to optimize the codon sequence for and why?
For codon optimization, I chose the online codon optimizing tool:
For CAI (Codon Adaptation Index), this indicates strong expected expression.
For GC content, after optimization it remained near 60%, within a suitable range for Escherichia coli, supporting stable and efficient gene synthesis.
I selected Escherichia coli strain K-12 MG1655 as the target organism for codon optimization because it is a well-studied laboratory strain with a completely sequenced and annotated genome [1–2].
Codon Optimized TNF-Alpha for improved expression of Escherichia coli
Lukjancenko O, Wassenaar TM, Ussery DW. Comparison of 61 sequenced Escherichia coli genomes. Microb Ecol. 2010 Nov;60(4):708-20. doi:10.1007/s00248-010-9717-3. PMID:20623278; PMCID:PMC2974192.
Yannai A, Katz S, Hershberg R. The codon usage of lowly expressed genes is subject to natural selection. Genome Biol Evol. 2018 May;10(5):1237–46. doi:10.1093/gbe/evy084.
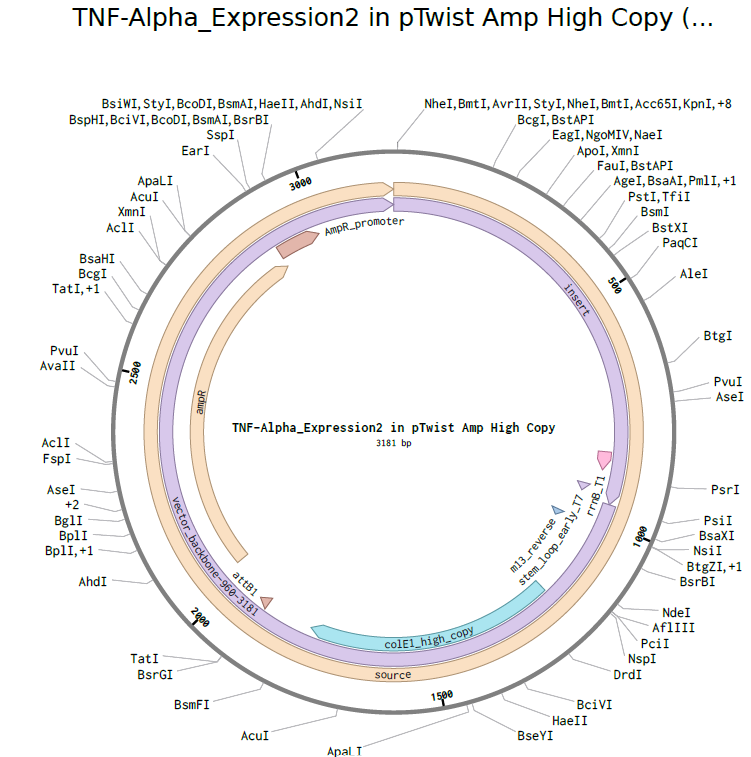
3.4. You have a sequence! Now what?
What technologies could be used to produce this protein from your DNA? Describe in your words the DNA sequence can be transcribed and translated into your protein. You may describe either cell-dependent or cell-free methods, or both.
After codon optimizing the TNF- α DNA sequence, it can be used to produce protein either through cell-dependent or cell-free systems.
For cell-dependent systems, the DNA will first need to be cloned using and inserted into an expression vector, this is then introduced into live host cells such as E. coli or eukaryotic cells, where cellular machinery transcribes the DNA into mRNA and then translates the mRNA into TNF‑α protein during growth and metabolism; this is seen in standard biotechnology production processes [1–2].
For cell-free systems, crude cell extracts provide all the machinery for transcription, translation, protein folding, and energy metabolism [3]. Therefore, when the codon optimized DNA is added, the TNF‑α protein will be produced in-vitro and under controlled conditions.
Both these methods rely on the flow of information from DNA to mRNA to protein; the Central Dogma of Molecular Biology.
Swartz JR. Advances in Escherichia coli production of therapeutic proteins. Curr Opin Biotechnol. 2001 Oct;12(5):195–201. doi:10.1016/s0958-1669(00)00198-5. PMID:11513436.
Carlson ED, Gan R, Hodgman CE, Jewett MC. Cell-free protein synthesis: Applications come of age. Biotechnol Adv. 2012 Sep-Oct;30(5):1185-94. doi:10.1016/j.biotechadv.2011.09.016. PMID:22001003; PMCID:PMC3359644.
3.5. [Optional] How does it work in nature/biological systems?
1. Describe how a single gene codes for multiple proteins at the transcriptional level.
2. Try aligning the DNA sequence, the transcribed RNA, and also the resulting translated Protein!!! See example below.
[Example shows the biomolecular flow in central dogma from DNA to RNA to Protein] Special note that all “T” were transcribed into “U” and that the 3-nt codon represents 1-AA.
(i) What DNA would you want to sequence (e.g., read) and why? This could be DNA related to human health (e.g. genes related to disease research), environmental monitoring (e.g., sewage waste water, biodiversity analysis), and beyond (e.g. DNA data storage, biobank).
I would want to sequence Mycobacterium Tuberculosis DNA. I would like to focus on virulence‑associated loci such as phoR, mymA and the mce1, and lineage defining SNPs, such as rpoB, katG, inhA promoter, gyrA, embB.
To integrate with surveillance, I would potentially try to store drug resistance and mutation outputs from my detection bio-tool into a DNA-based archive. This could help build a long-term genomic repository.
(ii) In lecture, a variety of sequencing technologies were mentioned. What technology or technologies would you use to perform sequencing on your DNA and why?Also answer the following questions:1. Is your method first-, second- or third-generation or other? How so?
2. What is your input? How do you prepare your input (e.g. fragmentation, adapter ligation, PCR)? List the essential steps.
3. What are the essential steps of your chosen sequencing technology, how does it decode the bases of your DNA sample (base calling)?
4. What is the output of your chosen sequencing technology?
To perform sequencing for the drug-resistant DNA, short-read sequencing is ideal for identifying the key resistance driving genes for profiling and analysis. In contrast, long-read sequencing (e.g. Oxford Nanopore) would make rapid detection, which is useful in high-burden regions, but has slightly lower accuracy.
Therefore, short-read sequencing is ideal for identifying key resistance-driving genes for profiling and analysis (for e.g. using Illumina) [1]. It involves DNA extraction, fragmentation, adapter ligation, cluster amplification, and sequencing by synthesis, with base-calling software decoding the sequence from fluorescent signals. The output includes high-quality short reads, aligned sequences, and variant calls for resistance and lineage analysis. In contrast, long-read sequencing enables rapid detection in high-burden regions but has slightly lower accuracy and may require deeper coverage.
References
The CRyPTIC Consortium and the 100,000 Genomes Project. Prediction of Susceptibility to First-Line Tuberculosis Drugs by DNA Sequencing. N Engl J Med. 2018;379:1403–1415. doi:10.1056/NEJMoa1800474.
5.2 DNA Read
(i) What DNA would you want to synthesize (e.g., write) and why? These could be individual genes, clusters of genes or genetic circuits, whole genomes, and beyond. As described in class thus far, applications could range from therapeutics and drug discovery (e.g., mRNA vaccines and therapies) to novel biomaterials (e.g. structural proteins), to sensors (e.g., genetic circuits for sensing and responding to inflammation, environmental stimuli, etc.), to art (DNA origamis). If possible, include the specific genetic sequence(s) of what you would like to synthesize! You will have the opportunity to actually have Twist synthesize these DNA constructs! :)
I would like to design a genetic circuit that could be integrated into a microbial chassis or a cell-free system, which would enable it to detect molecular signatures for key multi-drug /extra-drug-resistant tuberculosis and activates a fluorescent reporter when present in a sample. Examples of this have been seen in research that looks at how biosensors are used to detect heavy metal in water through recombinase-based logic gates [1].
Such CRISPR‑based detection systems can be programmed with guides targeting lineage‑specific SNPs (e.g., Beijing/East Asian, Indo-American) [2] alongside resistance mutations so that the circuit only activates a fluorescent reporter when both types of signatures are present. Potentially, CRISPR‑Cas12/13 coupled with allele‑specific amplification can discriminate single‑base changes for lineage and resistance detection with high specificity.
There is also a possibility of integrating all of this into a microfluidic biosensor, enabling automated, low-volume, rapid, and multiplexed detection suitable for environmental and point-of-care surveillance [3].
(ii) In lecture, a variety of sequencing technologies were mentioned. What technology or technologies would you use to perform sequencing on your DNA and why?
Also answer the following questions:
Is your method first-, second- or third-generation or other? How so?
What is your input? How do you prepare your input (e.g. fragmentation, adapter ligation, PCR)? List the essential steps.
What are the essential steps of your chosen sequencing technology, how does it decode the bases of your DNA sample (base calling)?
What is the output of your chosen sequencing technology?
For this synthesis, I would use synthetic DNA platforms and include CRISPR guide sequences, promoters, and fluorescent reporter proteins.
These technologies would allow for quick prototyping, flexibility with design and would allow for automated printers to synthesize sequences up to multiple kilobases accurately.
Essential steps would include: full sequence of nucleotides and CRISPR guides, promoters and reporter proteins; setting the oligonucleotide assembly, this includes making assemblies of short oligos through PCR or ligation. These would need to be further tested and validated to ensure proper functioning of the circuit.
Limitations include, time, fixing errors, and scaling the device. These large constructs and may take time due to the complexity associated with multiple variants.
References
Mathur S, Singh D, Ranjan R. Genetic circuits in microbial biosensors for heavy metal detection in soil and water. Biochem Biophys Res Commun. 2023 Apr 16;652:131–137. doi:10.1016/j.bbrc.2023.02.031.
Napier, G., Campino, S., Merid, Y. et al. Robust barcoding and identification of Mycobacterium tuberculosis lineages for epidemiological and clinical studies. BMC Genome Med 12, 114 (2020). https://doi.org/10.1186/s13073-020-00817-3
Didarian R, Azar MT. Microfluidic biosensors: revolutionizing detection in DNA analysis, cellular analysis, and pathogen detection. Biomed Microdevices. 2025;27:10. doi:10.1007/s10544-025-00741-6.
5.3 DNA Edit
(i) What DNA would you want to edit and why? In class, George shared a variety of ways to edit the genes and genomes of humans and other organisms. Such DNA editing technologies have profound implications for human health, development, and even human longevity and human augmentation. DNA editing is also already commonly leveraged for flora and fauna, for example in nature conservation efforts, (animal/plant restoration, de-extinction), or in agriculture (e.g. plant breeding, nitrogen fixation). What kinds of edits might you want to make to DNA (e.g., human genomes and beyond) and why?
For editing, I would use CRISPR-Cas systems to introduce lineage specific SNPs and resistant mutations into safe mycobacterial strains or cell-free systems [1]. This allow me to test the genetic circuit, validate the CRISPR guides, and generate controls for MDR-TB detection.
(ii) What technology or technologies would you use to perform these DNA edits and why?
Also answer the following questions:
How does your technology of choice edit DNA? What are the essential steps?
What preparation do you need to do (e.g. design steps) and what is the input (e.g. DNA template, enzymes, plasmids, primers, guides, cells) for the editing?
What are the limitations of your editing methods (if any) in terms of efficiency or precision?
Essential steps would include: designing guide RNAs to target SNPs/loci related to drug resistance; integrating of editing components into cells or a cell-free platform; functional testing to ensure sequences properly activate the fluorescent reporter protein within the circuit.
Preparation would require designing the guide RNAs and providing either a cell-free system or microbial framework as the host.
Limitations include: possible off-target edits; increased complexity when introducing multiple edits or larger constructs, which can affect throughput and precision.
References
Molla KA, Yang Y. CRISPR/Cas mediated base editing: technical considerations and practical applications. Trends Biotechnol. 2019 Oct;37(10):1121–1142. doi:10.1016/j.tibtech.2019.03.008. Review of CRISPR base editing systems and how they introduce precise nucleotide changes without double strand breaks.
Week 3 HW: Lab automation
Homework Week 3
Assignment: Python Script for Opentrons Artwork
One of the great parts about having an automated robot is being able to precisely mix, deposit, and run reactions without much intervention, and design and deploy experiments remotely.For this week, we’d like for you to do the following:
1. Find and describe a published paper that utilizes the Opentrons or an automation tool to achieve novel biological applications.
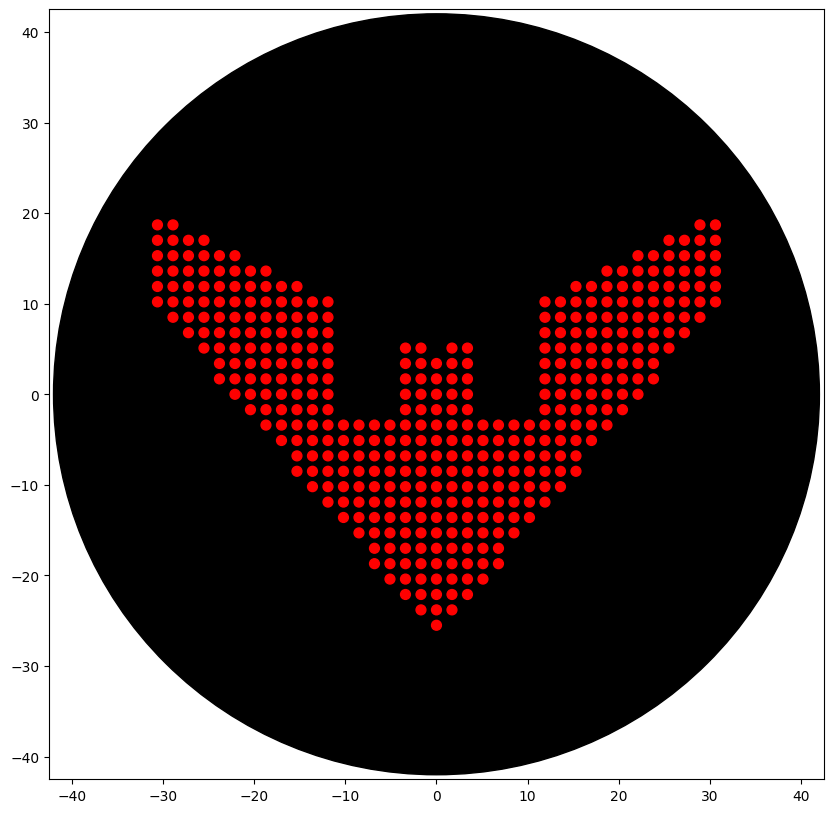
Initially tried to do a Sonic 3 & Knuckles logo (Classic sonic game) silhouette. The design with some tweaks was hopeful. In the end, I went with the Batman Beyond logo, as it was simple and only had one colour (given the limitations of our node).
The final code (with the help of Gemini) I used is below:
*###
*### YOUR CODE HERE to create your design
##############################################################################
Simple Design: Batman Beyond Logo
##############################################################################
spacing = 1.7
design_points = []
#* We use absolute values abs(i) to ensure perfect left-right symmetry
for i in range(-18, 19): # Horizontal span (~72mm total)
for j in range(-15, 12): # Vertical span
      x = abs(i)
      # 1. Top Wing Edge (slopes up to the points)
      if j < (0.5 * x) + 3:

          # 2. Bottom "V" Shape
          if j > (1.2 * x) - 16:

              # 3. Inner Wing Cutouts (The 'U' shapes next to the head)
              # If we are not in the cutout zone, add the point
              is_cutout = (2 < x < 7) and (j > -2)

              # 4. The Head (Center spike)
              is_head = (x <= 1) and (j < 5)

              if not is_cutout or is_head:
                  design_points.append((i * spacing, j * spacing, 'Red'))
#* EXECUTION
points_for_color = [p for p in design_points if p[2] == ‘Red’]
if points_for_color:
pipette_20ul.pick_up_tip()
pipette_20ul.aspirate(15, location_of_color(‘Red’))
  for x, y, c in points_for_color:
      if pipette_20ul.current_volume < 0.5:
          pipette_20ul.aspirate(15, location_of_color('Red'))

      target = center_location.move(types.Point(x=x, y=y))
      dispense_and_detach(pipette_20ul, 0.5, target)

  pipette_20ul.drop_tip()
##############################################################################
END OF CODE
##############################################################################
The output:
With some manual tweaks, what I initially wanted to do:
However, the end product was pretty atrocious and would take way too much time to fix, given I’m doing this in the last minute. So atrocious that I won’t paste it.
Post-Lab Questions
2. Write a description about what you intend to do with automation tools for your final project. You may include example pseudocode, Python scripts, 3D printed holders, a plan for how to use Ginkgo Nebula, and more. You may reference this week’s recitation slide deck for lab automation details.
While your description/project idea doesn’t need to be set in stone, we would like to see core details of what you would automate. This is due at the start of lecture and does not need to be tested on the Opentrons yet.
(Answer 1)
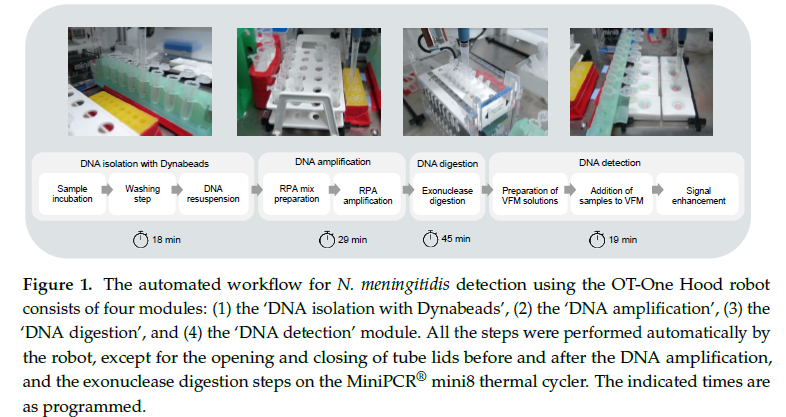
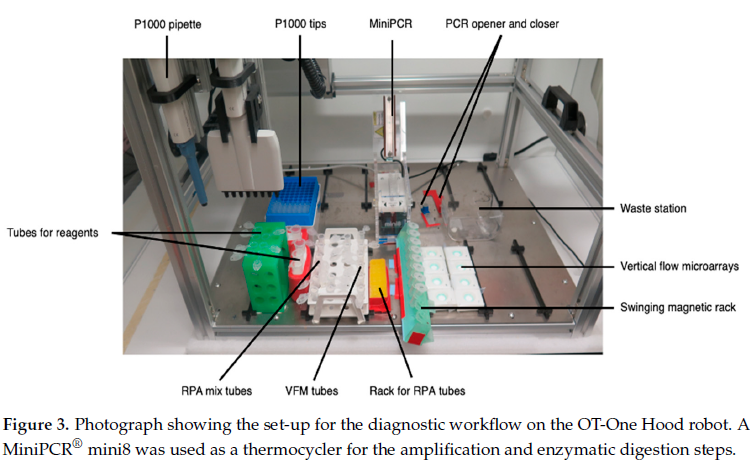
Paper: An Automated Versatile Diagnostic Workflow for Infectious Disease Detection in Low-Resource Settings
Miren Urrutia Iturritza, Phuthumani Mlotshwa, Jesper Gantelius, Tobias Alfvén, Edmund Loh, Jens Karlsson, Chris Hadjineophytou, Krzysztof Langer, Konstantinos Mitsakakis, Aman Russom, Håkan N. Jönsson, Giulia Gaudenzi
This paper describes how researchers built an automated diagnostic workflow for detection of infectious diseases in low-resource settings [1]. Specifically, they tested for Neisseria meningitidis; a gram-negative bacterium that cause serious meningitis and blood infections in humans.
For their workflow, they used Opentrons OT-One-S Hood. This is an open-source liquid handling robot, which can be bought at a relatively low cost. The researchers wrote custom software developed at SciLifeLab Nanobiotechnology division [2] to create scripts for their workflow.
Materials and reagents were organized onto the OT-One-S Hood robot, with racks and tubes with primers, buffers, and enzymes, the MiniPCR® mini8 thermal cycler, magnetic bead racks, waste containers, and microarray holders, to analyze Neisseria meningitidis DNA in both clinical and spiked samples. “Clinical” samples refere to specimens collected from individuals, where “spiked” samples were lab prepared samples where a known amount of Neisseria meningitidis DNA.
The robot then performs all the necessary pipetting steps, RNA amplication of ctrA gene (as its conserved, species-specific gene essential for capsule formation, making it a reliable marker [3]), enzymatic digestion, and deposition onto paper-based microarrays. The only manual steps were the opening and closing of tube lids before and after the DNA amplification, and the exonuclease digestion steps on the MiniPCR® mini8 thermal cycler [1].
The study showed that, automated liquid handling can detect Neisseria meningitidis in low-resource settings, though accuracy and reproducibility were not fully validated.
References
Urrutia Iturritza M, Mlotshwa P, Gantelius J, Alfvén T, Loh E, Karlsson J, Hadjineophytou C, Langer K, Mitsakakis K, Russom A, et al. An automated versatile diagnostic workflow for infectious disease detection in low-resource settings. Micromachines. 2024;15(6):708. doi:10.3390/mi15060708.
Langer K, Joensson HN. Rapid production and recovery of cell spheroids by automated droplet microfluidics. SLAS Technol. 2020;25:111–122.
Rivas L, Reuterswärd P, Rasti R, Herrmann B, Mårtensson A, Alfvén T, Gantelius J, Andersson-Svahn H. A vertical flow paper-microarray assay with isothermal DNA amplification for detection of Neisseria meningitidis. Talanta. 2018;183:192–200.
(Answer 2)
For the automation of my project, I plan to use automation tools to develop and test a CRISPR-based biosensor that would be capable of detecting multi-drug-resistant tuberculosis (MDR-TB) signatures. This workflow would involve high-throughput liquid handling and cell-free protein synthesis.
Possible steps would include:
(i) Module setup:
This would include arranging reagents, tip racks, thermal cyclers, magnetic bead racks, and microarray holders on an Opentrons OT-2 deck [1]. This would be supplemented by temperature modules for incubation and heater-shaker modules for mixing and precise reaction control
(ii) Automated reaction setup:
The robot will then perform pipetting of cell-free lysate, DNA templates, CRISPR guides, and cofactors into 96- or 384-well plate. Then multiple combinations of lineage-specific SNP guides and resistance mutation guides will be tested to evaluate ‘AND-gate logic’.
(iii) Incubation:
External devices like a plate reader or miniPCR thermal cycler amplification will be loaded. Then Python scripts will be used to control timing, mixtures, and incubation periods.
(iv) Signal detection and analysis:
Fluorescent outputs will be measure using devices such as Spark or PHERAstar FSX for high-throughput plate analysis [1]. This will be a measure of change in fluorescence colour which would indicate successful target detection and amplification.
(v) Microfluidic integration (if possible):
If possible, will look to integrate 3D printed holders for small microfluidic chips. These can serve as small test cartridges for running multiple tests at once while minimizing manual handling and contamination risk in low-resource settings.
Answer any NINE of the following questions from Shuguang Zhang: (i.e. you can select two to skip)
1. How many molecules of amino acids do you take with a piece of 500 grams of meat? (on average an amino acid is ~100 Daltons)
Assuming the meat is a red meat like beef, there would be approximately 20-25g of protein per 100g of meat [1, 2].
So, taking the upper end of that range for 500g:
500g x 0.25 = 125g
Given on average 1 amino acid ≈ 100 Daltons, then 1g/mol ≈ 1 Dalton
Therefore,
125 Daltons ≈ 125g/mol
Converting grams to moles:
Moles = mass/molar mass = 125g/125g/mol = 1 mole of amino acids
Converting moles to molecules using Avogadro’s constant [3]:
1 mole ≈ 6.02214076 x 10²³ ≈ 6.02 x 10²³
University Hospitals Sussex NHS Foundation Trust. Protein fact sheet [Internet]. West Sussex (UK): University Hospitals Sussex NHS Foundation Trust; [cited 2026 Mar 1]. Available from: https://www.uhsussex.nhs.uk/resources/protein-fact-sheet/
2. Why do humans eat beef but do not become a cow, eat fish but do not become fish?
When we digest meat or fish, we are breaking them down into their basic constituents, which include amino acids. These amino acids are further used by ribosomes (through DNA instruction) to build human proteins, not that of a cow or fish.
3. Why are there only 20 natural amino acids?
The standard 20 amino acids were formed through evolutionary pressures which selected the acids based on folding capabilities, catalysis, and molecular recognition. These were most likely adopted in pre-biotic conditions through early metabolism/pre-biotic chemistry [1]. Once incorporated into the genetic code, it got fixed given other additions may have created disruptions towards survival.
Exceptions include Pyrrolysine and Selenocysteine, which are naturally occurring amino acids incorporated into proteins via specialized mechanisms; with pyrrolysine encoded by UAG stop codon in certain areas using dedicated tRNA and biosynthetic enzymes, and selenocysteine inserted at UGA codons with a Selenocysteine Insertion Sequence (SECIS) in the mRNA.
Doig AJ. Frozen, but no accident – why the 20 standard amino acids were selected. FEBS Lett. 2016 Dec 7;590(21):3977–3985. doi:10.1111/febs.13982. Available from: https://doi.org/10.1111/febs.13982
4. Can you make other non-natural amino acids? Design some new amino acids.
Yes, it is possible to make non-natural amino acids as well as incorporate them into proteins using engineered tRNA synthase pairs with reassigned codons [1].
Initially will choose a base amino acid modify side chain to add new function Synthesize and by introducing protein with engineered tRNA, so that the amino acid can be recognized insert in specific codon.
To design a new amino acid, I would modify non‑natural amino acid is para‑azido‑L‑phenylalanine (pAzF), which contains an azide (‑N₃) group. When pAzF is genetically incorporated into a protein at a chosen site, the azide can act as a chemical handle attaching a fluorescent dye or imaging agent to that protein. This can help label or track proteins in cells and animals [2].
Bag SS, Saraogi I, Guo J. Editorial: Expansion of the Genetic Code: Unnatural Amino Acids and their Applications. Front Chem. 2022;10:958433. doi:10.3389/fchem.2022.958433.
Lightle HE, Kafley P, Lewis TR, Wang R. Site‑specific protein conjugates incorporating para‑azido‑L‑phenylalanine for cellular and in vivo imaging. Methods. 2023;219:95–101. doi:10.1016/j.ymeth.2023.10.001
5. Where did amino acids come from before enzymes that make them, and before life started?
The origins of amino acids are hypothesized to have emerged from primordial earth [1], and have undergone abiotic synthesis under early environmental conditions (such as electrical discharges and impact‑driven reactions during the Hadean Eon) before life existed; over time, as organisms evolved in the Archean and Proterozoic Eons, they developed enzyme‑mediated biosynthetic pathways to produce amino acids internally, eventually supporting the diversity of life seen in the three domains of Archaea, Bacteria, and Eukarya.
6. If you make an α-helix using D-amino acids, what handedness (right or left) would you expect?
If an α-helix is made from D-amino acids instead of L-amino acids, it would form a left-handed helix [1].
In natural proteins, L-amino acids are used, and they form right-handed α-helices. Therefore, the helix built from D-amino acids reverse that twist to make it left-handed.
7. Can you discover additional helices in proteins?
Yes, it is possible to have additional helices in proteins, both natural and artificially designed.
This includes the 310 helix which is a secondary structure found in proteins and polypeptides.
Another is the pi/π helix, which is a secondary structure found in proteins.
8. Why are most molecular helices right-handed?
9. Why do β-sheets tend to aggregate?
β-sheets tend to aggregate due to their structure as they have exposed edges with available hydrogen bonding groups [1]. This leaves it susceptible to interactions with other β-sheets.
o What is the driving force for β-sheet aggregation?
The intermolecular backbone formed from β-sheet aggregation from hydrogen bonds forming between the backbone groups. Once aligned, hydrophobic side-chain interactions and van der Waals forces between tightly packed residues further stabilize the β-sheet aggregates [1].
Richardson JS, Richardson DC. Natural β-sheet proteins use negative design to avoid edge-to-edge aggregationProc Natl Acad Sci U S A. 2002 Mar 5;99(5):2754–9. doi:10.1073/pnas.052706099.
10. Why do many amyloid diseases form β-sheets?
Give β-sheets allow for extensive intermolecular backbones, it enables multiple proteins to stick together.
For example, in Alzheimer’s disease, amyloid-β peptides misfold and aggregate into fibrils that are rich in β-sheet structure. These facilitate plaque formation in the brain [1].
o Can you use amyloid β-sheets as materials?
Amyloid β-sheets can be used as materials because their cross-β structure forms highly stable, self-assembling nanofibers. These properties allow them to be developed into biomaterials such as hydrogels and nanofibers.
Ow SY, Dunstan DE. A brief overview of amyloids and Alzheimer’s disease. Protein Sci. 2014 Oct;23(10):1315–31. doi:10.1002/pro.2524.
Part B. Protein Analysis and Visualization
In this part of the homework, you will be using online resources and 3D visualization software to answer questions about proteins. Pick any protein (from any organism) of your interest that has a 3D structure and answer the following questions:
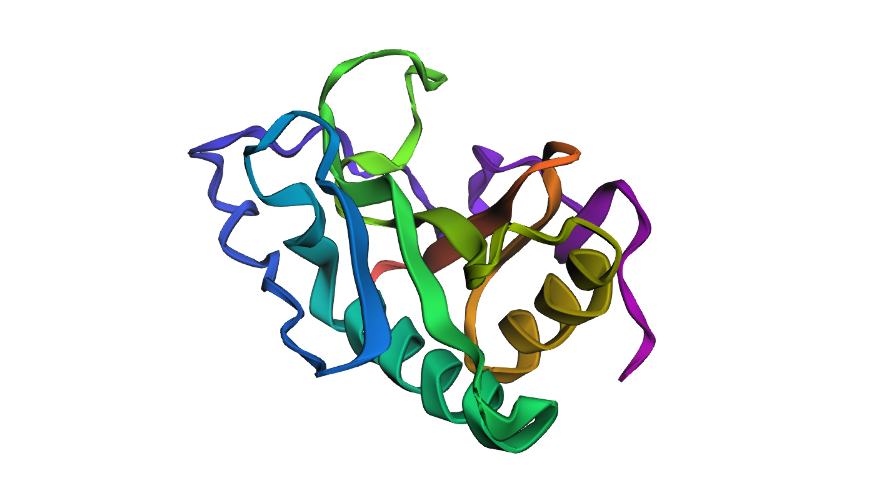
1. Briefly describe the protein you selected and why you selected it.
I selected the Sonic Hedgehog protein. One, because when I was a massive Sonic the Hedgehog fan. Later as I started studying and working, I became interested in biology, neuroscience, and mental health. I found out that the protein has important functions in information exchange at fetal stage, the central nervous system development, tooth enamel growth, and it has also been that it may have potential regenerative functions for hair growth. Whereas, dysregulation can lead to aging-related neurodegenerative diseases such as Alzheimer’s disease, Parkinson’s disease, and amyotrophic lateral sclerosis
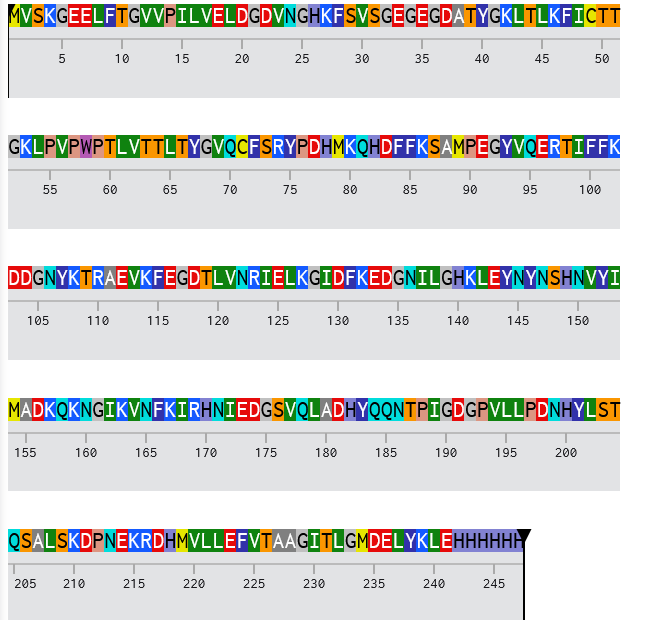
2. Identify the amino acid sequence of your protein.
From UniProt:
sp|Q15465|SHH_HUMAN Sonic hedgehog protein OS=Homo sapiens OX=9606 GN=SHH PE=1 SV=1
o How many protein sequence homologs are there for your protein? Hint: Use Uniprot’s BLAST tool to search for homologs.
After inputting the sequence into UniProt’s BLAST tool, there are 244 homologs identified.
o Does your protein belong to any protein family?
It belongs to the hedgehog family.
3. Identify the structure page of your protein in RCSBo When was the structure solved? Is it a good quality structure? Good quality structure is the one with good resolution. Smaller the better (Resolution: 2.70 Å)
After the search, I selected:
8Z2V | pdb_00008z2v
Crystal structure of Sonic hedgehog in complex with antibody 5E1 mutant H-R102A with metals
Resolution: 1.89 Å
This was deposited on April 13, 2024 and released in the PDB on April 16, 2025.
The resolution indicates that it is of good quality due to its resolution of a more detailed structure. This presents a more accurate interpretation of its structure.
o Are there any other molecules in the solved structure apart from protein?
The solved structure 8Z2V includes the heavy and light chains of the antibody 5E1 to which it is bound, as well as several small molecules: glycerol, zinc ions, calcium ions, and a chloride ion.
o Does your protein belong to any structure classification family?
It belongs to the immune system.
4. Open the structure of your protein in any 3D molecule visualization software:
o PyMol Tutorial Here (hint: ChatGPT is good at PyMol commands)
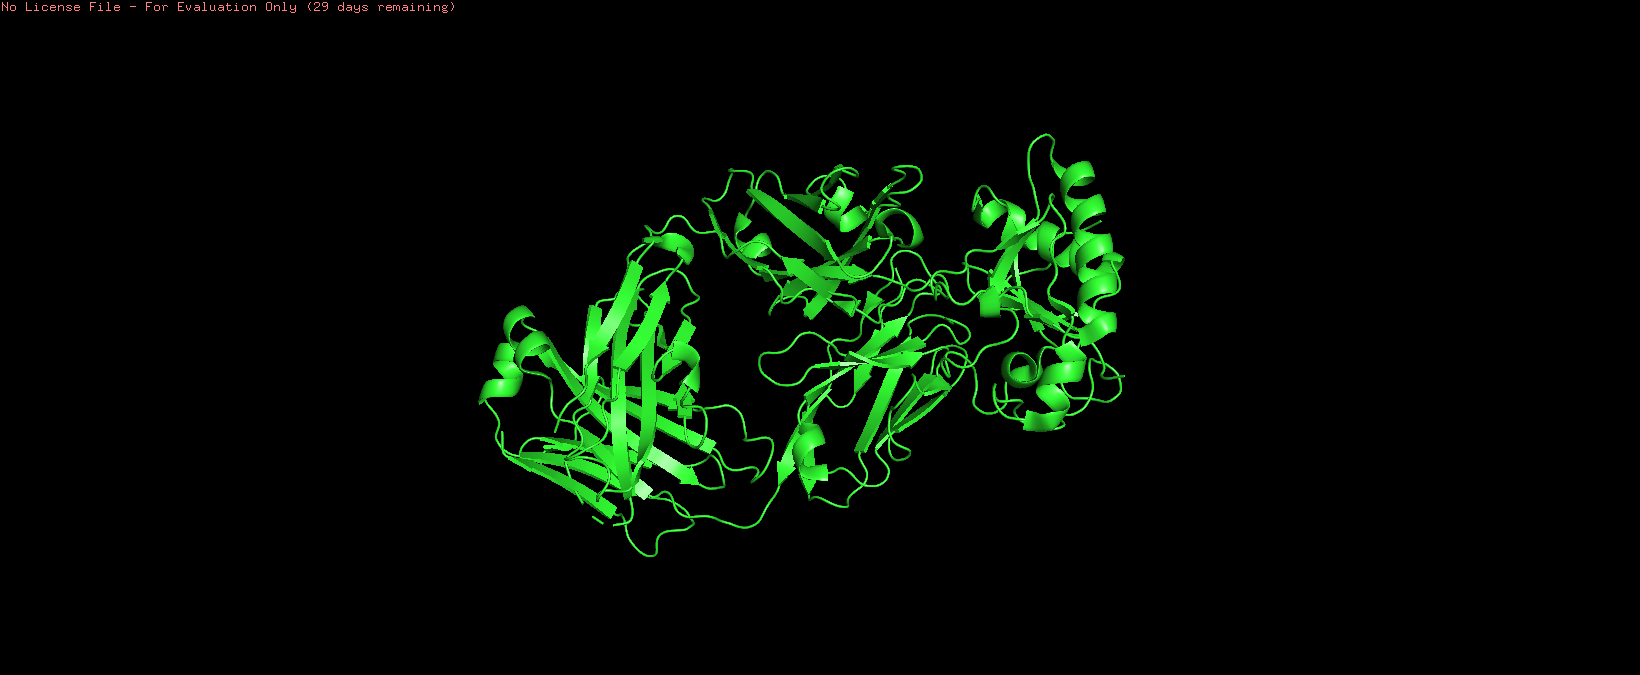
After loading the protein, I got:
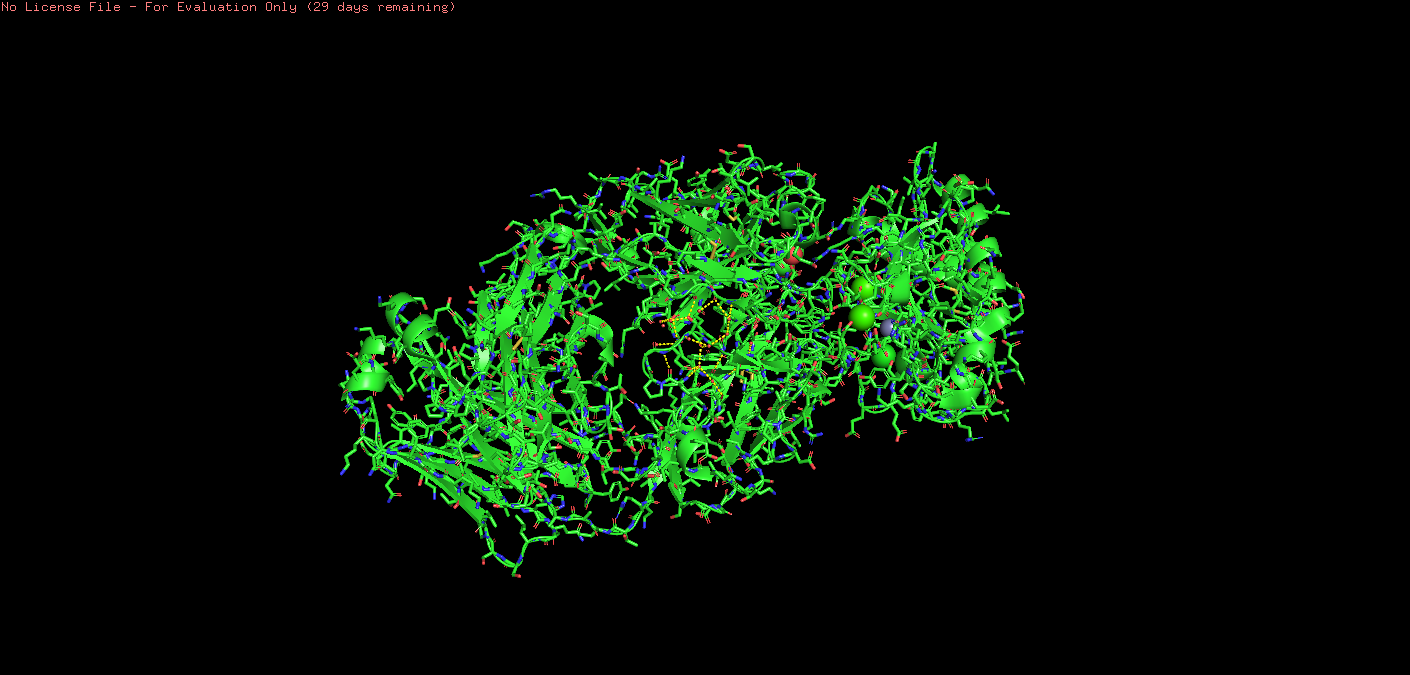
o Visualize the protein as “cartoon”, “ribbon” and “ball and stick”
Cartoon:
Ball & Stick:
Ribbon:
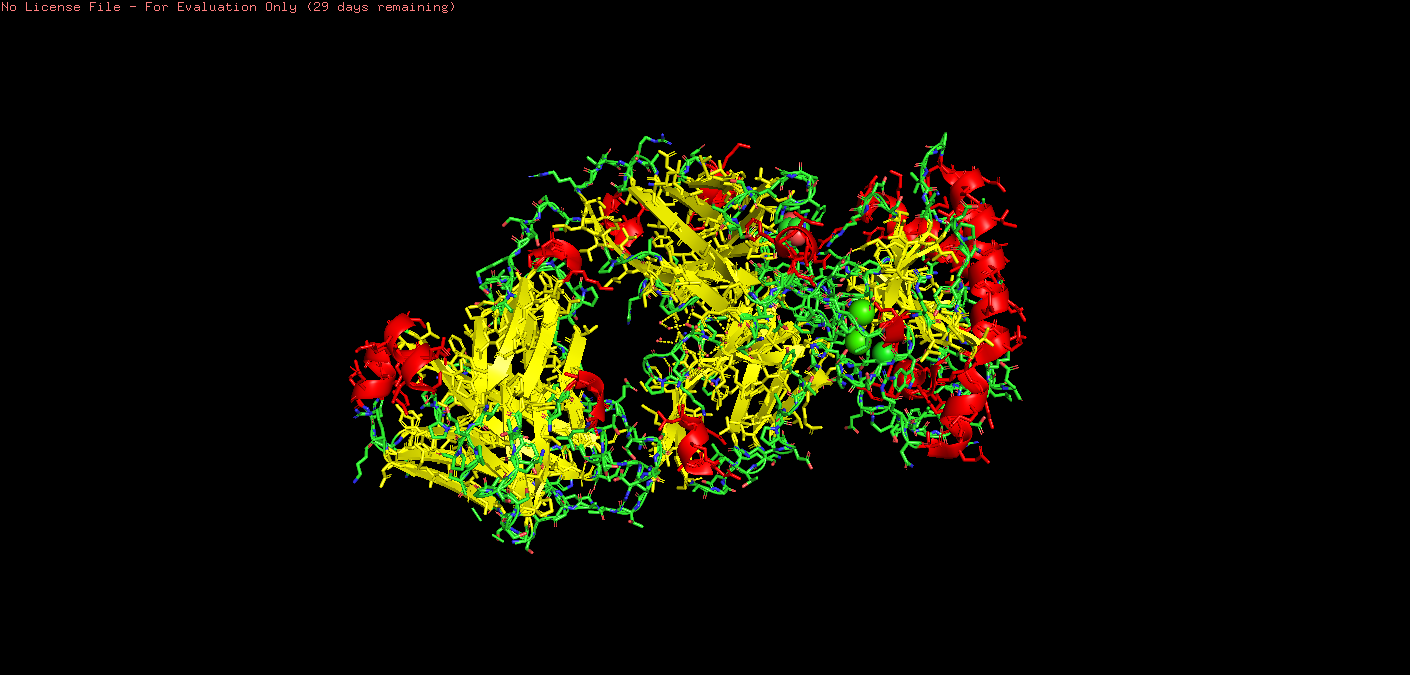
o Color the protein by secondary structure. Does it have more helices or sheets?
On PyMol I used:
*# color by secondary structure
color red, ss h # helices
color yellow, ss s # sheets
color green, ss l # loops/coils
Upon visual inspection, there seems to be more sheets.
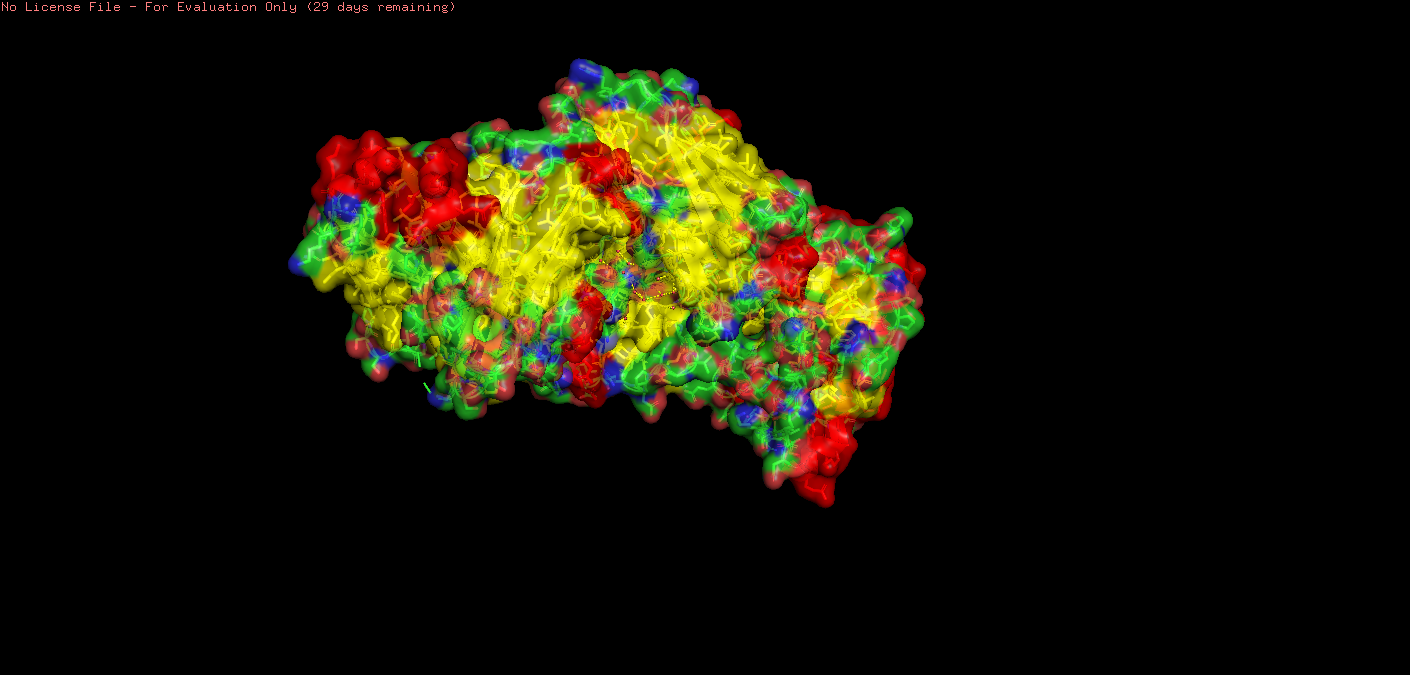
o Visualize the surface of the protein. Does it have any “holes” (aka binding pockets)?
For inspection of holes/pockets, I reduced transparency.
Setting: transparency set to 0.30000.
scene: scene stored as “004”.
I then restarted with the following code:
fetch 3m1n show surface show spheres, organic set transparency, 0.3
This showed spheres:
This showed some deeply embedded pockets, with one (I think!) more towards the surface.
May need some help with this!!
Part C. Using ML-Based Protein Design Tools
C1. Protein Language Modeling
1. Deep Mutational Scans
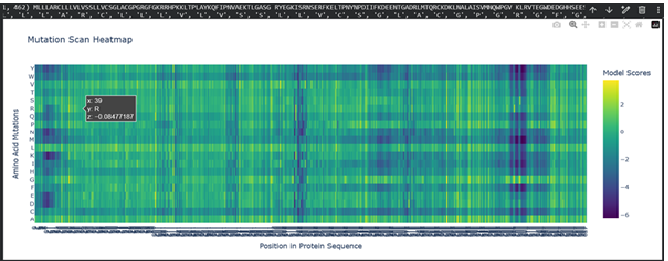
a. Use ESM2 to generate an unsupervised deep mutational scan of your protein based on language model likelihoods.
b. Can you explain any particular pattern? (choose a residue and a mutation that stands out)
Dark vertical stripes in the heatmap indicate positions where nearly all mutations score negatively; highly conserved residues critical for SHH function. Position 141 (His), part of the zinc-binding motif, shows strongly negative LLR scores for most substitutions, reflecting its essential role in zinc coordination. Interestingly, our ESMFold experiments confirmed that mutating this site (H141A/H142A) preserved the backbone fold while likely abolishing function, consistent with the language model’s predictions. In contrast, position 39 showed a near-neutral score (-0.08) for arginine substitution, expected given its location in the signal peptide which is cleaved after translation and therefore under weaker evolutionary pressure.
c. (Bonus) Find sequences for which we have experimental scans, and compare the prediction of the language model to experiment.
No systematic DMS dataset exists for SHH as far as I searched. Though, with more time I could do deeper searches. However, I would need some help with this question.
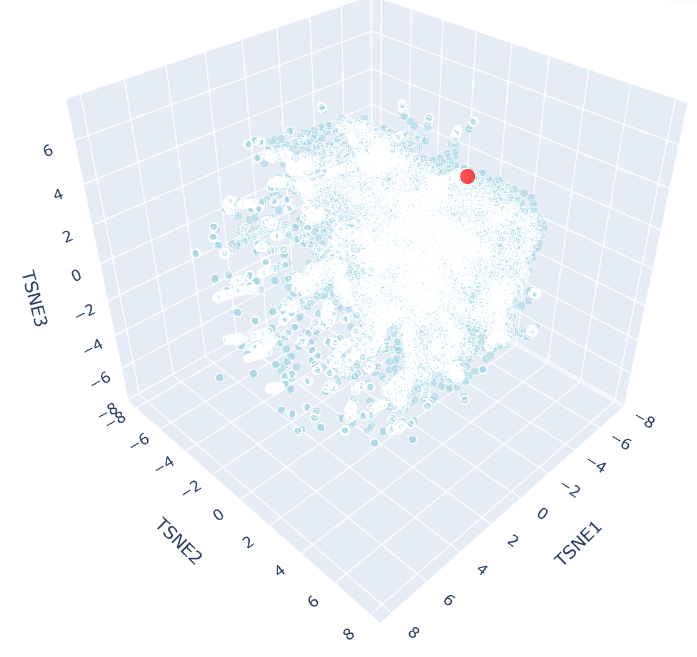
2. Latent Space Analysis
a. Use the provided sequence dataset to embed proteins in reduced dimensionality.
After realising that SHH was not included in the code, with the help of ChatGPT, I coded:
b. Analyze the different formed neighborhoods: do they approximate similar proteins?
The 3D t-SNE plot shows a single continuous distribution of SCOP protein embeddings with no sharply defined clusters, suggesting protein sequence space varies gradually across structural families. Outlier points at the periphery represent the most divergent sequences, consistent with the known continuity of protein fold space.
c. Place your protein in the resulting map and explain its position and similarity to its neighbors
SHH appears as a distinct red point near the periphery of the t-SNE cloud, reflecting its unusual biochemical features, including autocatalytic processing and lipid modification, that makes it distinct from most SCOP representatives. Despite this, it remains within the main cloud boundary, indicating shared broad sequence features with neighbouring proteins. Its nearest neighbours would be expected to include other hedgehog family members (IHH, DHH), consistent with ESM2 capturing evolutionary relationships through sequence alone.
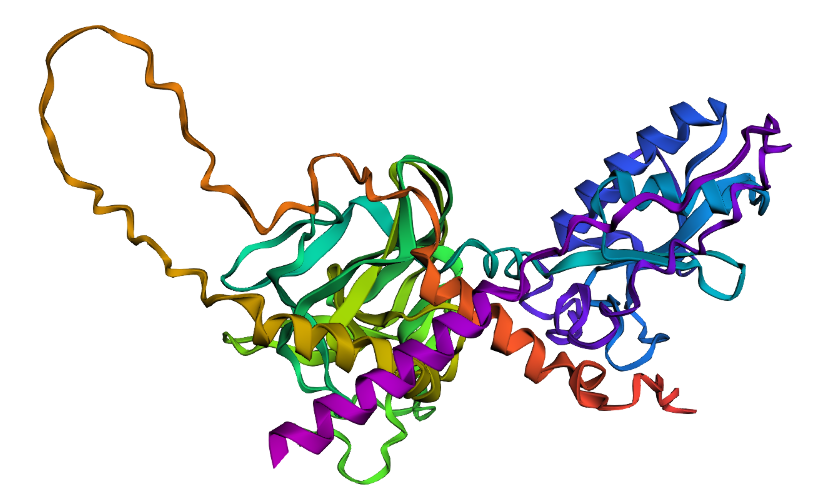
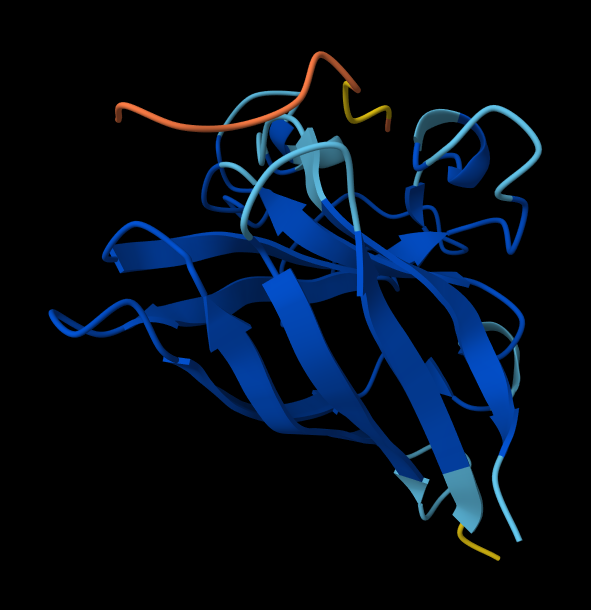
C2. Protein Folding
Folding a protein
Fold your protein with ESMFold. Do the predicted coordinates match your original structure?
Total sequence length: 462
Running ESMFold inference for sequence with length 462…
Prediction complete. ptm: 0.603 plddt: 78.225
Results saved to SHH_Fold_V1_3a3ca/
CPU times: user 1min 26s, sys: 8.6 s, total: 1min 35s
Wall time: 2min 8s
ESMFold predicted the SHH structure with a pTM of 0.603 and mean pLDDT of 78.2. The pTM score above 0.5 suggests the overall fold topology is likely correct, while the pLDDT of 78.2 indicates confident but not perfect local coordinate prediction. Regions of lower confidence likely correspond to flexible loops and the signal peptide. A full structural comparison via RMSD alignment to the crystal structure 1VHH would further quantify coordinate accuracy.
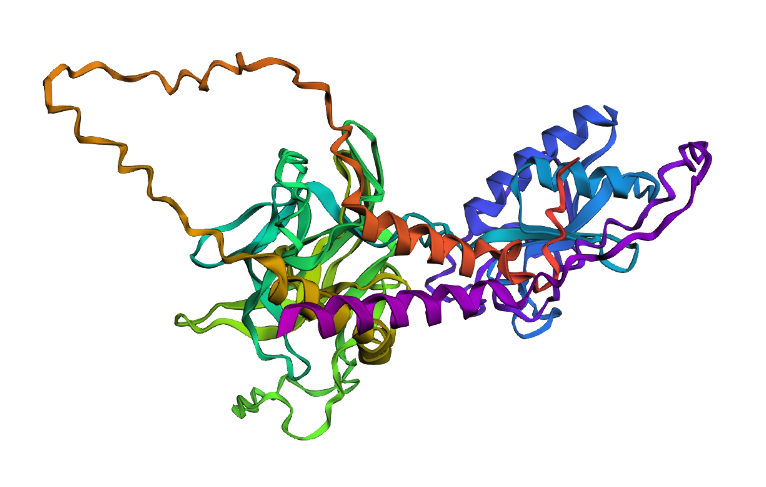
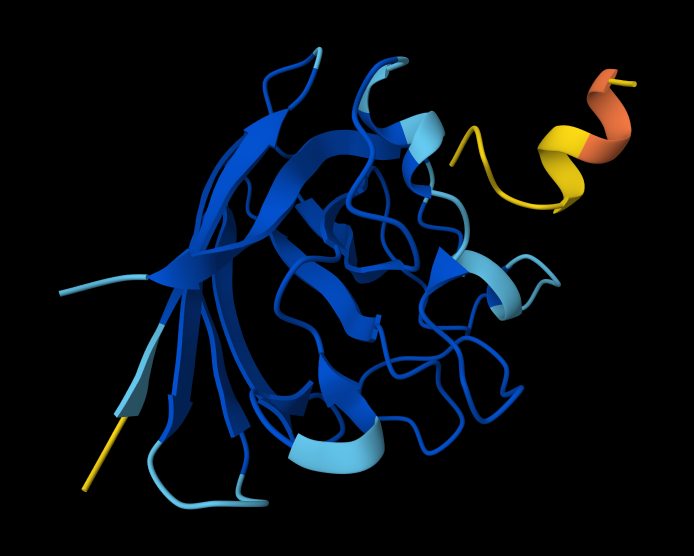
Try changing the sequence, first try some mutations, then large segments. Is your protein structure resilient to mutations?
Changed HH→AA at zinc-binding site (positions 141-142)
Total sequence length: 462
Running ESMFold inference for sequence with length 462…
Prediction complete. ptm: 0.602 plddt: 78.128
Results saved to test_2cd60/
CPU times: user 1min 25s, sys: 8.45 s, total: 1min 33s
Wall time: 2min 3s
A double point mutation at the zinc-binding site (H141A/H142A) had negligible effect on predicted structure (pTM 0.603 vs. 0.602, pLDDT 78.2 vs. 78.13), suggesting SHH’s fold is resilient to point mutations even at functionally critical residues.
Mutation:
Alanine substitution was chosen as it removes side chain functionality while preserving backbone geometry, representing a conservative but informative structural perturbation.
Replaced 25 residues with Alanines in a surface region
This resulted in:
Total sequence length: 482
Running ESMFold inference for sequence with length 482…
Prediction complete. ptm: 0.554 plddt: 72.026
Results saved to SHH_FinalMut_d0fdf/
CPU times: user 1min 40s, sys: 10.3 s, total: 1min 51s
Wall time: 2min 27s
A large segment mutation was introduced by replacing a surface region with a polyalanine stretch (26 residues), resulting in a slight sequence length increase from 462 to 482 residues due to insertion. This caused a moderate reduction in predicted structural confidence (pTM 0.603 –> 0.554, pLDDT 78.2 –> 72.0), while the fold remained above the 0.5 pTM threshold, indicating overall structural resilience.
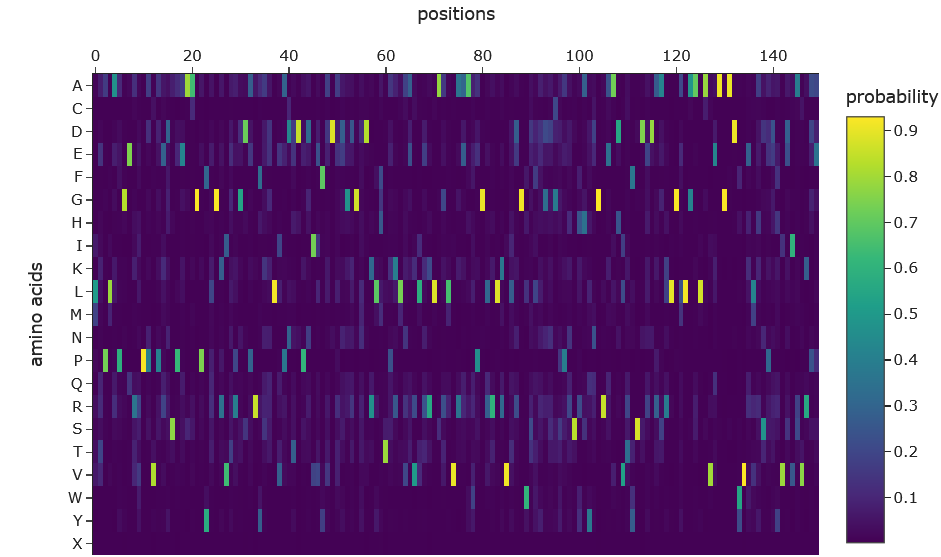
C3. Protein Generation
sequence candidates via ProteinMPNN
Analyze the predicted sequence probabilities and compare the predicted sequence vs the original one.
After installing necessary packages for ProteinMPNN, I input the latest PDB for SHH protein, 8Z2V.
The ProteinMPNN probability heatmap shows that most positions along the SHH backbone are highly constrained, with single amino acids receiving probabilities exceeding 0.9 (yellow). This reflects strong structural determinism; the backbone geometry dictates specific residue preferences at key positions. A minority of positions, particularly around residues 95–105, show broader probability distributions across multiple amino acids, indicating structurally tolerant surface-exposed regions. The overall sparsity of high-probability assignments is consistent with the 44.67% sequence recovery observed, where roughly half of positions were confidently recovered while the remainder tolerate sequence variation.
Input this sequence into ESMFold and compare the predicted structure to your original.
Running ESMFold inference for sequence with length 150…
Prediction complete. ptm: 0.910 plddt: 90.664
Results saved to SHH_Inverse_FinalMut_3f7ad/
CPU times: user 10.2 s, sys: 8.37 s, total: 18.6 s
Wall time: 47.2 s
The ProteinMPNN designed sequence, when folded by ESMFold, achieved a pTM of 0.910 and pLDDT of 90.664; substantially higher than the native SHH sequence (pTM 0.603, pLDDT 78.2). This improvement reflects two factors: first, the designed sequence covers only the structured core of SHH (150 residues vs 462), excluding disordered regions such as the signal peptide that reduce confidence scores; second, ProteinMPNN explicitly optimises sequences for backbone compatibility, producing a sequence more thermodynamically suited to the given fold than the evolutionarily derived native sequence.
Part D. Group Brainstorm on Bacteriophage Engineering
Proposal by: Sameen Nasar, Robert C Beck
Group Project Goal:
Engineering a chaperone-independent efficient MS2 lysis protein
Project Rationale:
The efficacy of bacteriophage MS2 as an antibacterial agent is currently limited by the host’s ability to evolve resistance. Specifically, E. coli can mutate the molecular chaperone DnaJ (e.g., at position P330), disrupting the essential interaction required for the MS2 lysis (L) protein to fold and function [1.] This interaction is required for proper function of the lysis protein, as DnaJ binds to the N-terminal domain of MS2 lysis protein and alleviates its inhibitory effect on lytic activity.
We propose engineering a self-activating L protein by replacing its inhibitory, chaperone-dependent N-terminal region with a computationally designed, thermodynamically stable scaffold. As this original domain is dispensable for actual lysis but creates the DnaJ dependency [2], our redesign conceptually eliminates the need for the molecular “handshake” between host and phage, allowing MS2 to fold independently and bypass bacterial control mechanisms entirely.
Schematic
MS2 Protein & DnaJ Sequences ↓ AlphaFold-Multimer Map the DnaJ binding interface
↓ RFDiffusion Design a stable, independent N-terminal scaffold
↓ ProteinMPNN Generate amino acid sequences for the new scaffold
↓ ESMFold Confirm the new single-chain mutant folds correctly
↓ AlphaFold-Multimer Confirm the mutant no longer binds to DnaJ ↓ Final L Protein Mutant for Synthesis
References
Chamakura KR, Tran JS, Young R. MS2 lysis of Escherichia coli depends on host chaperone DnaJ. J Bacteriol. 2017;199(9):e00058-17. doi:10.1128/JB.00058-17.
Chamakura KR, Edwards GB, Young R. Mutational analysis of the MS2 lysis protein L. Microbiology (Reading). 2017;163(7):961–969. doi:10.1099/mic.0.000485.
Week 5 HW: Protein Design Part II
Part A: SOD1 Binder Peptide Design (From Pranam)
Superoxide dismutase 1 (SOD1) is a cytosolic antioxidant enzyme that converts superoxide radicals into hydrogen peroxide and oxygen. In its native state, it forms a stable homodimer and binds copper and zinc.
Mutations in SOD1 cause familial Amyotrophic Lateral Sclerosis (ALS). Among them, the A4V mutation (Alanine → Valine at residue 4) leads to one of the most aggressive forms of the disease. The mutation subtly destabilizes the N-terminus, perturbs folding energetics, and promotes toxic aggregation.
Your challenge:
Design short peptides that bind mutant SOD1.
Then decide which ones are worth advancing toward therapy.
You will use three models developed in our lab:
• PepMLM: target sequence-conditioned peptide generation via masked language modeling
*I initially did this part wrong as I did not introduce the mutation into the sequence, therefore had to do it again. The following is the latest attempt
1. Begin by retrieving the human SOD1 sequence from UniProt (P00441) and introducing the A4V mutation.
2. Using the PepMLM Colab linked from the HuggingFace PepMLM-650M model card:
Using PepMLM, four candidate peptides of length 12 were generated conditioned on the mutant SOD1 (A4V) sequence. The generated peptides were WRYGPYAIELAX (pseudo-perplexity 11.85), WRYYVAALEWWE (28.73), WHNYAAAIRLKX (15.20), and WHSYAAAAELKX (9.48). For comparison, the known SOD1-binding peptide FLYRWLPSRRGG was scored against the same target, yielding a pseudo-perplexity of 20.64. Lower pseudo-perplexity values indicate higher model confidence in the predicted binder. Three of the four generated peptides outperformed the known binder, with WHSYAAAAELKX achieving the lowest score of 9.48. Notably, two of the four generated peptides, WRYGPYAIELAX and WHNYAAAIRLKX, contained a terminal X residue, representing an unknown or masked amino acid. This suggests a mismatch between the specified peptide length and the model’s generation process, and these sequences should be treated with caution or re-generated with corrected parameters before advancing to downstream evaluation.
3. Generate four peptides of length 12 amino acids conditioned on the mutant SOD1 sequence.
Binder
Pseudo Perplexity
WRYGPYAIELAX
11.85063412
WRYYVAALEWWE
28.7286821
WHNYAAAIRLKX
15.20319465
WHSYAAAAELKX
9.482601001
4. To your generated list, add the known SOD1-binding peptide FLYRWLPSRRGG for comparison.
To find the perplexity score for FLYRWLPSRRGG, I added this code (with help from LLM) to generate perplexity score on the collab notebook:
5. Record the perplexity scores that indicate PepMLM’s confidence in the binders.
After generating the 12 amino acid peptides with PepMLM on the mutant SOD1 sequence, I recorded the pseudo-perplexity scores for each (lower scores indicate higher model confidence). I then added the known SOD1-binding peptide FLYRWLPSRRGG as a reference for comparison, yielding a pseudo-perplexity of 20.64. Of the four generated peptides, three outperformed the known binder: WHSYAAAAELKX (9.48), WRYGPYAIELAX (11.85), and WHNYAAAIRLKX (15.20), while WRYYVAALEWWE (28.73) scored worse. The best performing generated peptide, WHSYAAAAELKX, achieved nearly half the perplexity of the known binder, suggesting a strong model confidence in its predicted binding to the A4V mutant SOD1 target.
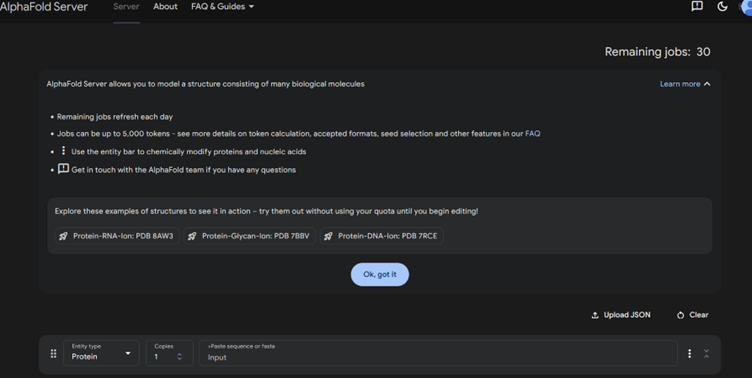
Part 2: Evaluate Binders with AlphaFold3
1. Navigate to the AlphaFold Server: alphafoldserver.com
2. For each peptide, submit the mutant SOD1 sequence followed by the peptide sequence as separate chains to model the protein-peptide complex.
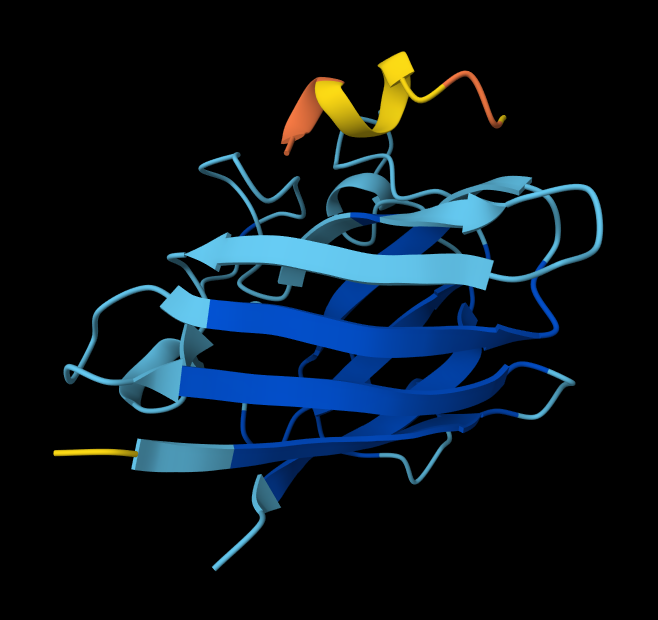
3. Record the ipTM score and briefly describe where the peptide appears to bind. Does it localize near the N-terminus where A4V sits? Does it engage the β-barrel region or approach the dimer interface? Does it appear surface-bound or partially buried?
SOD1_ProtPeptide1 (WRYGPYAIELAX)
ipTM: 0.33
The predicted complex produced an ipTM score of 0.33, indicating low confidence in the interaction between the peptide and mutant SOD1. In the structural model, the peptide appears detached from the protein surface and does not localize near the N-terminal region where the A4V mutation occurs. Instead, it remains largely solvent-exposed and does not form clear contacts with the β-barrel region of SOD1.
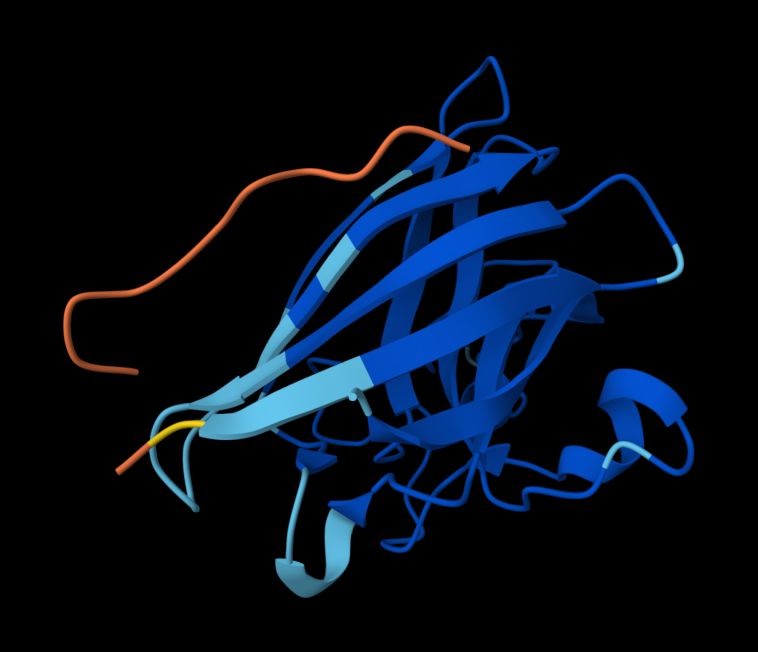
SOD1_ProtPeptide2 (WRYYVAALEWWE)
ipTM: 0.28
The predicted complex produced an ipTM score of 0.28, indicating low confidence in the interaction between the peptide and mutant SOD1. In the structural model, the peptide appears detached from the protein surface, adopting a partially helical conformation in the periphery of the structure but failing to localize near the N-terminal region where the A4V mutation occurs. The peptide does not form clear contacts with the β-barrel core and remains largely solvent-exposed.
SOD1_ProtPeptide3 (WHNYAAAIRLKX)
ipTM: 0.39
While this model has a higher ipTM score, it still has the same problems as a detached peptide, and no clear contacts make it solvent exposed.
SOD1_ProtPeptide4 (WHSYAAAAELKX)
ipTM: 0.26
Similar trends with this peptide.
4. In a short paragraph, describe the ipTM values you observe and whether any PepMLM-generated peptide matches or exceeds the known binder.
AlphaFold predictions of SOD-1 peptides produced relatively low ipTM scores ranging from 0.26¬–0.39. This indicates low confidence in stable interactions between the generated peptides and mutant SOD1. In the predicted structures, the peptides generally appear surface-exposed and do not consistently localize near the N-terminal region where the A4V mutation occurs. As a result, they are loosely structured, and do not form clear interfaces with the β-barrel core or the dimer interface.
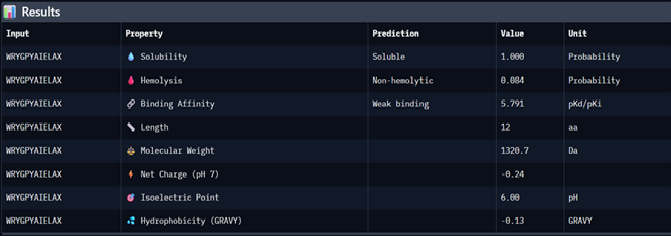
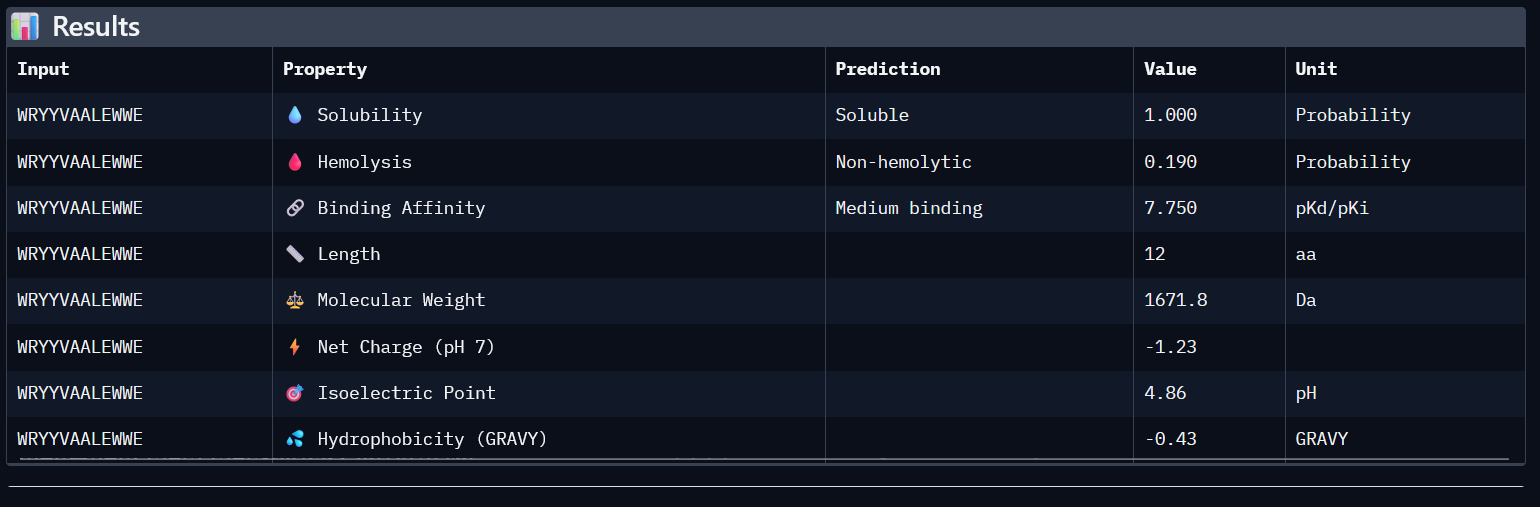
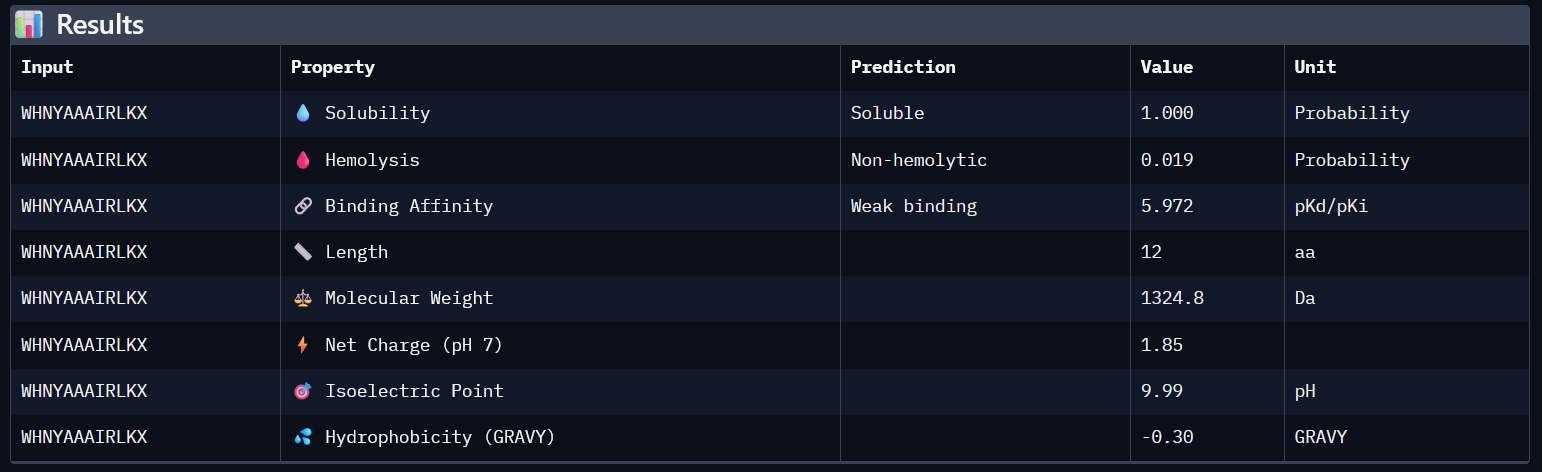
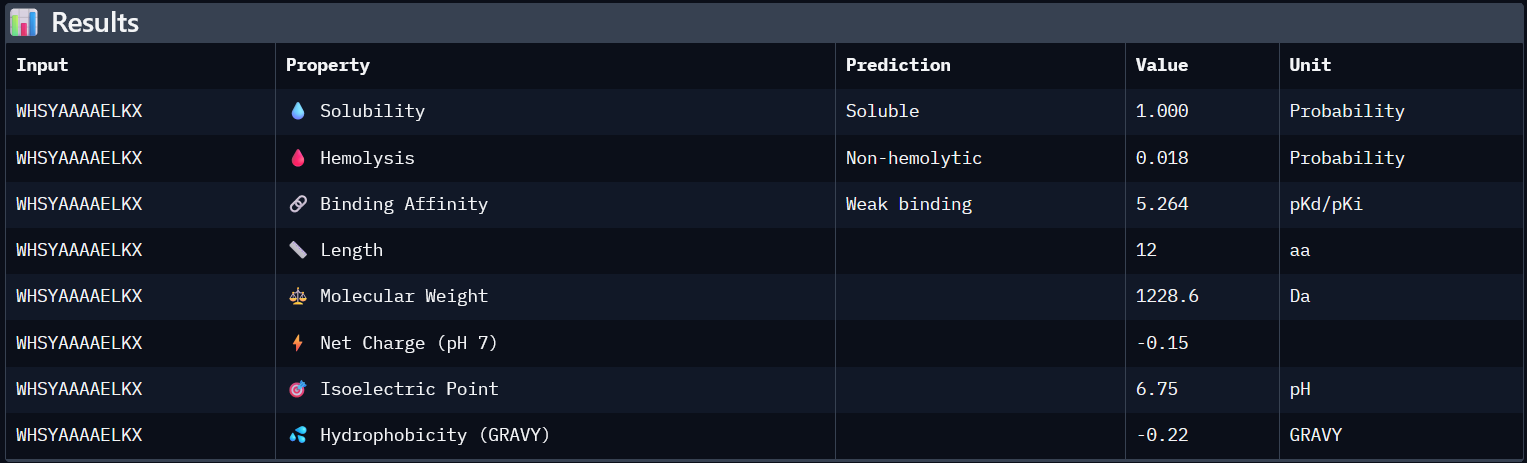
Part 3: : Evaluate Properties of Generated Peptides in the PeptiVerse
Structural confidence alone is insufficient for therapeutic development. Using PeptiVerse, let’s evaluate the therapeutic properties of your peptide! For each PepMLM-generated peptide:
Paste the peptide sequence.
Paste the A4V mutant SOD1 sequence in the target field.
Check the boxes:
Predicted binding affinity
Solubility
Hemolysis probability
Net charge (pH 7)
Molecular weight
Compare these predictions to what you observed structurally with AlphaFold3. In a short paragraph, describe what you see. Do peptides with higher ipTM also show stronger predicted affinity? Are any strong binders predicted to be hemolytic or poorly soluble? Which peptide best balances predicted binding and therapeutic properties?
Choose one peptide you would advance and justify your decision briefly.
*Candidate Peptides:
#
Binder
Pseudo Perplexity
0
WRYGPYAIELAX
11.85063412
1
WRYYVAALEWWE
28.7286821
2
WHNYAAAIRLKX
15.20319465
3
WHSYAAAAELKX
9.482601001
(0)
(1)
(2)
(3)
#
Binder
ipTM
Predicted binding affinity
Solubility
Hemolysis probability
Netcharge (pH7)
Molecular weight
0
WRYGPYAIELAX
0.33
5.791
1
0.084
-0.24
1320.7
1
WRYYVAALEWWE
0.28
7.750
1
0.190
-1.23
1671.8
2
WHNYAAAIRLKX
0.39
5.972
1
0.019
1.85
1324.8
3
WHSYAAAAELKX
0.26
5.972
1
0.019
1.85
1324.8
Higher ipTM scores do not consistently correspond to stronger predicted binding affinity in this dataset. For example, WHNYAAAIRLKX (ipTM 0.39) has a predicted binding affinity of 5.972, while WRYYVAALEWWE (ipTM 0.28) shows a higher affinity of 7.750 despite its lower structural confidence score. This suggests that ipTM and binding affinity capture different aspects of peptide-target interaction and should be considered together rather than in isolation.
All four generated peptides are highly soluble and show low hemolysis probabilities, indicating a favourable therapeutic safety profile. WHNYAAAIRLKX stands out as the most balanced candidate; it achieves the highest ipTM score (0.39), a competitive predicted binding affinity (5.972), perfect solubility, the lowest hemolysis probability in the dataset (0.019), and a positive net charge (1.85) which may favour interaction with the negatively charged surface regions of SOD1. However, it also has an unknown terminal amino acid, which is a problem for synthesis. Alternatively, WRYYVAALEWWE could also be a candidate due to its higher binding affinity and absence of X residue. Given its higher structural confidence (approx. 0.4) compared to the others, WHNYAAAIRLKX would be the most promising candidate to advance for further investigation.
Part 4: Generate Optimized Peptides with moPPIt
To edit the code, given the sliders were static, I used:
###########################################################################################################################################################
*# For meet new selections
Peptides generated with moPPIt differ from those generated by PepMLM through controlled, residue-specific generation targeting positions 1-10 of the A4V mutant SOD1 sequence, with simultaneous optimisation of hemolysis, solubility, affinity, and motif objectives.
The four generated peptides show different balances across the optimised properties. KKKKYITECLVM achieves the highest affinity score (7.178) and a strong hemolysis score (0.979), though its solubility is moderate (0.667). KLKQKKFTEKVC shows the highest motif score (0.725) alongside competitive affinity (6.900), suggesting strong localisation near the targeted N-terminal residues. ECYYVWTEQGTT offers the best solubility (0.833) but the lowest affinity and motif scores of the four. SFQKINEKVKNA presents a balanced profile across all objectives with the lowest hemolysis score (0.910).
Compared to the PepMLM-generated peptides, the moPPIt peptides benefit from explicit multi-objective optimisation, producing sequences with higher predicted affinities and targeted motif engagement rather than purely sequence-conditioned sampling.
Before advancing toward therapeutic development, these peptides would require further evaluation through in vitro binding assays to confirm SOD1 interaction, proteolytic stability testing to assess degradation resistance, and cytotoxicity screening to verify safety before progressing to in vivo studies. Special emphasis should be placed on the haemolysis, given the high scores generated by this model; this may or may not indicate high toxicity.
Part C: Final Project: L-Protein Mutants
After running the code for analysis between predicted mutations and the experimental dataset, there is little to no overlap.
Process
After running the code for analysis between predicted mutations and the experimental dataset, there is little to no overlap.
Process:
The model evaluated mutations using a log-likelihood ratio (LLR) derived from the probability distribution predicted by the ESM-2 protein language model. Mutations were then ranked by their LLR score, and predicted mutations were compared with experimental mutations using dataset merging.
The mutation C29R is present in both datasets. Experimental data shows no lysis activity, highlighting the difficulty in modelling predictions, as they do not always correspond to functional outcomes.
The model evaluated mutations using a log-likelihood ratio (LLR) derived from the probability distribution predicted by the ESM-2 protein language model. Mutations were then ranked by their LLR score, and predicted mutations were compared with experimental mutations using dataset merging.
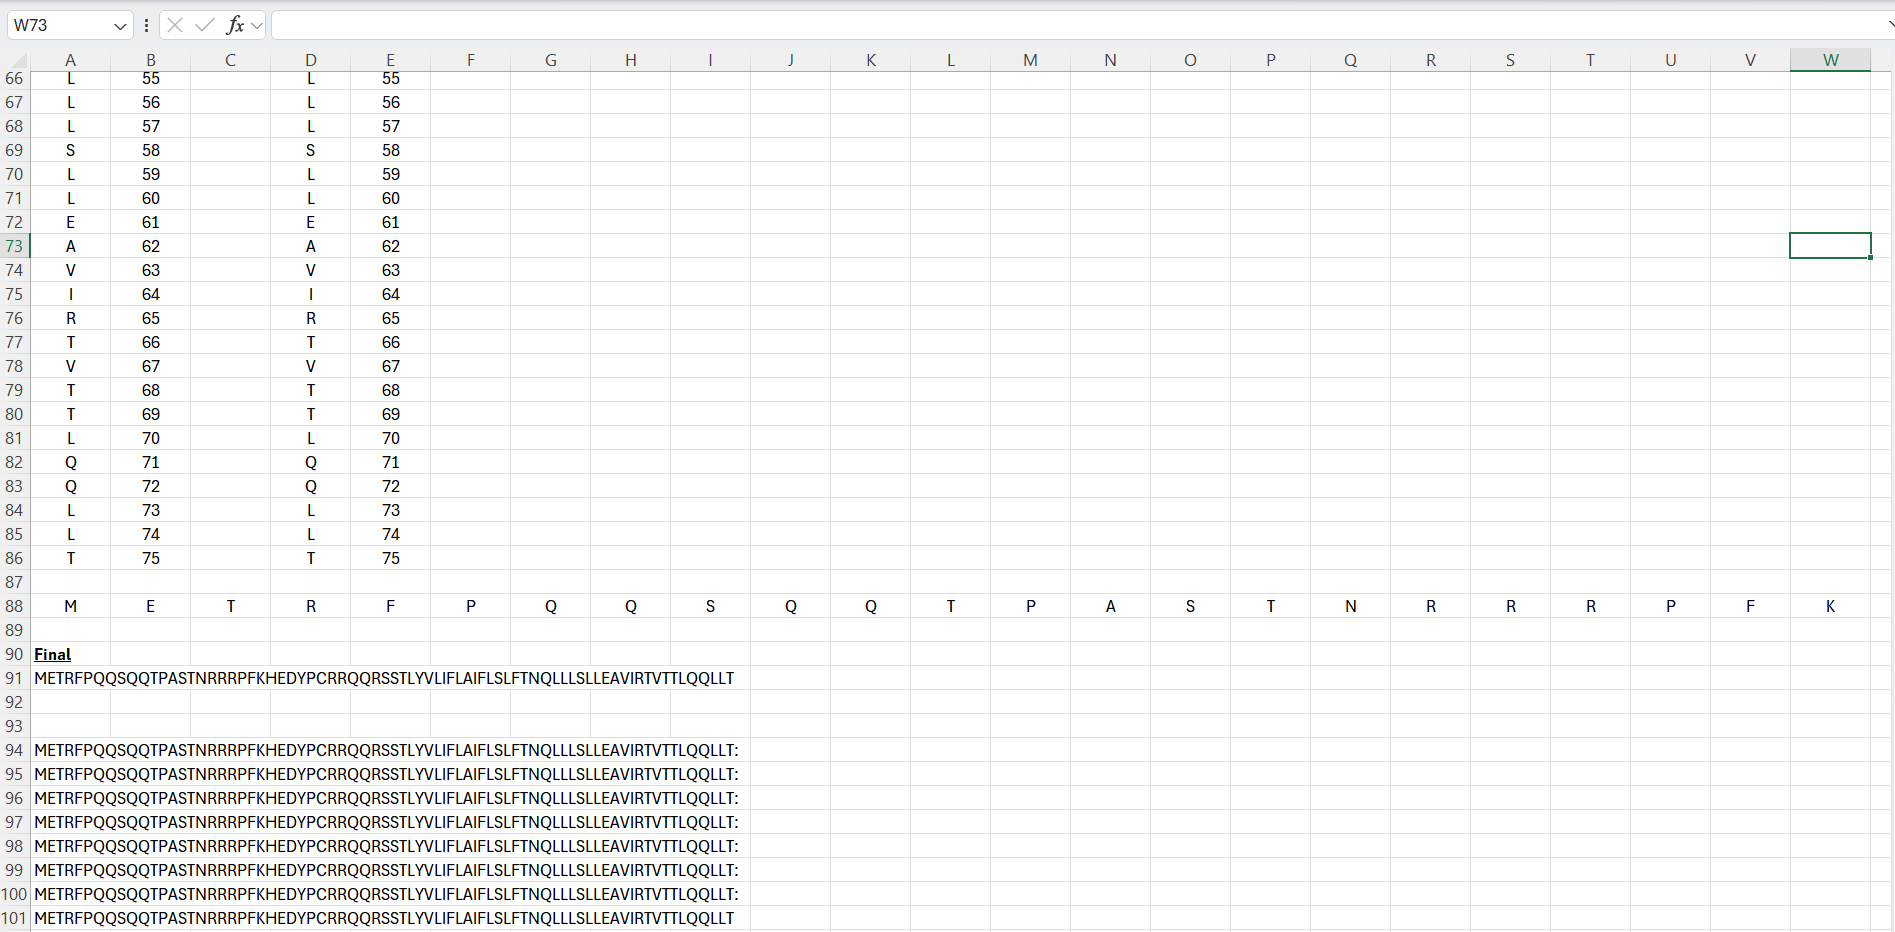
Intiailly I tried to geenrate the full length sequences via Excel through updating mutations at specific positions:
This was very tedious, therefore I switched to Python on the desktop. Python was used instead of manual editing in Excel. A script was written to apply selected point mutations to the wild-type sequence by modifying specific residue positions. The code I used is below:
From the experimental dataset, I chose the following:
Position of the mutation in L
Base Pair Changed
Amino Acid Position
Amino Acid Change
Lysis
Protein Levels
38
C->T
13
P->L
1
1
43
T->G
15
S->A
1
1
From the model, I then selected mutations with the highest LLR scores as they are the most strongly predicted from the model.
Position
Wild_Type_AA
Mutation_AA
LLR_Score
50
K
L
2.561468
29
C
R
2.395427
39
Y
L
2.24178
K50L and Y39L introduce hydrophobic residues that can help stabilize packed or core regions of the protein, consistent with the tendency for hydrophobic side chains to support structural integrity [1]. C29R adds a charged residue in a position the model favours, which may create new stabilizing interactions without disrupting folding [2]. Together these selections balance predicted stability, polarity, and structural compatibility, supporting the goal of designing functional L protein variants [3].
References
Pace CN, Fu H, Fryar KL, Landua J, Trevino SR, Shirley BA, et al. Contribution of hydrophobic interactions to protein stability. J Mol Biol. 2011;408(3):514-28.
Doig AJ, Williams DH. Is the hydrophobic effect stabilizing or destabilizing in proteins? The contribution of disulphide bonds to protein stability. J Mol Biol. 1991;217(2):389-98.
Hendsch ZS, Tidor B. Do salt bridges stabilize proteins? A continuum electrostatic analysis. Proteins. 1994;20(1):1-10.
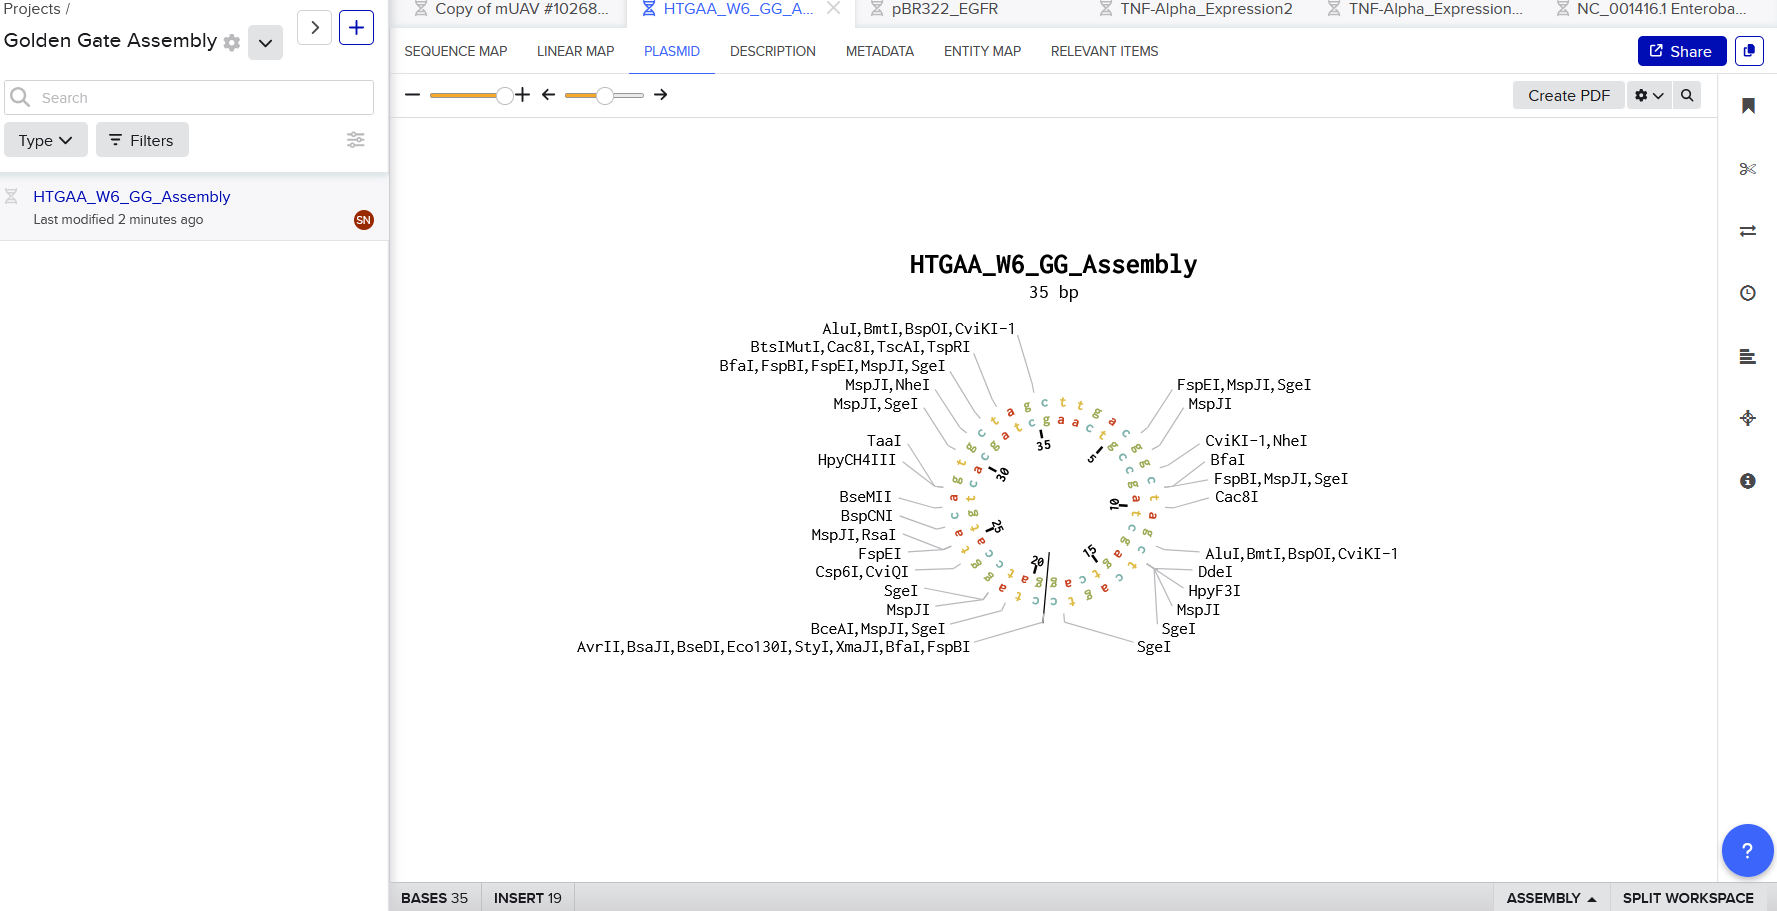
Week 6 HW: Genetic Circuits Part I: Assembly Technologies
Assignment: DNA Assembly
1. What are some components in the Phusion High-Fidelity PCR Master Mix and what is their purpose?
The template DNA is the mUAV plasmid at Used at 20 ng/µL, with 0.8 µL added to the reaction.
The primers are “colour forward” and “colour reverse”. Give that the stock concentration is 5 µL, using 2.5 µL of each primer in a total reaction volume of 25 µL results in a final primer concentration of 0.5 µM.
The Phusion HF Master mix is a solution containing DNA polymerase, nucleotides, and buffer Magnesium ions which enable accurate and efficient DNA amplification in PCR [1]. It was added at 12.5 µL from a 2X stock, resulting in a final concentration of 1X in the reaction.
Nuclease-free water is added (6.8 µL) to bring the total reaction volume up to 25 µL and ensure all components are at the correct final concentrations.
2. What are some factors that determine primer annealing temperature during PCR?
Annealing would depend on the melting point/temperature (Tm) of the primers; where annealing is generally done at 5 °C below the primer’s melting temperature [1]. Other factors include primer length, base composition (Guanine Content), salt and ion concentrations in the reaction (such as Mg2+ and monovalent salts).
3. There are two methods from this class that create linear fragments of DNA: PCR, and restriction enzyme digests. Compare and contrast these two methods, both in terms of protocol as well as when one may be preferable to use over the other.
PCR
Restriction Enzyme Digests
Amplifies any region of DNA
Requires presence of specific restriction sites
Can introduce mutations, insertions, deletions, and overhangs for Gibson assembly
The enzymes target and cleave near these sites
Highly flexible and does not require specific sequences to introduce mutations [1]
Ends produced are either sticky or blunt
They allow for precise insertion of DNA fragments into vectors [2]
For the is protocol, as it involves cloning, because it allows precise amplification of DNA fragments while introducing mutations and overlaps required for Gibson assembly. In contrast, restriction enzyme digestion would be limited to existing recognition and doesn’t easily introduce sequence changes.
4. How can you ensure that the DNA sequences that you have digested and PCR-ed will be appropriate for Gibson cloning?
Dpnl is a restriction enzyme that selectively digests methylated DNA, leaving unmethylated PCR products untouched [1]. Therefore, according to the lab protocol, adding 1 µL of dpnl to each sample to digest methylated DNA digests the mUAV template so that only newly created PCR fragments are introduced into the following Gibson Assembly step.
5. How does the plasmid DNA enter the E. coli cells during transformation?
The most common forms of transformation are:
(i) Heat shock: Creating pores in cell wall through abrupt temperature changes
(ii) Electroporation: Generating pores via electrical voltage
These methods cause the wall to open up and create pores in the cell membrane, after which plasmids enter the bacteria through diffusion. After the initial heat/electric shock and entry, the pores eventually close up. Inside the bacteria, the plasmids replicate.
6. Describe another assembly method in detail (such as Golden Gate Assembly)
Explain the other method in 5 - 7 sentences plus diagrams (either handmade or online).
Model this assembly method with Benchling or Asimov Kernel!
(1) The Golden Gate Assembly is a molecular cloning method that uses only the sequential or simultaneous activities of a single type IIS restriction enzyme and T4 DNA ligase [1], this enabled multiple inserts to be placed into the vector backbone in a single reaction.
Type IIS enzymes include BsaI, BsmBI, or BbsI [1, 2]. These cut DNA at a defined distance away from their recognition sites, rather than within them. This feature enables the generation of user-defined overhangs/fusion sites, which can be further designed to be unique and complementary guiding ordered and ligation of DNA parts with high specificity [2].
The reaction is done in 1 tube, where restriction digestion and ligation using T4 DNA ligase, increasing efficiency and reducing steps. Importantly, the recognition sites are removed during assembly, resulting in a seamless DNA construct [2]. The cyclic process of ligation (16 °C) and digestion (37 °C) facilitates repeated breakdown of incorrect assemblies and enhances growth of the selected product.
Tried to reference this whole process in this illustrated diagram:
To start, I tried entering J23100 Promoter sequence (35 nucleotides) into Benchling:
To facilitate Golden Gate Assembly, the promoter was then designed with flanking BsaI sites that allow the enzyme to create unique 4-base overhangs, ensuring the fragment inserts into the backbone in the correct orientation without leaving a ‘scar’ sequence. Therefore, I input (with some help from gemini to generate):
As comitted online listener associated with Lifefabs, we did not have access to Asimov Kernal. Therefore, with permission of Node leads this was skipped
Week 7 Genetic Circuits Part II
Assignment Part 1: Intracellular Artificial Neural Networks (IANNs)
1. What advantages do IANNs have over traditional genetic circuits, whose input/output behaviors are Boolean functions?
The advantages of IANNs over traditional circuits include:
(i) Continuous processing which allows them to constantly measure changes in concentration gradients of cellular inputs rather than just their absolute presence or absence.
(ii) Relatively easier to scale up. That is, new inputs can be programmed by integrating additional weighted connections to existing nodes without completely rewiring the circuit.
(iii) Better adapted to non-linear classifications. Given IANNs continuously process as opposed to a Boolean (On/Off) logic, they can respons better to complex cell-state classification (e.g. distinguishing highly specific cell types)
Britto Bisso F, Aguilar R, Shree D, Zhu Y, Espinoza M, Diaz B, Cuba Samaniego C. Pattern recognition in living cells through the lens of machine learning. Open Biol. 2025 Jul 16;15(7):240377. doi: 10.1098/rsob.240377
Moorman A. Machine learning inspired synthetic biology: neuromorphic computing in mammalian cells [thesis]. Cambridge (MA): Massachusetts Institute of Technology; 2020. Available from: https://dspace.mit.edu/handle/1721.1/129864
2. Describe a useful application for an IANN; include a detailed description of input/output behavior, as well as any limitations an IANN might face to achieve your goal.
From researching papers related to the application of IANNs, I came across some interesting papers working exploring the use of bacteria to act as biosensors in soil or any agricultural mediums. For example, a paper by Del Valle and colleagues looked to looked to engineer modular genetic circuits that allow microbes to process complex, multi-variable environmental signals from the soil matrix and dynamically convert them into measurable cellular outputs.
From researching papers related to the application of IANNs, I came across some interesting papers working exploring the use of bacteria to act as biosensors in soil or any agricultural mediums. For example, a paper by Del Valle and colleagues looked to engineer modular genetic circuits that allow microbes to process complex, multi-variable environmental signals from the soil matrix and dynamically convert them into measurable cellular outputs [1].
A potential idea could be to use engineering modular circuits to clean up arsenic in soil. Where, inputs would be:
X1 : Concertation of Arsenic to be measured by proteins such as the ArsR protein, which is a naturally occurring arsenic-responsive transcription factor often borrowed from E. coli or Chromobacterium violaceum) [2].
X2 : Soil pH, measured by pH-responsive promoters. As demonstrated by Bañares et al. [3], genetic sensors can be used to dynamically regulate cellular outputs based on changing pH levels. Here, we use pH sensors to create a “bandpass filter” for the circuit.
Process:
IANNs will serve as weighted classifiers for that computes if Arsenic is high AND soil pH within a safe zone
OUTPUT: If conditions are met, the network activates the ArsR protein.
If soil increases above threshold pH, if it is too high the IANN turns OFF
Del Valle, I., Fulk, E. M., Kalvapalle, P., Silberg, J. J., Masiello, C. A., & Stadler, L. B. (2021). Translating New Synthetic Biology Advances for Biosensing Into the Earth and Environmental Sciences. Frontiers in Microbiology, 11. https://doi.org/10.3389/fmicb.2020.618373
Berset Y, Merulla D, Joublin A, Hatzimanikatis V, van der Meer JR. Mechanistic modeling of genetic circuits for ArsR arsenic regulation. ACS Synth Biol. 2017;6(5):862–874. doi:10.1021/acssynbio.6b00364
Bañares AB, Valdehuesa KNG, Ramos KRM, Nisola GM, Lee WK, Chung WJ. A pH-responsive genetic sensor for the dynamic regulation of D-xylonic acid accumulation in Escherichia coli. Applied Microbiology and Biotechnology. 2020 Mar;104(5):2097-2108. doi: 10.1007/s00253-019-10297-0.
3. Below is a diagram depicting an intracellular single-layer perceptron where the X1 input is DNA encoding for the Csy4 endoribonuclease and the X2 input is DNA encoding for a fluorescent protein output whose mRNA is regulated by Csy4. Tx: transcription; Tl: translation.
Draw a diagram for an intracellular multilayer perceptron where layer 1 outputs an endoribonuclease that regulates a fluorescent protein output in layer 2.
Assignment Part 2: Fungal Materials
1. What are some examples of existing fungal materials and what are they used for? What are their advantages and disadvantages over traditional counterparts?
Some examples include:
(i) Mycelium bio-composites which include fungi-derived leather substitutes. The advantages of these are they allow to bypass the killing of animals and avoid microplastic pollution in the long term
(ii) In architecture and construction, there are mycelium panels and acoustic tiles. Companies that utilise mycelium include Biohm (https://www.biohm.co.uk/mycelium)
(iii) Protective packaging. MycoComposite is used by companies as a substitute to Styrofoam.
Bentangan M, Greetham D, Ross R, Kaplan-Bie L. Recent technological innovations in mycelium materials as leather substitutes: a patent review. Front Bioeng Biotechnol. 2023;11:1204861. https://doi.org/10.3389/fbioe.2023.1204861
Advantages
Animal free production
Quick turnaround given mushrooms have quick growth
Minimise agricultural waste
Low density and eco-friendly for building materials
Disadvantages
Easily biodegradable
Production scalability is low compared to traditional counterparts
Sensitivity moisture may reduce applicability
2. What might you want to genetically engineer fungi to do and why? What are the advantages of doing synthetic biology in fungi as opposed to bacteria?
Using the heat and drought resistance in engineered mycelium strains by engineering the overexpression of stress-response genes to confer drought and heat resistance in mycelium-based materials. This would be helpful beyond controlled laboratory environments, making fungal material manufacturing feasible in hotter, drier climates such as those found across.
The advantages of this would be that, as they are eukaryotes, they possess the post-translational machinery needed to produce and properly fold complex structural proteins that bacteria is unable to do. There is minimum downstream costs as it would not have to be derived, as mycelium would be used.
Assignment Part 3: First DNA Twist Order
Review Part 3: DNA Design Challenge of the week 2 homework. Design at least 1 insert sequence and place it into the Benchling/Kernel/Other folder you shared in the Google Form above. Document the backbone vector it will be synthesized in on your website.
Going back, I saw that after codon optimisation in week 2, there it did not start with “ATG”. I added it along with “CC” at the 3’ end (with help of claude.ai).
Having problems with inserting backbone with digest and ligate:
Initial restriction enzyme setup caused incompatibility because the TNF-α insert did not generate matching sticky ends (NdeI site absent or not properly cut), leading to “left sticky end mismatch” errors.
In Benchling Digest & Ligate, manual sequence selection was invalid; only enzyme-generated digest fragments could be used for backbone and insert assignment, causing assembly to remain disabled.
In Gibson assembly, incorrect fragment selection (partial backbone instead of full pET-28a(+) plasmid) led to unset components and failed assembly preview errors. Therefore, should I use full plasmid??
Would like some help on this
Week 9 Week 9 — Cell-Free Systems
General homework questions
1. Explain the main advantages of cell-free protein synthesis over traditional in vivo methods, specifically in terms of flexibility and control over experimental variables. Name at least two cases where cell-free expression is more beneficial than cell production.
Advantages of cell-free protein synthesis (CFPS) over traditional in-vivo methods:
(i) Greater flexibility and control: Given that cells do not need to stay “alive” and the absence of a cell wall, it is possible to manipulate cells in real time; add chaperones, cofactors etc [1].
(ii) Rapid development of prototypes: Where in-vivo methods require cloning DNA into plasmids and transforming host cells, the CFPS allows us to essentially ‘drag and drop’ DNA with raw PCR products and observe protein expression in short periods of time (e.g. hours) [2]
Cases where CFPS provides benefits over in-vivo methods:
(i) Expression of toxic/dangerous antimicrobial peptides, potent neurotoxins, or complex membrane proteins in vivo. Usually the host cell would ‘die’ before reaching a large protein yield, as the CFPS is technically dead, it can synthesize toxic therapeutics and viral vectors that would be impossible to harvest from living cultures [2]
(ii) The open environment lets you easily swap natural amino acids for synthetic ones, enabling efficient, site-specific incorporation of non-standard amino acids (nsAAs) without competing with host metabolism [2]
Khambhati K, Bhattacharjee G, Gohil N, Braddick D, Kulkarni V, Singh V. Exploring the potential of cell-free protein synthesis for extending the abilities of biological systems. Front Bioeng Biotechnol. 2019;7:248.
Silverman AD, Kelley-Loughnane N, Jewett MC. Cell-free gene expression: an expanded repertoire of applications. Nat Rev Genet. 2020;21(3):151-70.
2. Describe the main components of a cell-free expression system and explain the role of each component.
(i) Cell extract (machinery): Derived from lysed cells (like E. coli), this extract provides the core transcriptional and translational machinery, including ribosomes and RNA polymerase, required to build the protein
(ii) Genetic template (blueprint): The DNA plasmid or RNA template that contains the specific gene sequence of the target protein we want to express
(iii) Nucleotides and amino acids (building blocks): Nucleotides—Adenosine triphosphate (ATP), Guanosine triphosphate (GTP), Cytidine triphosphate (CTP), and Uridine triphosphate (UTP)—are supplied for ribonucleic acid (RNA) synthesis (transcription), while transfer RNAs (tRNAs) pair with messenger RNA (mRNA) to deliver the amino acids necessary for protein synthesis (translation)
(iv) Energy systems: immediate energy sources like adenosine triphosphate (ATP) are paired with intermediate metabolites like 3-phosphoglycerate (3-PGA) or phosphoenolpyruvate (PEP) to continuously regenerate energy and maintain reaction stability.
HEPES: 4-(2-hydroxyethyl)-1-piperazineethanesulfonic acid (buffer to maintain a stable pH for optimal enzyme activity)
Mg: Magnesium (cofactor for transcription and translation enzymes)
DTT: Dithiothreitol (reducing agent that maintains a non-oxidizing environment to protect protein residues)
Sodium Oxalate: This is already the full chemical name (there is no abbreviation here, though its chemical formula is Na₂C₂O₄) (prevent magnesium precipitation, stabilizing the ionic balance)
3. Why is energy provision regeneration critical in cell-free systems? Describe a method you could use to ensure continuous ATP supply in your cell-free experiment.
Transcription and translation consume ATP/GTP rapidly, and the by-product inorganic phosphate chelates Mg²⁺, stalling ribosomes within roughly 1 hour without replenishment.
For continuous ATP supply, a possible system such as phosphoenolpyruvate (PEP) + pyruvate kinase, or creatine phosphate + creatine kinase, continuously re-phosphorylates ADP to ATP, sustaining synthesis for several hours.
Filippo Caschera, Vincent Noireaux. Synthesis of 2.3 mg/ml of protein with an all Escherichia coli cell-free transcription-translation system. Biochimie. 2014 Apr;99:162-168. doi: 10.1016/j.biochi.2013.11.025. Epub 2013 Dec 8. PMID: 24326247
4. Compare prokaryotic versus eukaryotic cell-free expression systems. Choose a protein to produce in each system and explain why.
Prokaryotic systems such as E. coli S30 give high yields, are low cost, and have fast turnaround but lack post-translational modifications (PTMs); eukaryotic systems (wheat germ, CHO, HeLa) yield less but support glycosylation, disulfide bonds, and complex folding.
Therefore choosing:
GFP as it folds autonomously, no PTMs, ideal for rapid high-yield prototyping.
Eukaryotic choice: erythropoietin (EPO) as it requires N-glycosylation and disulfide bonds for activity, only achievable in a mammalian lysate
Anne Zemella, Lena Thoring, Christian Hoffmeister, Stefan Kubick. Cell-free protein synthesis: Pros and cons of prokaryotic and eukaryotic systems. ChemBioChem. 2015 Nov;16(17):2420-2431. doi: 10.1002/cbic.201500340. Epub 2015 Oct 19. PMID: 26478227; PMCID: PMC4676933.
5. How would you design a cell-free experiment to optimize the expression of a membrane protein? Discuss the challenges and how you would address them in your setup.
Challenges:
(i) Hydrophobic domains aggregate in aqueous mixes, the protein needs a lipid-like environment to fold
(ii) This could be toxic in-vivo
Design:
(i) Template: T7-driven, His-tagged construct of the membrane protein
(ii) Extract: E. coli S30 lysate
(iii) Supplement (test in parallel): mild detergents (Brij-35, DDM), nanodiscs (MSP + lipids), or liposomes
(iv) Optimise: Mg²⁺, K⁺, and temperature in a small factorial screen
Validation:
(i) SDS-PAGE + anti-His Western blot to confirm expression
(ii) Ultracentrifugation to separate soluble vs membrane-inserted fractions
(iii) Functional or ligand-binding assay to confirm native folding
Daniel Schwarz, Friederike Junge, Florian Durst, Nadine Frölich, Birgit Schneider, Sina Reckel, Solmaz Sobhanifar, Volker Dötsch, Frank Bernhard. Preparative scale expression of membrane proteins in Escherichia coli-based continuous exchange cell-free systems. Nat Protoc. 2007;2(11):2945-2957.
Imagine you observe a low yield of your target protein in a cell-free system. Describe three possible reasons for this and suggest a troubleshooting strategy for each.
(i) Energy depletion: add a regeneration system (PEP/pyruvate kinase or creatine phosphate/creatine kinase) or use a continuous-exchange (CECF) reactor.
(ii) Misfolding or proteolysis: lower temperature to 25 °C, add chaperones (GroEL/ES, DnaK) and protease/RNase inhibitors
(iii) Inefficient setup: re-purify DNA, check integrity on gel, ensure a T7 promoter and strong RBS, titrate 5–20 ng/µL
Adam D. Silverman, Ashty S. Karim, Michael C. Jewett. Cell-free gene expression: an expanded repertoire of applications. Nat Rev Genet. 2020 Mar;21(3):151-170. doi: 10.1038/s41576-019-0186-3. Epub 2019 Nov 28. PMID: 31780816.
Homework question from Kate Adamala
Function
A synthetic minimal cell that expands gut-brain axis signalling.
Input: Tumor Necrosis Factor-alpha (TNF-α), elevated in intestinal inflammation.
Output of SMC: 5-hydroxytryptophan (5-HTP), a serotonin precursor.
Output of whole system: increased serotonin production in enterochromaffin cells, improving mood-relevant signalling.
Could this be cell-free transcription/translation (Tx/Tl) without encapsulation?
No, encapsulation is required to spatially contain the enzymatic conversion of tryptophan to 5-HTP, preventing uncontrolled release and ensuring TNF-α-triggered production only.
Could a genetically modified natural cell do this?
Yes, but SMCs offer safer, non-replicating, controllable delivery without risk of horizontal gene transfer or colonisation.
Desired outcome:
In the presence of intestinal inflammation, SMCs locally produce and release 5-HTP, dampening the inflammation-serotonin deficit link in the gut-brain axis.
Small molecules: tryptophan (encapsulated substrate)
Measurement:
Enzyme-linked immunosorbent assay (ELISA) or high-performance liquid chromatography (HPLC) for 5-HTP output; serotonin levels in co-cultured enterochromaffin cells
Paul Strandwitz. Neurotransmitter modulation by the gut microbiota. Brain Res. 2018;1693(Pt B):128-133. doi:10.1016/j.brainres.2018.03.015.
Júlia Leão Batista Simões, Geórgia de Carvalho Braga, Charles Elias Assmann, Margarete Dulce Bagatini. Targeting the gut-immune-brain axis: pharmacological insights from depression in inflammatory bowel disease. Front Pharmacol. 2026 Apr 1;17:1793292. doi:10.3389/fphar.2026.1793292. PMID: 41993582; PMCID: PMC13079007.
Homework question from Peter Nguyen
Freeze-dried cell-free systems can be incorporated into all kinds of materials as biological sensors or as inducible enzymes to modify the material itself or the surrounding environment. Choose one application field — Architecture, Textiles/Fashion, or Robotics — and propose an application using cell-free systems that are functionally integrated into the material. Answer each of these key questions for your proposal pitch:
• Write a one-sentence summary pitch sentence describing your concept.
• How will the idea work, in more detail? Write 3-4 sentences or more.
• What societal challenge or market need will this address?
• How do you envision addressing the limitation of cell-free reactions (e.g., activation with water, stability, one-time use)?
Walls or tiles in homes in arsenic-endemic regions embedded with cell-free biosensors that visibly indicate arsenic contamination that change colour when water containing arsenic flows over or is applied to them.
• Freeze-dried cell-free systems containing ArsR biosensor embedded into a porous tile or panel surface coating
• HH member applies/splashes water sample onto the tile
• Water rehydrates the cell-free system
• If arsenic present –> colour change visible to the naked eye | can be a “testing wall”
Works towards one contributor of chronic kidney disease from arsenic. Prevalence is higher among communities dependent on communal wells. Additionally, no behaviour change would be needed, it would be part of regular chores/tasks.
Addressing cell-free system limitations:
Activation with water: Naturally solved through water sample application is the intended use, making rehydration a feature rather than a limitation
Stability: Freeze-drying into a protective hydrogel matrix embedded within the ceramic tile pores confers long shelf-life; tiles can be stored and installed in hot climates without refrigeration, as freeze-dried cell-free systems have demonstrated stability at ambient temperatures for extended periods
Homework question from Ally Huang
Freeze-dried cell-free reactions have great potential in space, where resources are constrained. As described in my talk, the Genes in Space competition challenges students to consider how biotechnology, including cell-free reactions, can be used to solve biological problems encountered in space. While the competition is limited to only high school students, your assignment will be to develop your own mock Genes in Space proposal to practice thinking about biotech applications in space!
For this particular assignment, your proposal is required to incorporate the BioBits® cell-free protein expression system, but you may also use the other tools in the Genes in Space toolkit (the miniPCR® thermal cycler and the P51 Molecular Fluorescence Viewer). For more inspiration, check out https://www.genesinspace.org/.
(1) Provide background information that describes the space biology question or challenge you propose to address. Explain why this topic is significant for humanity, relevant for space exploration, and scientifically interesting. (Maximum 100 words)
Future missions to Mars and icy moons such as Europa will be unable to return contaminated samples to Earth for analysis, requiring an on-site biological screening tool. A rapid, equipment-minimal, on-site biological screening tool for astronaut safety and planetary protection which would be in the form of freeze-dried cell-free systems offer a uniquely stable, rehydration-activated solution deployable without refrigeration or living cells across multi-year deep space missions.
(2) Name the molecular or genetic target that you propose to study. Examples of molecular targets include individual genes and proteins, DNA and RNA sequences, or broader -omics approaches. (Maximum 30 words)
Pathogen-specific messenger RNA (mRNA) sequences from Pseudomonas aeruginosa and Salmonella, detected via toehold switch riboregulators.
(3) Describe how your molecular or genetic target relates to the space biology question or challenge your proposal addresses. (Maximum 100 words)
Toehold switches are synthetic riboregulators that only trigger translation of a fluorescent reporter when a specific target RNA is present. Embedding these into the BioBits cell-free system creates a programmable, rehydration-activated biosensor that can be reprogrammed for different pathogens or extraterrestrial biosignatures.
(4) Clearly state your hypothesis or research goal and explain the reasoning behind it. (Maximum 150 words)
Freeze-dried BioBits cell-free systems incorporating pathogen-specific toehold switches can be rehydrated with extraterrestrial liquid samples and produce a detectable fluorescent signal within 2–3 hours, enabling rapid on-site pathogen screening without living cells or complex equipment, even under microgravity conditions.
(5) Outline your experimental plan - identify the sample(s) you will test in your experiment, including any necessary controls, the type of data or measurements that will be collected, etc. (Maximum 100 words)
(i) Rehydrate toehold switch BioBits reactions with pathogen RNA spiked into simulated Martian brine and Europa ocean analogue solutions
(ii) Pre-amplify trace nucleic acids using miniPCR where sample concentrations are too low for direct detection
(iii) Visualise and quantify fluorescent output using the P51 Molecular Fluorescence Viewer
(iv) Controls: sterile water (negative) and non-target RNA (specificity)
(v) Repeat all experiments under simulated microgravity to confirm performance consistency
Selin Kocalar, Bess M Miller, Ally Huang, Emily Gleason, Kathryn Martin, Kevin Foley, D Scott Copeland, Michael C Jewett, Ezequiel Alvarez Saavedra, Sebastian Kraves. Validation of cell-free protein synthesis aboard the International Space Station. ACS Synth Biol. 2024 Mar 15;13(3):942-950. doi:10.1021/acssynbio.3c00733
Week 10 — Imaging and measurement
Homework: Waters Part I — Molecular Weight
We will analyze an eGFP standard on a Waters Xevo G3 QTof MS system to determine the molecular weight of intact eGFP and observe its charge state distribution in the native and denatured (unfolded) states. The conditions for LC-MS analysis of intact protein cause it to unfold and be detected in its denatured form (due to the solvents and pH used for analysis).
1. Based on the predicted amino acid sequence of eGFP (see below) and any known modifications, what is the calculated molecular weight? You can use an online calculator like the one at https://web.expasy.org/compute_pi/
eGFP Sequence:
MVSKGEELFTG VVPILVELDG DVNGHKFSVS GEGEGDATYG KLTLKFICTT GKLPVPWPTL VTTLTYGVQC FSRYPDHMKQ HDFFKSAMPE GYVQERTIFF KDDGNYKTRA EVKFEGDTLV NRIELKGIDF KEDGNILGHK LEYNYNSHNV YIMADKQKNG IKVNFKIRHN IEDGSVQLAD HYQQNTPIGD GPVLLPDNHY LSTQSALSKD PNEKRDHMVL LEFVTAAGIT LGMDELYKLE HHHHHH
Note: This contains a His-purification tag (HHHHHH) and a linker (the LE before it).
After inputting into the eGFP sequence into the online calculator I get:
Theoretical pI/Mw: 5.90 / 28006.60
2. Calculate the molecular weight of the eGFP using the adjacent charge state approach described in the recitation. Select two charge states from the intact LC-MS data (Figure 1) and:
I. Determine for each adjacent pair of peaks using:
From figure 1 I picked:
m/zn: 933.7349
m/zn+1: 903.7148
Plugging in values:
z = 903.7148/(933.7349 - 903.7148)
z = 31.1037
II. Determine the MW of the protein using the relationship between m/z_n , MW, and z.
Using derivation of deconvolution for ’n’':
Top
m/zn+1 903.7148
minus 1
Top 902.7148
Bottom
m/zn 933.7349
m/zn - m/zn+1 30.0201
Therefore,
n = Top/Bottom ~ 30.07035
Therefore,
MW = (n x m/zn – n)
{(30.0703462) * (933.7349)} - 30.07035
MW = 28047.66 Da
III. Calculate the accuracy of the measurement using the deconvoluted MW from 2.2 and the predicted weight of the protein from 2.1 using:
Accuracy = |28047.66 - 28006.60|Da/(28006.60)Da
= 0.001466131 (0.15%)
3. Can you observe the charge state for the zoomed-in peak in the mass spectrum for the intact eGFP? If yes, what is it? If no, why not?
No, it is difficult to determine charged state from zoomed-in peak by itself. The isotropic peaks are not clear, therefore the space needed to identify z cannot be found.
Homework: Waters Part II — Secondary/Tertiary structure
Homework: Waters Part III — Peptide Mapping - primary structure
We will digest the eGFP protein standard into peptides using trypsin (an enzyme that selectively cleaves the peptide bond after Lysine (K) and Arginine (R) residues. The resulting peptides will be analyzed on the Waters BioAccord LC-MS to measure their molecular weights and fragmented to confirm the amino acid sequence within each peptide – generating a “peptide map”. This process is used to confirm the primary structure of the protein.
There are a variety of tools available online to calculate protein molecular weight and predict a list of peptides generated from a tryptic digest. We will be using tools within the online resource Expasy (the bioinformatics resource portal of the Swiss Institute of Bioinformatics (SIB)) to predict a list of tryptic peptides from eGFP.
How many Lysines (K) and Arginines (R) are in eGFP? Please circle or highlight them in the eGFP sequence given in Waters Part I question 1 above. (Note: adding the sequence to Benchling as an amino acid file and clicking biochemical properties tab will show you a count for each amino acid).
After adding to benchling, I got counts & frequencies for each amino acid:
(ii) Copy/paste the sequence above into the input box in the PeptideMass tool to generate expected list of peptides.
(iii) Use Figure 4 below as a guide for the relevant parameters to predict peptides from eGFP.
(iv) Click “Perform the Cleavage” button in the PeptideMass tool and report the number of peptides generated when using trypsin to perform the digest.
Number of peptides generated: 19
Mass (Da)
Position
#MC
Modifications
Peptide Sequence
4472.1752
170–210
0
HNIEDGSVQLADHYQQNTPIGDGPVLLPDNHYLSTQSALSK
2566.2931
217–239
0
DHMVLLEFVTAAGITLGMDELYK
2437.2608
5–27
0
GEELFTGVVPILVELDGDVNGHK
2378.2577
54–74
0
LPVPWPTLVTTLTYGVQCFSR
1973.9062
142–157
0
LEYNYNSHNVYIMADK
1503.6597
28–42
0
FSVSGEGEGDATYGK
1266.5783
87–97
0
SAMPEGYVQER
1083.4979
240–247
0
LEHHHHHH
1050.5214
115–123
0
FEGDTLVNR
982.4952
133–141
0
EDGNILGHK
821.3940
81–86
0
QHDFFK
790.3552
75–80
0
YPDHMK
769.3913
47–53
0
FICTTGK
711.2944
103–108
0
DDGNYK
655.3813
98–102
0
TIFFK
602.2780
211–215
0
DPNEK
579.3137
128–132
0
GIDFK
507.2925
164–167
0
VNFK
502.3235
124–127
0
IELK
3. Based on the LC-MS data for the Peptide Map data generated in lab (please use Figure 5a as a reference) how many chromatographic peaks do you see in the eGFP peptide map between 0.5 and 6 minutes? You may count all peaks that are >10% relative abundance
Count peaks that are long (tiny peaks are (e.g. 1.20 impurities due to non-specificity to his-tag column/misses a cleavage)
Given relative abundance and using 4.87 as reference, there are about 20 peaks including peak at 5.43 which is borderline
4. Assuming all the peaks are peptides, does the number of peaks match the number of peptides predicted from question 2 above? Are there more peaks in the chromatogram or fewer?
It is roughly the same; ~19–20 observed vs. 19 predicted. There are approximately the same number, with perhaps slightly more peaks than predicted peptides. Missed cleavages (trypsin doesn’t cut every K/R every time), non-specific cleavages, oxidation or other modifications producing multiple forms of the same peptide, or contaminants.
5. Identify the mass-to-charge () of the peptide shown in Figure 5b. What is the charge (z) of the most abundant charge state of the peptide (use the separation of the isotopes to determine the charge state). Calculate the mass of the singly charged form of the peptide ([M+H]+) based on its m/z and z.
Highest peak is 525.76712
Average spacing:
Peak Pair
Difference (m/z)
526.25918 − 525.76712
0.49206
526.76845 − 526.25918
0.50927
527.26098 − 526.76845
0.49253
Average
0.497953
Rounded Average (m/z)
0.5
Therefore,
Z = 1/delta(m/z) = 1/0.5 = 2
With MW = (n × m/z) – n = (2 x 525.7612) – 2 = 1049.53424Da
Therefore, approximating H = 1
[M+H]+1 = 1049.53424 + 1 Da = 1050.53424 Da
6. Identify the peptide based on comparison to expected masses in the PeptideMass tool. What is mass accuracy of measurement? Please calculate the error in ppm. (Recall that Accuracy = (MWexperiment – MWtheory)/ MWtheory )
7. What is the percentage of the sequence that is confirmed by peptide mapping? (see Figure 6)
88%
Bonus Peptide Map Questions
8. Can you determine the peptide sequence for the peptide fragmentation spectrum shown in Figure 5c? (HINT: Use your results from Question 2 above to match the peptide molecular weight that is closest to that shown in Figure 5b. Copy and paste its sequence into this tool online to predict the fragmentation pattern based on its amino acid sequence: http://db.systemsbiology.net/proteomicsToolkit/FragIonServlet.html. What is the sequence of the eGFP peptide that best matches the fragmentation spectrum in Figure 5c?
After pasting FEGDTLVNR, I get:
Residue
Position
b-ion (m/z)
y-ion (m/z)
F
1
148.07574
1050.52149
E
2
277.11833
903.45308
G
3
334.13979
774.41049
D
4
449.16673
717.38902
T
5
550.21441
602.36208
L
6
663.29848
501.31440
V
7
762.36689
388.23034
N
8
876.40982
289.16192
R
9
1032.51093
175.11900
Ion Species
Monoisotopic Mass
Average Mass
(M)
1049.51422
1050.13629
(M+H)+
1050.52149
1051.14356
(M+2H)²+
525.76441
526.07544
(M+3H)³+
350.84538
351.05273
(M+4H)⁴+
263.38586
263.54138
The predicted y-ions for FEGDTLVNR (y3=388.23, y4=501.31, y5=602.36, y7=774.41, y8=903.45) match the peaks in figure 5c.
9. Does the peptide map data make sense, i.e. do the results indicate the protein is the eGFP standard? Why or why not? Consult with Figure 6, which depicts the % amino acid coverage of peptides positively identified using their calculated mass and fragmentation pattern.
The data confirms it’s eGFP because there is 88% sequence coverage; detected peptides map across most of the eGFP sequence. Also, there are fragmentation matches; b/y ions confirm the amino acid order.
Homework: Waters Part IV — Oligomers
We will determine Keyhole Limpet Hemocyanin (KLH)’s oligomeric states using charge detection mass spectrometry (CDMS). CDMS single-particle measurements of KLH allow us to make direct mass measurements to determine what oligomeric states (that is, how many protein subunits combine) are present in solution. Using the known masses of the polypeptide subunits (Table 1) for KLH, identify where the following oligomeric species are on the spectrum shown below from the CDMS (Figure 7):
• 7FU Decamer
• 8FU Didecamer
• 8FU 3-Decamer
• 8FU 4-Decamer
Polypeptide Subunit Name
Subunit Mass
7FU
340 kDa
8FU
400 kDa
Table 1: KLH Subunit Masses
Convert to Kilo-DA**
Oligomer (FU Decamer)
Multiply
Theoretical Mass (MDa)
7FU Decamer
10 × 340 kDa = 3,400 kDa
3.4
8FU Didecamer
20 × 400 kDa = 8,000 kDa
8.0
8FU 3-Decamer
30 × 400 kDa = 12,000 kDa
12.0
8FU 4-Decamer
40 × 400 kDa = 16,000 kDa
16.0
Homework: Waters Part V — Did I make GFP?
Please fill out this table with the data you acquired from the lab work done at the Waters Immerse Lab in Cambridge, or else the data screenshots in this document if you were unable to have lab work done at Waters.
Two peaks (m/z):
(i) 2545.0388
(ii) 2799.4929
Average distance between peaks is approximately = 0.092
Z= 1/0.092 = 10.86956522. Therefore taking 10 as charge state for peak (ii)
Part A: The 1,536 Pixel Artwork Canvas | Collective Artwork
1. Contribute at least one pixel to this global artwork experiment before the editing ends on Sunday 4/19 at 11:59 PM EST.
• A personalized URL was sent to the email address associated with your Discourse account, and you can discuss the artwork on the Discourse.
• If you did not have a chance to contribute, it’s okay, just make sure you become a TA this fall! 😉
Most of my contributions were in the top right quadrant, followed by the top left quadrant. Initially the top left was the LifeLabs logo, which is now the 2026. The top right is the ‘MIT’ now. I also contributed to the bottom left, which is now formed a bacteriophage. I forgot to take screenshots at the time.
I really like the collaborative aspect of this project. Also, it gives us the opportunity to see emergent art as it happens.
To improve on the project, I would maybe have 1 large contribution followed by lab-specific artwork; each lab across the world could make their own design. Obviously, this would be subject to time and financial constraints. But, if possible, it would be very cool!
Part B: Cell-Free Protein Synthesis | Cell-Free Reagents
1. Referencing the cell-free protein synthesis reaction composition (the middle box outlined in yellow on the image above, also listed below), provide a 1-2 sentence description of what each component’s role is in the cell-free reaction.
E. coli Lysate
(i) BL21 (DE3) Star Lysate (includes T7 RNA Polymerase):
Produces high levels of protein from the T7 promoter and can be used with high or low copy number plasmids, making BL21(DE3) competent cells the preferred strains for protein expression in bacteria [1].
It is a salt that salt that maintains ionic strength. It leads to transcriptional activation of sets of genes that allow the cell to achieve long-term adaptation to high osmolarity
Gralla JD, Vargas DR. Potassium glutamate as a transcriptional inhibitor during bacterial osmoregulation. EMBO J. 2006;25(7):1515–1521. doi:10.1038/sj.emboj.7601041.
(ii) HEPES-KOH pH 7.5
HEPES-KOH is a buffering agent that maintains a stable physiological pH during the cell-free reaction. Maintaining pH near 7.5 is essential because transcription and translation enzymes are highly sensitive to pH fluctuations.
Good NE, Winget GD, Winter W, Connolly TN, Izawa S, Singh RMM. Hydrogen ion buffers for biological research. Biochemistry. 1966;5(2):467-477. doi:10.1021/bi00866a011.
(iii) Magnesium Glutamate
Magnesium glutamate supplies Mg²⁺ ions that stabilize ribosomes, RNA, and ATP-dependent enzymatic reactions during transcription and translation. Magnesium concentration strongly affects protein synthesis efficiency and overall fluorescence yield in cell-free systems.
Jewett MC, Swartz JR. Rapid expression and purification of 100 nmol quantities of active protein using cell-free protein synthesis. Biotechnol Prog. 2004;20(1):102-109. doi:10.1021/bp0342330.
(iv) Potassium phosphate monobasic
Potassium phosphate monobasic contributes to phosphate buffering and helps maintain intracellular-like ionic conditions in the reaction. It also supports ATP regeneration and metabolic stability during extended incubations.
Kim DM, Swartz JR. Regeneration of adenosine triphosphate from glycolytic intermediates for cell-free protein synthesis. Biotechnol Bioeng. 2001;74(4):309-316. doi:10.1002/bit.1110.
(v) Potassium phosphate dibasic
Potassium phosphate dibasic works together with monobasic phosphate to maintain buffering capacity and phosphate balance in the cell-free system. This helps stabilize enzymatic activity and sustain long-term transcription and translation reactions.
Kim DM, Swartz JR. Regeneration of adenosine triphosphate from glycolytic intermediates for cell-free protein synthesis. Biotechnol Bioeng. 2001;74(4):309-316. doi:10.1002/bit.1110.
Energy / Nucleotide System
(i) Ribose
D-ribose is a naturally occurring monosaccharide within the pentose pathway that assists with ATP (Adenosine Triphosphate) production. In cell-free systems, it helps sustain nucleotide regeneration and prolonged protein synthesis.
Mahoney DE, Hiebert JB, Thimmesch A, Pierce JT, Vacek JL, Clancy RL, et al. Understanding D-ribose and mitochondrial function. Adv Biosci Clin Med. 2018;6(1):1-5. doi:10.7575/aiac.abcmed.v.6n.1p.1.
(ii) Glucose
Glucose serves as a major energy source that is metabolized to generate ATP through glycolysis and related metabolic pathways. In cell-free protein synthesis systems, glucose supports ATP regeneration, helping sustain transcription and translation during long incubations.
Hantzidiamantis PJ, Awosika AO, Lappin SL. Physiology, glucose. In: StatPearls [Internet]. Treasure Island (FL): StatPearls Publishing; 2024 [cited 2026 May 24]. Available from: https://www.ncbi.nlm.nih.gov/books/NBK545201/
(iii) AMP
Adenosine triphosphate is a nucleotide involved in cellular energy metabolism and nucleotide biosynthesis. For cell-free protein synthesis systems, AMP contributes to ATP regeneration pathways and helps sustain transcriptional and translational activity during extended incubations.
Hardie DG. AMP-activated protein kinase: maintaining energy homeostasis at the cellular and whole-body levels. Annu Rev Nutr. 2014;34:31-55.
(iv) CMP
Cytidine monophosphate is a pyrimidine nucleotide involved in RNA synthesis and nucleotide metabolism. In cell-free protein synthesis systems, CMP will help maintain nucleotide pools required for sustained transcription during extended reactions
Guanosine monophosphate is a purine nucleotide that serves as a precursor for Guanosine triphosphate (GTP) synthesis; which is essential for transcription and translation elongation. In cell-free systems, GMP supplementation can help sustain nucleotide availability and prolonged protein synthesis.
Uridine monophosphate is a pyrimidine nucleotide involved in RNA biosynthesis and cellular nucleotide metabolism. In cell-free synthesis systems, UMP can support RNA production by contributing to the regeneration of uridine nucleotide pools.
Guanine is one of the four nitrogenous bases found in nucleic acids and is an essential component of RNA and DNA. In cell-free protein synthesis systems, guanine can be converted through nucleotide salvage pathways into GMP and GTP, supporting continued transcription and translation activity.
National Human Genome Research Institute. Guanine [Internet]. Bethesda (MD): National Human Genome Research Institute; [cited 2026 May 24]. Available from: https://www.genome.gov/genetics-glossary/guanine
Translation Mix (Amino Acids)
(i) 17 Amino Acid Mix
A combined stock of the standard proteinogenic amino acids excluding tyrosine and cysteine, which are added separately due to solubility and oxidation issues. In cell-free protein synthesis systems, this mix supplies the substrates charged onto tRNAs for ribosomal elongation, sustaining translation during extended reactions.
Caschera F, Noireaux V. Synthesis of 2.3 mg/ml of protein with an all Escherichia coli cell-free transcription–translation system. Biochimie. 2014;99:162-8. doi:10.1016/j.biochi.2013.11.025.
(ii) Tyrosine
Tyrosine is an aromatic, polar amino acid with notably low aqueous solubility. In cell-free systems, it is supplemented separately to maintain accurate concentrations without precipitation, and it supports consistent incorporation into nascent polypeptides during translation.
Cysteine is a sulfur-containing amino acid whose thiol side chain is prone to oxidation and disulfide cross-linking. For cell-free protein synthesis systems, it is added separately to preserve the free thiol pool and support correct incorporation and folding, particularly for cysteine-rich or disulfide-bonded proteins.
Nicotinamide is the amide form of vitamin B3 (niacin) and a precursor in the biosynthesis of NAD⁺ and NADP⁺. In cell-free systems, it supports the maintenance of nicotinamide cofactor pools required for energy regeneration reactions that sustain ATP supply during prolonged transcription and translation.
ScienceDirect. Nicotinamide [Internet]. Amsterdam: Elsevier; [cited 2026 May 24]. Available from: https://www.sciencedirect.com/topics/biochemistry-genetics-and-molecular-biology/nicotinamide
Backfill
(i) Nuclease Free Water
Nuclease-free water is highly purified, deionized, filtered, and autoclaved water certified to be free of endonuclease, exonuclease, and RNase activity. In cell-free systems, it is used to adjust reaction volumes and dilute components without introducing contaminants that could degrade DNA, mRNA, or compromise reaction efficiency.
2. Describe the main differences between the 1-hour optimized PEP-NTP master mix and the 20-hour NMP-Ribose-Glucose master mix shown in the Google Slide above. (2-3 sentences)
The 1-hour PEP/NTP mix supplies energy and nucleotides quickly via their ready-to-use forms (ATP, GTP, CTP, UTP plus PEP-Mono and maltodextrin), providing immediate phosphorylation power for fast transcription and translation but exhausting quickly.
In comparison, the 20-hour NMP-Ribose mix is slow releasing. It feeds in low-cost precursors (NMPs, guanine, ribose, glucose, phosphate buffer) and relies on the lysate’s own metabolism to regenerate NTPs and ATP gradually, sustaining protein synthesis over a much longer window.
3. Bonus question: How can transcription occur if GMP is not included but Guanine is?
Guanine + ribose + ATP from the metabolic system enable the production of GTP. It is done inside the lysate using the purine salvage pathway, then phosphorylated up to GTP for transcription. The mix supplies the raw ingredients (guanine + ribose) and lets the cell extract’s own enzymes do the assembly.
Smith AA, Wong EL, Donovan RC, Chapman BA, Harry R, Tirandazi P, et al. Using a GPT-5-driven autonomous lab to optimize the cost and titer of cell-free protein synthesis. bioRxiv [Preprint]. 2026. Available from: https://www.biorxiv.org/content/10.64898/2026.02.05.703998v1
Part C: Part C: Planning the Global Experiment | Cell-Free Master Mix Design
1. Given the 6 fluorescent proteins we used for our collaborative painting, identify and explain at least one biophysical or functional property of each protein that affects expression or readout in cell-free systems. (Hint: options include maturation time, acid sensitivity, folding, oxygen dependence, etc) (1-2 sentences each)
sfGFP
This is a variant with fast, robust folding (maturation half-time ~10 min in E. coli) that tolerates misfolding-prone fusion partners. As a result, it’s the default CFPS reporter, giving the earliest and most reliable readout.
mRFP1
It is described on Pbase as a “somewhat slowly-maturing monomer” (~1 h half-time) with a low pKa (~4.5). The slow chromophore maturation means fluorescent readout lags well behind actual protein production in CFPS, plus a residual green immature intermediate (inherited from DsRed) can complicate spectral readout.
mKO2
It is a coral-derived monomeric Kusabira-Orange variant specifically engineered for rapid maturation. In CFPS reactions that drift acidic during prolonged ATP regeneration, signal can drop without strong buffering.
mTurquoise2
It has the highest quantum yield (~93%) of any monomeric fluorescent protein and high photostability, giving a strong, stable signal in CFPS. This is useful when expression levels are modest, as is common with non-optimised constructs
mScarlet_I
This variant evolved from the bright but very slow-maturing mScarlet (~132 min) down to a maturation half-time of ~36 min, trading a small brightness loss for much earlier red signal. This can be important for short CFPS incubations.
Electra2
A blue fluorescent protein derived from Entacmaea quadricolor. It is reported to reported to form aggregates in multiple organisms (C. elegans, zebrafish, mice, Dictyostelium). This aggregation could compromise solubility and skew fluorescence readout in CFPS.
2. Create a hypothesis for how adjusting one or more reagents in the cell-free mastermix could improve a specific biophysical or functional property you identified above, in order to maximize fluorescence over a 36-hour incubation. Clearly state the protein, the reagent(s), and the expected effect.
In the sfGFP cell-free system, increasing glucose, magnesium glutamate, and nucleotide precursors (AMP/CMP/ribose) is expected to extend ATP and nucleotide regeneration capacity, thereby sustaining transcription and translation over the full 36-hour incubation. This should increase total sfGFP accumulation and result in higher final fluorescence due to prolonged protein synthesis rather than early energy depletion.
For mRFP1, increasing magnesium glutamate to 10 mM is expected to improve ribosome stability and translation efficiency, while supplementation with GMP at 0.625 mM may help sustain GTP pools required for transcription and translation elongation. Increasing cysteine to 6 mM may also support proper protein folding and help maintain a favorable redox environment during the extended incubation, improving maturation and accumulation of functional fluorescent protein.
Together, these adjustments are expected to sustain translation capacity and improve fluorescent protein maturation over the 36-hour reaction, reducing losses from energy depletion and inefficient folding.
3. The second phase of this lab will be to define the precise reagent concentrations for your cell-free experiment. You will be assigned artwork wells with specific fluorescent proteins and receive an email with instructions this week (by April 24). You can begin composing master mix compositions here.
Well 1: Q2-B9
In the sfGFP cell-free system, increasing glucose, magnesium glutamate, and nucleotide precursors (AMP/CMP/ribose) is expected to extend ATP and NTP regeneration capacity, thereby sustaining transcription and translation over the full 36-hour incubation. This should increase total sfGFP accumulation and result in higher final fluorescence due to prolonged protein synthesis rather than early energy depletion.
Well 2: Q4-K18
To maximize mRFP1 (monomeric red fluorescent protein 1) fluorescence over 36 hours, I increased magnesium glutamate to 10 mM to stabilize translation and protein folding, added guanosine monophosphate (GMP) at 0.625 mM to sustain guanosine triphosphate (GTP) pools for translation elongation, and increased cysteine to 6 mM to prevent aggregation-promoting disulfide bonds.
Together, these adjustments sustain both translation output and chromophore stability over the extended reaction, preventing energy depletion and misfolding that would limit fluorescence accumulation at the 36-hour timepoint.
4. The final phase of this lab will be analyzing the fluorescence data we collect to determine whether we can draw any conclusions about favorable reagent compositions for our fluorescent proteins. This will be due a week after the data is returned (date TBD!). The reaction composition for each well will be as follows:
6 μL of Lysate
10 μL of 2X Optimized Master Mix from above
2 μL of assigned fluorescent protein DNA template
2 μL of your custom reagent supplements
Total: 20 μL reaction
We never received data for this part. With permission of Node leads, skipping this!
SECTION 1: ABSTRACT Tuberculosis, caused by Mycobacterium tuberculosis, remains one of the leading infectious disease killers globally. Multidrug resistant TB (MDR-TB), resistant to first-line drugs such as isoniazid and rifampicin, is a major contributor to global antimicrobial resistance (AMR). Current surveillance relies on clinical testing, which is limited by inadequate diagnostic infrastructure, healthcare access barriers, and social stigma reducing testing uptake. The project evaluates whether wastewater-based sampling can serve as a scalable, non-invasive interface for detecting rifampicin-resistant tuberculosis through downstream molecular analysis.
Group Brainstorm on Bacteriophage Engineering Proposal by: Sameen Nasar (London, Lifefabs), Robert C Beck (London, Lifefabs) to be joined by Jean Colmenares (Lima, Peru)
As per instructions of Node leaders & TAs, this will be put on hold, hopefully we will get to do this over the summer
Group Project Goal:
Subsections of Projects
Individual Final Project
SECTION 1: ABSTRACT
Tuberculosis, caused by Mycobacterium tuberculosis, remains one of the leading infectious disease killers globally. Multidrug resistant TB (MDR-TB), resistant to first-line drugs such as isoniazid and rifampicin, is a major contributor to global antimicrobial resistance (AMR). Current surveillance relies on clinical testing, which is limited by inadequate diagnostic infrastructure, healthcare access barriers, and social stigma reducing testing uptake. The project evaluates whether wastewater-based sampling can serve as a scalable, non-invasive interface for detecting rifampicin-resistant tuberculosis through downstream molecular analysis.
The central hypothesis is that concentrating microbial genetic material from wastewater using a robust pre-filtration and capture system will enable reliable molecular detection of rpoB mutations associated with rifampicin resistance, even in complex environmental samples. To test this, a staged workflow will be developed using a ~10 µm pre-filtration module to reduce particulate load, followed by evaluation of DNA recovery efficiency with the BSL-1 surrogate Mycobacterium smegmatis. Recovered nucleic acids will then be assessed for compatibility with molecular genotyping assays targeting rifampicin resistance-associated single nucleotide polymorphisms (SNPs).
The approach includes wastewater sampling with a robust pre-filtration and off-chip DNA extraction workflow for downstream molecular analysis. A rpoB gene fragment representing wild-type and rifampicin-resistant mutations will be used to validate allele-specific SNP detection with a simple colorimetric readout, enabling scalable surveillance of tuberculosis resistance.
SECTION 2: PROJECT AIMS
Define three aims for your final project (minimum one sentence per aim).
Aim 1: Experimental Aim (this project):
a. “The first aim of my final project is to [achievable experimental goal] by utilizing [protocols, tools, or strategies].”
i. This aim should describe the core experimental objective you will attempt during this class. List or link any relevant methods or resources you plan to use (e.g., experimental protocols, automation workflows, DNA or protein designs, protein design tools, or Twist orders).
You will provide a detailed step-by-step experimental plan for Aim 1 in the Experimental Design section of this assignment.
The first aim of my final project is to develop and validate a LAMP-based molecular assay for detecting rifampicin-resistant M. tuberculosis via rpoB S531L mutations by designing allele-specific LAMP primer sets and optimizing SNP detection in spiked, complex synthetic wastewater samples.
This will be done by utilizing layered glass fiber–nitrocellulose filtration for cell concentration, on-membrane chemical lysis, and colorimetric LAMP detection with a Twist Bioscience-synthesized rpoB RRDR positive control. Mycobacterium smegmatis, a commonly used BSL-1 surrogate for Mycobacterium tuberculosis, will be used to evaluate sample recovery and assay performance under controlled laboratory conditions.
The experimental workflow includes:
(i) Commercial paper-based pre-filtration (~10 μm) for microbial cell concentration
(ii) Off-chip chemical lysis (SDS + Proteinase K, 65°C, 30 min) for DNA extraction
(iii) Ethanol precipitation for DNA purification from complex matrices
(v) NEB WarmStart colorimetric LAMP master mix for isothermal amplification
(vi) Custom allele-specific LAMP primers from IDT targeting rpoB S531L SNP
(vii) Mycobacterium smegmatis (BSL-1 surrogate for M. tuberculosis) for validation
(viii) Paper substrate for colorimetric LAMP detection with visual readout
Success metrics include: ≥70% DNA recovery from pre-filtration, visually distinct allele discrimination (WT = bright yellow, S531L = orange-yellow), limit of detection ≤10³ CFU/mL, 100% negative control specificity, and reproducibility CV <15% across replicates.
Aim 2: Development Aim:
Describe the next step that would follow a successful Aim 1, extending the work beyond the scope of this course. This aim should represent a realistic progression of the project, such as executing additional experiments, solving a technical limitation, or developing the system or technology further.
Following LAMP validation, I would aim to integrate the LAMP chemistry within a nitrocellulose Microfluidic paper analytic device (µPAD) that combines passive filtration, on-chip lysis buffer delivery, and isothermal amplification zones. This will be then further tested on spiked environmental water samples (tap water, pond water, streams in villages) at clinically relevant cell concentrations. The device itself will be further evaluated for thermal stability by lyophilizing the LAMP master mix into the amplification zone and storing assembled devices at 35°C and 42°C for 7, 14, and 30 days. Performance will be benchmarked against Day 0 LOD using a Twist synthetic rpoB RRDR fragment at 10³ copies/reaction as a defined standard.
Figure: Potential Schematic of Integrated Device
Aim 3: Visionary Aim:
a. Describe the long-term vision for the project. Explain how the broader concept could have an impact if fully realized.
b. Examples include:
i. Challenging an existing paradigm or clinical practice.
ii. Addressing a major barrier in a field.
Enabling a new experimental capability or research approach.
Using the open-source device and surveillance strategies, detect AMR at the community level to enable rapid testing, analysis, and diagnosis of MDR-TB. This will be done by distributing these environmental AMR detection devices/sensors in wastewater treatment plants, river monitoring stations, and community water sources across low-resource settings. The ideal vision is to have a two-tiered surveillance approach, where:
Tier 1-Passive Surveillance: Devices are deployed at fixed wastewater sampling points (treatment plant inlets, community drainage channels) and processed weekly by local environmental health teams. A positive colorimetric LAMP signal triggers an automated community alert to the regional surveillance team, who deploy GeneXpert-based clinical testing in the flagged area to identify and treat affected individuals.
Tier 2-Active Community Health Worker Point-of-Need Testing: Community health workers carry pre-loaded µPAD kits for on-demand water source testing during household visits or outbreak investigations. Areas with positive results will be directed towards surveillance teams for individual testing.
If fully realised the Expected Impact could be:
If achieved, this paradigm shift would enable early detection of resistance emergence hotspots before community-wide transmission, facilitate targeted MDR-TB treatment programs, reduce unnecessary broad-spectrum antibiotic use, and inform WHO drug policy decisions. It would empower communities most affected by TB with surveillance capability and democratize access to genomic resistance data.
Figure: Prospective Design Device (Image generated with instructions)
Figure: Potential Areas for Deployment: Humanitarian Settings with informal water systems (Field pictures: Rohingya Refugee Camp on borders of Myanmar & Bangladesh)
Figure: Potential Areas for Deployment: Remote low-resource settings (Field pictures: Matlab, Chandpur, Bangladesh (Near cluster of brick kilns & many informal pharmacies))
SECTION 3: BACKGROUND
Background and Literature Context
Provide background research that explains the current state of knowledge and identifies the gap in knowledge or capability that your project addresses.
Tuberculosis, caused by Mycobacterium tuberculosis, remains one of the leading infectious disease killers globally [1]. Multidrug resistant TB (MDR-TB), resistant to first-line drugs such as isoniazid and rifampicin, is a major contributor to global antimicrobial resistance (AMR).
Unregulated pharmaceutical use, which includes over-the-counter sales without prescription and substandard/falsified anti-tuberculosis medicine, is widely prevalent in many high-burden burden countries [2, 3], leading to the emergence and persistence of drug-resistant strains. However, TB detection remains highly dependent on clinical testing infrastructure and diagnostic availability, both of which are often limited in low-resource settings. While next-generation sequencing (NGS), particularly whole genome sequencing (WGS), now enables high-resolution profiling of resistance mutations and transmission dynamics, these approaches remain costly and dependent on individual patient sampling.
During infection, M. tuberculosis can persist within host granulomas for prolonged periods, enabling continued adaptation under immune and antibiotic pressure. Unlike many bacteria that acquire resistance through horizontal gene transfer, M. tuberculosis primarily develops drug resistance through chromosomal mutations such as single nucleotide polymorphisms (SNPs) and insertions/deletions affecting drug targets, activators, and enzymes [4,5]. This persistence-driven evolution contributes to treatment failure, long-term transmission, and the emergence of MDR-TB strains.
Although TB transmission is classically considered airborne, increasing historical and modern evidence suggests that M. tuberculosis can also persist in environmental reservoirs including soil, dust, water, and wastewater for extended periods [6, 7]. Experimental studies demonstrated that environmental samples contaminated with M. tuberculosis were capable of infecting guinea pigs and mice, while more recent studies have identified viable mycobacteria in soil and wastewater months after contamination [7]. Additional evidence suggests that wastewater contamination may originate from faecal and urinary shedding of Mycobacterium tuberculosis complex (MTBC) organisms, particularly in patients with gastrointestinal involvement of TB [8].
Recent wastewater-based epidemiology studies have further confirmed the detection of MTBC DNA in untreated and treated wastewater using PCR and droplet digital PCR methods, supporting the feasibility of wastewater as a population-level surveillance tool for tuberculosis monitoring [9, 10].
Furthermore, the persistence of mycobacteria in wastewater environments raises the possibility that environmental reservoirs may contribute to prolonged community circulation and under-recognized transmission dynamics; for example, aerosols generated during wastewater treatment, the reuse of wastewater for irrigation could also lead to the generation of aerosols [10].
Building on this evidence, this project proposes a portable microfluidic paper-based platform integrating filtration, DNA extraction, and visual SNP genotyping targeting rifampicin-resistance mutations in the rpoB gene. Rather than solely detecting the presence of M. tuberculosis, the project aims to investigate whether wastewater-derived DNA can reveal resistance-associated mutations at the population level, enabling low-cost environmental surveillance of MDR-TB evolution and transmission. Furthermore, this will provide community health workers, who often visit remote areas, a device to identify susceptible areas and transmission hotspots, allowing targeted public health interventions that reduce both surveillance costs and clinical disease burden.
Innovation & Novelty
This project is novel in three key dimensions.
First, it applies wastewater-based epidemiology (WBE) to detect not just the presence of TB, but resistance mutations at the population level, enabling low-cost environmental surveillance of MDR-TB evolution and transmission without individual patient testing. Unlike traditional surveillance that requires sputum samples, blood draws, or clinical diagnosis; these impose barriers to participation due to invasion, discomfort, and diagnostic bottlenecks slowing down data collection and swift detection of hotspots. Most WBE studies focus on viral pathogens (SARS-CoV-2, polio); applying this to TB resistance mutations is innovative and underexplored.
Second, the project integrates paper-based microfluidics with allele-specific LAMP SNP genotyping, a combination that has not been extensively characterized for TB resistance detection. The kinetic-based discrimination requires no post-amplification processing.
Third, the project prioritizes field deployment from the outset, designing the assay device for use by community health workers in remote or underserved regions without laboratory infrastructure, electricity, or highly trained personnel.
Significance & Impact
Tuberculosis remains a leading infectious disease killer, with MDR-TB driving global antimicrobial resistance. Current surveillance relies on individual clinical diagnosis, missing asymptomatic carriers and failure to detect resistance emergence until clinical diagnosis of outbreaks occur; global MDR-TB treatment success rates are as low as 10%.
This project enables rapid, low-cost, non-invasive population-level surveillance of TB resistance through wastewater monitoring, providing an earlier detection window before widespread community transmission.
The open-source paper device design ensures accessibility to low-resource settings, avoiding intellectual property barriers that currently limit TB diagnostics to high-income regions.
The methods (wastewater pre-filtration + LAMP SNP detection on paper) are broadly applicable to drug-resistant malaria, COVID-19 variants, and antimicrobial resistance surveillance generally, advancing environmental molecular surveillance beyond TB.
If successful, TB surveillance will shift from individual clinical testing to population-level environmental monitoring, enabling earlier resistance detection, faster public health response, and empowering community health workers to conduct surveillance in endemic regions.
Third, the project prioritizes field deployment from the outset, designing the assay device for use by community health workers in remote or underserved regions without laboratory infrastructure, electricity, or highly trained personnel.
Ethical Implications and Proposed Safeguards
Wastewater-based epidemiology for TB surveillance raises distinct ethical considerations. Although using environmental samples rather than direct human subjects, it generates population-level health data about communities. Primary ethical principles include non-maleficence (avoiding harm), beneficence (maximizing benefit), justice (fair distribution of benefits/burdens), and responsibility (accountability for societal implications).
Governance Goal 1: Prevent Harm and Misuse
Sub-goal 1a: Require ethical review and oversight of surveillance data and secondary uses
Establish IRB/ethics committee approval before deployment
Define permissible uses of surveillance data (TB control only; prohibit immigration/policing)
Implement data access restrictions and audit trails
Sub-goal 1b: Establish strict guidelines on location data precision and sharing
Aggregate results at regional/facility level, not neighborhood or household level
Prohibit public disclosure of specific wastewater treatment plants as positive
Require anonymization in any scientific publications
Sub-goal 1c: Establish accountability mechanisms
Create grievance processes for communities
Establish liability frameworks for misuse by state or private actors
Regular third-party audits of data handling
Governance Goal 2: Promote Equity in Data Collection and Development
Sub-goal 2a: Control of locally-generated data
Host surveillance data on servers controlled by implementing country
Require data-sharing agreements ensuring country retains ownership
Prevent unilateral export of data without consent
Sub-goal 2b: Inclusion of implementing country as equal research partners
Establish co-authored publications requiring local institution as co-author
Fund local research teams to lead interpretation and analysis
Ensure local researchers trained in bioinformatics and epidemiology
Sub-goal 2c: Prioritize under-resourced regions with coupled treatment access
Deploy surveillance only where clinical TB diagnostics and MDR-TB treatment are available
Conduct surveillance in communities that specifically request it
Tie surveillance funding to health system strengthening
Actions
Action 1: Regulation and Standards for Early-Stage Bio-Sensor Development
Purpose: Create regulatory standards for paper-based LAMP devices before widespread deployment, ensuring safety, accuracy, and responsible innovation.
Design: Public health agencies (WHO, CDC, national TB programs) + diagnostic developers establish validation criteria, accuracy thresholds (≥95% sensitivity/specificity), metadata standards, and geolocation safeguards. Embed standards into existing TB surveillance protocols.
Assumptions: Regulators will rapidly evaluate devices; public health systems will adopt technology quickly.
Risks: Bureaucratic delays may slow innovation. Premature reliance on bio-sensors could cause false positives and misdirected public health responses.
Action 2: Pre-Detection Rapid Signal Regulatory Pathways
Purpose: Create formal pathways for rapid surveillance signals (positive LAMP signals) to trigger clinical verification (GeneXpert) before data enters national surveillance systems, with defined quality and data-use standards.
Design: WHO + national TB programs + public health agencies expand existing WHO genomic data-sharing principles to include rapid biosensor signals.
Define workflow: Positive LAMP signal clinical testing confirmed case reported (not signal alone).
Assumptions: Developers implement required standards; public health agencies can train workers to interpret signals; state agencies have technical capacity.
Risks: State agencies may lack expertise; misinterpretation of signals could delay response or cause panic; disagreements on implementation across countries.
Action 3: Ethical Data Access and Community Engagement Requirements
Purpose: Mandate consistent privacy, consent, equity, and community engagement standards for all TB surveillance data collection and use.
Design: Establish standardized data agreements specifying permissible uses, benefit-sharing, and consent mechanisms. Create local advisory boards and steering committees for community feedback and oversight. WHO/national bodies enforce compliance.
Assumptions: Communities will engage meaningfully; cross-country coordination on ethics is possible; implementation won’t significantly slow operations.
Risks: Strict data provisions may slow action; communities may view engagement as superficial; high administrative burden.
Potential Unintended Consequences & Mitigation
(i) Surveillance data could be misused for community stigmatization
a. Mitigation: Data aggregation policies, restricted access, clear communication about population vs. individual-level data
(ii) Consequence: Device/protocols might fail in field conditions
a. Mitigation: Extensive stability testing, field-readiness validation before deployment, contingency planning
(iii) Communities might experience surveillance as invasion of privacy
a. Mitigation: Community engagement, transparency, opt-out mechanisms, demonstrated benefits
Recommendations
If ethical challenges prove to be too large of a burden:
(i) Selective surveillance at high-burden health facilities instead of community-wide wastewater surveillance
(ii) Combined clinical + environmental surveillance to reduce reliance on either approach alone
(iii) Technology transfer to local organizations for autonomous implementation with cultural oversight
(iv) Participatory research model where, communities co-design surveillance approach and data use policies
(v) Pilot surveillance in communities that explicitly request it, rather than imposing surveillance
SECTION 4: EXPERIMENTAL DESIGN, TECHNIQUES, TOOLS, AND TECHNOLOGY
Outputs were written with the help of With the help of the HGTAA tutor and Claude skill AI using a combination of my writing, their inputs and some reading across resources.
1. Detailed Experimental Plan for Aim 1
The Aim 1 experimental pipeline is a complete 12-step integrated workflow spanning 12 weeks
Weeks 1-2:
For the first iteration, as an online committed student, I was set on getting a gene fragment of the BSL-1 surrogate Mycobacterium smegmatis for testing and validation.
Searched: MSMEG_1367 (this is rpoB | used help from chatGPT to search this)
after clicking CDS next to it I got:
1461630..1465139 /gene=“rpoB” /locus_tag=“MSMEG_1367” /EC_number=“2.7.7.6” /note=“identified by match to protein family HMM PF00562; match to protein family HMM PF04560; match to protein family HMM PF04561; match to protein family HMM PF04563; match to protein family HMM PF04565; match to protein family HMM TIGR02013” /codon_start=1 /transl_table=11 /product=“DNA-directed RNA polymerase, beta subunit” /protein_id=“ABK70312.1” /translation=“MLEGCILAVSSQSKSNAITNNSVPGAPNRVSFAKLREPLEVPGL LDVQTDSFEWLVGSDRWRQAAIDRGEENPVGGLEEVLAELSPIEDFSGSMSLSFSDPR FDEVKASVDECKDKDMTYAAPLFVTAEFINNNTGEIKSQTVFMGDFPMMTEKGTFIIN GTERVVVSQLVRSPGVYFDETIDKSTEKTLHSVKVIPGRGAWLEFDVDKRDTVGVRID RKRRQPVTVLLKALGWTNEQIVERFGFSEIMMGTLEKDTTSGTDEALLDIYRKLRPGE PPTKESAQTLLENLFFKEKRYDLARVGRYKVNKKLGLNAGKPITSSTLTEEDVVATIE YLVRLHEGQTSMTVPGGVEVPVEVDDIDHFGNRRLRTVGELIQNQIRVGLSRMERVVR ERMTTQDVEAITPQTLINIRPVVAAIKEFFGTSQLSQFMDQNNPLSGLTHKRRLSALG PGGLSRERAGLEVRDVHPSHYGRMCPIETPEGPNIGLIGSLSVYARVNPFGFIETPYR KVENGVVTDQIDYLTADEEDRHVVAQANSPTDENGRFTEDRVMVRKKGGEVEFVSADQ VDYMDVSPRQMVSVATAMIPFLEHDDANRALMGANMQRQAVPLVRSEAPLVGTGMELR AAIDAGDVVVADKTGVIEEVSADYITVMADDGTRQSYRLRKFARSNHGTCANQRPIVD AGQRVEAGQVIADGPCTQNGEMALGKNLLVAIMPWEGHNYEDAIILSNRLVEEDVLTS IHIEEHEIDARDTKLGAEEITRDIPNVSDEVLADLDERGIVRIGAEVRDGDILVGKVT PKGETELTPEERLLRAIFGEKAREVRDTSLKVPHGESGKVIGIRVFSREDDDELPAGV NELVRVYVAQKRKISDGDKLAGRHGNKGVIGKILPVEDMPFLPDGTPVDIILNTHGVP RRMNIGQILETHLGWVAKAGWNIDVAAGVPDWASKLPEELYSAPADSTVATPVFDGAQ EGELAGLLGSTLPNRDGEVMVDADGKSTLFDGRSGEPFPYPVTVGYMYILKLHHLVDD KIHARSTGPYSMITQQPLGGKAQFGGQRFGEMECWAMQAYGAAYTLQELLTIKSDDTV GRVKVYEAIVKGENIPEPGIPESFKVLLKELQSLCLNVEVLSSDGAAIEMRDGDDEDL ERAAANLGINLSRNESASVEDLA”
To find regions of similarity, I ran it through BLAST at:
Then using this paper I looked for the codon positions:
Nakata N, Kai M, Makino M. Mutation analysis of mycobacterial rpoB genes and rifampin resistance using recombinant Mycobacterium smegmatis. Antimicrob Agents Chemother. 2012;56(4):2008-2013. doi:10.1128/AAC.05831-11 (pubmed.ncbi.nlm.nih.gov)
The MIC value of rifampin for the recombinant M. smegmatis strain with the wild-type sequence of the M. leprae rpoB or M. tuberculosis rpoB gene was 1 μg/ml. Most strains that had a mutation at codon 511, 513, 516, 522, 526, 531, or 533 showed rifampin resistance. In contrast, strains that had a mutation at codon 507, 508, 517, 521, 523, or 532 showed MIC values of rifampin comparable to those for the wild-type sequence
Therefore:
M. smegmatisRRDR core region = positions 1505–1583 = ~78 bp
Therefore for ~350 bp total:
350 bp − 78 bp core = 272 bp remaining for flanking
272 bp ÷ 2 (upstream + downstream) = 136 bp per side
So, I rounded to ~135 bp on each side to get:
135 bp upstream + 78 bp core + 135 bp downstream = 348 bp ~ 350 bp
As a result, in my sequence:
Position 1370 = 135 bp before position 1505 (start of core)
Position 1505–1583 = the RRDR core
Position 1718 = 135 bp after position 1583 (end of core)
Which I uploaded to benchling to annotate and Lifefabs initial order sheet.
The initial plan was to use the fragment with the wild type and one with region ~531 (S531L) for rifampicin resistance as tests for validation.
However, after feedback sessions with the HGTAA AI tutor and the TAs in the node sessions. I decided to proceed with plasmids with Mycobacterium smegmatis RRDR regions for wild type and editing. Therefore, I proceeded with constructing the plasmids on benchling, then preparing for my order quotation on Twist (Final orders at my node will be done afterwards).
For the backbone, pUC19 was selected for its high copy number (~500-700 copies/cell), proven reliability in E. coli, small synthesis cost, and established use as a positive control plasmid for molecular assays.
The S531L rifampicin-resistance mutation was introduced at codon 531 of the rpoB insert (positions 223-225 bp within the 348 bp rpoB RRDR sequence), changing TCG (Serine, wild-type) to TTG (Leucine, rifampicin-resistant) via site-directed mutagenesis.
Ordering on TWIST:
Quotation:
I hope to continue from weeks 2 onwards in London at Lifefabs. The following steps are indicative of what I will try to do to validate aim 1 over the summer (I used the Claude skills AI tutor to develop the plan).
Weeks 2-3: Project Setup, Primer Design, and Synthetic Wastewater Preparation
• Assemble all required chemicals for synthetic wastewater (PBS, humic acids, cellulose powder, NaCl, CaCl₂, BSA)
• Order custom 6-primer LAMP set from IDT targeting rpoB S531L SNP ($120, 5-7 day delivery)
• Design and validate all primer sequences in silico; check for off-target binding and thermodynamic stability
• Order NEB WarmStart LAMP Master Mix kit ($250) from supplier
• Prepare synthetic wastewater stock (PBS + 10 mg/L humic acids + 100 mg/L cellulose + 50 mM NaCl + 5 mM CaCl₂ + 1 mg/mL BSA) in 500 mL batches
Expected result: All materials received and confirmed; synthetic wastewater prepared and stored at 4°C
Weeks 4-5: Twist Plasmid Synthesis, Delivery, and Verification
• Export two GenBank-formatted plasmid sequences from Benchling (pUC19_rpoB_WT and pUC19_rpoB_S531L)
• Test variations: (a) 100% ethanol vs. 95% ethanol precipitation; (b) single wash vs. double wash with 70% ethanol; (c) air-dry vs. vacuum dry; (d) resuspension in nuclease-free water vs. TE buffer
• Apply each protocol to lysed samples; quantify final DNA recovery and purity (Qubit A260/A280 ratio if available)
• Select protocol maximizing recovery with minimal polymerase inhibitors
We discussed and practiced various techniques related to synthetic biology throughout the semester. Place a check next to the techniques relevant to your project.
✅ DNA Construct Design (Benchling plasmid design) ✅ Databases (GenBank for rpoB sequences) ✅ Designing a Twist Order (whole plasmid synthesis)
Bioproduction
✅ Chassis Selection (E. coli DH5α) ✅ Plasmid Preparation (miniprep of Twist plasmids) ✅ Bacterial Culturing (growth on LB agar + Ampicillin) ✅ Quality Control/Analysis (colony PCR, Qubit quantification) ✅ Bacterial Processing (centrifugation, lysis, DNA purification)
Detection & Analysis
✅ Cell-Free Reactions (LAMP on paper substrate) ✅ Colorimetric Detection (visual readout via pH indicator dye)
Expand upon two techniques you checked in the previous question by describing how you would utilize those techniques in your final project. (min. 4 sentences)
These are indicative of what I will do at Lifefabs in London over the summer
Technique 1: PCR (Polymerase Chain Reaction)
I will utilize PCR to validate that pre-filtration and DNA extraction successfully recover target DNA sequences from complex wastewater samples. Colony PCR with M13F/R primers will verifiy Twist plasmid inserts (~350 bp rpoB band expected) after bacterial transformation and confirms proper construct delivery. PCR also serves as a sensitive detection method to confirm the presence of rpoB sequences in purified DNA before LAMP amplification, ensuring the extraction workflow functions correctly.
I will spot 25 µL of LAMP master mix (enzymes, dNTPs, pH indicator dye) directly onto paper substrate and incubate at 65°C for 60 minutes without requiring cells or cellular machinery. The isothermal amplification generates pH changes that produce real-time colorimetric readout: bright yellow (WT, rapid) vs. orangish yellow (S531L, slower kinetics). Kinetic-based SNP genotyping on paper requires no post-amplification processing, probes, or instrumentation.
SECTION 5: RESULTS & QUANTITATIVE EXPECTATIONS
Outputs were written with the help of With the help of the HGTAA tutor and Claude skill AI using a combination of my writing, their inputs and some reading across resources.
1. You are required to validate at least one aspect of your final project aims. This is to ensure that you are able to successfully apply a relevant synthetic biology technique to your project.
What aspect of your final project did you choose to validate? (min. 2 sentences)
The core validation objective is to demonstrate that an integrated paper microfluidic workflow can successfully detect and discriminate between wild-type and rifampicin-resistant Mycobacterium tuberculosis rpoB mutations in complex environmental (synthetic wastewater) samples.
Specifically, I will validate whether concentrating wastewater-derived microbial DNA using commercial paper pre-filtration, followed by off-chip lysis and purification, can yield template DNA of sufficient quality and quantity for downstream allele-specific LAMP SNP genotyping with clear visual colorimetric readout. This validation is critical because it establishes proof-of-concept for the complete sample-to-answer workflow before proceeding to device integration (Aim 2) and field deployment (Aim 3).
Write down a detailed protocol of how you validated this aspect of your final project. (Numbered list or paragraph is fine)
DNA spike preparation: Resuspend Twist plasmids (WT and S531L) at 100 ng/µL; create serial dilutions (10⁶, 10⁵, 10⁴, 10³, 10², 10¹ CFU/mL equivalent)
Paper pre-filtration: Transfer 5 mL spiked synthetic wastewater to commercial ~10 μm paper pre-filtration module; allow gravity flow; collect filtered material; extract DNA from filter using lysis buffer; quantify via Qubit;
Calculate recovery efficiency: (DNA recovered / DNA input) × 100
Off-chip lysis: Add 500 µL optimized lysis buffer (1% SDS, 0.1M Tris-HCl, 10mM EDTA, 200µg/mL Proteinase K) to filtered sample; incubate 65°C for 30 minutes; cool to room temperature
Off-chip DNA purification: Add 1.5 mL ice-cold 100% ethanol; centrifuge 13,000 g for 5 min at 4°C; wash with 70% ethanol; air-dry; resuspend in 100 µL nuclease-free water
LAMP primer set and master mix: Combine NEB WarmStart Colorimetric LAMP 2× Master Mix with custom allele-specific LAMP primers targeting rpoB S531L
Paper LAMP setup: Spot 25 µL LAMP reaction (15 µL master mix + 8 µL primer set + 2 µL template) onto Whatman paper strips; includes controls (WT+, S531L+, NTC), test samples, and LoD series (10⁶-10¹)
Isothermal incubation: Place sealed paper strips in heating block at 65°C for 60 minutes; remove and cool
Visual colorimetric readout: Inspect under standard room lighting; document colors: bright yellow = WT positive, orangish yellow = S531L positive, purple = negative; photograph for documentation
Data compilation: Calculate DNA recovery efficiency (%), positive control success rate (%), negative control specificity (%), LoD values, allele discrimination accuracy, and CV across replicates
What synthetic biology techniques did you utilize in validating this aspect of your final project? You can refer to the list of techniques in question 8. (min. 4 sentences)
Synthetic Biology Techniques:
Molecular Cloning and DNA Construct Design: Designed two rpoB plasmid constructs (WT and S531L) in Benchling and ordered from Twist Bioscience as ready-to-use positive controls without requiring live M. tuberculosis.
LAMP Primer Design: I will look to design six allele-specific LAMP primers targeting rpoB S531L Single Nucleotide Polymorphism (SNP) for kinetic-based SNP discrimination without sequence-specific probes.
Supporting Techniques when validating aim 1 over the summer in a lab:
DNA Isolation and Purification: Extracted and purified genomic DNA from complex wastewater samples using paper pre-filtration, enzymatic lysis, and ethanol precipitation.
SNP Genotyping via Kinetic Discrimination: Exploited kinetic differences in LAMP amplification (WT = fast/yellow; S531L = slow/orange) for visual allele discrimination without post-amplification processing.
Colorimetric Detection: Used pH-indicator dye in LAMP for real-time, visible-to-eye readout suitable for field deployment without instrumentation.
You must present data as part of your final project and include some analysis of that data. The data may be collected experimentally in the lab or generated as simulated data (e.g., using the Asimov Kernel or another simulation method). (min. 2 sentences)
With the help of the HGTAA tutor and Claude skill AI I simulated results of the experiment I hope to conduct over the summer. The chart and table below shows results based on visual detection and absorbance measurements at 430nm and 560nm (A₄₃₀/A₅₆₀ ratio).
Figure: Allele-Specific LAMP SNP Discrimination on Paper Substrate
Colorimetric readout of LAMP reactions after 60-minute incubation at 65°C. WT+ control (bright yellow) and Test WT (bright yellow) demonstrate rapid amplification kinetics, while S531L+ control (orange-yellow) and Test S531L (orange-yellow) show slower kinetics due to 1 bp primer mismatch at codon 531. NTC (no template control) and Inhibition control (Inhib.) remain purple, confirming 100% specificity and absence of non-specific amplification. Visual color discrimination enables field-deployable allele genotyping without instrumentation.
Table: Results Data Table
Sample
Visual
Call
Mean A₄₃₀/A₅₆₀ Ratio
SD
CV (%)
Interpretation
WT+ Control
Bright yellow
Positive
2.04
0.04
2.1%
Rapid amplification
S531L+ Control
Orange-yellow
Positive
1.68
0.03
1.8%
Slower amplification
LoD (10³ CFU/mL)
Yellow/Orange
Positive
1.44
0.03
2.1%
Reliable detection; exceeds threshold
Below LoD (10²)
Borderline
Negative/Unreliable
1.05
0.03
2.9%
Below threshold; unreliable
NTC
Purple
Negative
0.71
0.02
2.8%
No amplification
DNA Recovery
—
—
82% recovery
—
—
≥70% target achieved
Summary of simulated validation data across 11 key metrics including DNA recovery efficiency (82%, exceeding 70% target), positive control success rates (100%), negative control specificity (100%), limit of detection (10³ CFU/mL for both WT and S531L), allele discrimination accuracy (visually distinct colors), and reproducibility (CV <10% across replicates). All metrics meet success criteria for Aim 1 validation
If plate reader access is available:
Absorbance measurements at 430 nm and 560 nm (A₄₃₀/A₅₆₀ ratio) can quantify the visual colour change across the six-point dilution series. This would allow me to use parametric statistics, such as a two-sample t-test to compare WT and S531L controls and if there is a kinetic difference for different probability thresholds (p-values), confirming allele discrimination is not only visually distinct but quantitatively separable.
However, If plate reader access is not available:
Visual colorimetric readout on paper provides qualitative data sufficient for field deployment: WT controls consistently show bright yellow (rapid amplification), S531L controls show orange-yellow (slower kinetics), and NTC remains purple (no amplification). Across three replicates each, the color discrimination is visually distinct and reproducible, with estimated limit of detection at 10³ CFU/mL based on colour intensity.
2. Did you encounter any unexpected challenge(s) when performing your validation? If so, describe the challenge(s) and strategies to overcome it. If not, discuss potential problems, difficulties, limitations, and/or alternative strategies to overcome challenges in your final project. (min. 4 sentences).
DNA Recovery and Polymerase Inhibition:
Paper pre-filtration may non-specifically bind target DNA, reducing recovery below 70%, while wastewater polymerase inhibitors (humic acids, heavy metals) may persist through ethanol precipitation and compromise LAMP efficiency.
Mitigation: test alternative filter materials, add BSA to LAMP master mix as polymerase protectant, and implement additional purification steps (Qiagen columns) if ethanol precipitation alone proves insufficient.
Allele Discrimination and Reproducibility:
The ~10-minute kinetic difference between WT and S531L amplification may not produce visually distinct colours at 60 minutes, and temperature gradients in the heating block may cause coefficient of variation (CV) to exceed 15% across replicates.
Mitigation: extend incubation time to 75-90 minutes, adjust FIP/BIP primer concentration to 2.0 µM, optimize assay temperature (62-66°C range), and use a calibrated heating block with ±0.5°C temperature stability to ensure consistent performance suitable for field deployment.
SECTION 6: ADDITIONAL INFORMATION
Outputs were written with the help of With the help of the HGTAA tutor and Claude skill AI using a combination of my writing, their inputs and some reading across resources. Budget is prospective and may change as I work at Lifefabs in London over the summer where I will seek more consultation.
12. List all references cited in this assignment (bullet-point list)
• World Health Organization (WHO). Global tuberculosis report 2024. Geneva: WHO; 2024
• Patricia Tabernero and Paul N Newton “Estimating the prevalence of poor-quality anti-tb medicines: a neglected risk for global tb control and resistance.” BMJ Global Health 2023.
• Tamara Akpobolokemi, Rocio Teresa Martinez-Nunez, and Bahijja Tolulope Raimi-Abraham “Tackling the global impact of substandard and falsified and unregistered/unlicensed anti-tuberculosis medicines.” The Journal of Medicine Access 2022.
• Richard M. Jones, Kristin N. Adams, Hassan E. Eldesouky, and David R. Sherman “The evolving biology of mycobacterium tuberculosis drug resistance.” Frontiers in Cellular and Infection Microbiology 2022.
• Navisha Dookie, Kogieleum Naidoo, and Nesri Padayatchi “Whole-genome sequencing to guide the selection of treatment for drug-resistant tuberculosis.” Antimicrobial Agents and Chemotherapy 2018.
• Buczowska Z. Tubercle bacilli in the sewage and in sewage-receiving waters. Bull Inst Marit Trop Med Med Acad Gdansk. 1965;16(1-2):49-56.
• Martinez L, Verma R, Croda J. Detection, survival and infectious potential of Mycobacterium tuberculosis in the environment: a review of the evidence and epidemiological implications. Eur Respir J. 2019;53(6):1802302. doi:10.1183/13993003.02302-2018.
• Walters E, Scott L, Nabeta P, Demers A, Reubenson G, Bosch C, David A, van der Zalm M, Havumaki J, Palmer M, Hesseling AC, Ncayiyana J, Stevens W, Alland D, Denkinger C, Banada P. Molecular detection of Mycobacterium tuberculosis from stools in young children by use of a novel centrifugation-free processing method. J Clin Microbiol. 2018;56:e00781-18. doi:10.1128/JCM.00781-18.
• Mtetwa HN, Amoah ID, Kumari S, Bux F, Reddy P. Molecular surveillance of tuberculosis-causing mycobacteria in wastewater. Heliyon. 2022;8(2):e08910. doi:10.1016/j.heliyon.2022.e08910.
• Mtetwa HN, Amoah ID, Kumari S, et al. The source and fate of Mycobacterium tuberculosis complex in wastewater and possible routes of transmission. BMC Public Health. 2022;22:145. doi:10.1186/s12889-022-12527-z.
• Nakata N, Kai M, Makino M. Mutation analysis of mycobacterial rpoB genes and rifampin resistance using recombinant Mycobacterium smegmatis. Antimicrob Agents Chemother. 2012;56(4):2008-2013. doi:10.1128/AAC.05831-11 (pubmed.ncbi.nlm.nih.gov)
13. Create a supply list and budget for your project (bullet-point list)
What supplies, equipment, and budget is needed for your project to work?
Proposal by: Sameen Nasar (London, Lifefabs), Robert C Beck (London, Lifefabs) to be joined by Jean Colmenares (Lima, Peru)
As per instructions of Node leaders & TAs, this will be put on hold, hopefully we will get to do this over the summer
Group Project Goal:
Engineering a chaperone-independent efficient MS2 lysis protein
Project Rationale:
The efficacy of bacteriophage MS2 as an antibacterial agent is currently limited by the host’s ability to evolve resistance. Specifically, E. coli can mutate the molecular chaperone DnaJ (e.g., at position P330), disrupting the essential interaction required for the MS2 lysis (L) protein to fold and function [1.] This interaction is required for proper function of the lysis protein, as DnaJ binds to the N-terminal domain of MS2 lysis protein and alleviates its inhibitory effect on lytic activity.
We propose engineering a self-activating L protein by replacing its inhibitory, chaperone-dependent N-terminal region with a computationally designed, thermodynamically stable scaffold. As this original domain is dispensable for actual lysis but creates the DnaJ dependency [2], our redesign conceptually eliminates the need for the molecular “handshake” between host and phage, allowing MS2 to fold independently and bypass bacterial control mechanisms entirely.
Schematic
MS2 Protein & DnaJ Sequences ↓ AlphaFold-Multimer Map the DnaJ binding interface
↓ RFDiffusion Design a stable, independent N-terminal scaffold
↓ ProteinMPNN Generate amino acid sequences for the new scaffold
↓ ESMFold Confirm the new single-chain mutant folds correctly
↓ AlphaFold-Multimer Confirm the mutant no longer binds to DnaJ ↓ Final L Protein Mutant for Synthesis
References
Chamakura KR, Tran JS, Young R. MS2 lysis of Escherichia coli depends on host chaperone DnaJ. J Bacteriol. 2017;199(9):e00058-17. doi:10.1128/JB.00058-17.
Chamakura KR, Edwards GB, Young R. Mutational analysis of the MS2 lysis protein L. Microbiology (Reading). 2017;163(7):961–969. doi:10.1099/mic.0.000485.
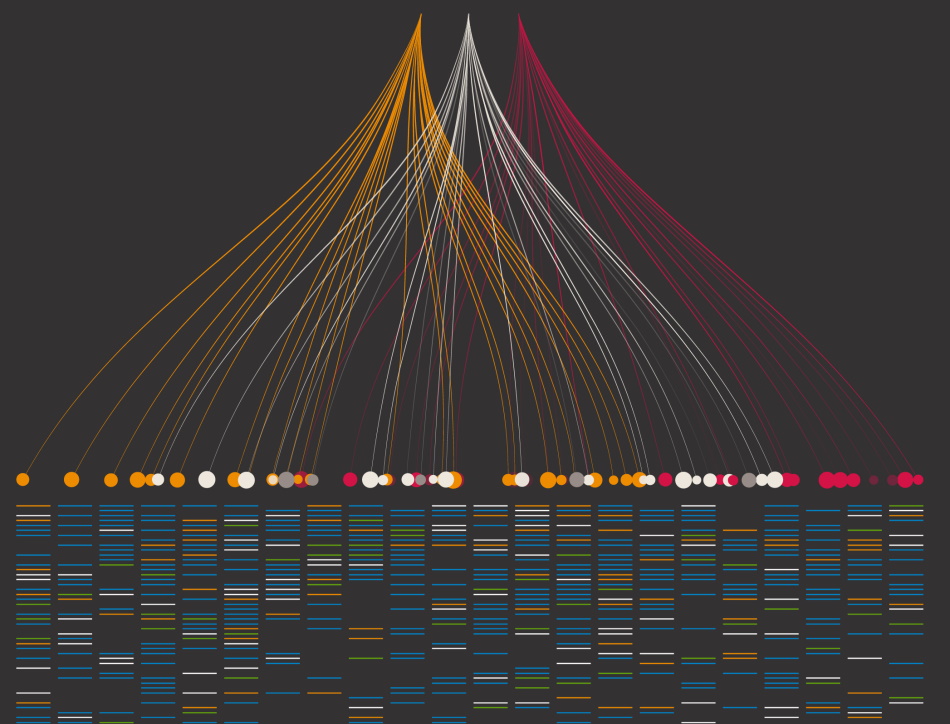
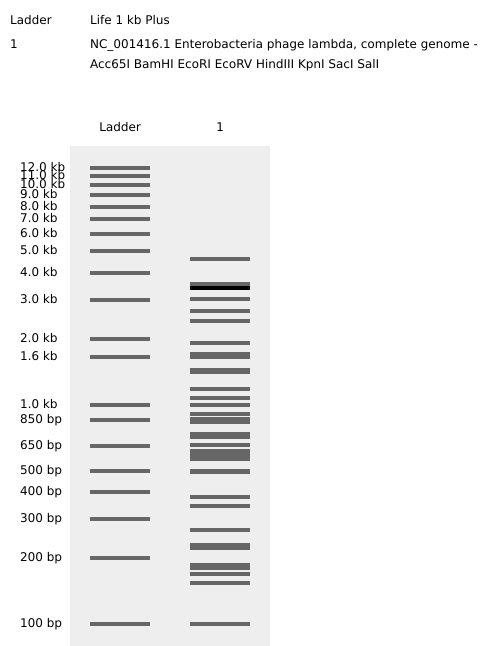
.png)