Individual Final Project
SECTION 1: ABSTRACT
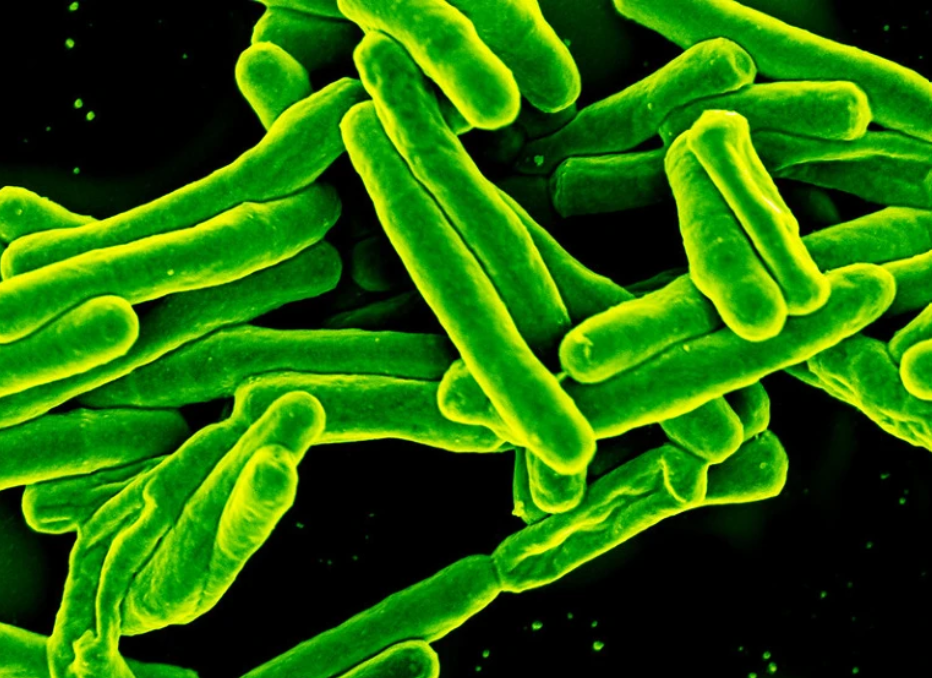
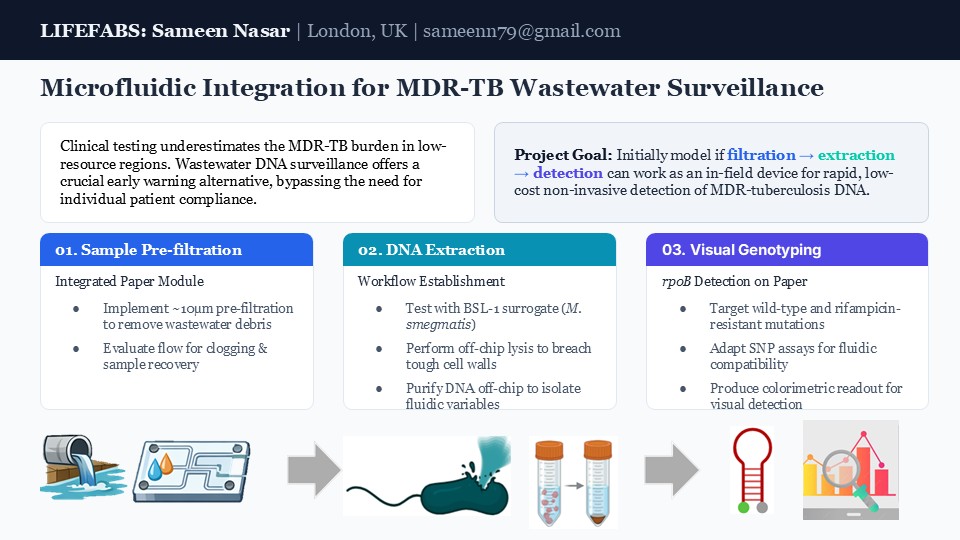
Tuberculosis, caused by Mycobacterium tuberculosis, remains one of the leading infectious disease killers globally. Multidrug resistant TB (MDR-TB), resistant to first-line drugs such as isoniazid and rifampicin, is a major contributor to global antimicrobial resistance (AMR). Current surveillance relies on clinical testing, which is limited by inadequate diagnostic infrastructure, healthcare access barriers, and social stigma reducing testing uptake. The project evaluates whether wastewater-based sampling can serve as a scalable, non-invasive interface for detecting rifampicin-resistant tuberculosis through downstream molecular analysis.
The central hypothesis is that concentrating microbial genetic material from wastewater using a robust pre-filtration and capture system will enable reliable molecular detection of rpoB mutations associated with rifampicin resistance, even in complex environmental samples. To test this, a staged workflow will be developed using a ~10 µm pre-filtration module to reduce particulate load, followed by evaluation of DNA recovery efficiency with the BSL-1 surrogate Mycobacterium smegmatis. Recovered nucleic acids will then be assessed for compatibility with molecular genotyping assays targeting rifampicin resistance-associated single nucleotide polymorphisms (SNPs).
The approach includes wastewater sampling with a robust pre-filtration and off-chip DNA extraction workflow for downstream molecular analysis. A rpoB gene fragment representing wild-type and rifampicin-resistant mutations will be used to validate allele-specific SNP detection with a simple colorimetric readout, enabling scalable surveillance of tuberculosis resistance.
SECTION 2: PROJECT AIMS
Define three aims for your final project (minimum one sentence per aim).
Aim 1: Experimental Aim (this project):
a. “The first aim of my final project is to [achievable experimental goal] by utilizing [protocols, tools, or strategies].”
i. This aim should describe the core experimental objective you will attempt during this class. List or link any relevant methods or resources you plan to use (e.g., experimental protocols, automation workflows, DNA or protein designs, protein design tools, or Twist orders).
You will provide a detailed step-by-step experimental plan for Aim 1 in the Experimental Design section of this assignment.
The first aim of my final project is to develop and validate a LAMP-based molecular assay for detecting rifampicin-resistant M. tuberculosis via rpoB S531L mutations by designing allele-specific LAMP primer sets and optimizing SNP detection in spiked, complex synthetic wastewater samples.
This will be done by utilizing layered glass fiber–nitrocellulose filtration for cell concentration, on-membrane chemical lysis, and colorimetric LAMP detection with a Twist Bioscience-synthesized rpoB RRDR positive control. Mycobacterium smegmatis, a commonly used BSL-1 surrogate for Mycobacterium tuberculosis, will be used to evaluate sample recovery and assay performance under controlled laboratory conditions.
The experimental workflow includes:
(i) Commercial paper-based pre-filtration (~10 μm) for microbial cell concentration
(ii) Off-chip chemical lysis (SDS + Proteinase K, 65°C, 30 min) for DNA extraction
(iii) Ethanol precipitation for DNA purification from complex matrices
(iv) Twist Bioscience-synthesized rpoB RRDR positive controls (wild-type and S531L constructs)
(v) NEB WarmStart colorimetric LAMP master mix for isothermal amplification
(vi) Custom allele-specific LAMP primers from IDT targeting rpoB S531L SNP
(vii) Mycobacterium smegmatis (BSL-1 surrogate for M. tuberculosis) for validation
(viii) Paper substrate for colorimetric LAMP detection with visual readout
Success metrics include: ≥70% DNA recovery from pre-filtration, visually distinct allele discrimination (WT = bright yellow, S531L = orange-yellow), limit of detection ≤10³ CFU/mL, 100% negative control specificity, and reproducibility CV <15% across replicates.
Aim 2: Development Aim:
Describe the next step that would follow a successful Aim 1, extending the work beyond the scope of this course. This aim should represent a realistic progression of the project, such as executing additional experiments, solving a technical limitation, or developing the system or technology further.
Following LAMP validation, I would aim to integrate the LAMP chemistry within a nitrocellulose Microfluidic paper analytic device (µPAD) that combines passive filtration, on-chip lysis buffer delivery, and isothermal amplification zones. This will be then further tested on spiked environmental water samples (tap water, pond water, streams in villages) at clinically relevant cell concentrations. The device itself will be further evaluated for thermal stability by lyophilizing the LAMP master mix into the amplification zone and storing assembled devices at 35°C and 42°C for 7, 14, and 30 days. Performance will be benchmarked against Day 0 LOD using a Twist synthetic rpoB RRDR fragment at 10³ copies/reaction as a defined standard.
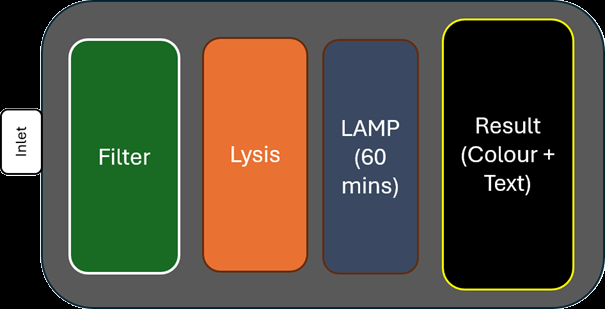
Figure: Potential Schematic of Integrated Device
Aim 3: Visionary Aim:
a. Describe the long-term vision for the project. Explain how the broader concept could have an impact if fully realized.
b. Examples include:
i. Challenging an existing paradigm or clinical practice.
ii. Addressing a major barrier in a field.
Enabling a new experimental capability or research approach.
Using the open-source device and surveillance strategies, detect AMR at the community level to enable rapid testing, analysis, and diagnosis of MDR-TB. This will be done by distributing these environmental AMR detection devices/sensors in wastewater treatment plants, river monitoring stations, and community water sources across low-resource settings. The ideal vision is to have a two-tiered surveillance approach, where:
Tier 1-Passive Surveillance: Devices are deployed at fixed wastewater sampling points (treatment plant inlets, community drainage channels) and processed weekly by local environmental health teams. A positive colorimetric LAMP signal triggers an automated community alert to the regional surveillance team, who deploy GeneXpert-based clinical testing in the flagged area to identify and treat affected individuals.
Tier 2-Active Community Health Worker Point-of-Need Testing: Community health workers carry pre-loaded µPAD kits for on-demand water source testing during household visits or outbreak investigations. Areas with positive results will be directed towards surveillance teams for individual testing.
If fully realised the Expected Impact could be:
If achieved, this paradigm shift would enable early detection of resistance emergence hotspots before community-wide transmission, facilitate targeted MDR-TB treatment programs, reduce unnecessary broad-spectrum antibiotic use, and inform WHO drug policy decisions. It would empower communities most affected by TB with surveillance capability and democratize access to genomic resistance data.
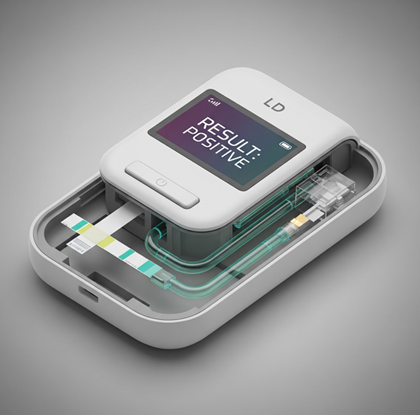
Figure: Prospective Design Device (Image generated with instructions)
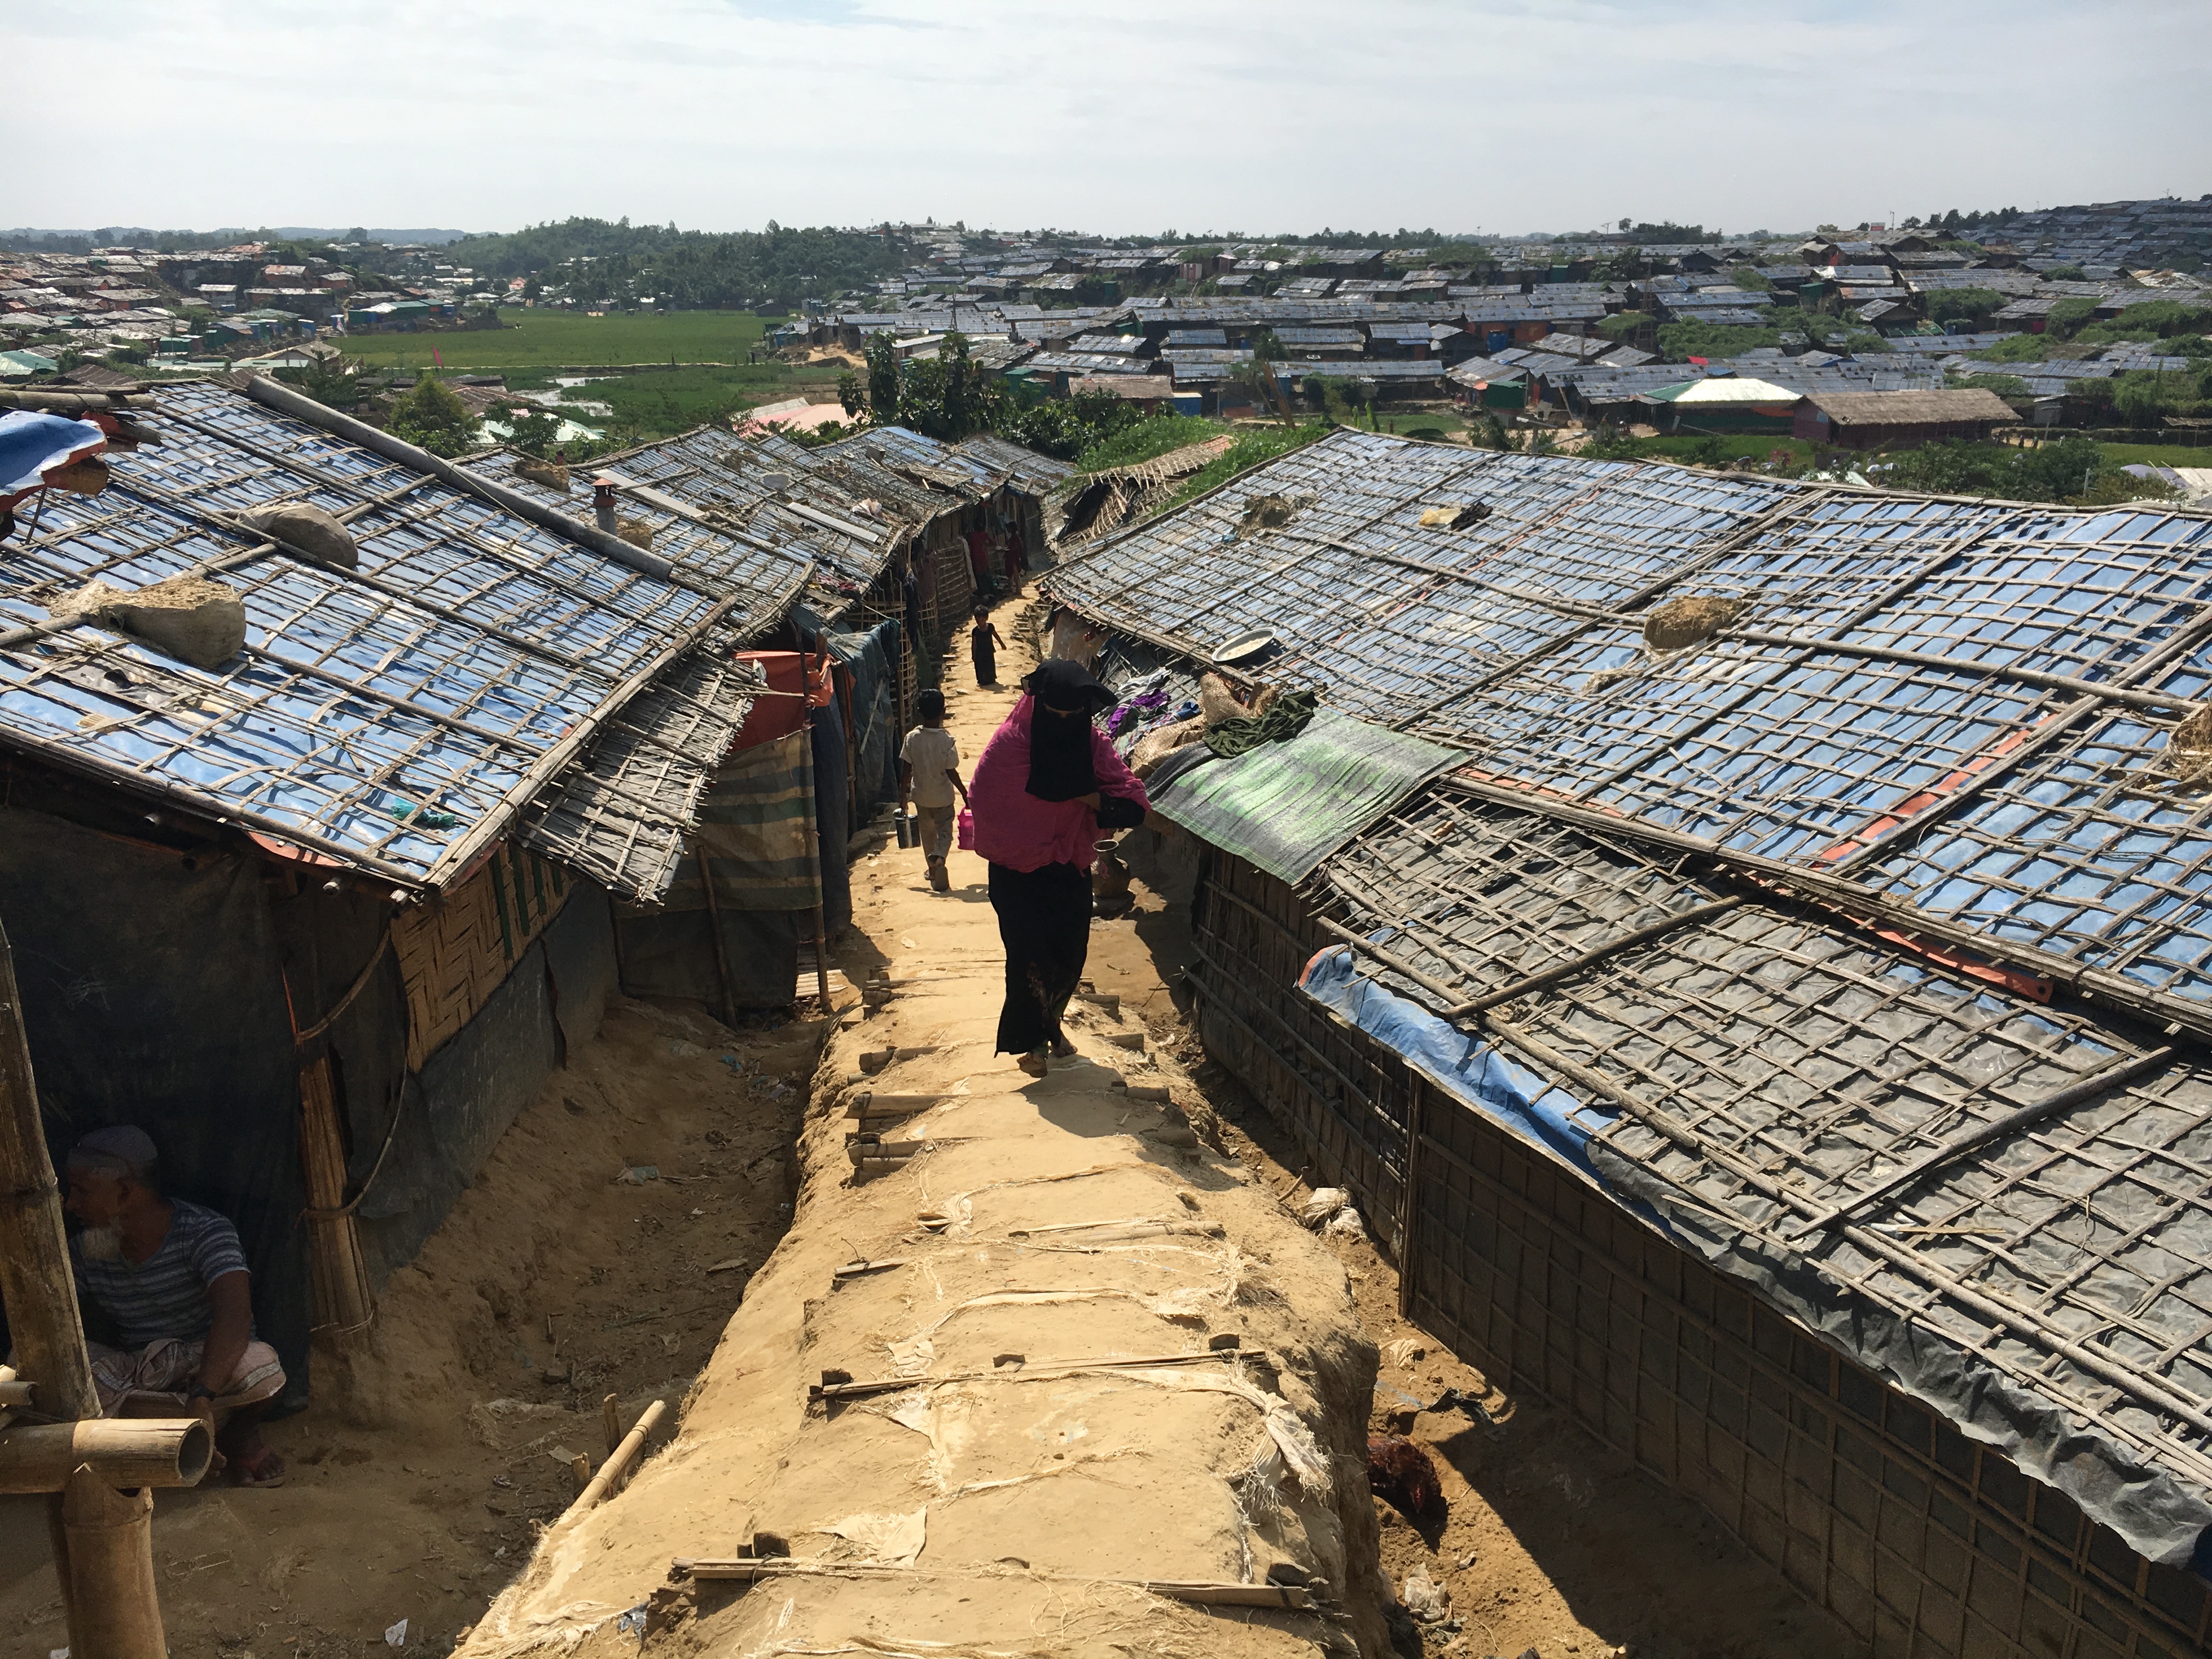
Figure: Potential Areas for Deployment: Humanitarian Settings with informal water systems (Field pictures: Rohingya Refugee Camp on borders of Myanmar & Bangladesh)
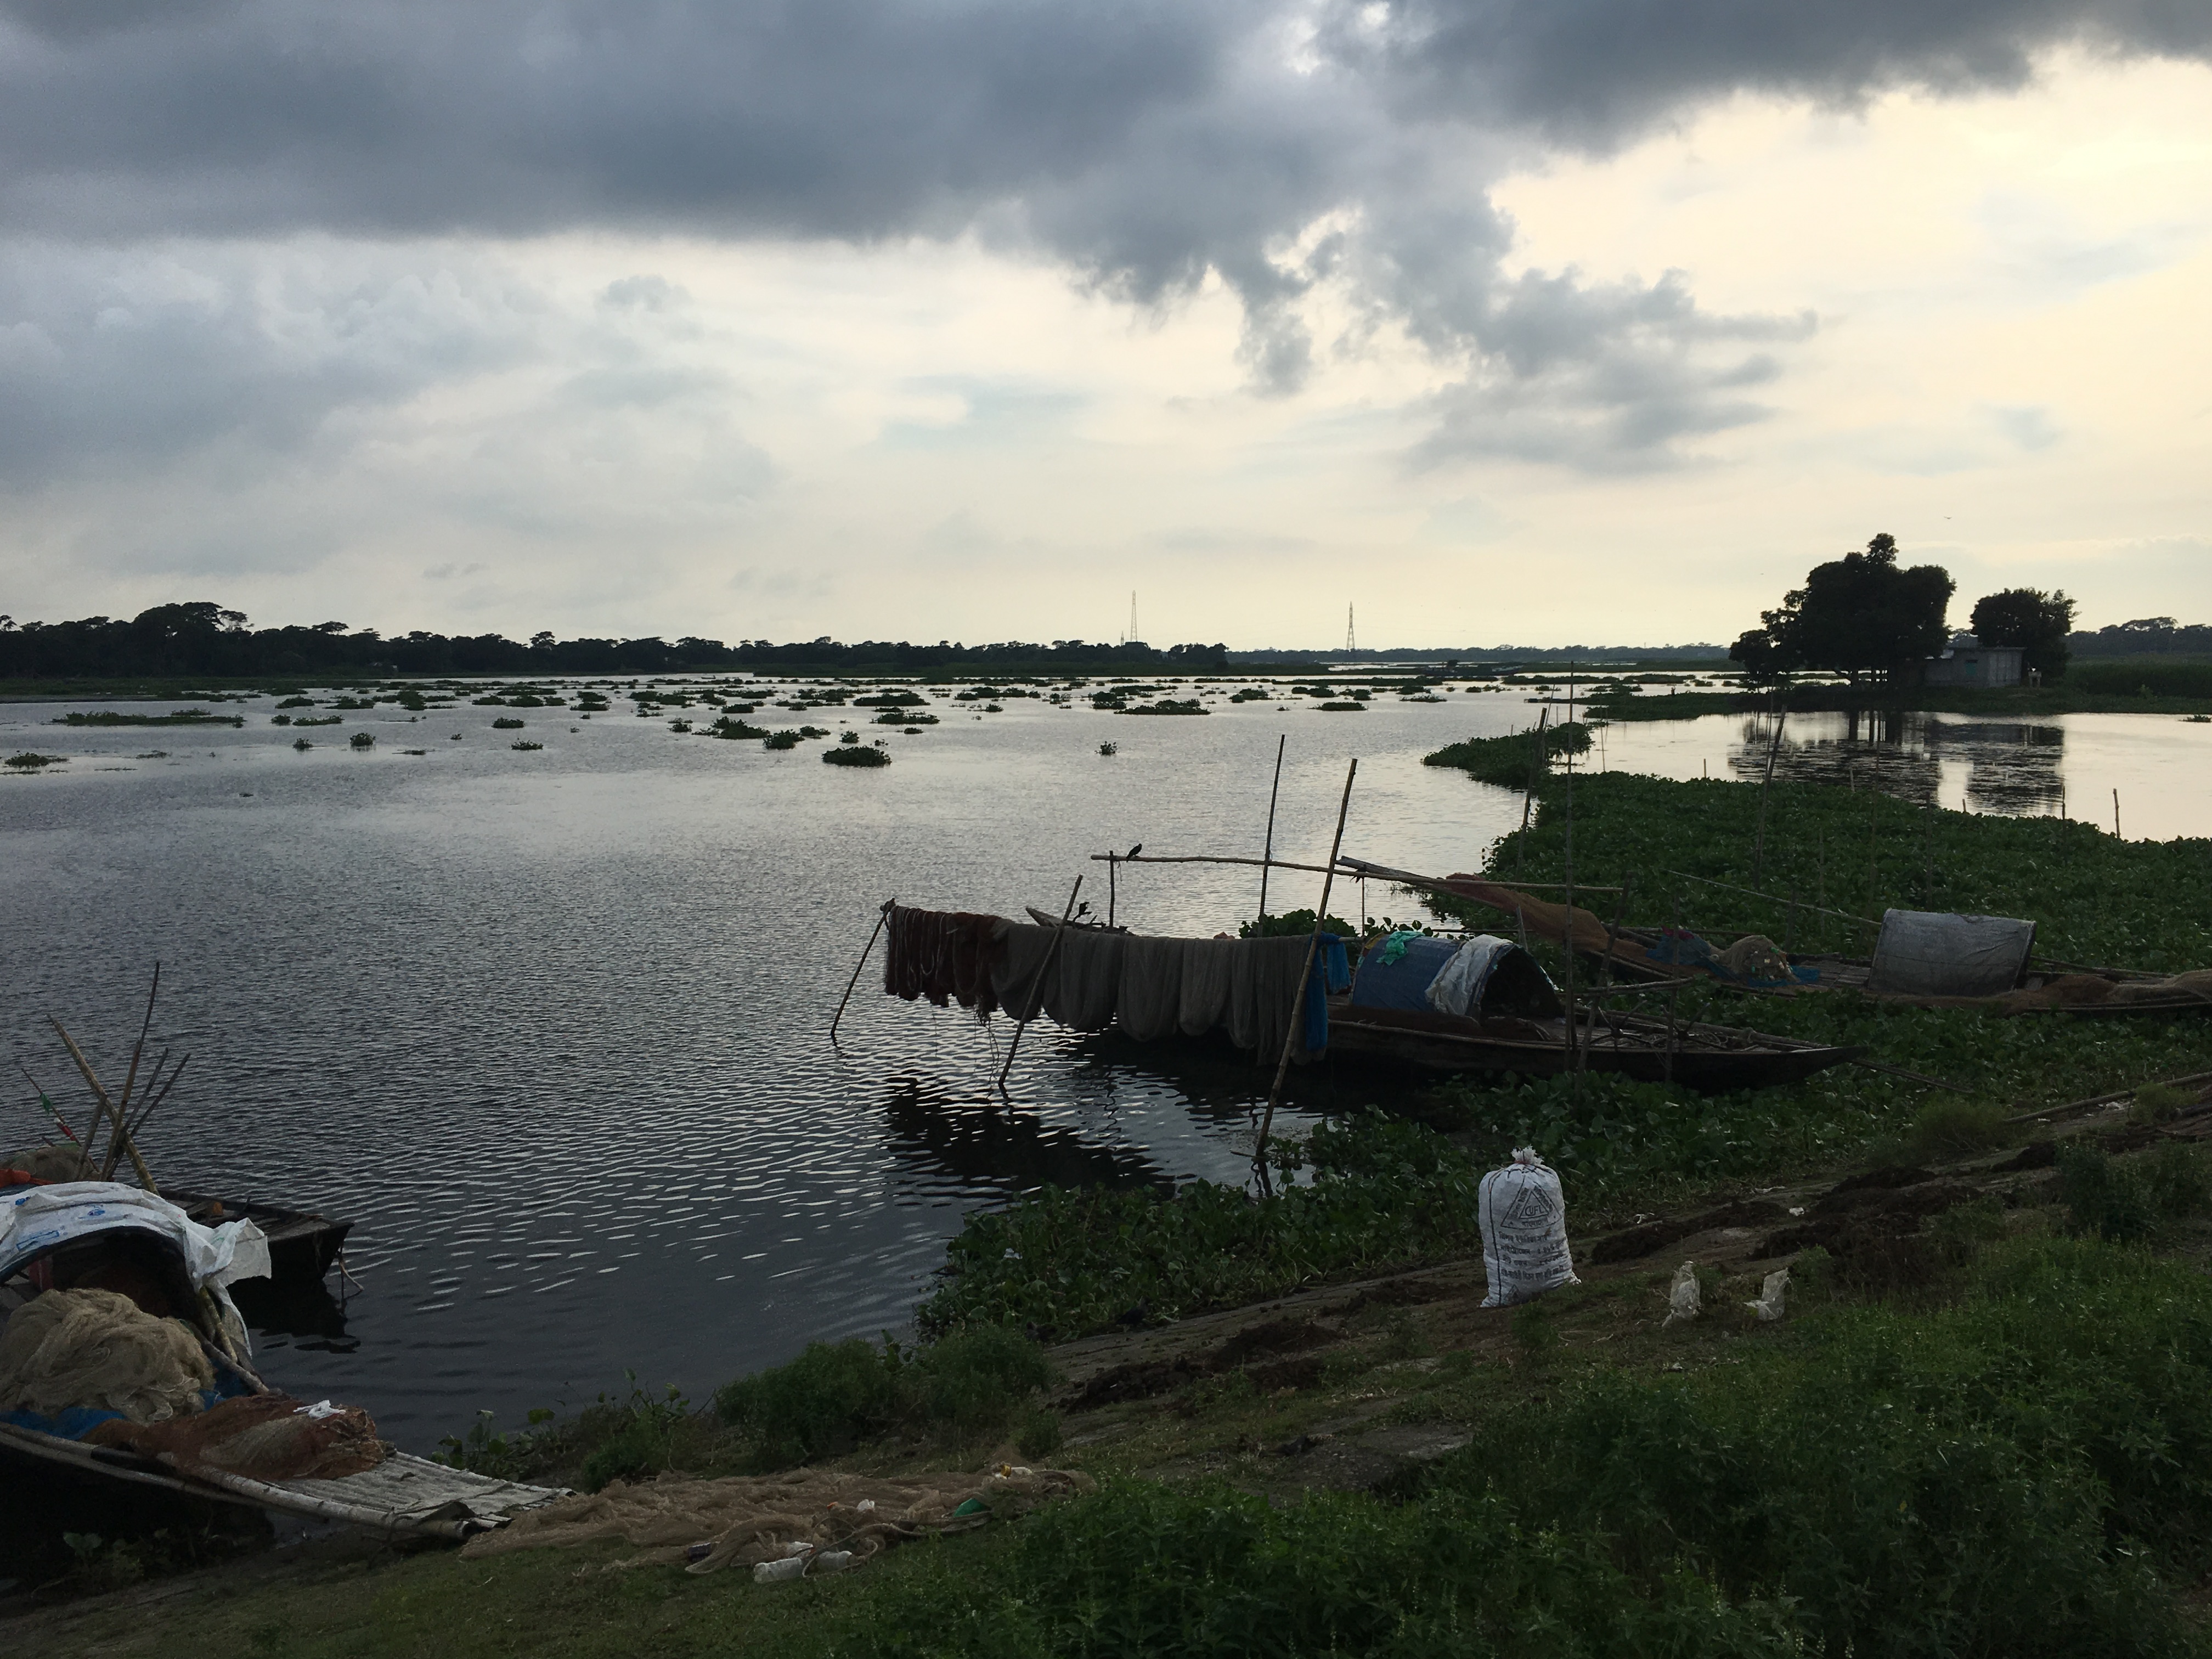
Figure: Potential Areas for Deployment: Remote low-resource settings (Field pictures: Matlab, Chandpur, Bangladesh (Near cluster of brick kilns & many informal pharmacies))
SECTION 3: BACKGROUND
Background and Literature Context
Provide background research that explains the current state of knowledge and identifies the gap in knowledge or capability that your project addresses.
Tuberculosis, caused by Mycobacterium tuberculosis, remains one of the leading infectious disease killers globally [1]. Multidrug resistant TB (MDR-TB), resistant to first-line drugs such as isoniazid and rifampicin, is a major contributor to global antimicrobial resistance (AMR). Unregulated pharmaceutical use, which includes over-the-counter sales without prescription and substandard/falsified anti-tuberculosis medicine, is widely prevalent in many high-burden burden countries [2, 3], leading to the emergence and persistence of drug-resistant strains. However, TB detection remains highly dependent on clinical testing infrastructure and diagnostic availability, both of which are often limited in low-resource settings. While next-generation sequencing (NGS), particularly whole genome sequencing (WGS), now enables high-resolution profiling of resistance mutations and transmission dynamics, these approaches remain costly and dependent on individual patient sampling.
During infection, M. tuberculosis can persist within host granulomas for prolonged periods, enabling continued adaptation under immune and antibiotic pressure. Unlike many bacteria that acquire resistance through horizontal gene transfer, M. tuberculosis primarily develops drug resistance through chromosomal mutations such as single nucleotide polymorphisms (SNPs) and insertions/deletions affecting drug targets, activators, and enzymes [4,5]. This persistence-driven evolution contributes to treatment failure, long-term transmission, and the emergence of MDR-TB strains.
Although TB transmission is classically considered airborne, increasing historical and modern evidence suggests that M. tuberculosis can also persist in environmental reservoirs including soil, dust, water, and wastewater for extended periods [6, 7]. Experimental studies demonstrated that environmental samples contaminated with M. tuberculosis were capable of infecting guinea pigs and mice, while more recent studies have identified viable mycobacteria in soil and wastewater months after contamination [7]. Additional evidence suggests that wastewater contamination may originate from faecal and urinary shedding of Mycobacterium tuberculosis complex (MTBC) organisms, particularly in patients with gastrointestinal involvement of TB [8]. Recent wastewater-based epidemiology studies have further confirmed the detection of MTBC DNA in untreated and treated wastewater using PCR and droplet digital PCR methods, supporting the feasibility of wastewater as a population-level surveillance tool for tuberculosis monitoring [9, 10].
Furthermore, the persistence of mycobacteria in wastewater environments raises the possibility that environmental reservoirs may contribute to prolonged community circulation and under-recognized transmission dynamics; for example, aerosols generated during wastewater treatment, the reuse of wastewater for irrigation could also lead to the generation of aerosols [10].
Building on this evidence, this project proposes a portable microfluidic paper-based platform integrating filtration, DNA extraction, and visual SNP genotyping targeting rifampicin-resistance mutations in the rpoB gene. Rather than solely detecting the presence of M. tuberculosis, the project aims to investigate whether wastewater-derived DNA can reveal resistance-associated mutations at the population level, enabling low-cost environmental surveillance of MDR-TB evolution and transmission. Furthermore, this will provide community health workers, who often visit remote areas, a device to identify susceptible areas and transmission hotspots, allowing targeted public health interventions that reduce both surveillance costs and clinical disease burden.
Innovation & Novelty
This project is novel in three key dimensions.
First, it applies wastewater-based epidemiology (WBE) to detect not just the presence of TB, but resistance mutations at the population level, enabling low-cost environmental surveillance of MDR-TB evolution and transmission without individual patient testing. Unlike traditional surveillance that requires sputum samples, blood draws, or clinical diagnosis; these impose barriers to participation due to invasion, discomfort, and diagnostic bottlenecks slowing down data collection and swift detection of hotspots. Most WBE studies focus on viral pathogens (SARS-CoV-2, polio); applying this to TB resistance mutations is innovative and underexplored.
Second, the project integrates paper-based microfluidics with allele-specific LAMP SNP genotyping, a combination that has not been extensively characterized for TB resistance detection. The kinetic-based discrimination requires no post-amplification processing.
Third, the project prioritizes field deployment from the outset, designing the assay device for use by community health workers in remote or underserved regions without laboratory infrastructure, electricity, or highly trained personnel.
Significance & Impact
Tuberculosis remains a leading infectious disease killer, with MDR-TB driving global antimicrobial resistance. Current surveillance relies on individual clinical diagnosis, missing asymptomatic carriers and failure to detect resistance emergence until clinical diagnosis of outbreaks occur; global MDR-TB treatment success rates are as low as 10%.
This project enables rapid, low-cost, non-invasive population-level surveillance of TB resistance through wastewater monitoring, providing an earlier detection window before widespread community transmission.
The open-source paper device design ensures accessibility to low-resource settings, avoiding intellectual property barriers that currently limit TB diagnostics to high-income regions.
The methods (wastewater pre-filtration + LAMP SNP detection on paper) are broadly applicable to drug-resistant malaria, COVID-19 variants, and antimicrobial resistance surveillance generally, advancing environmental molecular surveillance beyond TB.
If successful, TB surveillance will shift from individual clinical testing to population-level environmental monitoring, enabling earlier resistance detection, faster public health response, and empowering community health workers to conduct surveillance in endemic regions.
Third, the project prioritizes field deployment from the outset, designing the assay device for use by community health workers in remote or underserved regions without laboratory infrastructure, electricity, or highly trained personnel.
Ethical Implications and Proposed Safeguards
Wastewater-based epidemiology for TB surveillance raises distinct ethical considerations. Although using environmental samples rather than direct human subjects, it generates population-level health data about communities. Primary ethical principles include non-maleficence (avoiding harm), beneficence (maximizing benefit), justice (fair distribution of benefits/burdens), and responsibility (accountability for societal implications).
Governance Goal 1: Prevent Harm and Misuse
Sub-goal 1a: Require ethical review and oversight of surveillance data and secondary uses
Establish IRB/ethics committee approval before deployment
Define permissible uses of surveillance data (TB control only; prohibit immigration/policing)
Implement data access restrictions and audit trails
Sub-goal 1b: Establish strict guidelines on location data precision and sharing
Aggregate results at regional/facility level, not neighborhood or household level
Prohibit public disclosure of specific wastewater treatment plants as positive
Require anonymization in any scientific publications
Sub-goal 1c: Establish accountability mechanisms
Create grievance processes for communities
Establish liability frameworks for misuse by state or private actors
Regular third-party audits of data handling
Governance Goal 2: Promote Equity in Data Collection and Development
Sub-goal 2a: Control of locally-generated data
Host surveillance data on servers controlled by implementing country
Require data-sharing agreements ensuring country retains ownership
Prevent unilateral export of data without consent
Sub-goal 2b: Inclusion of implementing country as equal research partners
Establish co-authored publications requiring local institution as co-author
Fund local research teams to lead interpretation and analysis
Ensure local researchers trained in bioinformatics and epidemiology
Sub-goal 2c: Prioritize under-resourced regions with coupled treatment access
Deploy surveillance only where clinical TB diagnostics and MDR-TB treatment are available
Conduct surveillance in communities that specifically request it
Tie surveillance funding to health system strengthening
Actions
Action 1: Regulation and Standards for Early-Stage Bio-Sensor Development
Purpose: Create regulatory standards for paper-based LAMP devices before widespread deployment, ensuring safety, accuracy, and responsible innovation.
Design: Public health agencies (WHO, CDC, national TB programs) + diagnostic developers establish validation criteria, accuracy thresholds (≥95% sensitivity/specificity), metadata standards, and geolocation safeguards. Embed standards into existing TB surveillance protocols.
Assumptions: Regulators will rapidly evaluate devices; public health systems will adopt technology quickly.
Risks: Bureaucratic delays may slow innovation. Premature reliance on bio-sensors could cause false positives and misdirected public health responses.
Action 2: Pre-Detection Rapid Signal Regulatory Pathways
Purpose: Create formal pathways for rapid surveillance signals (positive LAMP signals) to trigger clinical verification (GeneXpert) before data enters national surveillance systems, with defined quality and data-use standards.
Design: WHO + national TB programs + public health agencies expand existing WHO genomic data-sharing principles to include rapid biosensor signals.
Define workflow: Positive LAMP signal clinical testing confirmed case reported (not signal alone).
Assumptions: Developers implement required standards; public health agencies can train workers to interpret signals; state agencies have technical capacity.
Risks: State agencies may lack expertise; misinterpretation of signals could delay response or cause panic; disagreements on implementation across countries.
Action 3: Ethical Data Access and Community Engagement Requirements
Purpose: Mandate consistent privacy, consent, equity, and community engagement standards for all TB surveillance data collection and use.
Design: Establish standardized data agreements specifying permissible uses, benefit-sharing, and consent mechanisms. Create local advisory boards and steering committees for community feedback and oversight. WHO/national bodies enforce compliance.
Assumptions: Communities will engage meaningfully; cross-country coordination on ethics is possible; implementation won’t significantly slow operations.
Risks: Strict data provisions may slow action; communities may view engagement as superficial; high administrative burden.
Potential Unintended Consequences & Mitigation
(i) Surveillance data could be misused for community stigmatization
a. Mitigation: Data aggregation policies, restricted access, clear communication about population vs. individual-level data
(ii) Consequence: Device/protocols might fail in field conditions
a. Mitigation: Extensive stability testing, field-readiness validation before deployment, contingency planning
(iii) Communities might experience surveillance as invasion of privacy
a. Mitigation: Community engagement, transparency, opt-out mechanisms, demonstrated benefits
Recommendations
If ethical challenges prove to be too large of a burden:
(i) Selective surveillance at high-burden health facilities instead of community-wide wastewater surveillance
(ii) Combined clinical + environmental surveillance to reduce reliance on either approach alone
(iii) Technology transfer to local organizations for autonomous implementation with cultural oversight
(iv) Participatory research model where, communities co-design surveillance approach and data use policies
(v) Pilot surveillance in communities that explicitly request it, rather than imposing surveillance
SECTION 4: EXPERIMENTAL DESIGN, TECHNIQUES, TOOLS, AND TECHNOLOGY
Outputs were written with the help of With the help of the HGTAA tutor and Claude skill AI using a combination of my writing, their inputs and some reading across resources.
1. Detailed Experimental Plan for Aim 1 The Aim 1 experimental pipeline is a complete 12-step integrated workflow spanning 12 weeks
Weeks 1-2:
For the first iteration, as an online committed student, I was set on getting a gene fragment of the BSL-1 surrogate Mycobacterium smegmatis for testing and validation.
For this process:
Went to NCBI Nucleotide: https://www.ncbi.nlm.nih.gov/nucleotide/
Searched: CP000480 Mycobacterium smegmatis
M. smegmatis MC2-155 complete genome
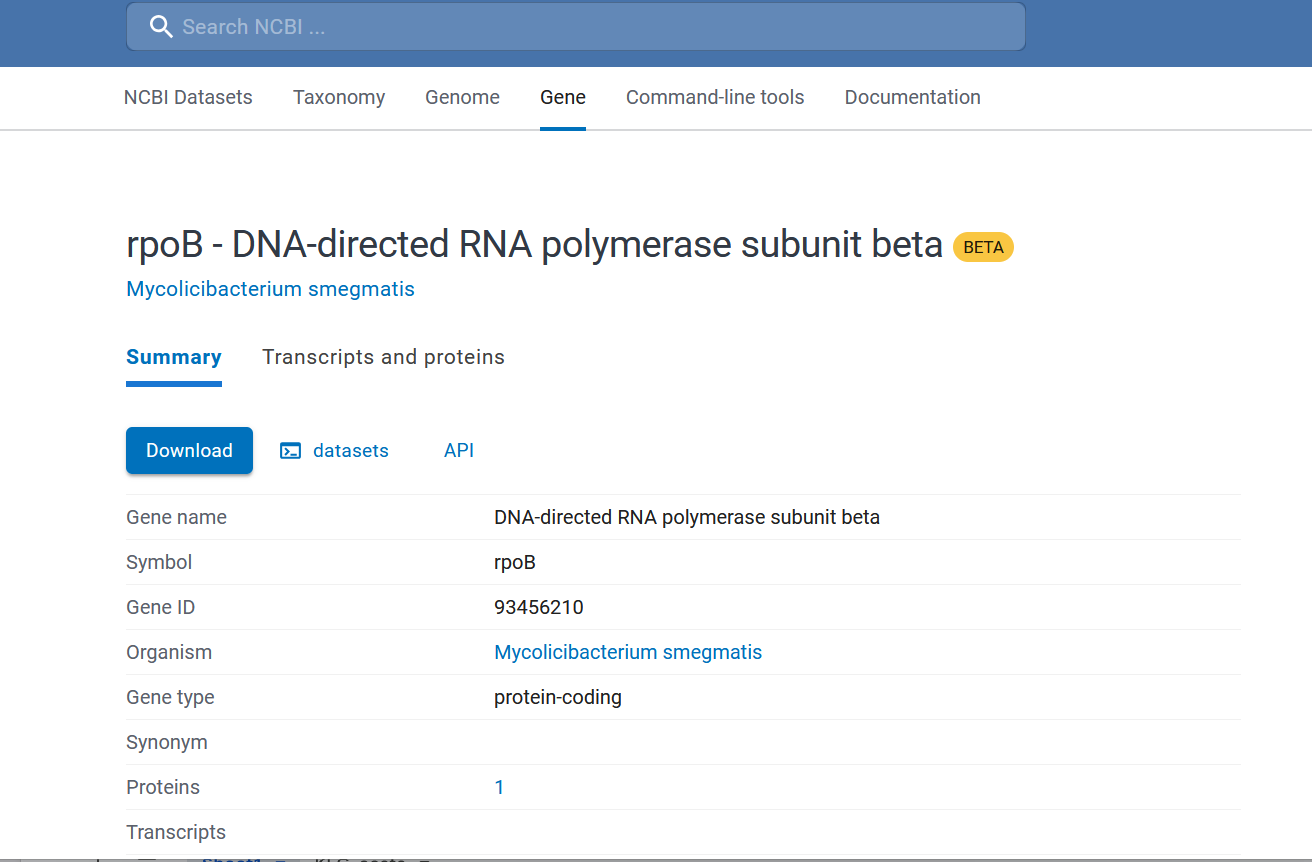
Searched: MSMEG_1367 (this is rpoB | used help from chatGPT to search this)
after clicking CDS next to it I got:
1461630..1465139 /gene=“rpoB” /locus_tag=“MSMEG_1367” /EC_number=“2.7.7.6” /note=“identified by match to protein family HMM PF00562; match to protein family HMM PF04560; match to protein family HMM PF04561; match to protein family HMM PF04563; match to protein family HMM PF04565; match to protein family HMM TIGR02013” /codon_start=1 /transl_table=11 /product=“DNA-directed RNA polymerase, beta subunit” /protein_id=“ABK70312.1” /translation=“MLEGCILAVSSQSKSNAITNNSVPGAPNRVSFAKLREPLEVPGL LDVQTDSFEWLVGSDRWRQAAIDRGEENPVGGLEEVLAELSPIEDFSGSMSLSFSDPR FDEVKASVDECKDKDMTYAAPLFVTAEFINNNTGEIKSQTVFMGDFPMMTEKGTFIIN GTERVVVSQLVRSPGVYFDETIDKSTEKTLHSVKVIPGRGAWLEFDVDKRDTVGVRID RKRRQPVTVLLKALGWTNEQIVERFGFSEIMMGTLEKDTTSGTDEALLDIYRKLRPGE PPTKESAQTLLENLFFKEKRYDLARVGRYKVNKKLGLNAGKPITSSTLTEEDVVATIE YLVRLHEGQTSMTVPGGVEVPVEVDDIDHFGNRRLRTVGELIQNQIRVGLSRMERVVR ERMTTQDVEAITPQTLINIRPVVAAIKEFFGTSQLSQFMDQNNPLSGLTHKRRLSALG PGGLSRERAGLEVRDVHPSHYGRMCPIETPEGPNIGLIGSLSVYARVNPFGFIETPYR KVENGVVTDQIDYLTADEEDRHVVAQANSPTDENGRFTEDRVMVRKKGGEVEFVSADQ VDYMDVSPRQMVSVATAMIPFLEHDDANRALMGANMQRQAVPLVRSEAPLVGTGMELR AAIDAGDVVVADKTGVIEEVSADYITVMADDGTRQSYRLRKFARSNHGTCANQRPIVD AGQRVEAGQVIADGPCTQNGEMALGKNLLVAIMPWEGHNYEDAIILSNRLVEEDVLTS IHIEEHEIDARDTKLGAEEITRDIPNVSDEVLADLDERGIVRIGAEVRDGDILVGKVT PKGETELTPEERLLRAIFGEKAREVRDTSLKVPHGESGKVIGIRVFSREDDDELPAGV NELVRVYVAQKRKISDGDKLAGRHGNKGVIGKILPVEDMPFLPDGTPVDIILNTHGVP RRMNIGQILETHLGWVAKAGWNIDVAAGVPDWASKLPEELYSAPADSTVATPVFDGAQ EGELAGLLGSTLPNRDGEVMVDADGKSTLFDGRSGEPFPYPVTVGYMYILKLHHLVDD KIHARSTGPYSMITQQPLGGKAQFGGQRFGEMECWAMQAYGAAYTLQELLTIKSDDTV GRVKVYEAIVKGENIPEPGIPESFKVLLKELQSLCLNVEVLSSDGAAIEMRDGDDEDL ERAAANLGINLSRNESASVEDLA”
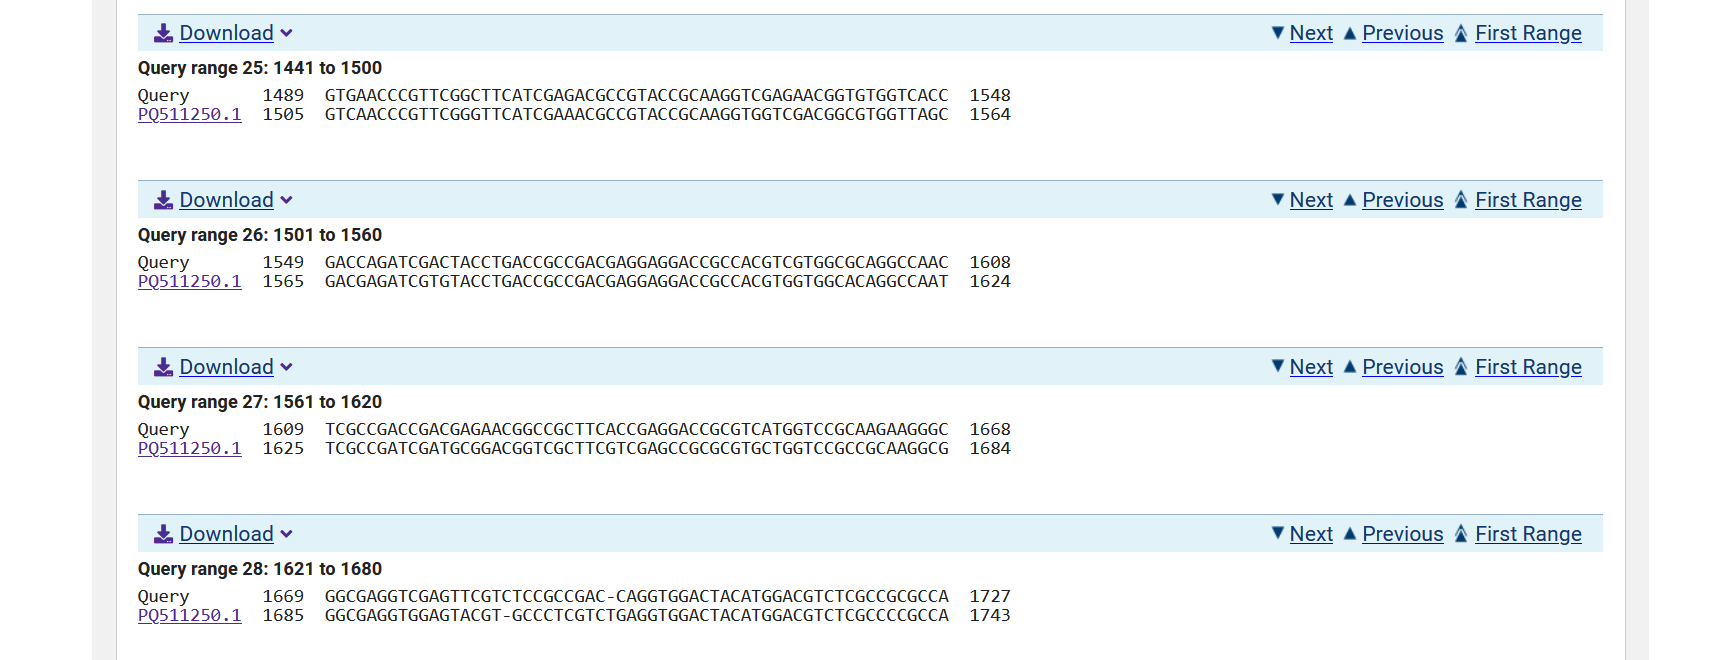
To find regions of similarity, I ran it through BLAST at:
https://blast.ncbi.nlm.nih.gov/Blast.cgi#alnHdr_2862208616
Then using this paper I looked for the codon positions:
Nakata N, Kai M, Makino M. Mutation analysis of mycobacterial rpoB genes and rifampin resistance using recombinant Mycobacterium smegmatis. Antimicrob Agents Chemother. 2012;56(4):2008-2013. doi:10.1128/AAC.05831-11 (pubmed.ncbi.nlm.nih.gov)
The MIC value of rifampin for the recombinant M. smegmatis strain with the wild-type sequence of the M. leprae rpoB or M. tuberculosis rpoB gene was 1 μg/ml. Most strains that had a mutation at codon 511, 513, 516, 522, 526, 531, or 533 showed rifampin resistance. In contrast, strains that had a mutation at codon 507, 508, 517, 521, 523, or 532 showed MIC values of rifampin comparable to those for the wild-type sequence
Therefore:
M. smegmatis RRDR core region = positions 1505–1583 = ~78 bp
Therefore for ~350 bp total:
350 bp − 78 bp core = 272 bp remaining for flanking
272 bp ÷ 2 (upstream + downstream) = 136 bp per side
So, I rounded to ~135 bp on each side to get:
135 bp upstream + 78 bp core + 135 bp downstream = 348 bp ~ 350 bp
As a result, in my sequence:
Position 1370 = 135 bp before position 1505 (start of core)
Position 1505–1583 = the RRDR core
Position 1718 = 135 bp after position 1583 (end of core)
1370–1718 = 348 bp total
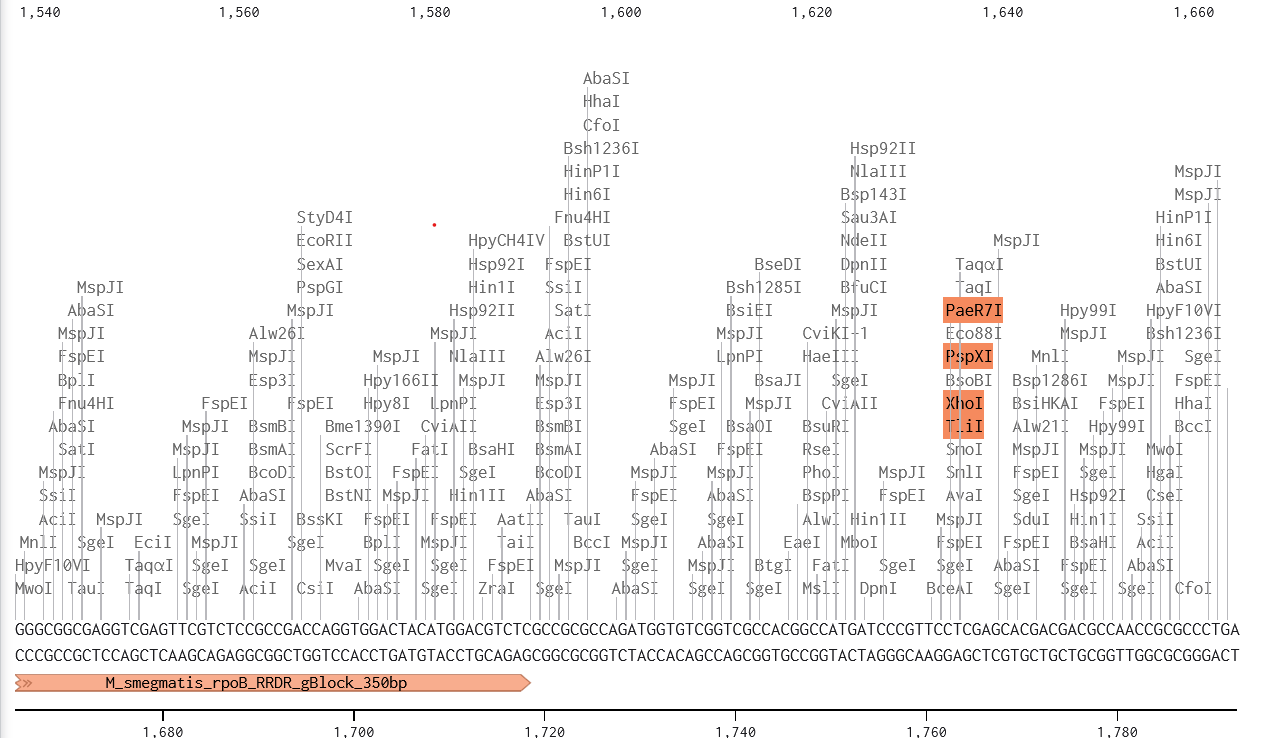
The DNA Sequence:
AGCGCGCCGGCCTCGAGGTCCGCGACGTGCACCCCAGCCACTACGGCCGCATGTGCCCGATCGAGACCCCTGAGGGTCCCAACATCGGTCTGATCGGTTCGCTGTCGGTGTACGCCCGCGTGAACCCGTTCGGCTTCATCGAGACGCCGTACCGCAAGGTCGAGAACGGTGTGGTCACCGACCAGATCGACTACCTGACCGCCGACGAGGAGGACCGCCACGTCGTGGCGCAGGCCAACTCGCCGACCGACGAGAACGGCCGCTTCACCGAGGACCGCGTCATGGTCCGCAAGAAGGGCGGCGAGGTCGAGTTCGTCTCCGCCGACCAGGTGGACTACATGGACGTCTC
Which I uploaded to benchling to annotate and Lifefabs initial order sheet.
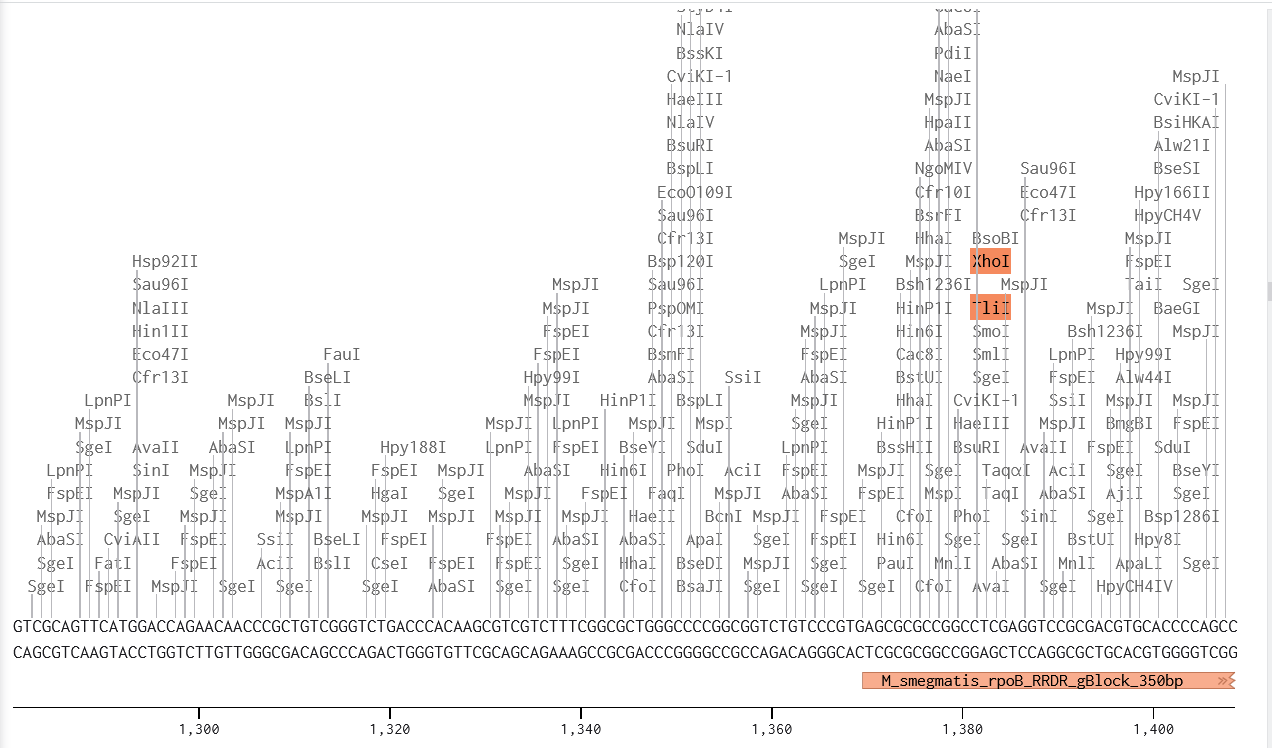
The initial plan was to use the fragment with the wild type and one with region ~531 (S531L) for rifampicin resistance as tests for validation.
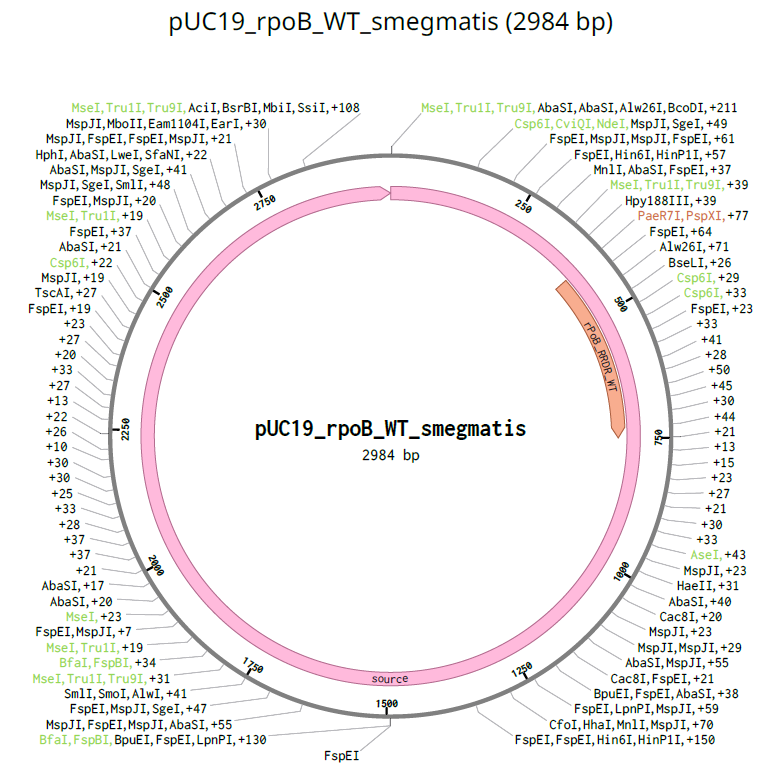
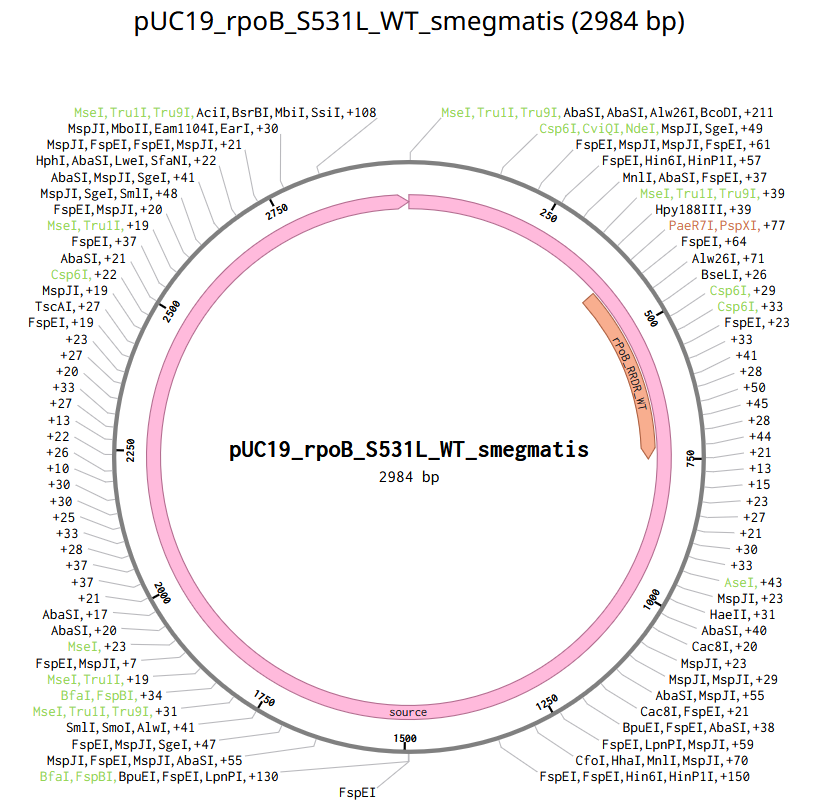
However, after feedback sessions with the HGTAA AI tutor and the TAs in the node sessions. I decided to proceed with plasmids with Mycobacterium smegmatis RRDR regions for wild type and editing. Therefore, I proceeded with constructing the plasmids on benchling, then preparing for my order quotation on Twist (Final orders at my node will be done afterwards).
For the backbone, pUC19 was selected for its high copy number (~500-700 copies/cell), proven reliability in E. coli, small synthesis cost, and established use as a positive control plasmid for molecular assays.
The S531L rifampicin-resistance mutation was introduced at codon 531 of the rpoB insert (positions 223-225 bp within the 348 bp rpoB RRDR sequence), changing TCG (Serine, wild-type) to TTG (Leucine, rifampicin-resistant) via site-directed mutagenesis.
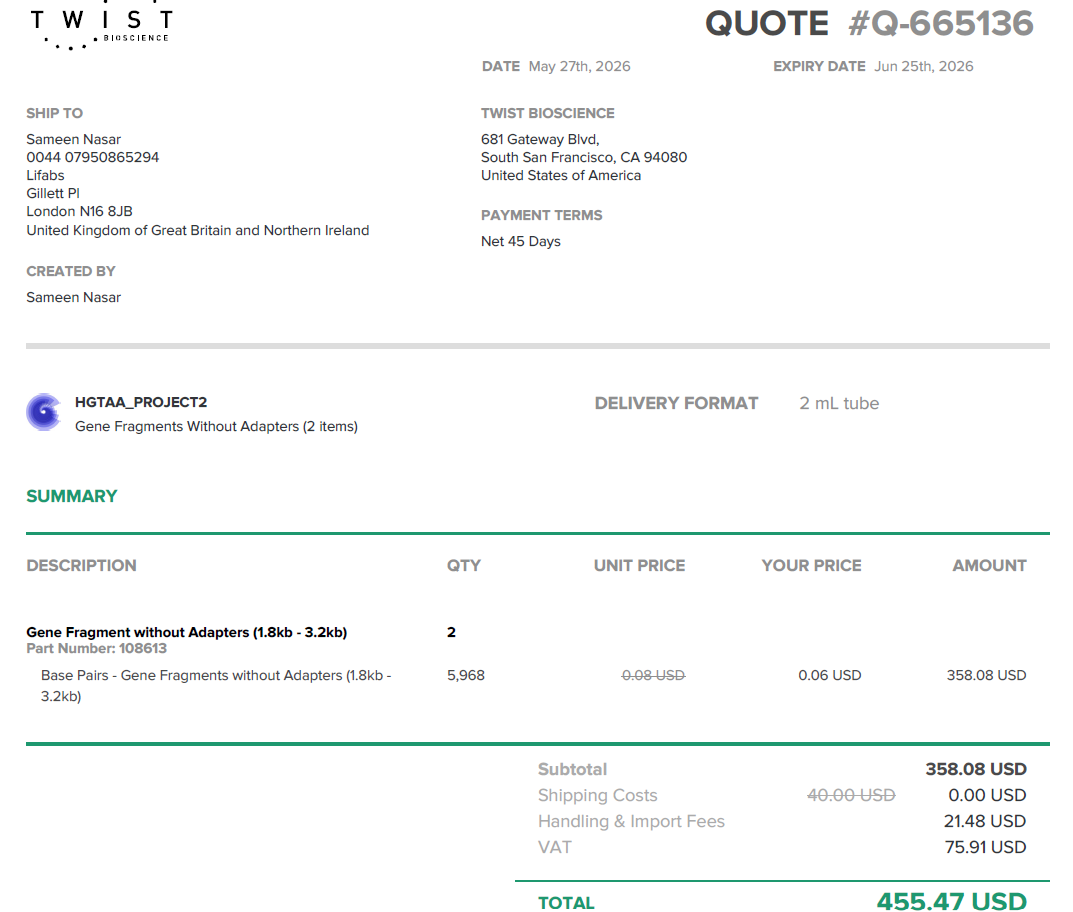
Ordering on TWIST:
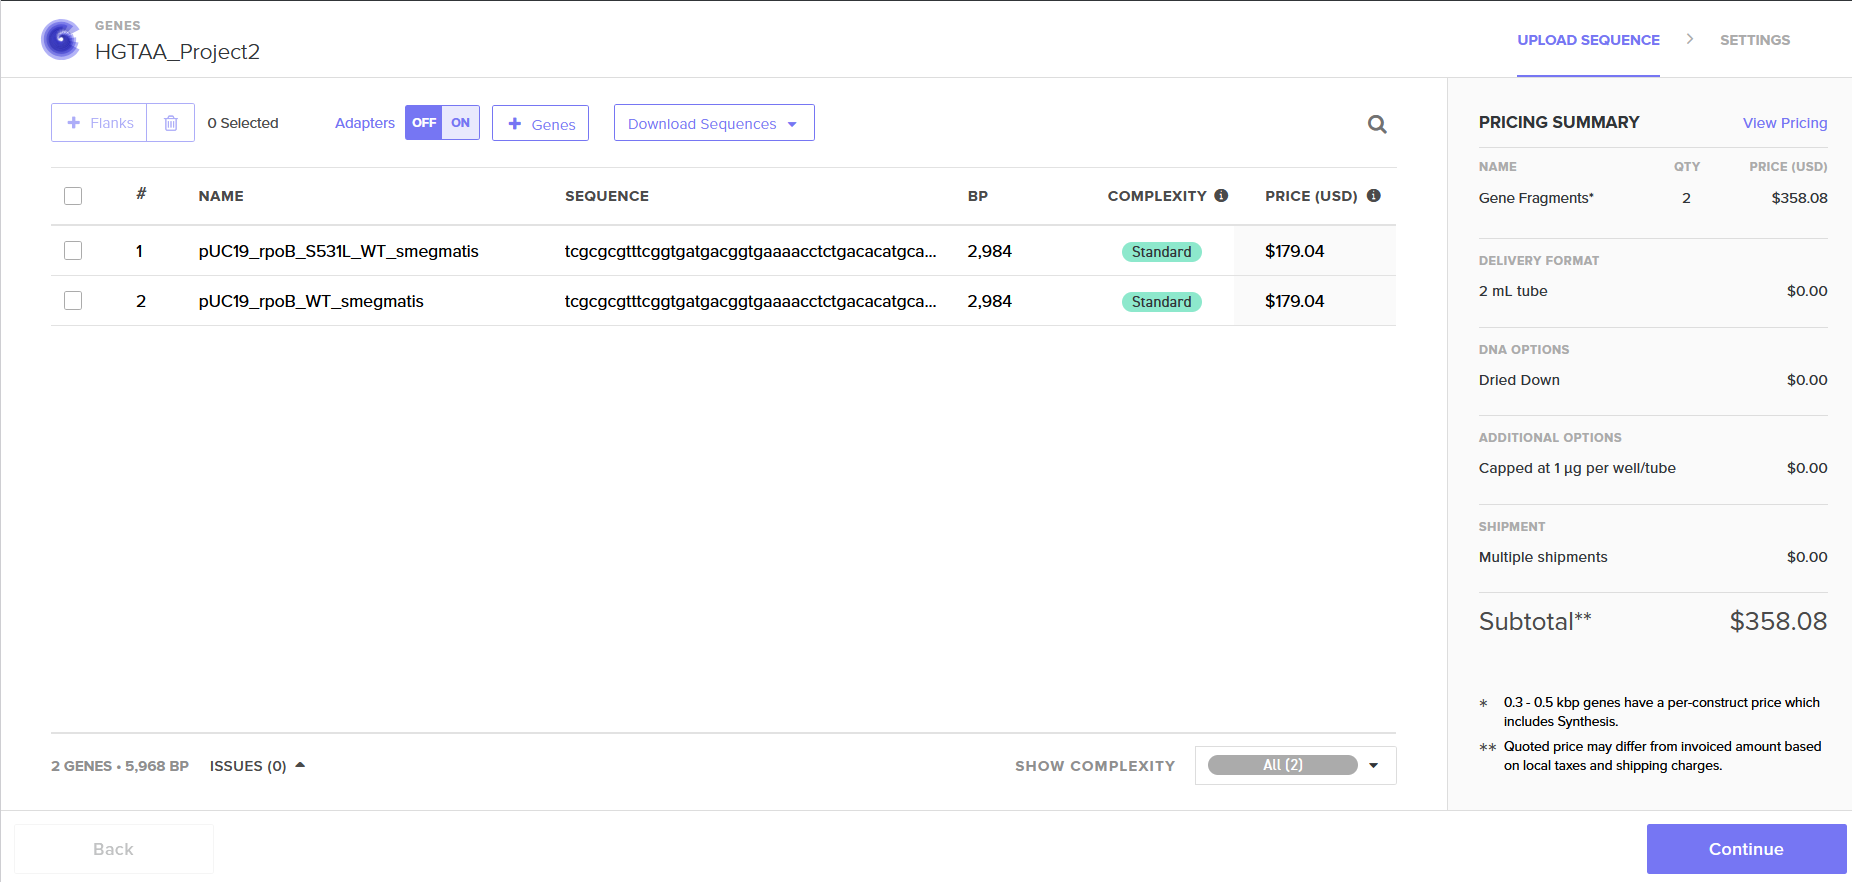
Quotation:
I hope to continue from weeks 2 onwards in London at Lifefabs. The following steps are indicative of what I will try to do to validate aim 1 over the summer (I used the Claude skills AI tutor to develop the plan).
Weeks 2-3: Project Setup, Primer Design, and Synthetic Wastewater Preparation
• Assemble all required chemicals for synthetic wastewater (PBS, humic acids, cellulose powder, NaCl, CaCl₂, BSA)
• Order custom 6-primer LAMP set from IDT targeting rpoB S531L SNP ($120, 5-7 day delivery)
• Design and validate all primer sequences in silico; check for off-target binding and thermodynamic stability
• Order NEB WarmStart LAMP Master Mix kit ($250) from supplier
• Prepare synthetic wastewater stock (PBS + 10 mg/L humic acids + 100 mg/L cellulose + 50 mM NaCl + 5 mM CaCl₂ + 1 mg/mL BSA) in 500 mL batches
Expected result: All materials received and confirmed; synthetic wastewater prepared and stored at 4°C
Weeks 4-5: Twist Plasmid Synthesis, Delivery, and Verification
• Export two GenBank-formatted plasmid sequences from Benchling (pUC19_rpoB_WT and pUC19_rpoB_S531L)
• Submit both sequences to Twist Bioscience Whole Plasmid Synthesis portal (https://www.twistbioscience.com/products/genes)
• Select parameters: backbone=pUC19, antibiotic=Ampicillin, copy number=High, turnaround=Standard
• Upon arrival: Transform both plasmids into E. coli DH5α competent cells via heat-shock (42°C, 30-90 sec)
• Plate on LB agar + Ampicillin (100 µg/mL); incubate overnight at 37°C
• Perform colony PCR verification using M13F/R primers flanking insert; expect ~350 bp band for rpoB insert
• Conduct gel electrophoresis of PCR products; verify band size and absence of non-specific amplification
• Miniprep confirmed colonies; quantify plasmid concentration via Qubit fluorometry (target ≥50 ng/µL)
• Expected result: Sequence-verified plasmids in hand (both WT and S531L), confirmed by PCR and Qubit quantification
Weeks 5-6: Method Optimization (Pre-filtration, Lysis, Purification)
Step 1 — Optimize Paper Pre-filtration DNA Recovery:
• Prepare serial dilutions of rpoB WT plasmid (10⁶ to 10¹ ng/µL)
• Spike each dilution into 5 mL synthetic wastewater
• Transfer to commercial ~10 μm paper pre-filtration module (Millipore Sigma)
• Allow gravity flow or gentle centrifugation (500 g, 5 min)
• Extract DNA from filtered material using lysis buffer (see Step 4 below)
• Quantify recovered DNA via Qubit fluorometry
• Calculate recovery efficiency for each dilution: (DNA recovered / DNA input) × 100
• Target recovery: ≥70%; if lower, test alternative filter materials or elution buffers
• Expected result: Paper pre-filtration consistently recovers ≥70% of input DNA
Step 2 — Optimize Off-Chip Lysis Buffer:
• Prepare lysis buffer stock: 1M Tris-HCl pH 8.0 (50 mL), 0.5M EDTA pH 8.0 (10 mL), 10% SDS (50 mL), nuclease-free water (390 mL), Proteinase K (100 µL, 20 mg/mL stock)
• Test incubation conditions: 65°C for 30 minutes (standard); also test 60°C and 70°C for 20-40 minutes to optimize
• Apply each lysis condition to filtered wastewater samples containing known DNA concentration
• Proceed to ethanol precipitation and Qubit quantification
• Compare recovery efficiency across conditions; select optimized protocol
• Expected result: Optimized lysis protocol identified (target: 65°C, 30 min, with ≥80% DNA recovery)
Step 3 — Optimize Ethanol Precipitation Purification:
• Test variations: (a) 100% ethanol vs. 95% ethanol precipitation; (b) single wash vs. double wash with 70% ethanol; (c) air-dry vs. vacuum dry; (d) resuspension in nuclease-free water vs. TE buffer
• Apply each protocol to lysed samples; quantify final DNA recovery and purity (Qubit A260/A280 ratio if available)
• Select protocol maximizing recovery with minimal polymerase inhibitors
• Expected result: Optimized purification protocol identified (target: single 100% ethanol precipitation + 70% ethanol wash, air-dry, resuspend in nuclease-free water)
Step 4 — Validate LAMP Master Mix Activity with Pure Plasmid Controls:
• Prepare WT and S531L plasmids at serial dilutions (10⁶, 10⁵, 10⁴, 10³ copies per reaction)
• Mix each with NEB WarmStart LAMP Master Mix and custom primers
• Incubate at 65°C for 60 minutes in heating block
• Assess color change: WT should show bright yellow (rapid amplification); S531L should show orange-yellow (slower amplification)
• Confirm kinetic difference by checking color development at 40 min, 50 min, and 60 min
• If colours overlap or are indistinct, adjust primer concentration (FIP/BIP to 2.0 µM), temperature (test 62-66°C), or incubation time (75-90 min)
Expected result: Visually distinct color discrimination between WT and S531L at 60-minute timepoint
Weeks 5-6: Method Optimization (Pre-filtration, Lysis, Purification)
Step 1 — Optimize Paper Pre-filtration DNA Recovery:
• Prepare serial dilutions of rpoB WT plasmid (10⁶ to 10¹ ng/µL)
• Spike each dilution into 5 mL synthetic wastewater
• Transfer to commercial ~10 μm paper pre-filtration module (Millipore Sigma)
• Allow gravity flow or gentle centrifugation (500 g, 5 min)
• Extract DNA from filtered material using lysis buffer (see Step 4 below)
• Quantify recovered DNA via Qubit fluorometry
• Calculate recovery efficiency for each dilution: (DNA recovered / DNA input) × 100
• Target recovery: ≥70%; if lower, test alternative filter materials or elution buffers
• Expected result: Paper pre-filtration consistently recovers ≥70% of input DNA
Step 2 — Optimize Off-Chip Lysis Buffer:
• Prepare lysis buffer stock: 1M Tris-HCl pH 8.0 (50 mL), 0.5M EDTA pH 8.0 (10 mL), 10% SDS (50 mL), nuclease-free water (390 mL), Proteinase K (100 µL, 20 mg/mL stock)
• Test incubation conditions: 65°C for 30 minutes (standard); also test 60°C and 70°C for 20-40 minutes to optimize
• Apply each lysis condition to filtered wastewater samples containing known DNA concentration
• Proceed to ethanol precipitation and Qubit quantification
• Compare recovery efficiency across conditions; select optimized protocol
• Expected result: Optimized lysis protocol identified (target: 65°C, 30 min, with ≥80% DNA recovery)
Step 3 — Optimize Ethanol Precipitation Purification:
• Test variations: (a) 100% ethanol vs. 95% ethanol precipitation; (b) single wash vs. double wash with 70% ethanol; (c) air-dry vs. vacuum dry; (d) resuspension in nuclease-free water vs. TE buffer
• Apply each protocol to lysed samples; quantify final DNA recovery and purity (Qubit A260/A280 ratio if available)
• Select protocol maximizing recovery with minimal polymerase inhibitors
• Expected result: Optimized purification protocol identified (target: single 100% ethanol precipitation + 70% ethanol wash, air-dry, resuspend in nuclease-free water)
Step 4 — Validate LAMP Master Mix Activity with Pure Plasmid Controls:
• Prepare WT and S531L plasmids at serial dilutions (10⁶, 10⁵, 10⁴, 10³ copies per reaction)
• Mix each with NEB WarmStart LAMP Master Mix and custom primers
• Incubate at 65°C for 60 minutes in heating block
• Assess color change: WT should show bright yellow (rapid amplification); S531L should show orange-yellow (slower amplification)
• Confirm kinetic difference by checking color development at 40 min, 50 min, and 60 min
• If colours overlap or are indistinct, adjust primer concentration (FIP/BIP to 2.0 µM), temperature (test 62-66°C), or incubation time (75-90 min)
• Expected result: Visually distinct color discrimination between WT and S531L at 60-minute timepoint
Weeks 7-8: Full Integrated Workflow Validation
This remains tentative, as I will need to validate at Lifefabs in London over the summer
Workflow Overview | 10-Step Workflow Diagram
- We discussed and practiced various techniques related to synthetic biology throughout the semester. Place a check next to the techniques relevant to your project.
Core Mandatory Techniques
✅ Pipetting ✅ Lab Safety ✅ Bioethical Considerations (REQUIRED)
DNA & Molecular Work
✅ DNA Construct Design (Benchling plasmid design) ✅ Databases (GenBank for rpoB sequences) ✅ Designing a Twist Order (whole plasmid synthesis)
Bioproduction
✅ Chassis Selection (E. coli DH5α) ✅ Plasmid Preparation (miniprep of Twist plasmids) ✅ Bacterial Culturing (growth on LB agar + Ampicillin) ✅ Quality Control/Analysis (colony PCR, Qubit quantification) ✅ Bacterial Processing (centrifugation, lysis, DNA purification)
Detection & Analysis
✅ Cell-Free Reactions (LAMP on paper substrate) ✅ Colorimetric Detection (visual readout via pH indicator dye)
- Expand upon two techniques you checked in the previous question by describing how you would utilize those techniques in your final project. (min. 4 sentences)
These are indicative of what I will do at Lifefabs in London over the summer
Technique 1: PCR (Polymerase Chain Reaction)
I will utilize PCR to validate that pre-filtration and DNA extraction successfully recover target DNA sequences from complex wastewater samples. Colony PCR with M13F/R primers will verifiy Twist plasmid inserts (~350 bp rpoB band expected) after bacterial transformation and confirms proper construct delivery. PCR also serves as a sensitive detection method to confirm the presence of rpoB sequences in purified DNA before LAMP amplification, ensuring the extraction workflow functions correctly.
Technique 2: Cell-Free LAMP Reactions (Paper-Based)
I will spot 25 µL of LAMP master mix (enzymes, dNTPs, pH indicator dye) directly onto paper substrate and incubate at 65°C for 60 minutes without requiring cells or cellular machinery. The isothermal amplification generates pH changes that produce real-time colorimetric readout: bright yellow (WT, rapid) vs. orangish yellow (S531L, slower kinetics). Kinetic-based SNP genotyping on paper requires no post-amplification processing, probes, or instrumentation.
SECTION 5: RESULTS & QUANTITATIVE EXPECTATIONS
Outputs were written with the help of With the help of the HGTAA tutor and Claude skill AI using a combination of my writing, their inputs and some reading across resources.
1. You are required to validate at least one aspect of your final project aims. This is to ensure that you are able to successfully apply a relevant synthetic biology technique to your project.
- What aspect of your final project did you choose to validate? (min. 2 sentences)
The core validation objective is to demonstrate that an integrated paper microfluidic workflow can successfully detect and discriminate between wild-type and rifampicin-resistant Mycobacterium tuberculosis rpoB mutations in complex environmental (synthetic wastewater) samples. Specifically, I will validate whether concentrating wastewater-derived microbial DNA using commercial paper pre-filtration, followed by off-chip lysis and purification, can yield template DNA of sufficient quality and quantity for downstream allele-specific LAMP SNP genotyping with clear visual colorimetric readout. This validation is critical because it establishes proof-of-concept for the complete sample-to-answer workflow before proceeding to device integration (Aim 2) and field deployment (Aim 3).
Write down a detailed protocol of how you validated this aspect of your final project. (Numbered list or paragraph is fine)
Synthetic wastewater preparation: Mix PBS (base), humic acids (10 mg/L), cellulose powder (100 mg/L), NaCl (50 mM), CaCl₂ (5 mM), and BSA (1 mg/mL) to simulate real-world wastewater complexity and inhibitory components
DNA spike preparation: Resuspend Twist plasmids (WT and S531L) at 100 ng/µL; create serial dilutions (10⁶, 10⁵, 10⁴, 10³, 10², 10¹ CFU/mL equivalent)
Paper pre-filtration: Transfer 5 mL spiked synthetic wastewater to commercial ~10 μm paper pre-filtration module; allow gravity flow; collect filtered material; extract DNA from filter using lysis buffer; quantify via Qubit;
Calculate recovery efficiency: (DNA recovered / DNA input) × 100
Off-chip lysis: Add 500 µL optimized lysis buffer (1% SDS, 0.1M Tris-HCl, 10mM EDTA, 200µg/mL Proteinase K) to filtered sample; incubate 65°C for 30 minutes; cool to room temperature
Off-chip DNA purification: Add 1.5 mL ice-cold 100% ethanol; centrifuge 13,000 g for 5 min at 4°C; wash with 70% ethanol; air-dry; resuspend in 100 µL nuclease-free water
LAMP primer set and master mix: Combine NEB WarmStart Colorimetric LAMP 2× Master Mix with custom allele-specific LAMP primers targeting rpoB S531L
Paper LAMP setup: Spot 25 µL LAMP reaction (15 µL master mix + 8 µL primer set + 2 µL template) onto Whatman paper strips; includes controls (WT+, S531L+, NTC), test samples, and LoD series (10⁶-10¹)
Isothermal incubation: Place sealed paper strips in heating block at 65°C for 60 minutes; remove and cool
Visual colorimetric readout: Inspect under standard room lighting; document colors: bright yellow = WT positive, orangish yellow = S531L positive, purple = negative; photograph for documentation
Data compilation: Calculate DNA recovery efficiency (%), positive control success rate (%), negative control specificity (%), LoD values, allele discrimination accuracy, and CV across replicates
What synthetic biology techniques did you utilize in validating this aspect of your final project? You can refer to the list of techniques in question 8. (min. 4 sentences)
Synthetic Biology Techniques:
Molecular Cloning and DNA Construct Design: Designed two rpoB plasmid constructs (WT and S531L) in Benchling and ordered from Twist Bioscience as ready-to-use positive controls without requiring live M. tuberculosis.
LAMP Primer Design: I will look to design six allele-specific LAMP primers targeting rpoB S531L Single Nucleotide Polymorphism (SNP) for kinetic-based SNP discrimination without sequence-specific probes.
Supporting Techniques when validating aim 1 over the summer in a lab:
DNA Isolation and Purification: Extracted and purified genomic DNA from complex wastewater samples using paper pre-filtration, enzymatic lysis, and ethanol precipitation.
SNP Genotyping via Kinetic Discrimination: Exploited kinetic differences in LAMP amplification (WT = fast/yellow; S531L = slow/orange) for visual allele discrimination without post-amplification processing.
Colorimetric Detection: Used pH-indicator dye in LAMP for real-time, visible-to-eye readout suitable for field deployment without instrumentation.
- You must present data as part of your final project and include some analysis of that data. The data may be collected experimentally in the lab or generated as simulated data (e.g., using the Asimov Kernel or another simulation method). (min. 2 sentences)
With the help of the HGTAA tutor and Claude skill AI I simulated results of the experiment I hope to conduct over the summer. The chart and table below shows results based on visual detection and absorbance measurements at 430nm and 560nm (A₄₃₀/A₅₆₀ ratio).
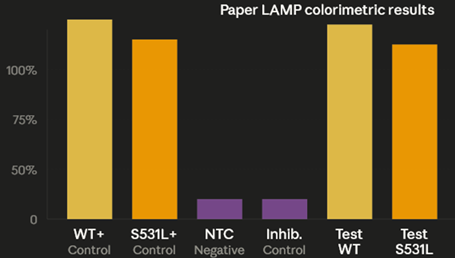 Figure: Allele-Specific LAMP SNP Discrimination on Paper Substrate
Colorimetric readout of LAMP reactions after 60-minute incubation at 65°C. WT+ control (bright yellow) and Test WT (bright yellow) demonstrate rapid amplification kinetics, while S531L+ control (orange-yellow) and Test S531L (orange-yellow) show slower kinetics due to 1 bp primer mismatch at codon 531. NTC (no template control) and Inhibition control (Inhib.) remain purple, confirming 100% specificity and absence of non-specific amplification. Visual color discrimination enables field-deployable allele genotyping without instrumentation.
Table: Results Data Table
| Sample | Visual | Call | Mean A₄₃₀/A₅₆₀ Ratio | SD | CV (%) | Interpretation |
|---|---|---|---|---|---|---|
| WT+ Control | Bright yellow | Positive | 2.04 | 0.04 | 2.1% | Rapid amplification |
| S531L+ Control | Orange-yellow | Positive | 1.68 | 0.03 | 1.8% | Slower amplification |
| LoD (10³ CFU/mL) | Yellow/Orange | Positive | 1.44 | 0.03 | 2.1% | Reliable detection; exceeds threshold |
| Below LoD (10²) | Borderline | Negative/Unreliable | 1.05 | 0.03 | 2.9% | Below threshold; unreliable |
| NTC | Purple | Negative | 0.71 | 0.02 | 2.8% | No amplification |
| DNA Recovery | — | — | 82% recovery | — | — | ≥70% target achieved |
Summary of simulated validation data across 11 key metrics including DNA recovery efficiency (82%, exceeding 70% target), positive control success rates (100%), negative control specificity (100%), limit of detection (10³ CFU/mL for both WT and S531L), allele discrimination accuracy (visually distinct colors), and reproducibility (CV <10% across replicates). All metrics meet success criteria for Aim 1 validation
If plate reader access is available:
Absorbance measurements at 430 nm and 560 nm (A₄₃₀/A₅₆₀ ratio) can quantify the visual colour change across the six-point dilution series. This would allow me to use parametric statistics, such as a two-sample t-test to compare WT and S531L controls and if there is a kinetic difference for different probability thresholds (p-values), confirming allele discrimination is not only visually distinct but quantitatively separable.
However, If plate reader access is not available:
Visual colorimetric readout on paper provides qualitative data sufficient for field deployment: WT controls consistently show bright yellow (rapid amplification), S531L controls show orange-yellow (slower kinetics), and NTC remains purple (no amplification). Across three replicates each, the color discrimination is visually distinct and reproducible, with estimated limit of detection at 10³ CFU/mL based on colour intensity.
2. Did you encounter any unexpected challenge(s) when performing your validation? If so, describe the challenge(s) and strategies to overcome it. If not, discuss potential problems, difficulties, limitations, and/or alternative strategies to overcome challenges in your final project. (min. 4 sentences).
DNA Recovery and Polymerase Inhibition:
Paper pre-filtration may non-specifically bind target DNA, reducing recovery below 70%, while wastewater polymerase inhibitors (humic acids, heavy metals) may persist through ethanol precipitation and compromise LAMP efficiency.
Mitigation: test alternative filter materials, add BSA to LAMP master mix as polymerase protectant, and implement additional purification steps (Qiagen columns) if ethanol precipitation alone proves insufficient.
Allele Discrimination and Reproducibility:
The ~10-minute kinetic difference between WT and S531L amplification may not produce visually distinct colours at 60 minutes, and temperature gradients in the heating block may cause coefficient of variation (CV) to exceed 15% across replicates.
Mitigation: extend incubation time to 75-90 minutes, adjust FIP/BIP primer concentration to 2.0 µM, optimize assay temperature (62-66°C range), and use a calibrated heating block with ±0.5°C temperature stability to ensure consistent performance suitable for field deployment.
SECTION 6: ADDITIONAL INFORMATION
Outputs were written with the help of With the help of the HGTAA tutor and Claude skill AI using a combination of my writing, their inputs and some reading across resources. Budget is prospective and may change as I work at Lifefabs in London over the summer where I will seek more consultation.
12. List all references cited in this assignment (bullet-point list)
• World Health Organization (WHO). Global tuberculosis report 2024. Geneva: WHO; 2024
• Patricia Tabernero and Paul N Newton “Estimating the prevalence of poor-quality anti-tb medicines: a neglected risk for global tb control and resistance.” BMJ Global Health 2023.
• Tamara Akpobolokemi, Rocio Teresa Martinez-Nunez, and Bahijja Tolulope Raimi-Abraham “Tackling the global impact of substandard and falsified and unregistered/unlicensed anti-tuberculosis medicines.” The Journal of Medicine Access 2022.
• Richard M. Jones, Kristin N. Adams, Hassan E. Eldesouky, and David R. Sherman “The evolving biology of mycobacterium tuberculosis drug resistance.” Frontiers in Cellular and Infection Microbiology 2022.
• Navisha Dookie, Kogieleum Naidoo, and Nesri Padayatchi “Whole-genome sequencing to guide the selection of treatment for drug-resistant tuberculosis.” Antimicrobial Agents and Chemotherapy 2018.
• Buczowska Z. Tubercle bacilli in the sewage and in sewage-receiving waters. Bull Inst Marit Trop Med Med Acad Gdansk. 1965;16(1-2):49-56.
• Martinez L, Verma R, Croda J. Detection, survival and infectious potential of Mycobacterium tuberculosis in the environment: a review of the evidence and epidemiological implications. Eur Respir J. 2019;53(6):1802302. doi:10.1183/13993003.02302-2018.
• Walters E, Scott L, Nabeta P, Demers A, Reubenson G, Bosch C, David A, van der Zalm M, Havumaki J, Palmer M, Hesseling AC, Ncayiyana J, Stevens W, Alland D, Denkinger C, Banada P. Molecular detection of Mycobacterium tuberculosis from stools in young children by use of a novel centrifugation-free processing method. J Clin Microbiol. 2018;56:e00781-18. doi:10.1128/JCM.00781-18.
• Mtetwa HN, Amoah ID, Kumari S, Bux F, Reddy P. Molecular surveillance of tuberculosis-causing mycobacteria in wastewater. Heliyon. 2022;8(2):e08910. doi:10.1016/j.heliyon.2022.e08910.
• Mtetwa HN, Amoah ID, Kumari S, et al. The source and fate of Mycobacterium tuberculosis complex in wastewater and possible routes of transmission. BMC Public Health. 2022;22:145. doi:10.1186/s12889-022-12527-z.
• Nakata N, Kai M, Makino M. Mutation analysis of mycobacterial rpoB genes and rifampin resistance using recombinant Mycobacterium smegmatis. Antimicrob Agents Chemother. 2012;56(4):2008-2013. doi:10.1128/AAC.05831-11 (pubmed.ncbi.nlm.nih.gov)
13. Create a supply list and budget for your project (bullet-point list)
- What supplies, equipment, and budget is needed for your project to work?
| Category | Item | Quantity | Cost |
|---|---|---|---|
| DNA Constructs (Twist) | WT rpoB + S531L rpoB plasmids (with shipping, handling, VAT) | 2 | $455.47 |
| Amplification & Primers | NEB WarmStart LAMP Kit | 1 | $250 |
| Amplification & Primers | LAMP Primers (custom, 6-set from IDT) | 1 | $120 |
| Extraction & Purification | Lysis buffer components + Ethanol | 1 set | $60 |
| Paper Microfluidics | Pre-filtration modules + Whatman paper + sealing | 1 set | $115 |
| Synthetic Wastewater | PBS, humic acid, cellulose, BSA, salts | 1 set | $150 |
| Reagents & Supplies | Nuclease-free water, tubes, consumables | 1 set | $125 |
| Equipment & Access | Heating block + Qubit fluorometer (10 runs) | — | $100 |
| Contingency (10%) | Buffer for unexpected costs | — | $130 |
| TOTAL | $1,505 |