Week 6 HW: Genetic Circuits I: Assembly Technologies
1. Components in Phusion High-Fidelity PCR Master Mix and Their Purpose
One of the main enzymes used is Phusion High-Fidelity DNA Polymerase, a DNA polymerase with an extremely low error rate (high fidelity), making it ideal for mutagenesis and cloning experiments. The main components in Phusion High-Fidelity PCR Master Mix and their functions are:
| Components | Function |
|---|---|
| Phusion DNA Polymerase | Enzyme that synthesizes new DNA from primers during the extension phase. It has proofreading activity (3’→5’ exonuclease), resulting in very low replication errors. |
| dNTPs (dATP, dTTP, dGTP, dCTP) | Substrates or “building blocks” used by the polymerase to form the new DNA strand. |
| Reaction Buffer | Provides optimal chemical conditions (pH, salts, enzyme stability) for polymerase activity. |
| Mg²⁺ ions (MgCl₂) | Essential cofactor required by DNA polymerase to catalyze phosphodiester bond formation between nucleotides. |
| Stabilizing agents | Maintain enzyme stability during PCR. |
The master mix is typically at 2X concentration, so only primers, template DNA, and water need to be added.
2. Factors That Determine Primer Annealing Temperature
Annealing temperature determines how well primers bind to the DNA template. Factors influencing annealing temperature:
• Primer melting temperature (Tm): Annealing is usually 2–5°C lower than the primer Tm.
• Primer length: Longer primers typically have a higher Tm.
• GC content: G-C bonds have three hydrogen bonds, increasing stability and Tm.
• Primer-template complementarity: Mismatches reduce stability and Tm.
• Salt concentration in buffer: Ion concentration affects DNA duplex stability.
• Secondary structures in primers: Hairpins or dimers can disrupt proper annealing.
Too low an annealing temperature causes non-specific amplification, while too high prevents primer binding.
3. Comparison: PCR vs Restriction Enzyme Digestion
| Feature | PCR | Restriction Enzyme Digestion |
|---|---|---|
| Principle | DNA amplification using DNA polymerase | DNA cutting using restriction enzymes |
| Product | New DNA fragments from synthesis | DNA fragments from cutting existing DNA |
| Specificity | Determined by primers | Determined by enzyme recognition site |
| Time | Usually 1–2 hours | 30–60 minutes |
| Flexibility | Highly flexible (add mutations, overhangs, tags) | Limited to restriction site locations |
| When to use? | PCR preferred if: wanting to amplify DNA, introduce mutations, add new sequences, or no restriction sites available | Restriction digestion preferred if: precise plasmid cutting, traditional cloning with sticky ends, no mutations needed |
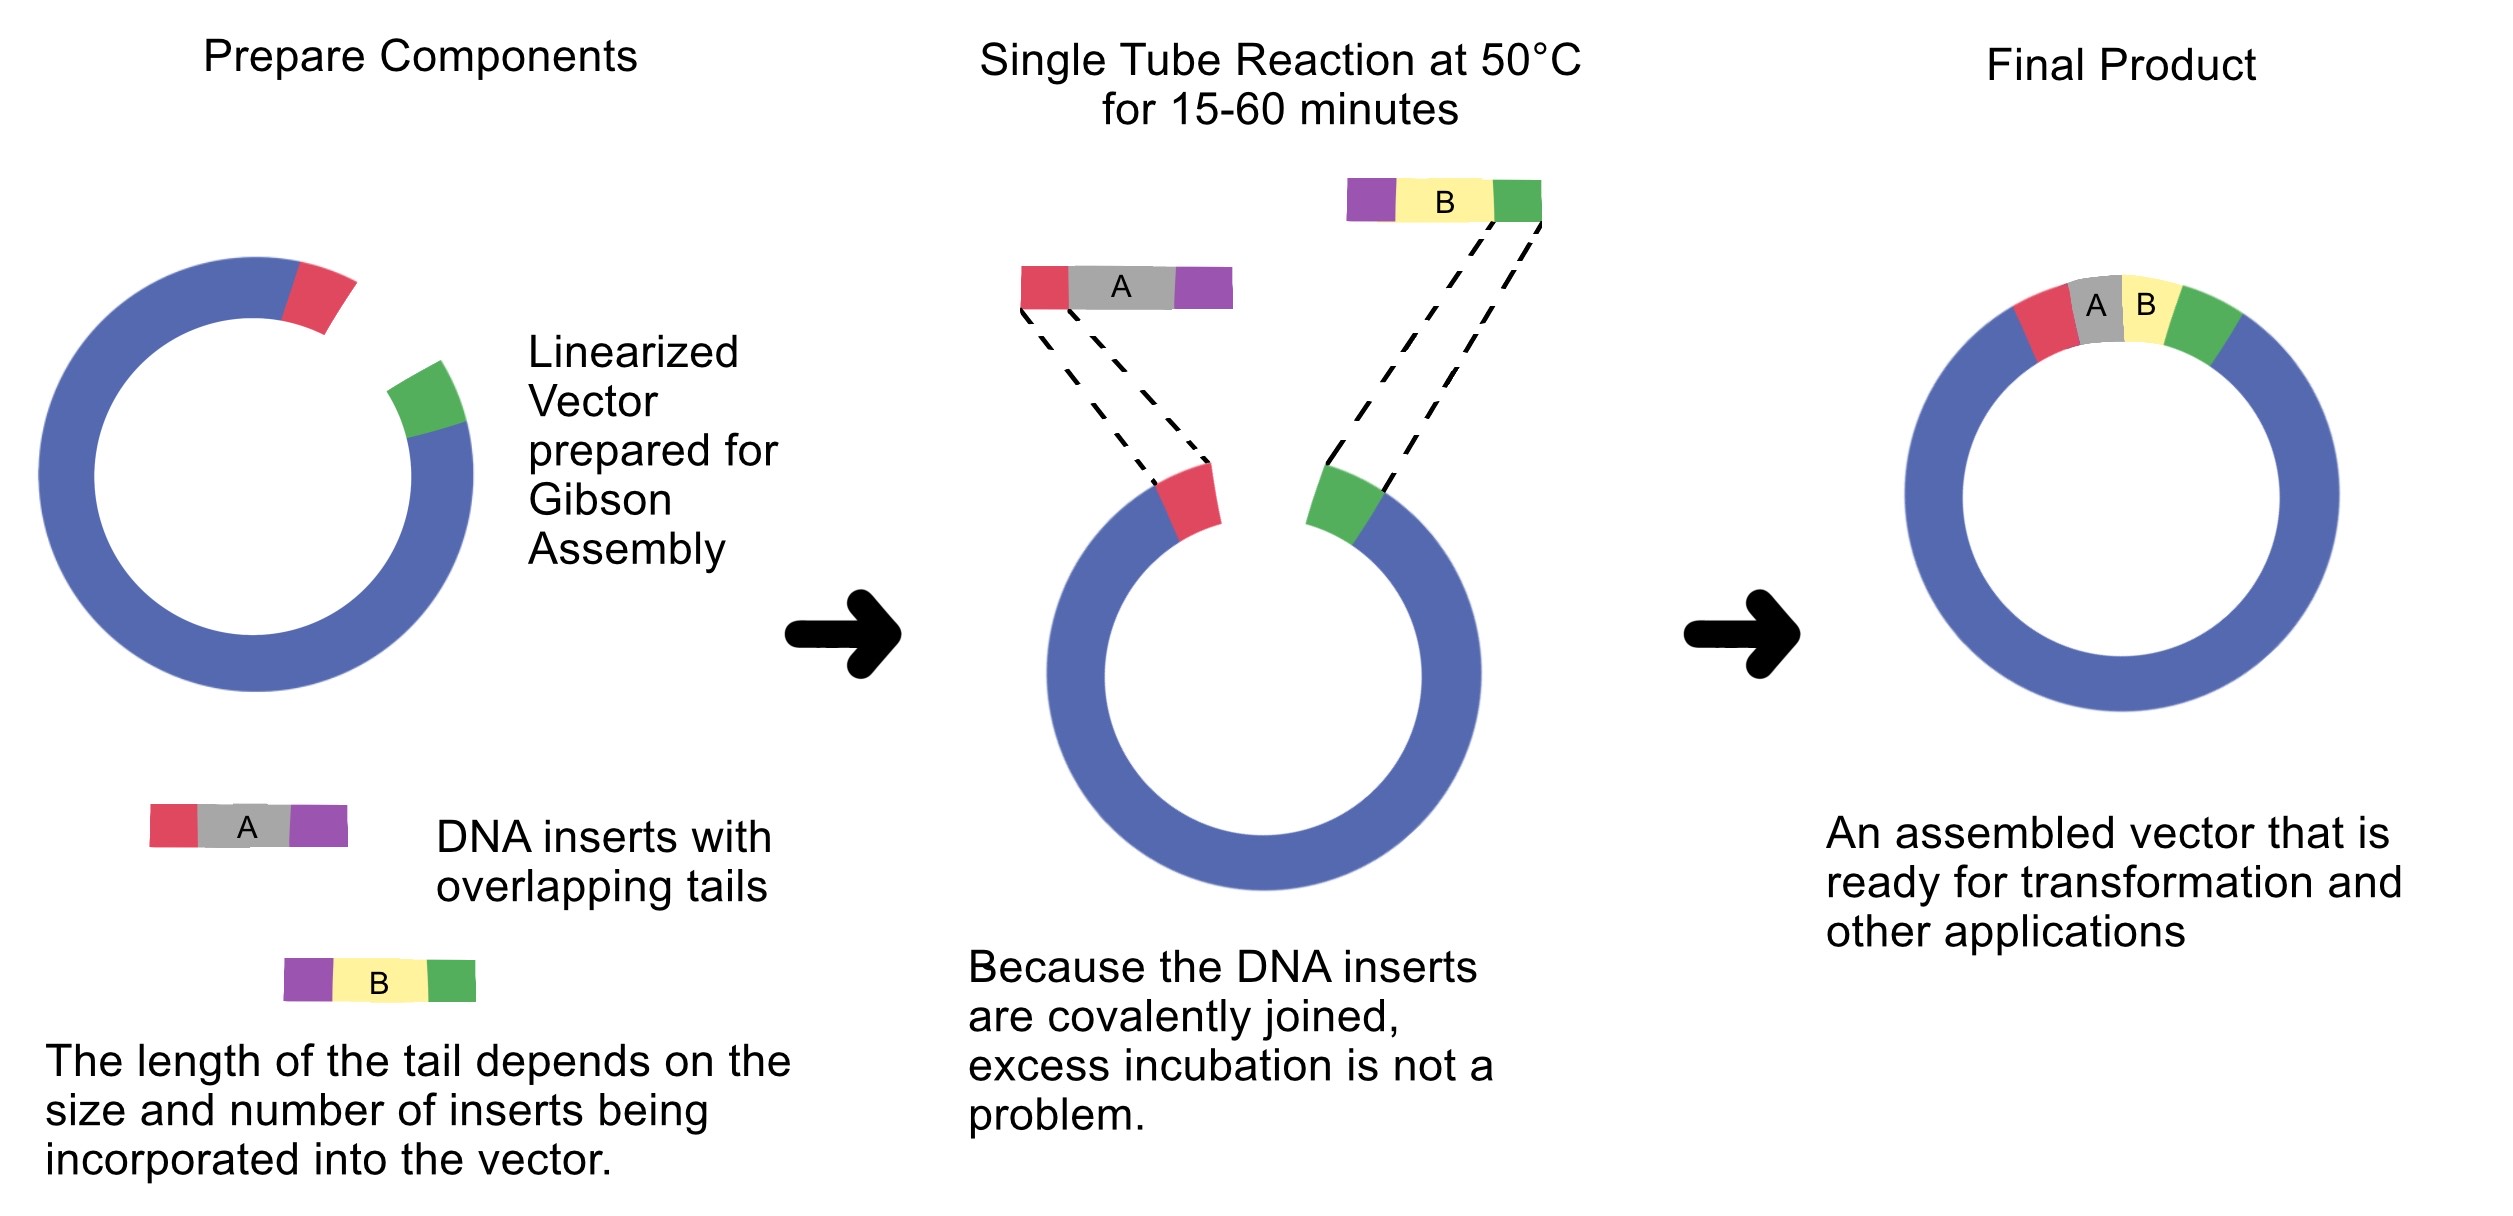
4. Ensuring DNA Fragments Are Suitable for Gibson Assembly
Gibson Assembly requires DNA fragments with homologous overlap sequences.
To ensure PCR or digested fragments are suitable for Gibson cloning:
• Design overlap sequences (20–40 bp) in primers.
• Ensure correct fragment orientation (5’ → 3’).
• Use design software like Benchling to verify overlaps.
• Confirm no unwanted mutations in overlaps.
• Verify fragment size via gel electrophoresis.
• Measure DNA concentration for proper insert:vector molar ratio (usually 2:1).
Overlap sequences enable the exonuclease in Gibson Assembly to generate single-stranded ends that can anneal to each other.
5. How Plasmid DNA Enters E. coli During Transformation
Plasmid DNA is introduced into Escherichia coli bacteria via heat-shock transformation. The process:
Bacterial cells are made competent, usually with CaCl₂ treatment.
Plasmid DNA is mixed with competent cells at cold temperature (0–4°C).
Heat shock at 42°C for ~45 seconds alters membrane permeability.
Temporary pores form in the cell membrane.
Plasmid DNA enters the cell via diffusion.
Cells recover in nutrient media (SOC) before antibiotic selection.
Only bacteria carrying the plasmid with antibiotic resistance genes will grow.
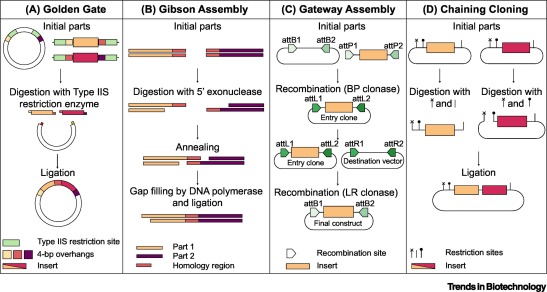
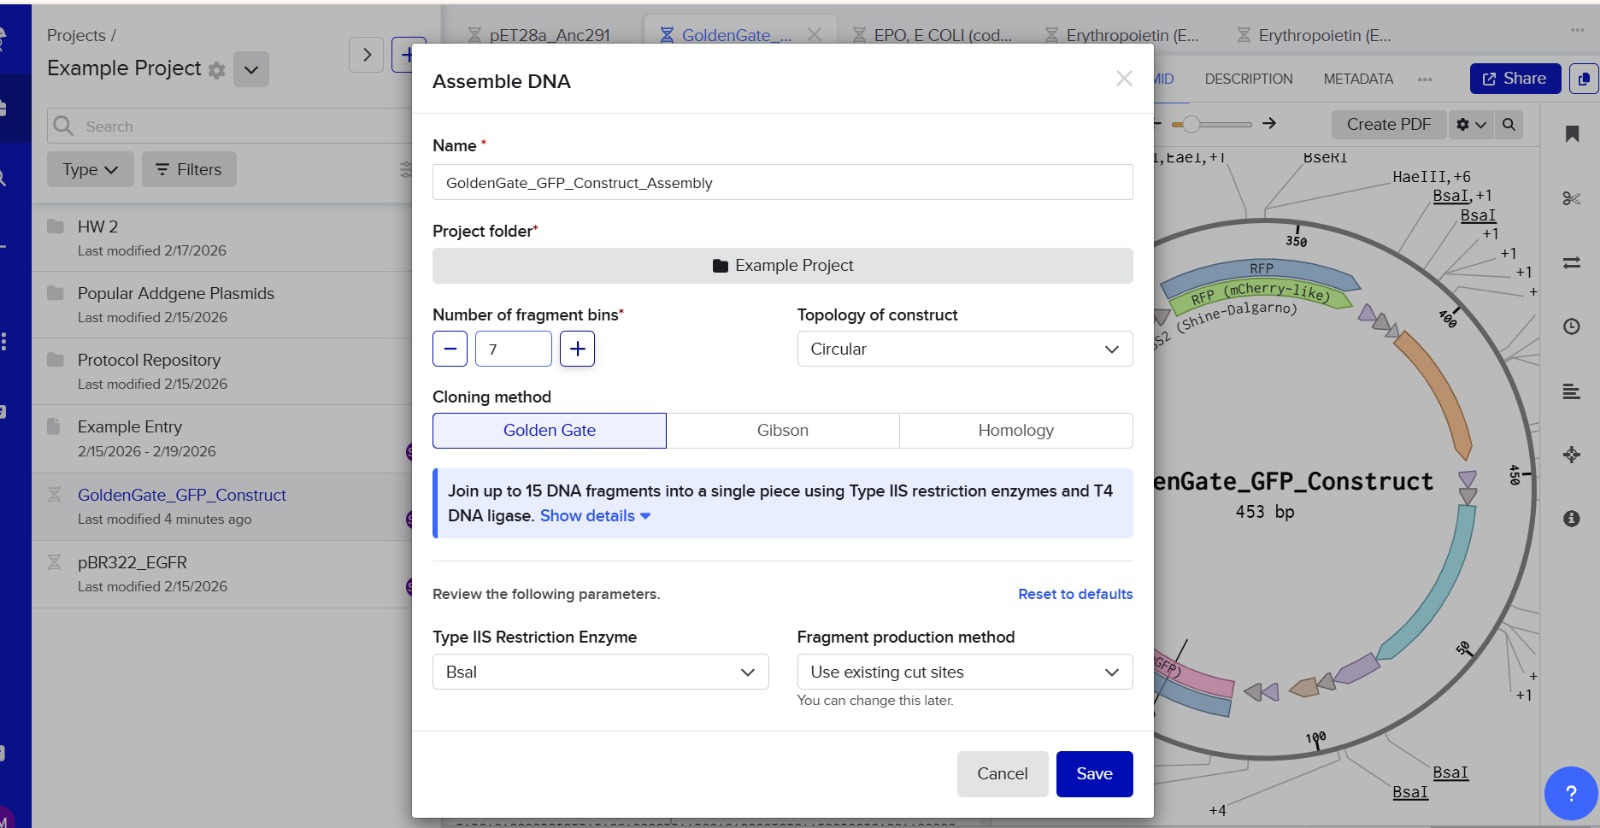
6. Another Assembly Method: Golden Gate Assembly
Golden Gate Assembly is a cloning technique that allows multiple DNA fragments to be joined in a single reaction. It uses Type IIS restriction enzymes that cut DNA outside their recognition sites, producing designer-specific overhangs. DNA fragments and vector plasmids are cut by these enzymes and then ligated by DNA ligase in a cyclic reaction alternating between cutting and ligation temperatures. Since the restriction sites are lost after ligation, assembled fragments are not recut. This enables directional assembly of multiple DNA fragments in one reaction. The method is highly popular in synthetic biology for efficiently constructing multigene assemblies. Golden Gate is often used for metabolic pathway construction or gene libraries.
Diagram of Golden Gate Assembly
Step 1: Restriction digestion
Fragment A Fragment B Fragment C
| BsaI | | BsaI | | BsaI |
Step 2: Custom overhangs created
A —-ATGC
B —-ATGC
C —-ATGC
Step 3: Ligation
A + B + C → assembled plasmid
simple concept:
DNA Fragment 1 + DNA Fragment 2
↓ BsaI digestion
Sticky overhangs created
   ↓ DNA ligase

   Joined plasmid
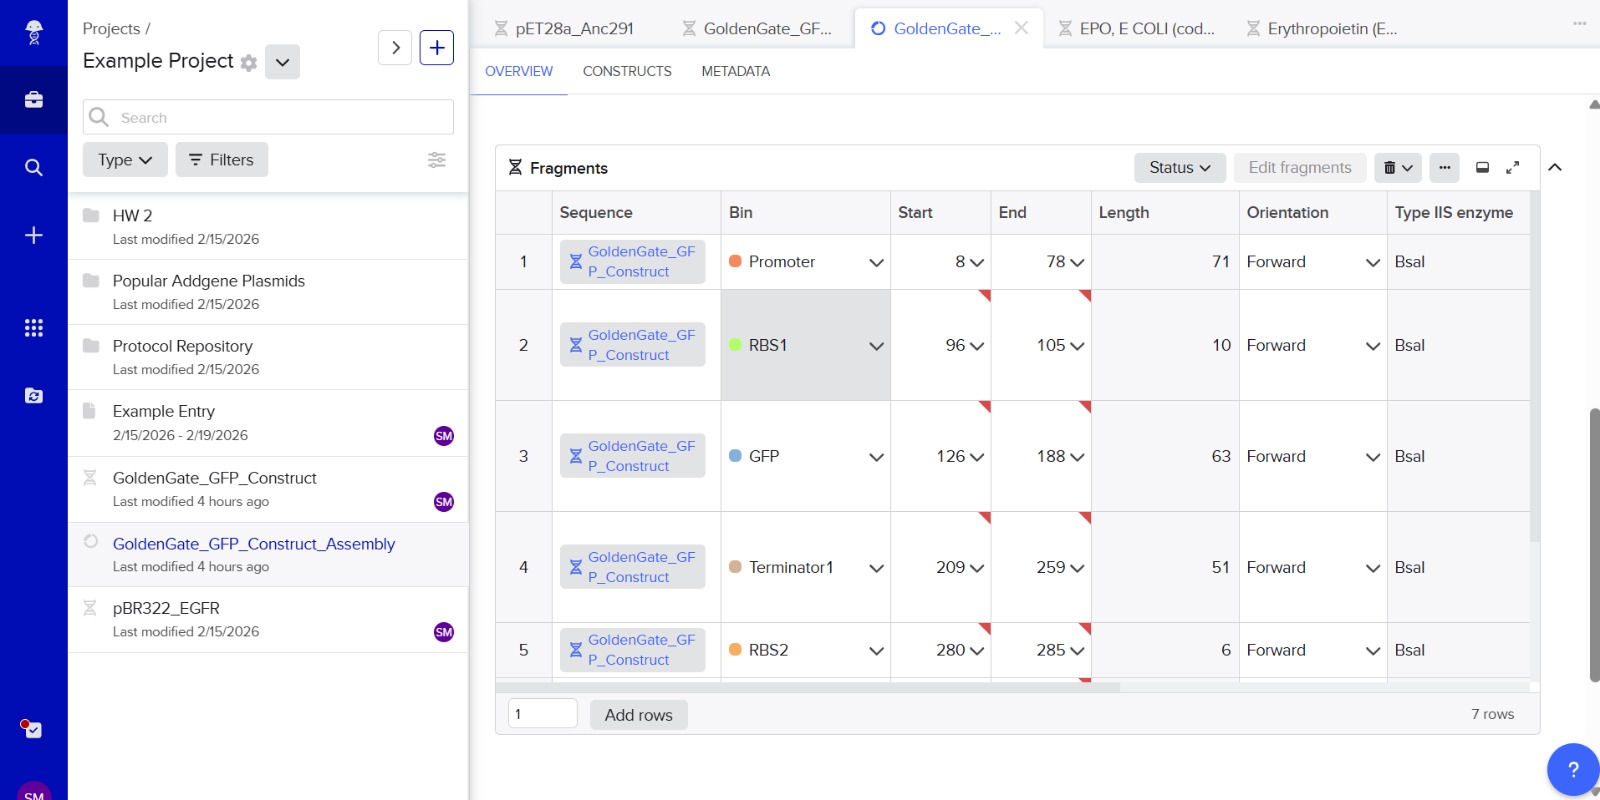
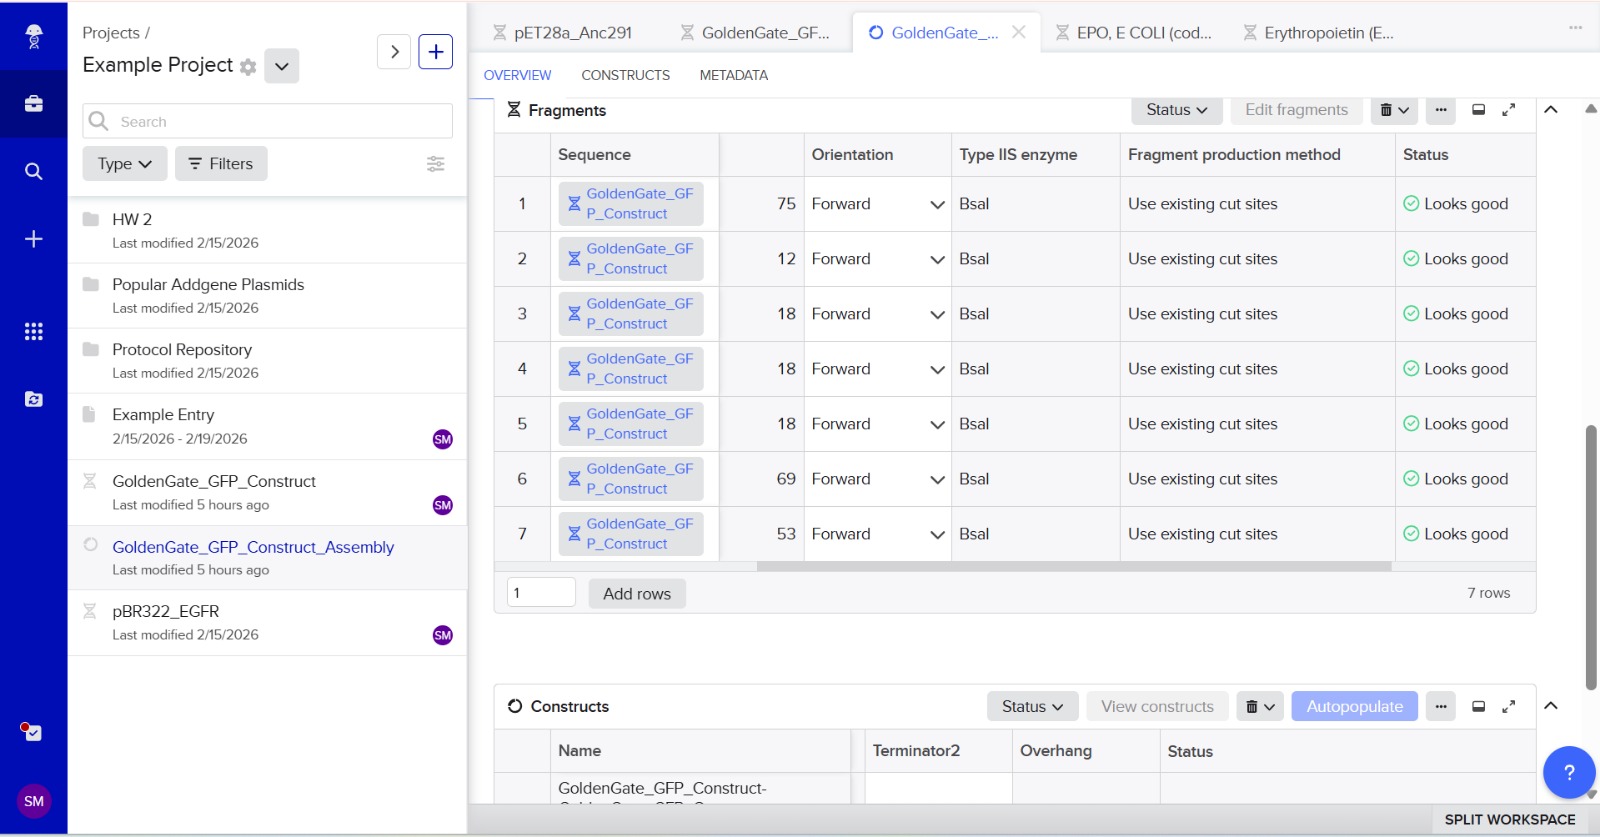
7. Modeling Assembly with Benchling or Asimov Kernel
This method can be modeled using DNA design software like Benchling or Asimov Kernel.
Modeling steps:
Import plasmid and insert DNA sequences.
Add Type IIS restriction enzyme recognition sites (e.g., BsaI).
Design unique 4-bp overhangs for each fragment.
Simulate digestion using restriction analysis features.
Simulate ligation to ensure correct fragment orientation.
Verify the final plasmid sequence.
This software helps prevent frame shifts, orientation errors, or unwanted restriction sites before experiments.
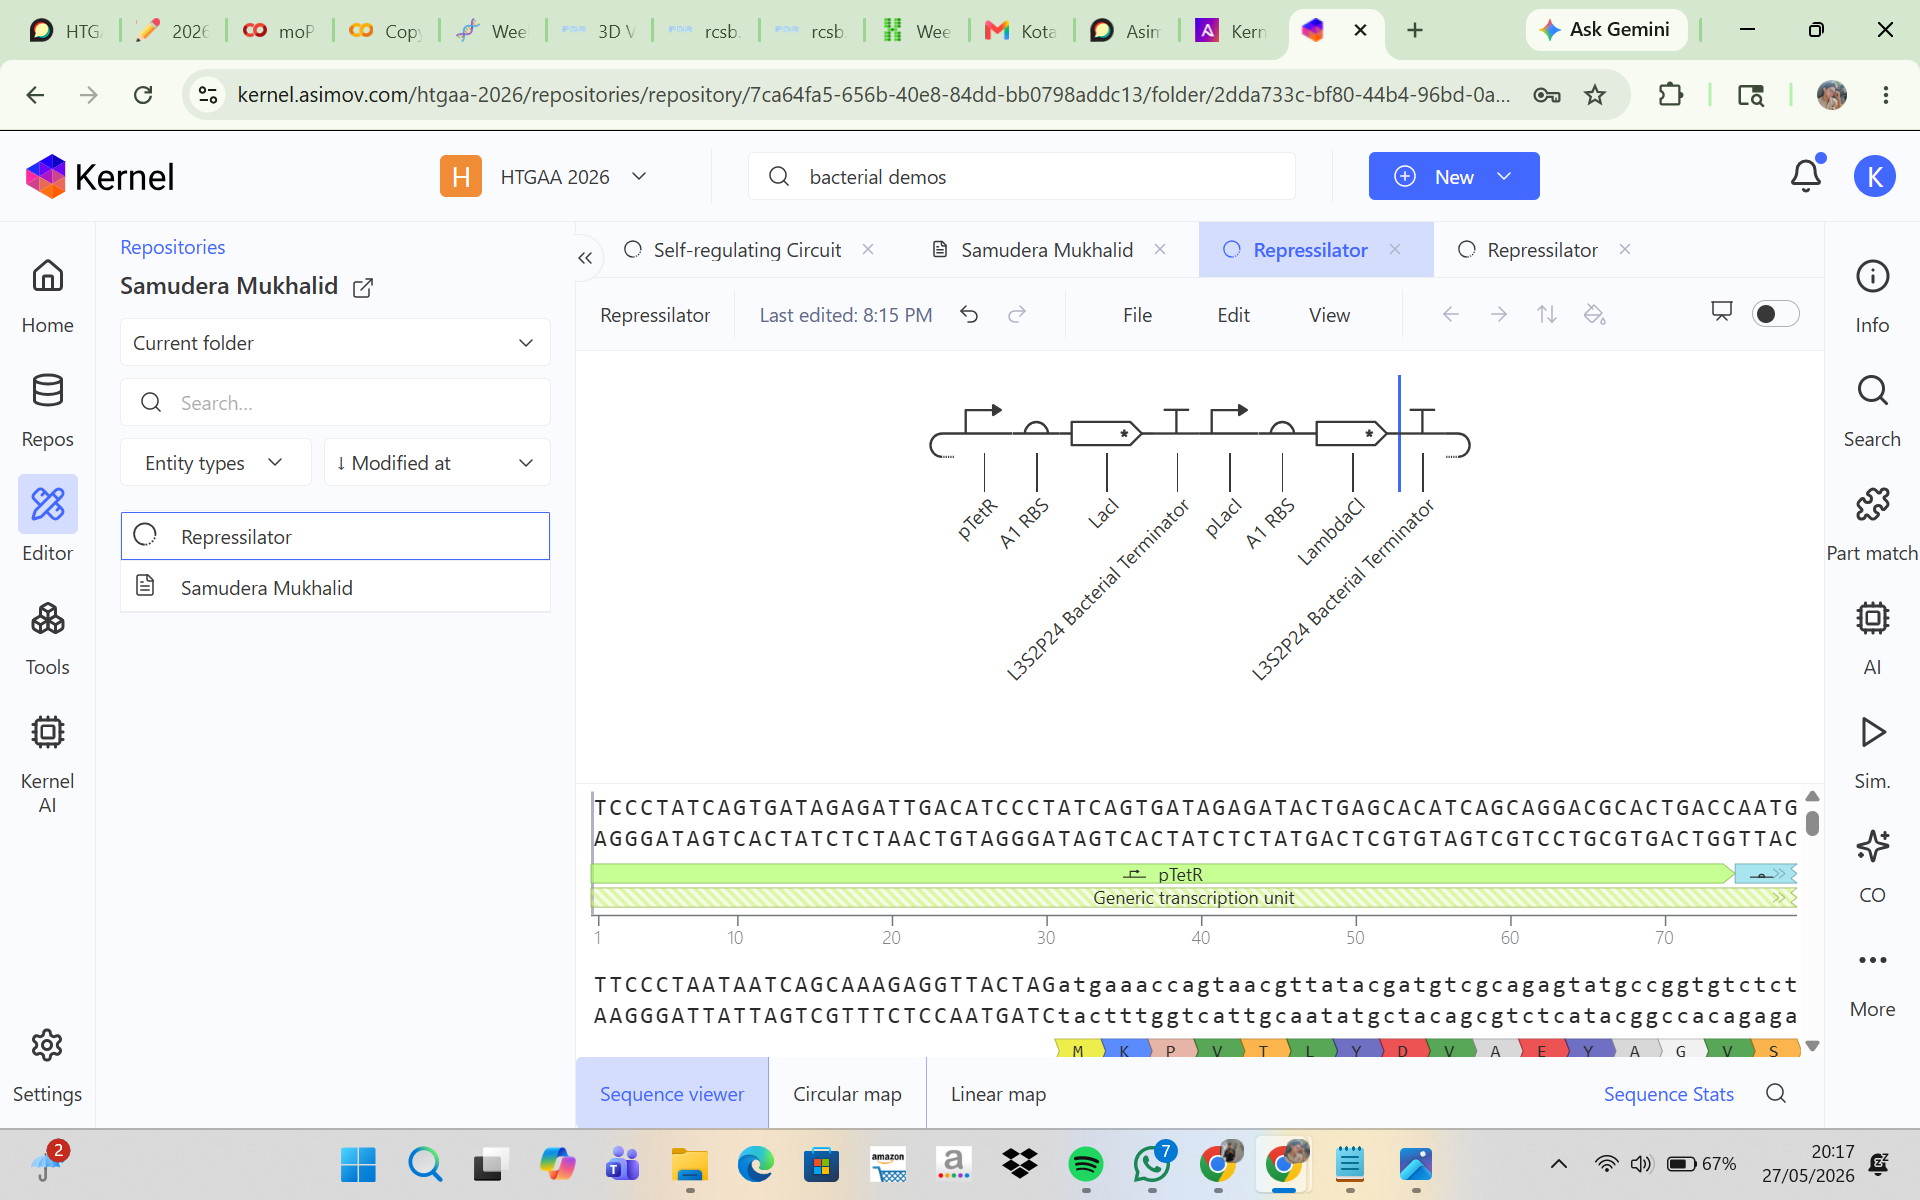
Simulation
This construct models an inducible dual-reporter system commonly used in synthetic biology. The lac promoter allows controlled gene expression in the presence of IPTG. Upon induction, both GFP and RFP are expressed, enabling visualization of gene expression. The use of two reporter genes allows comparative analysis of expression levels. This system demonstrates how multiple genes can be co-expressed under a single regulatory element. Such designs are widely used in biosensors and gene circuit engineering.
Promotor
GGTCTCAATGTGTGAGTTAGCTCACTCATTAGGCACCCCAGGCTTTACACTTTATGCTTCCGGCTCGTATAATGTGTGGAGGTGAGACC
RBS1
GGTCTCAGGTAGGAGGGCTTGAGACC
GFP
GGTCTCGCTTATGGTGAGCAAGGGCGAGGAGCTGTTCACCGGGGTGGTGCCCATCCTGGTCGAGCTGGACCGCTGAGACC
Terminator1
GGTCTCCGCTGCCTCAGCGGTGGCGAACCTGCGCGTTGTTGCGGTTTTTTGCCGCCAGCGGTTATGAGACC
RBS2
GGTCTCTTATAGGAGGGCTTAATGGAGACC
RFP
GGTCTCAATGATGGTGAGCAAGGGCGAGGAGGATAACATGGCCATCATCAAGGAGTTCATGCGCTTCAAGCGCTGAGACC
Terminator2
GGTCTCCGCTGCCTCAGCGGTGGCGAACCTGCGCGTTGTTGCGGTTTTTTGCCGCCAGCGGACTAGAGACC
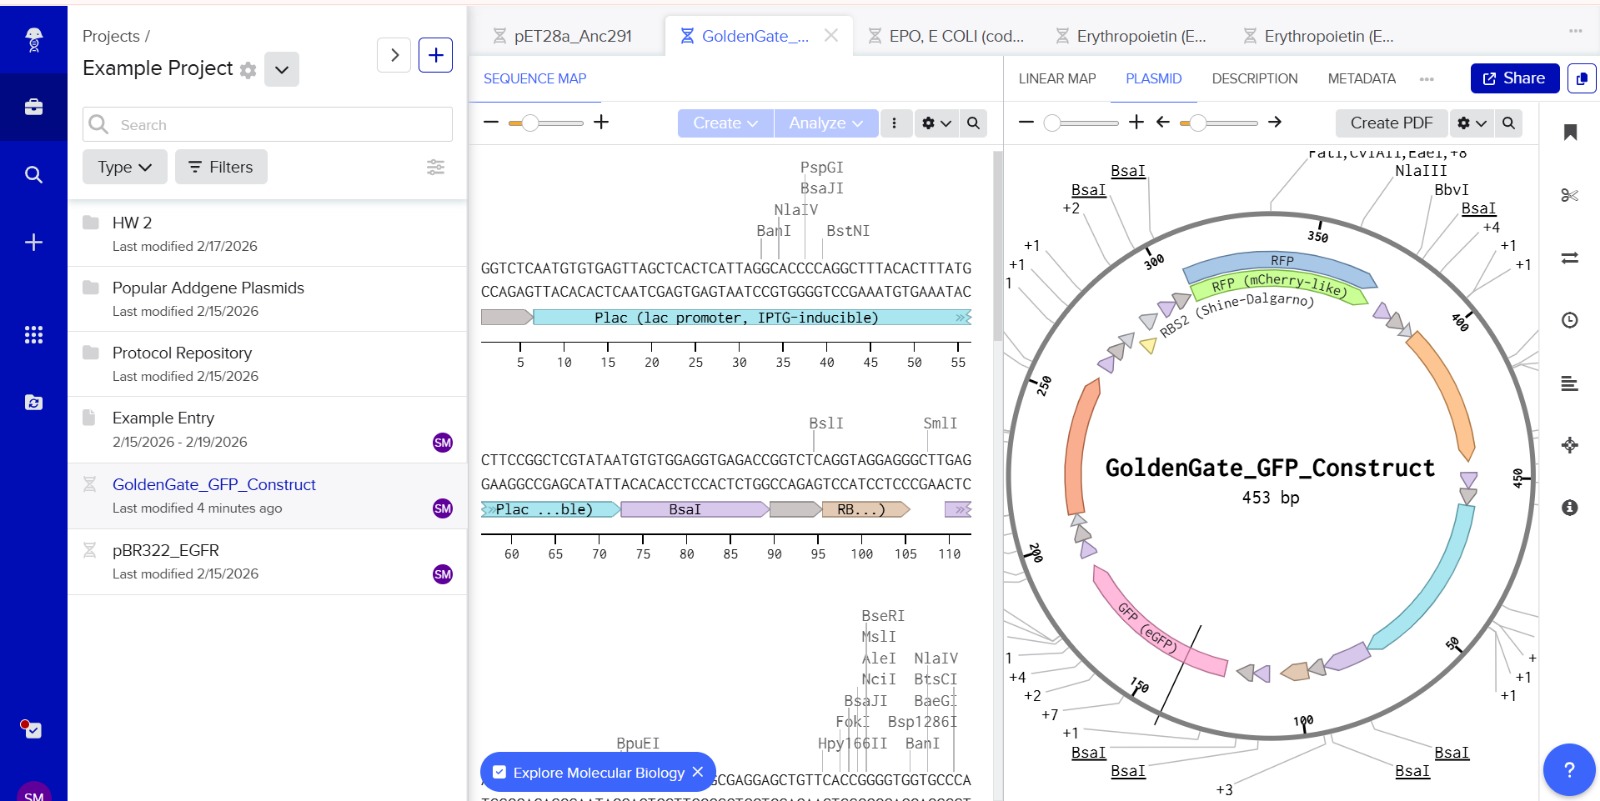
The promoter sequence was separated from the BsaI restriction sites to ensure correct biological annotation. The flanking BsaI sites are used only for Golden Gate assembly and are not part of the functional promoter region.
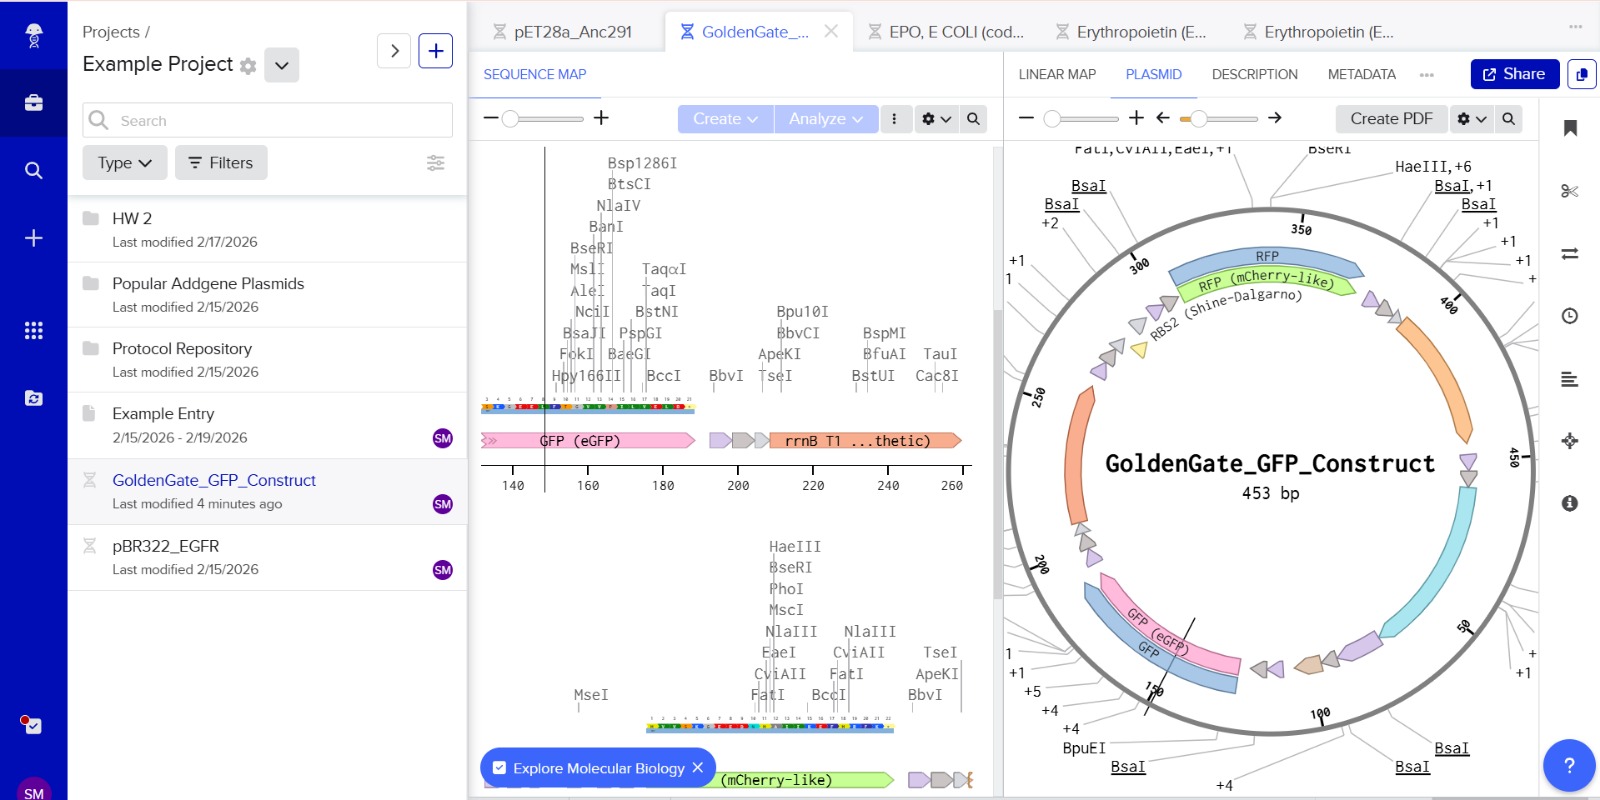
Stop codons were included at the end of each coding sequence (GFP and RFP) to ensure proper termination of translation. No additional stop codons were added downstream of terminators, as terminators function at the transcriptional level and do not affect translation termination.
Assignment: Asimov Kernel
Bacterial Demo
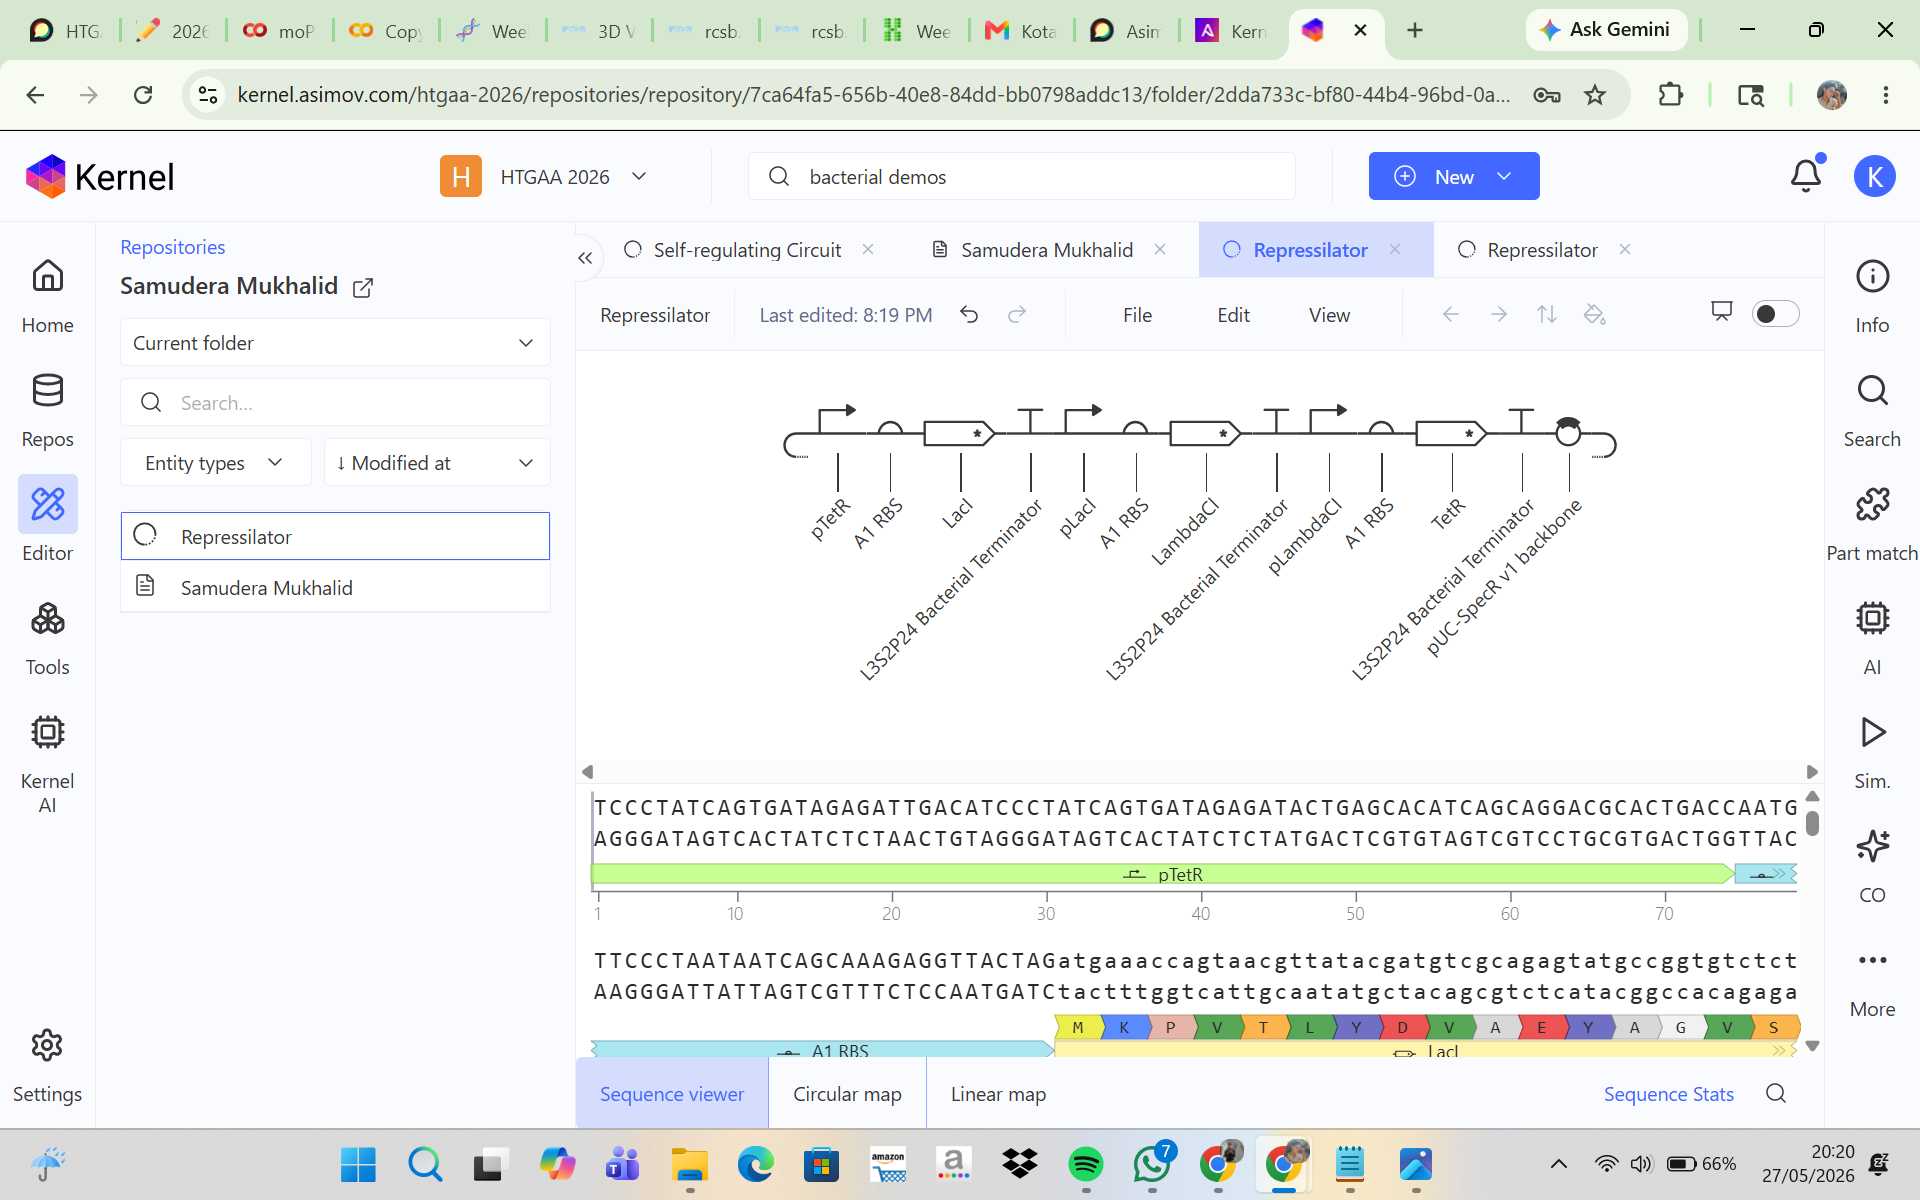
This is the simulation result I obtained. I think the simulation results are very different compared to the bacterial demos one.
CONSTRUCT 1. Auto-Repression GFP Circuit (Negative Feedback Circuit)
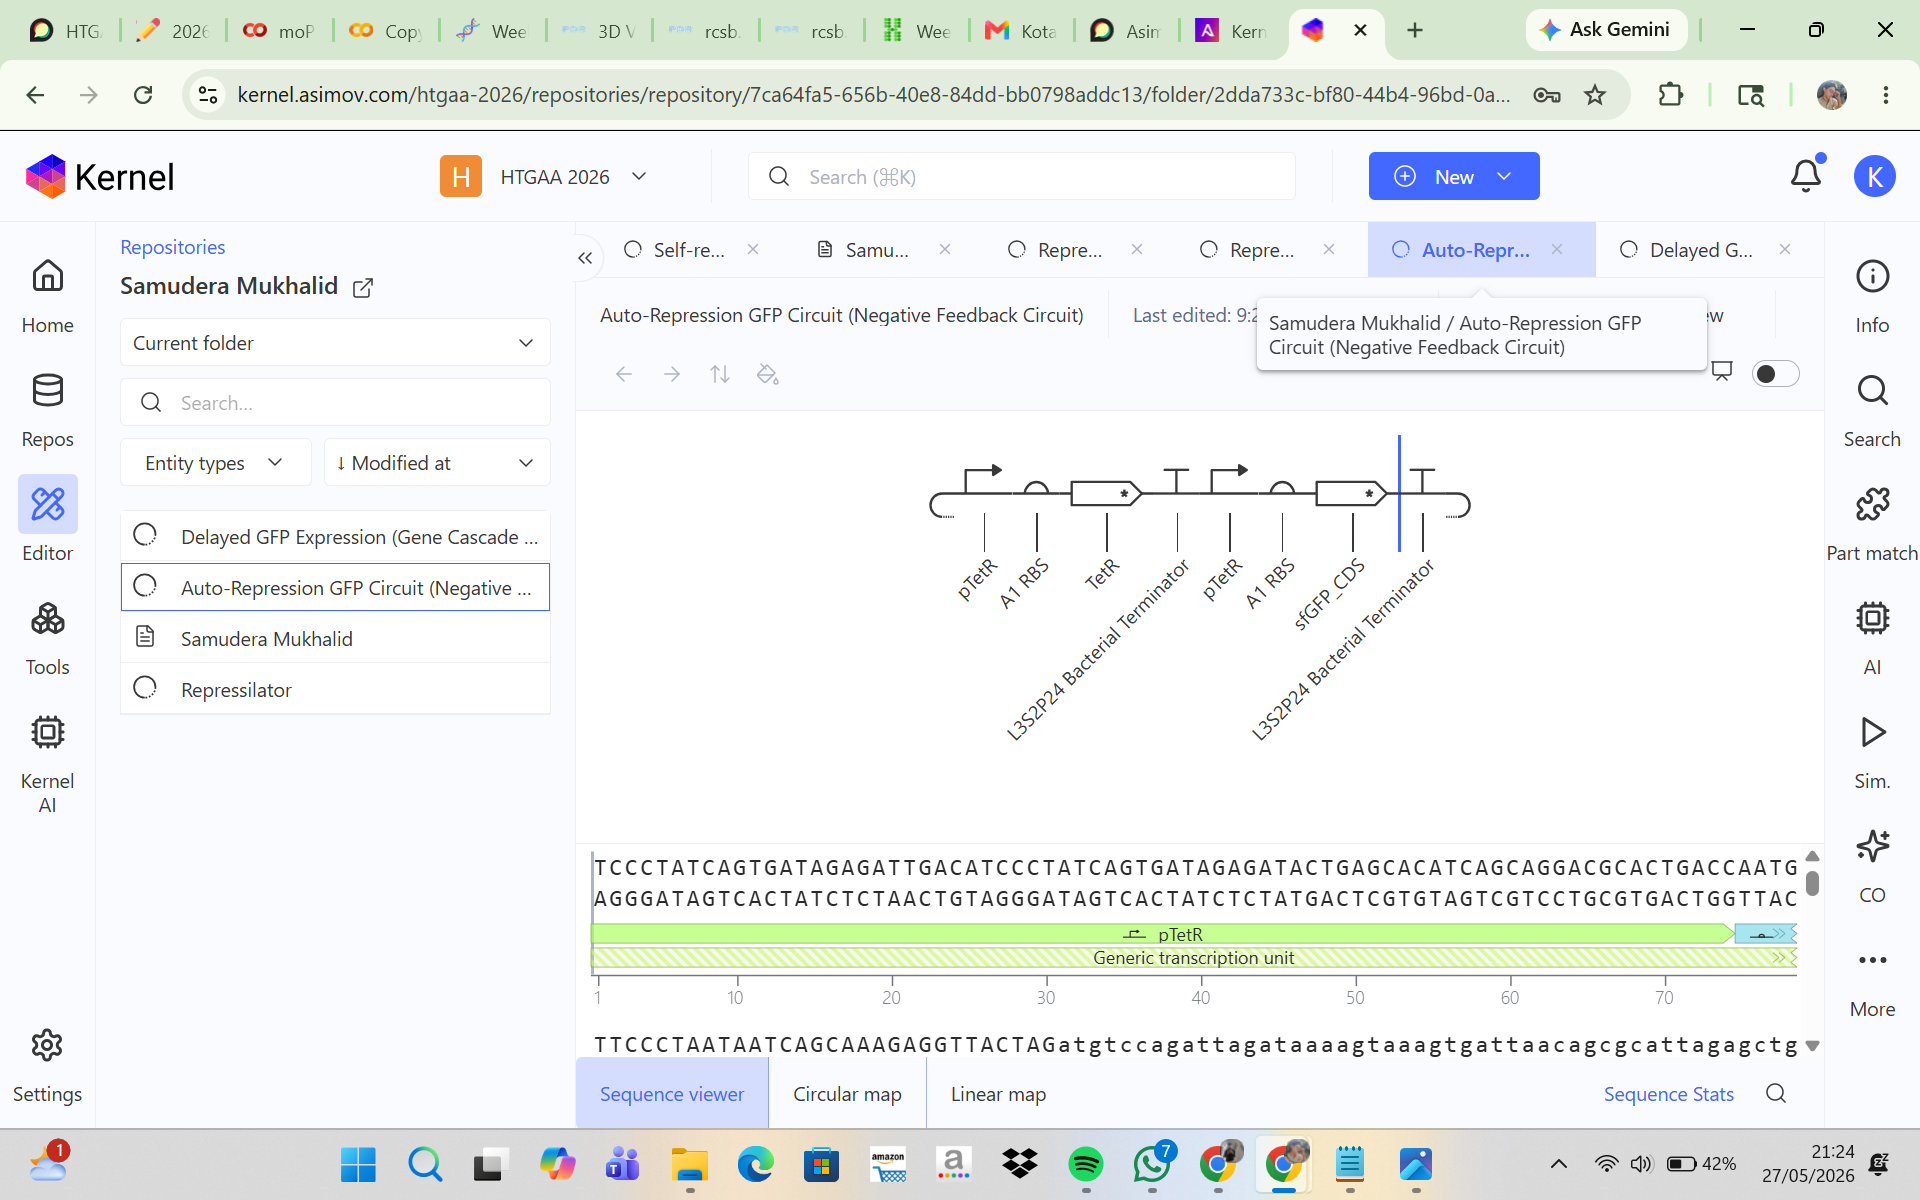
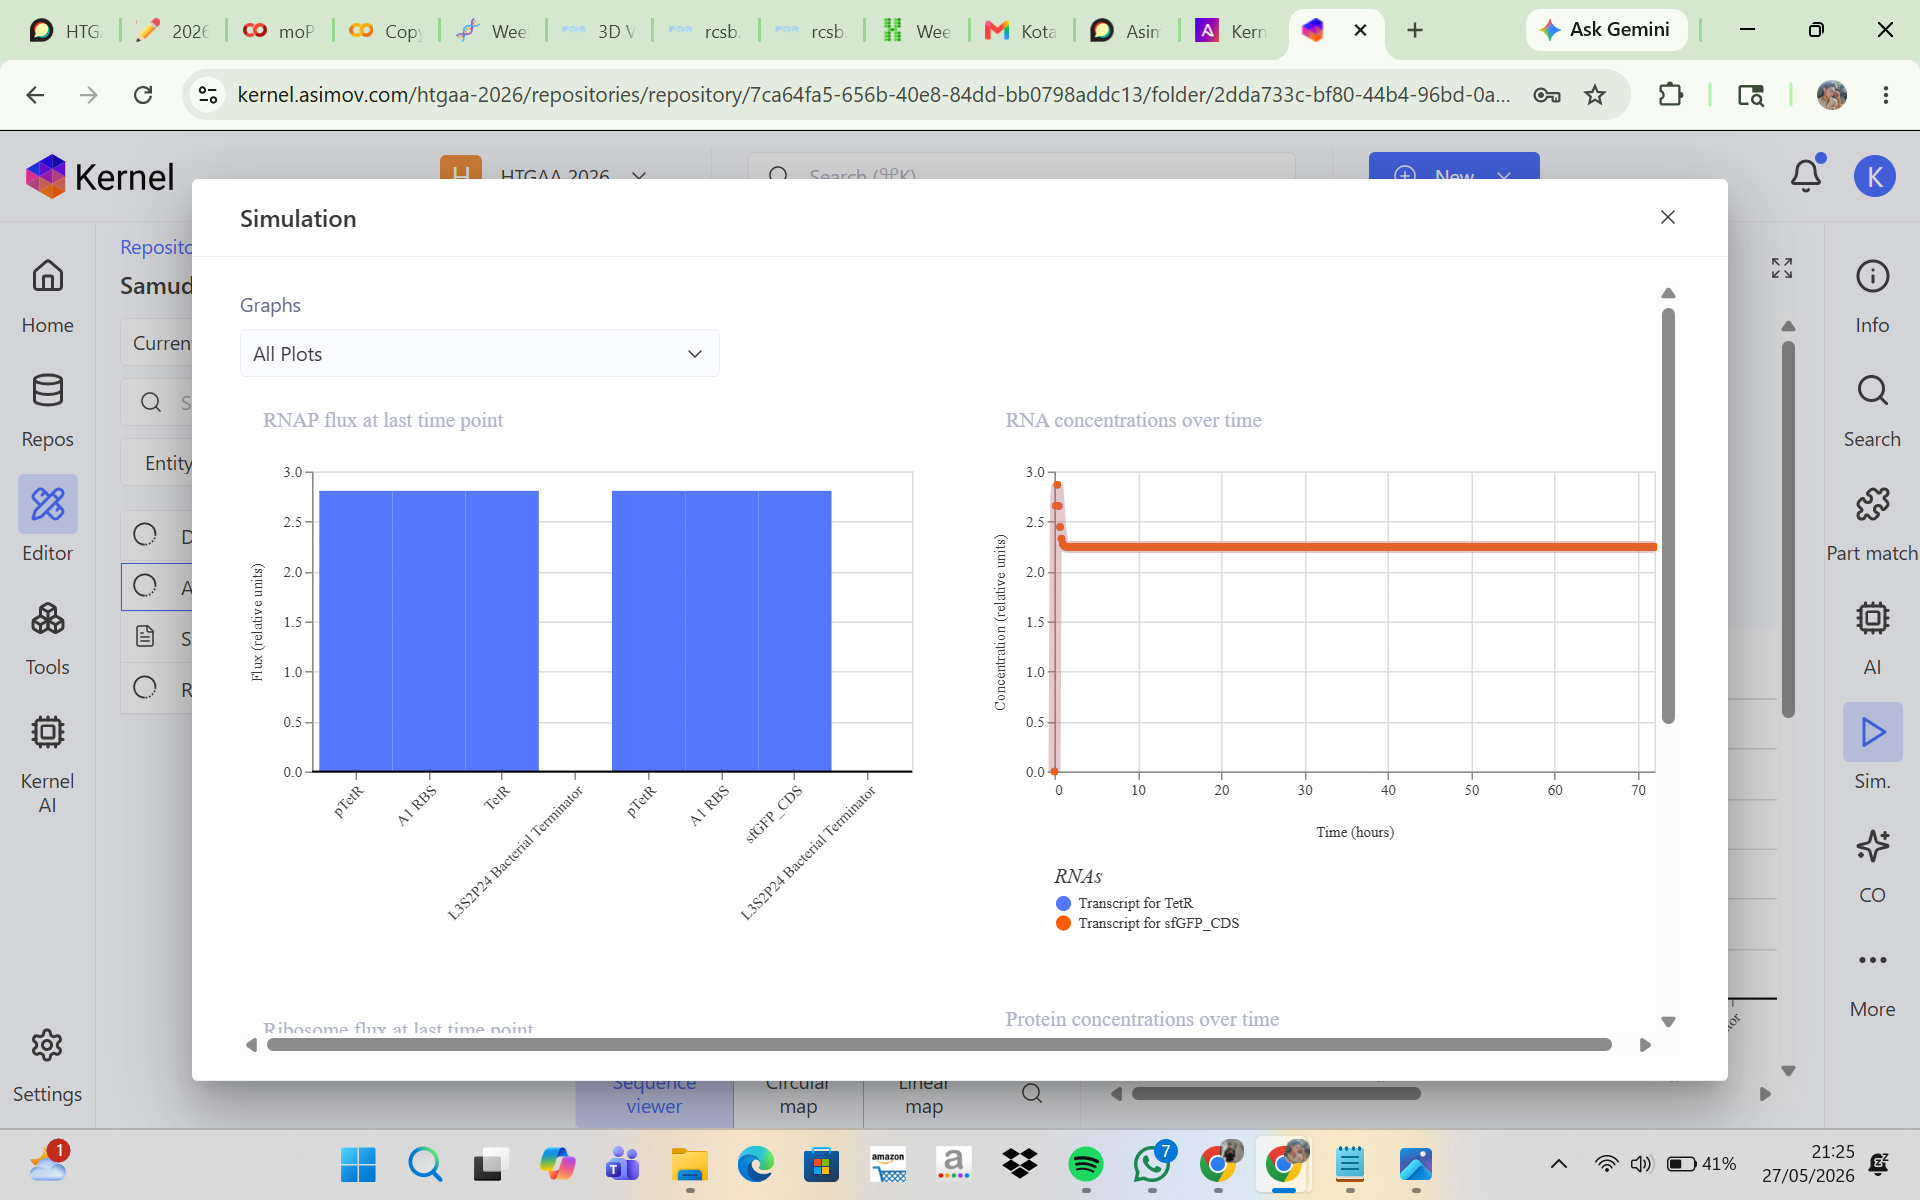
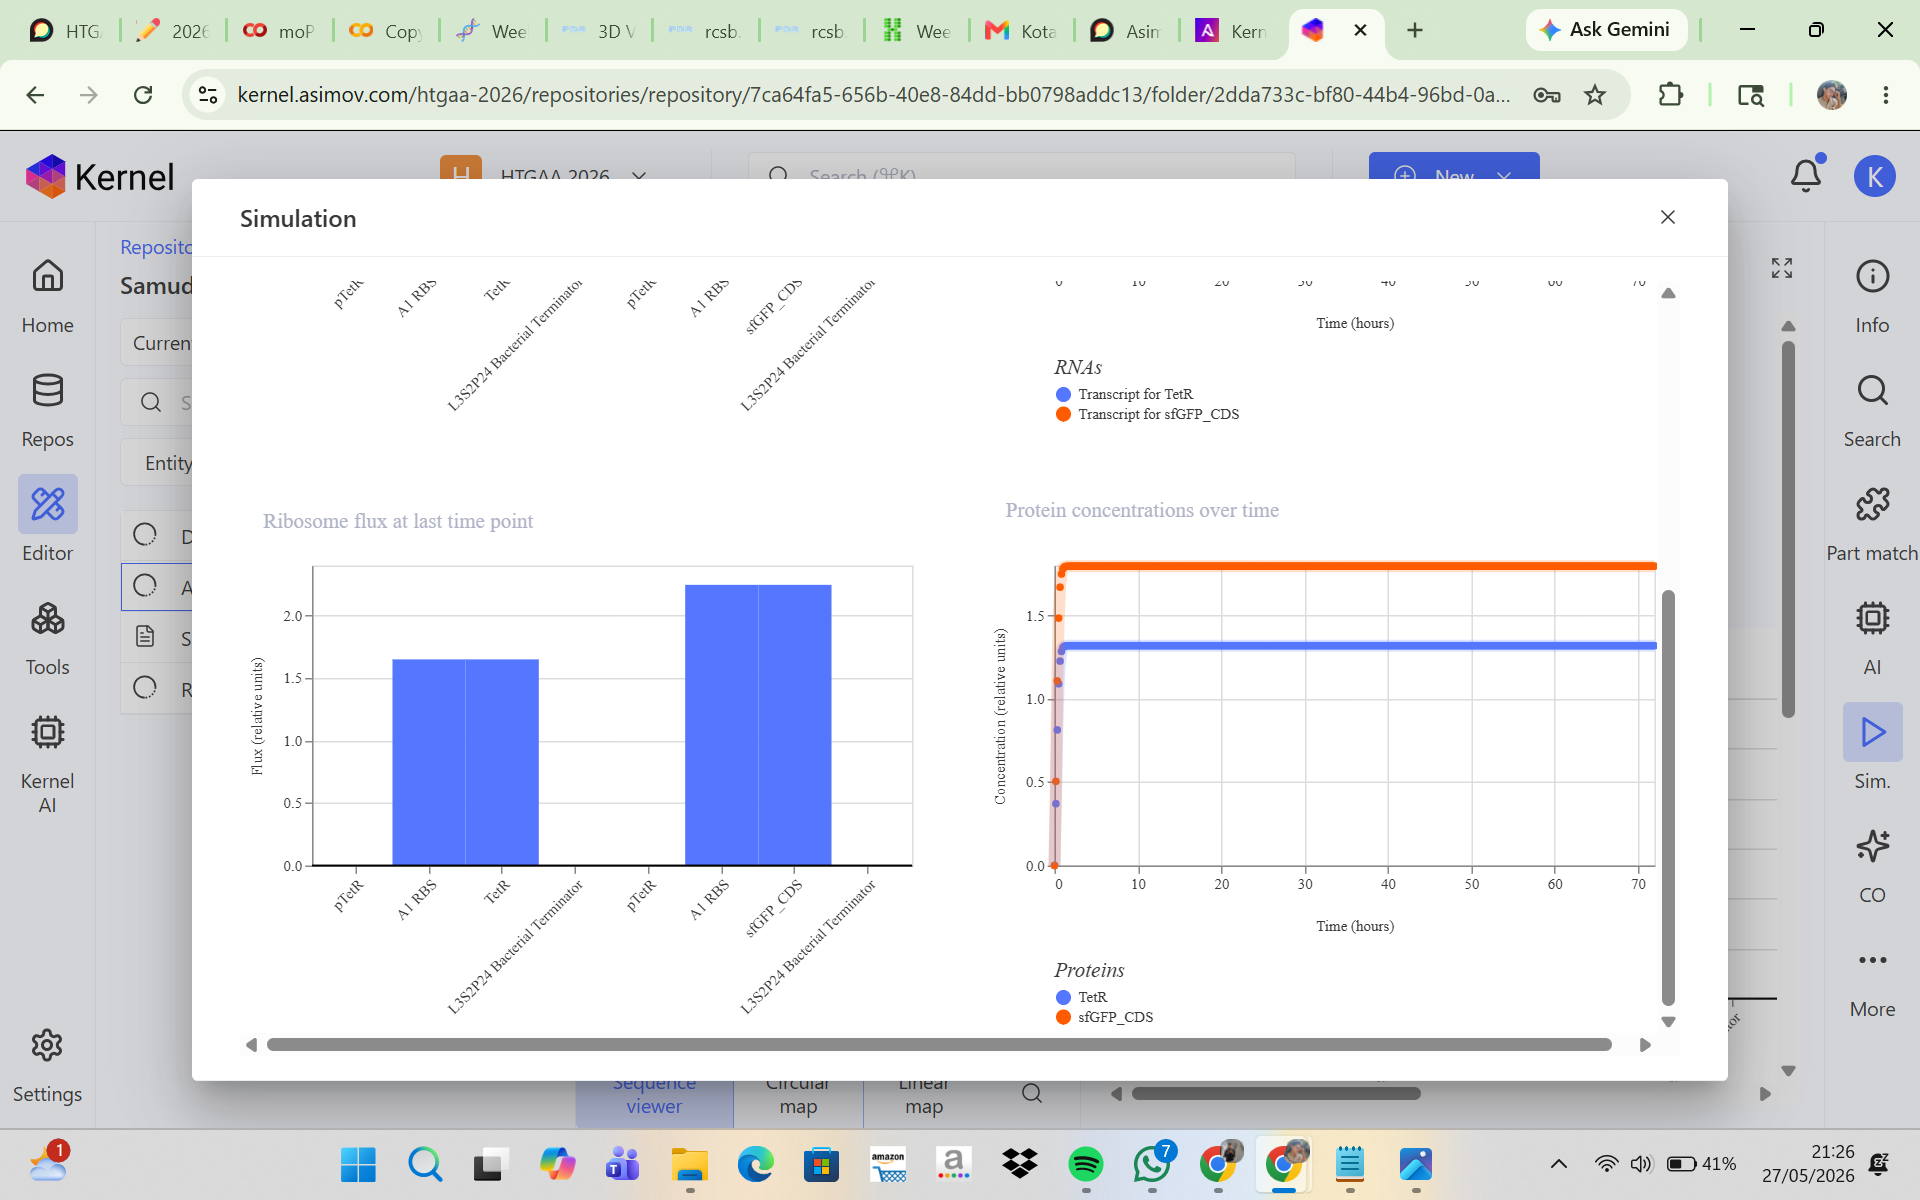
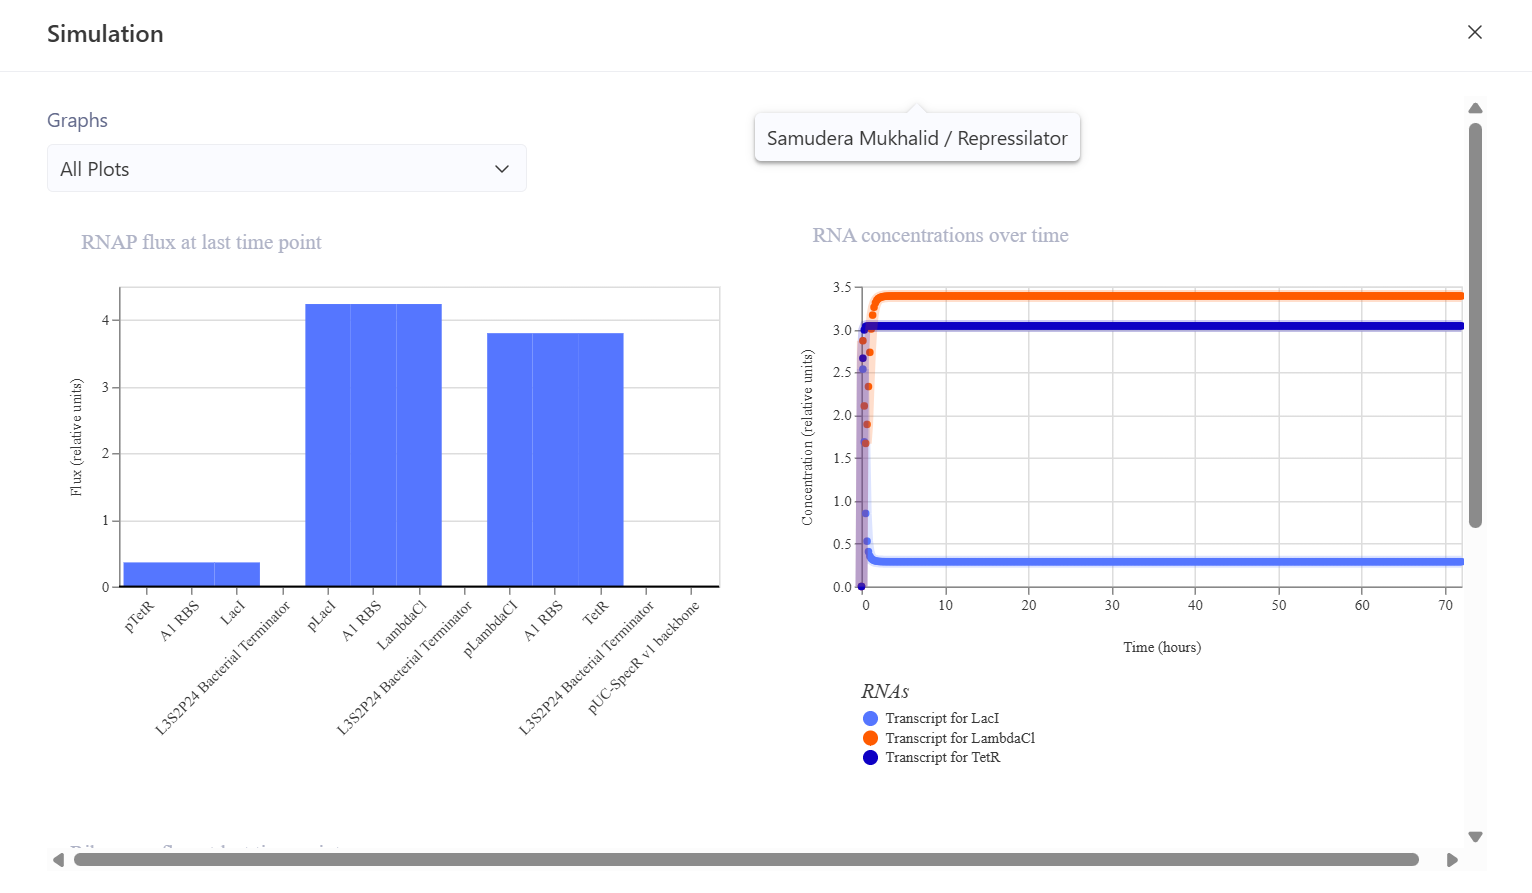
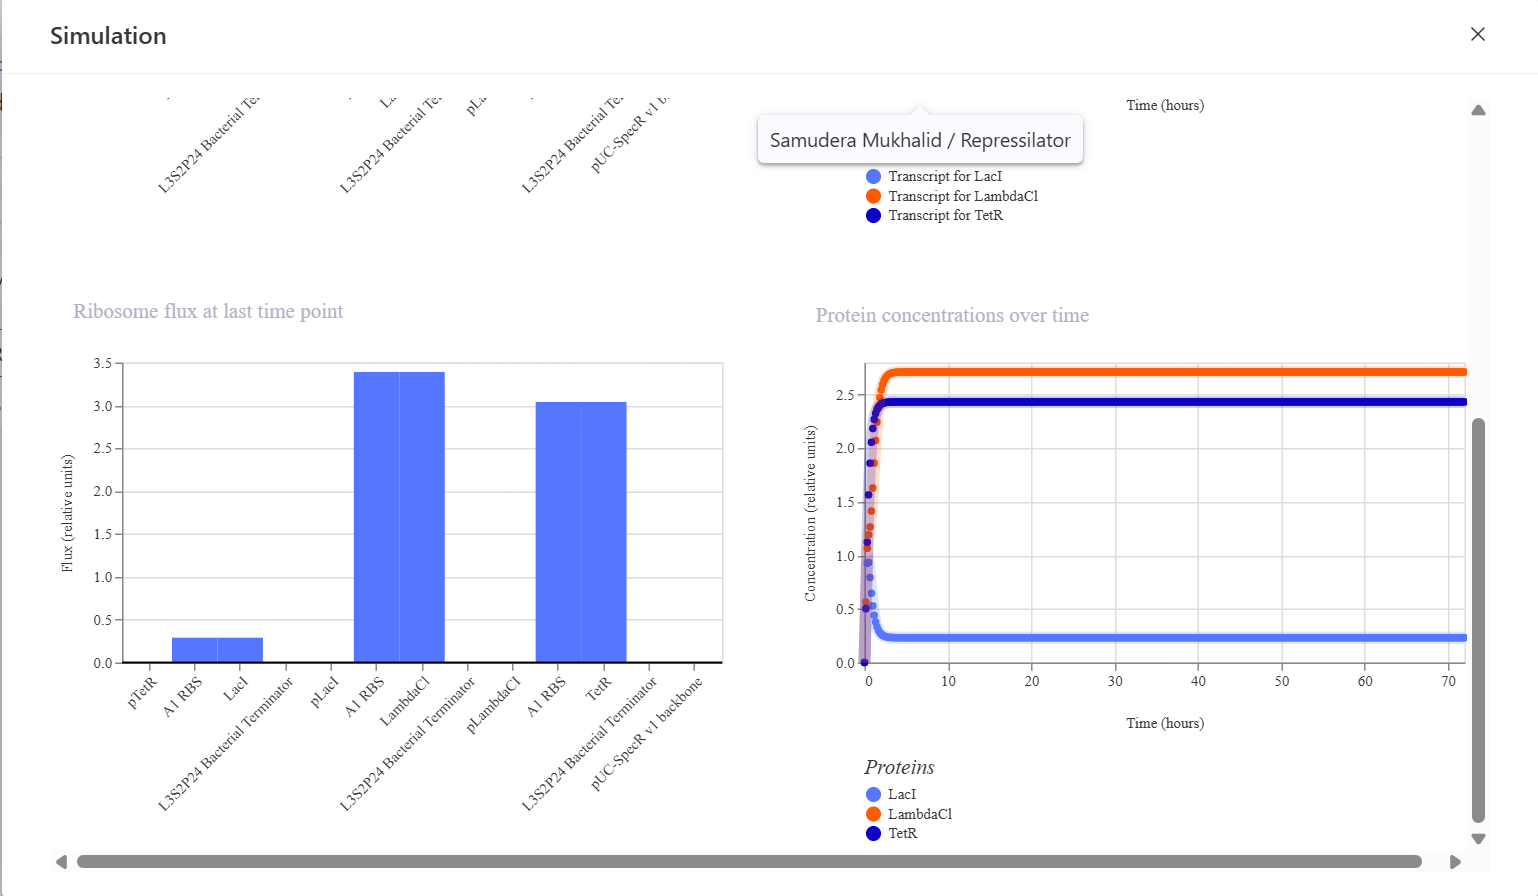
This construct was designed to produce GFP that initially turns on and is then self-repressed by a repressor protein. In this system, the pTetR promoter activates the expression of TetR and GFP, and the TetR protein then represses the pTetR promoter, which should cause GFP production to decrease over time. The initial hypothesis was that GFP would rise rapidly at the beginning of the simulation because the promoter is active, and then, as TetR accumulates, the promoter would become repressed so that GFP expression would decline and the system would eventually reach a low steady state. However, the simulation results and analysis showed that the construct successfully expressed TetR and sfGFP in a stable manner, but the negative feedback mechanism was not strong enough to produce the expected decrease in GFP expression. This may be due to a high promoter strength, a low protein degradation rate, or weak TetR repression. Adjusting the simulation parameters, such as increasing the degradation rate and reducing the promoter strength, may help produce a feedback behavior that is more consistent with the biological expectation.
CONSTRUCT 2. Delayed GFP Expression (Gene Cascade Circuit)
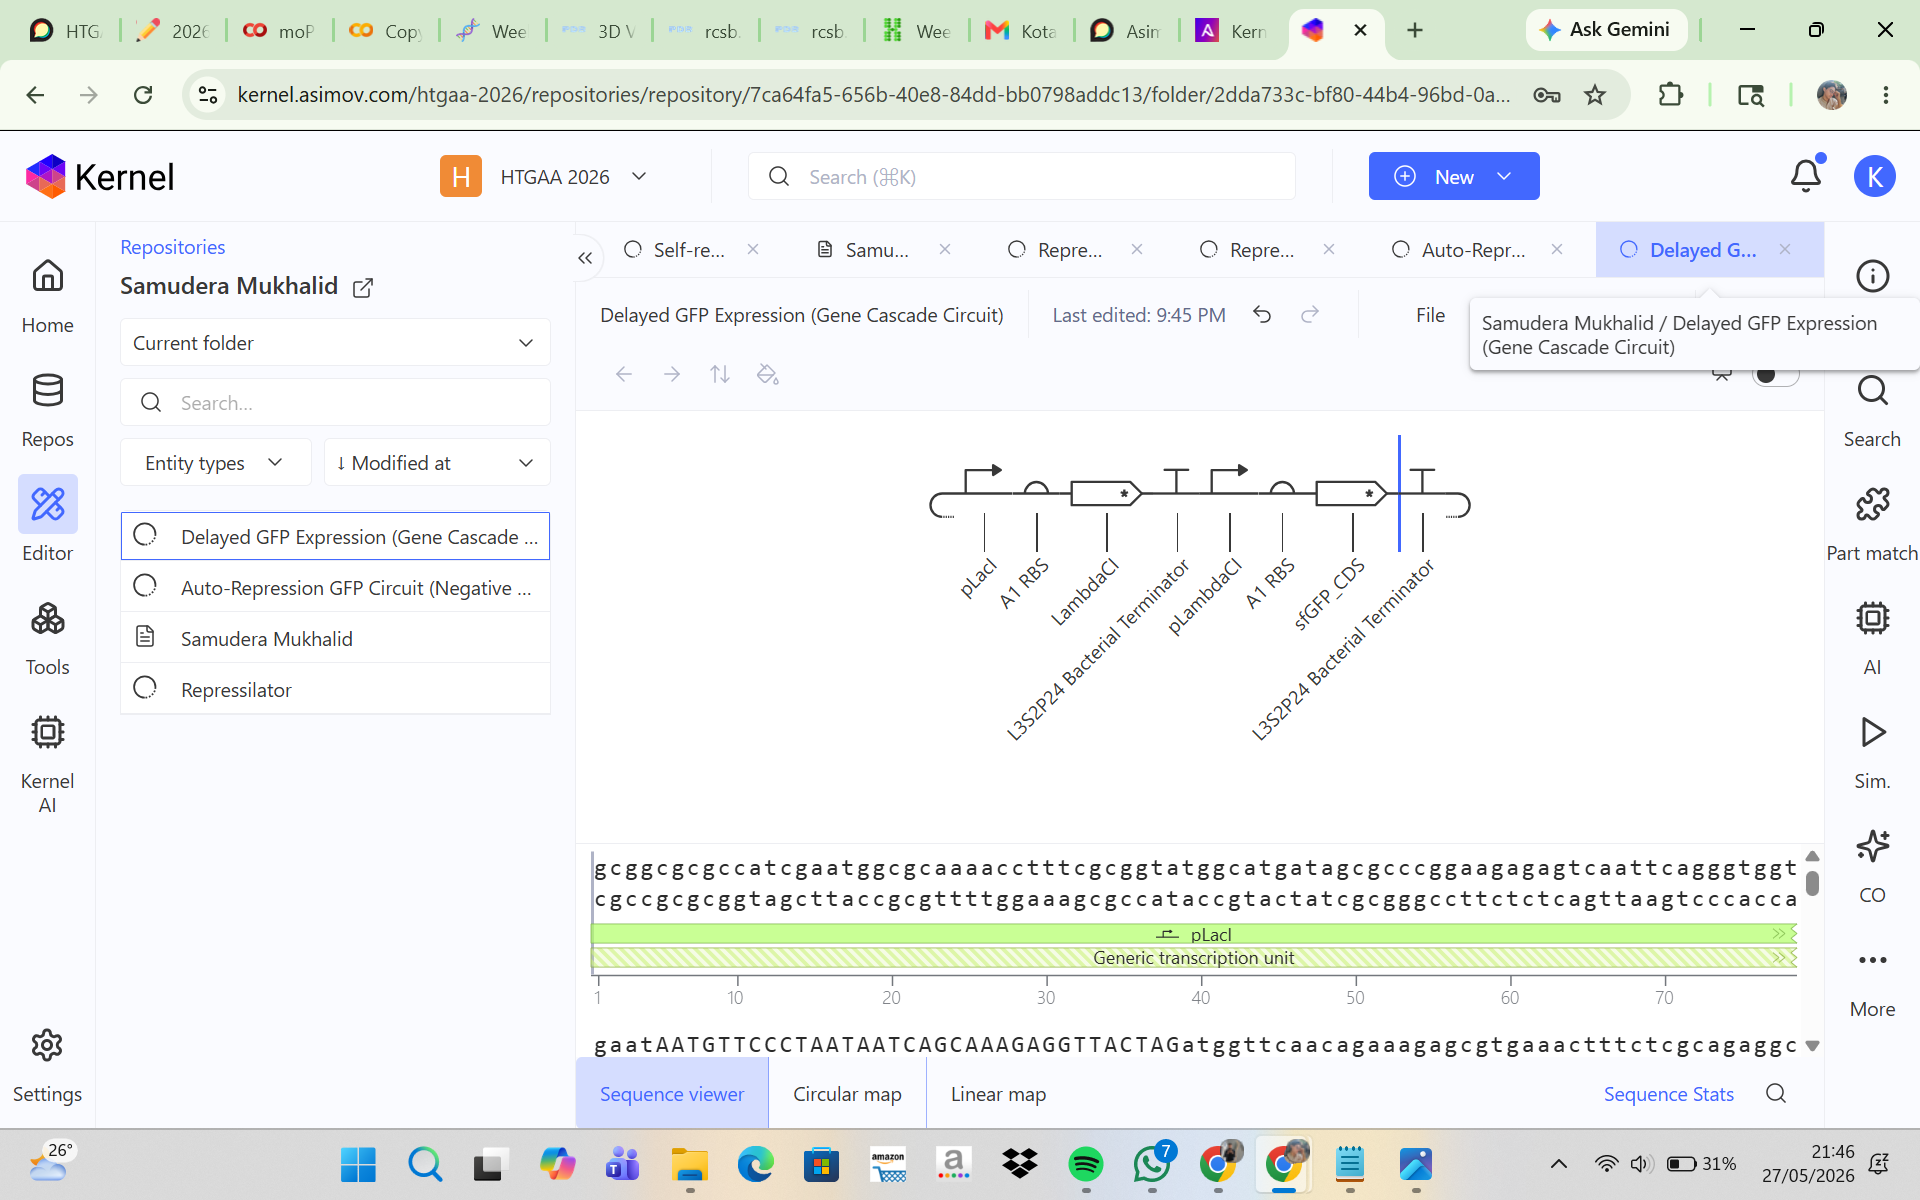
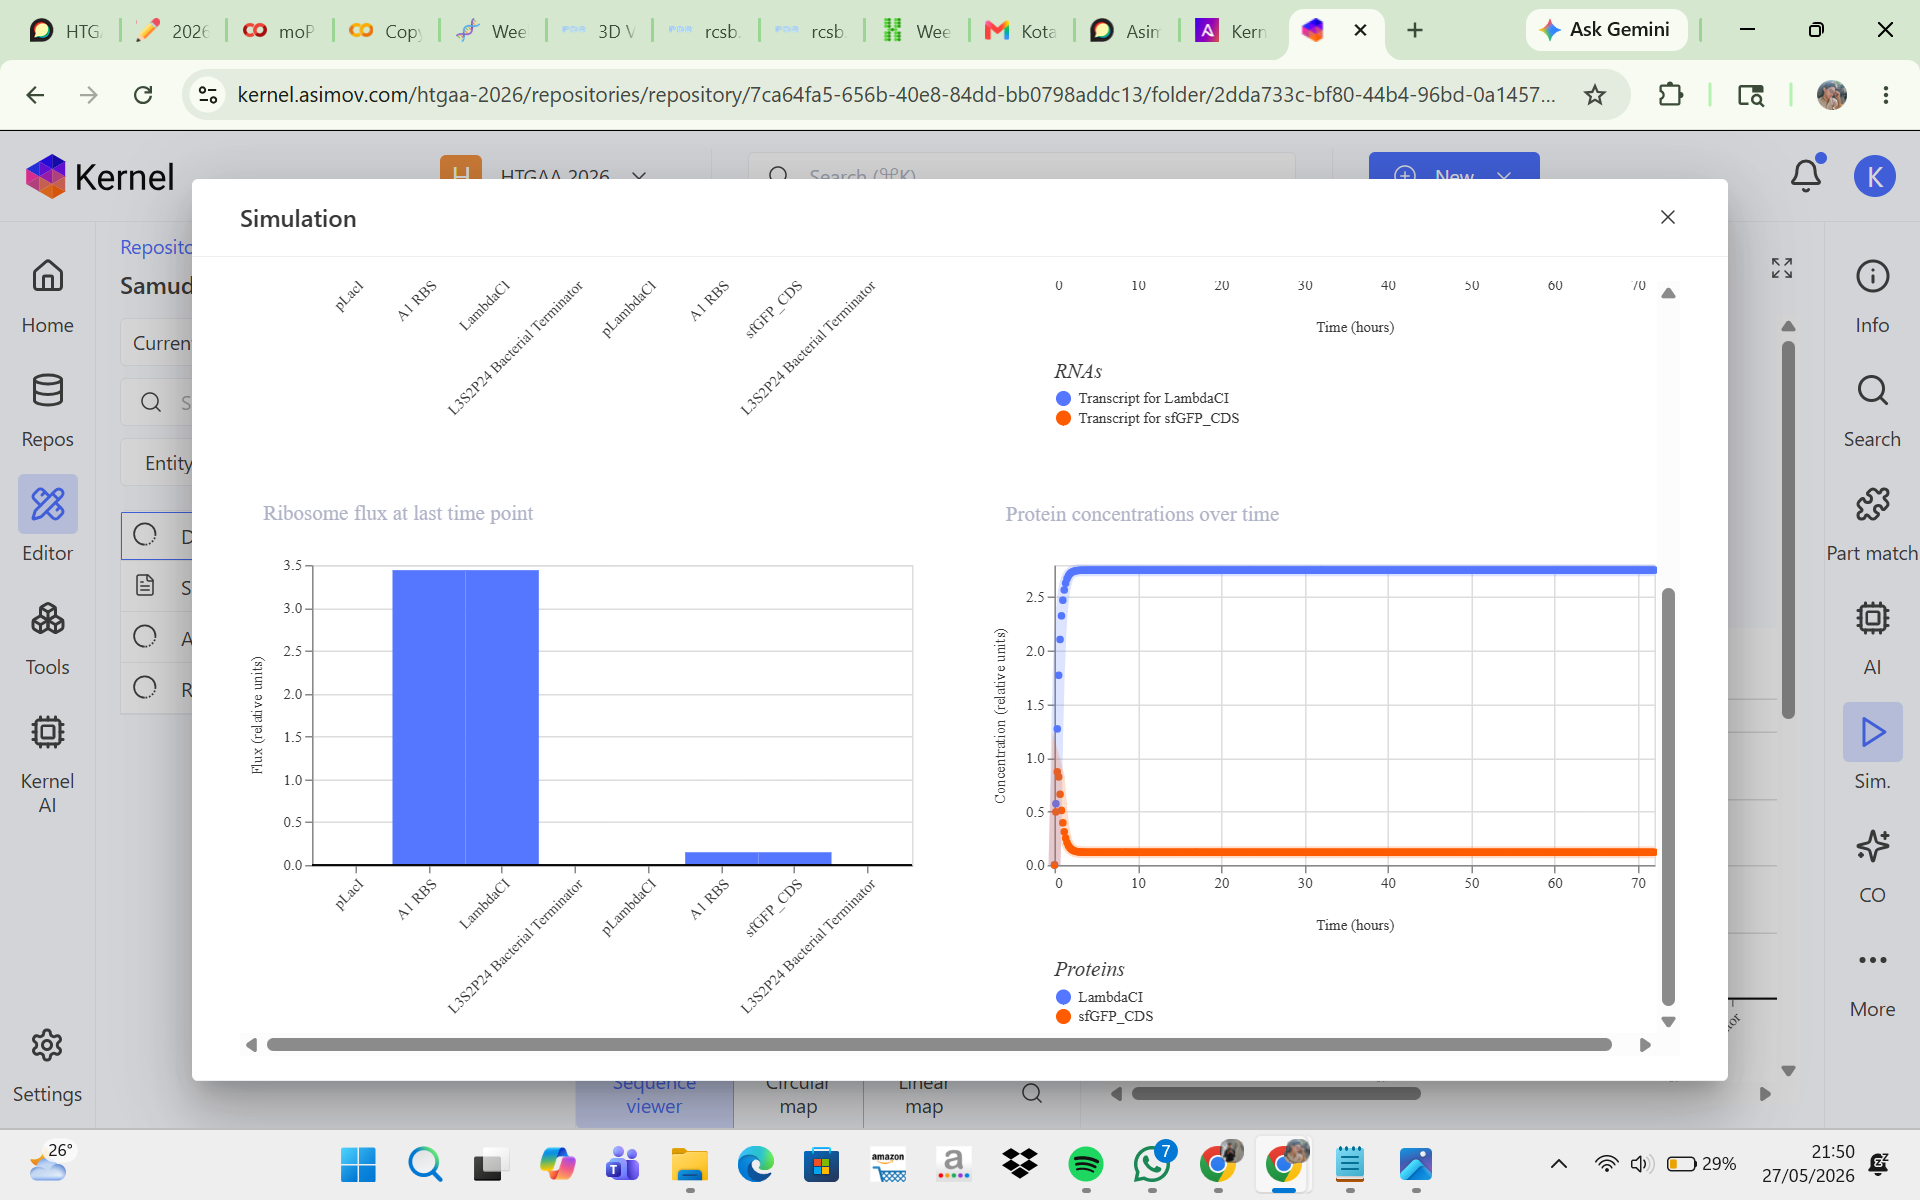
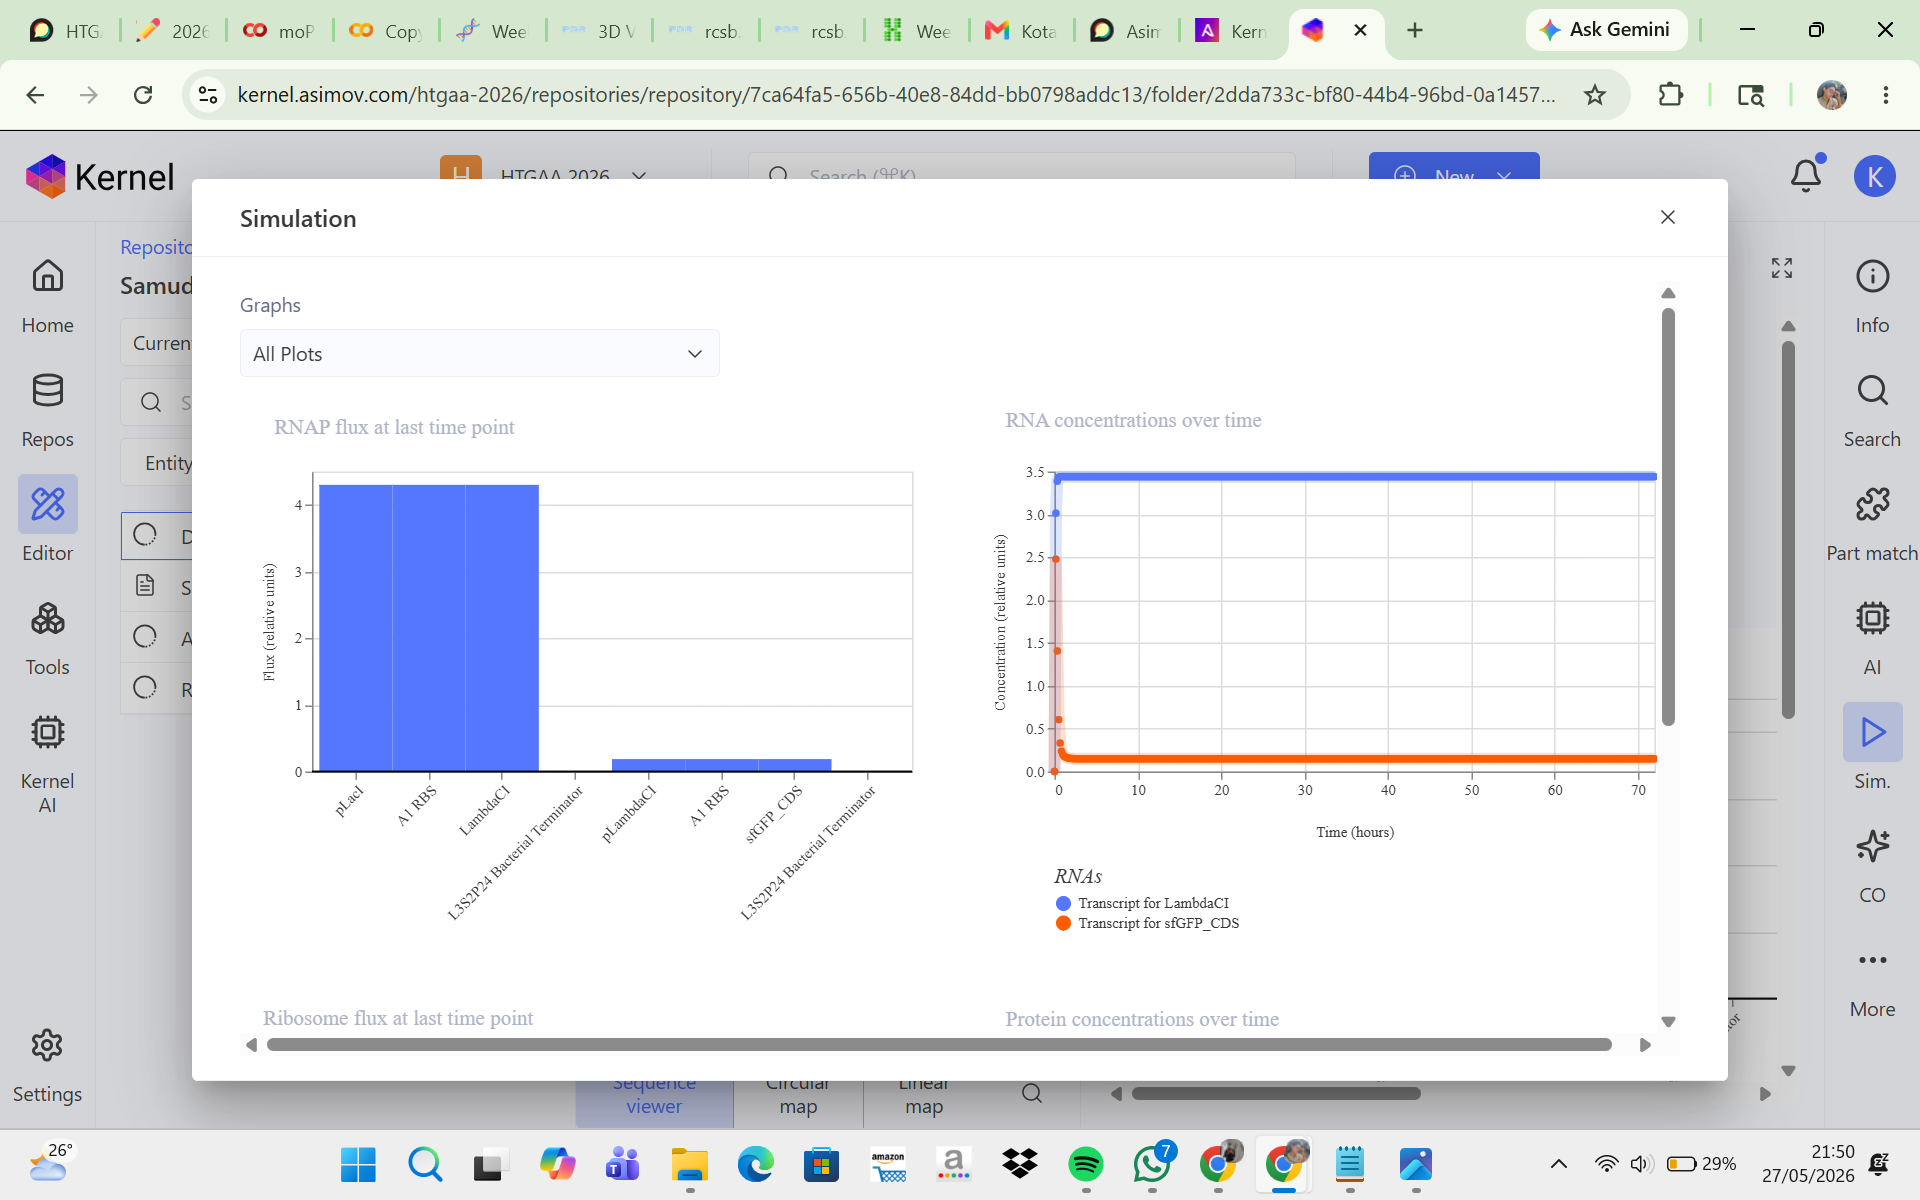
The goal of this construct was to create a delayed GFP expression system. In this design, the first promoter produces LambdaCI, and once LambdaCI accumulates to a sufficient level, the second promoter becomes active, allowing GFP to be expressed. The initial hypothesis was that GFP would not increase immediately at the beginning of the simulation because there would be a time delay while LambdaCI was first produced before it could activate GFP expression. However, the simulation results and analysis showed that LambdaCI was successfully expressed at a high and stable concentration, while sfGFP expression remained very low throughout the simulation. This suggests that the pLambdaCI promoter most likely functions as a promoter that is repressed by LambdaCI rather than activated by it. As a result, the circuit did not produce delayed GFP expression as expected. Adjustments such as replacing the second promoter, reducing repression strength, or increasing the sfGFP promoter strength may help generate a cascade behavior that is more consistent with the initial expectation.
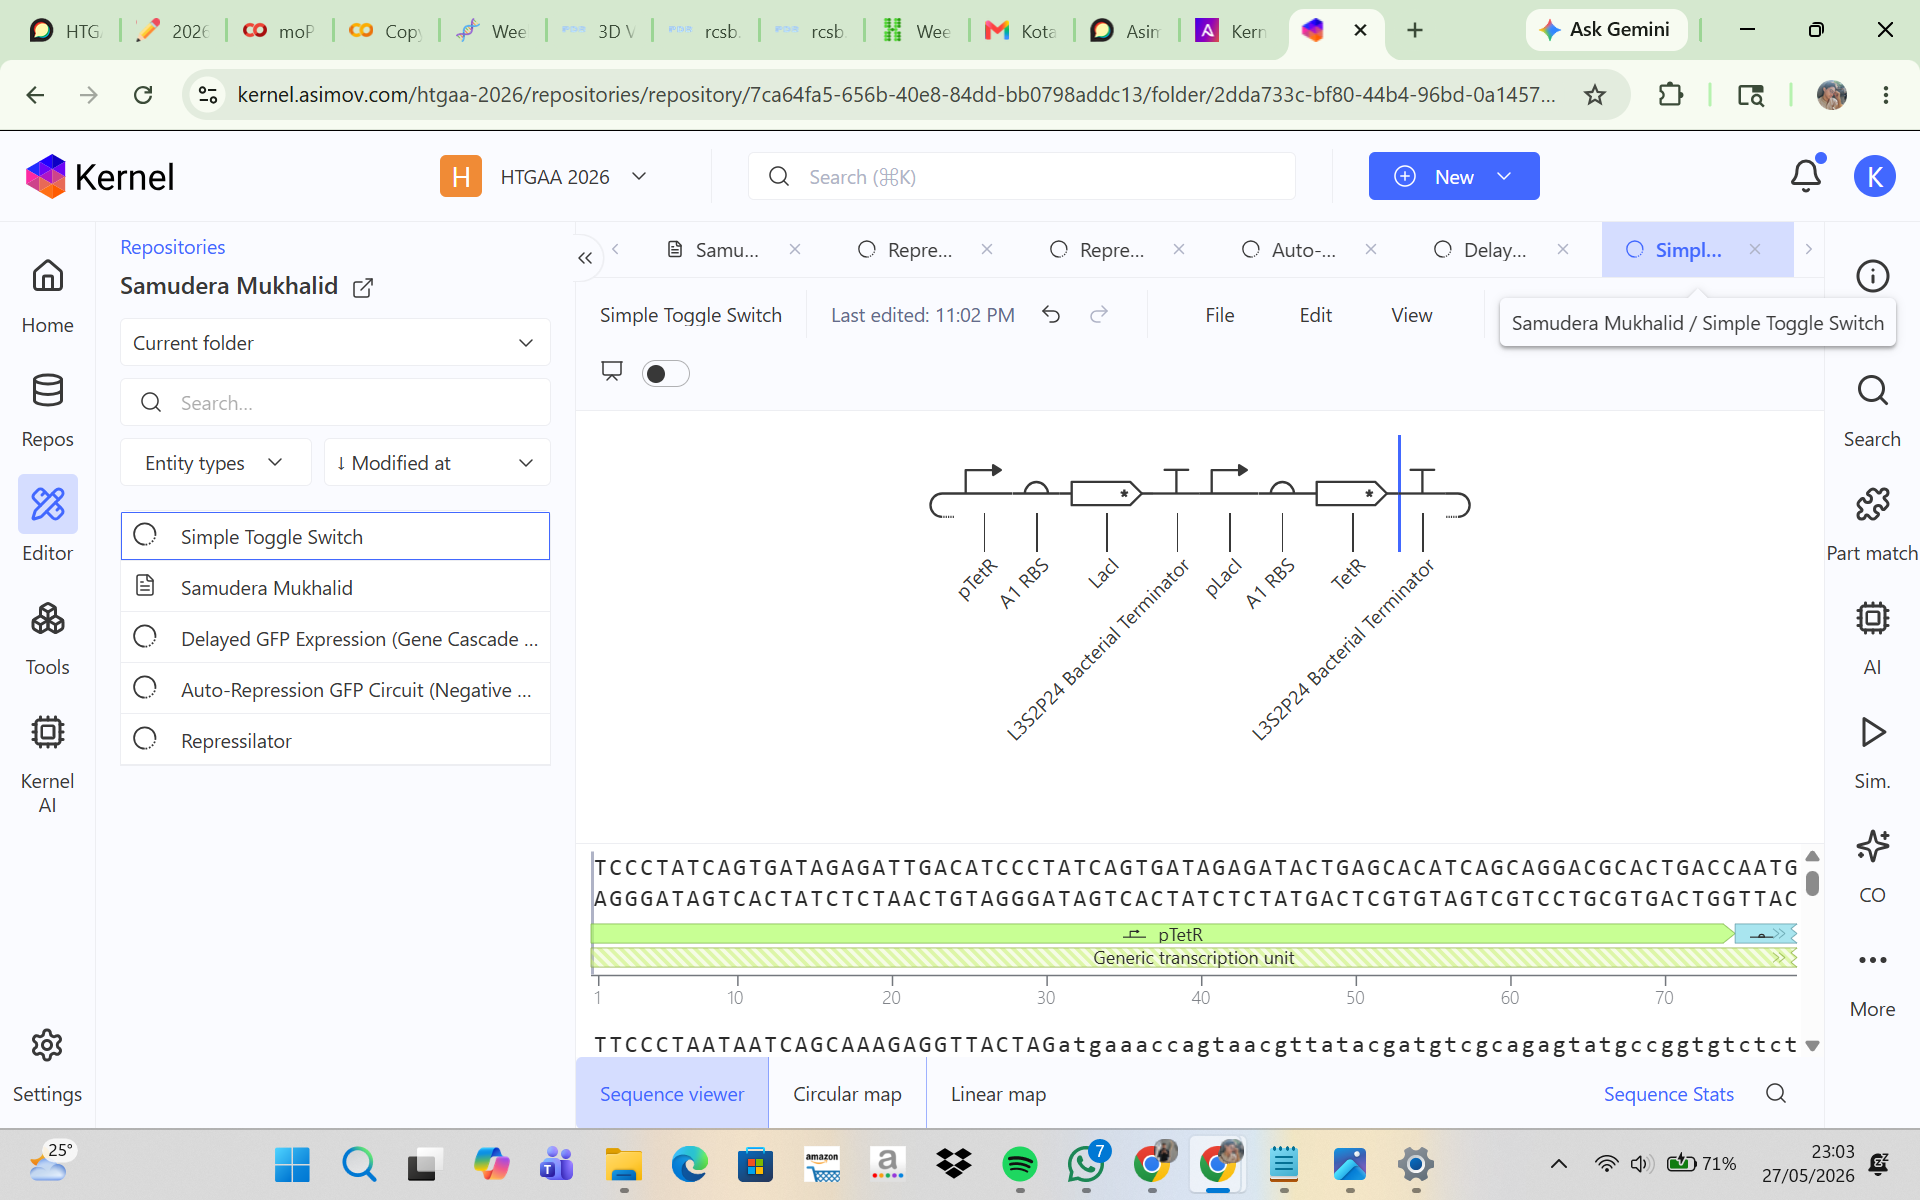
CONSTRUCT 3. Simple Toggle Switch (Bistable Circuit)
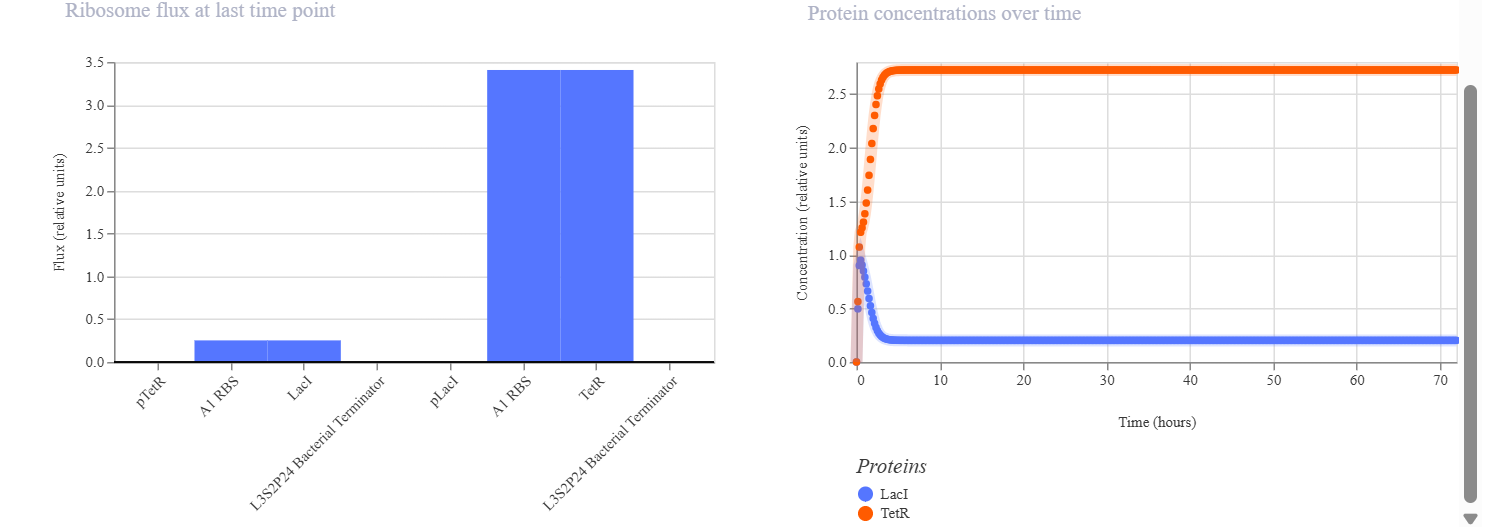
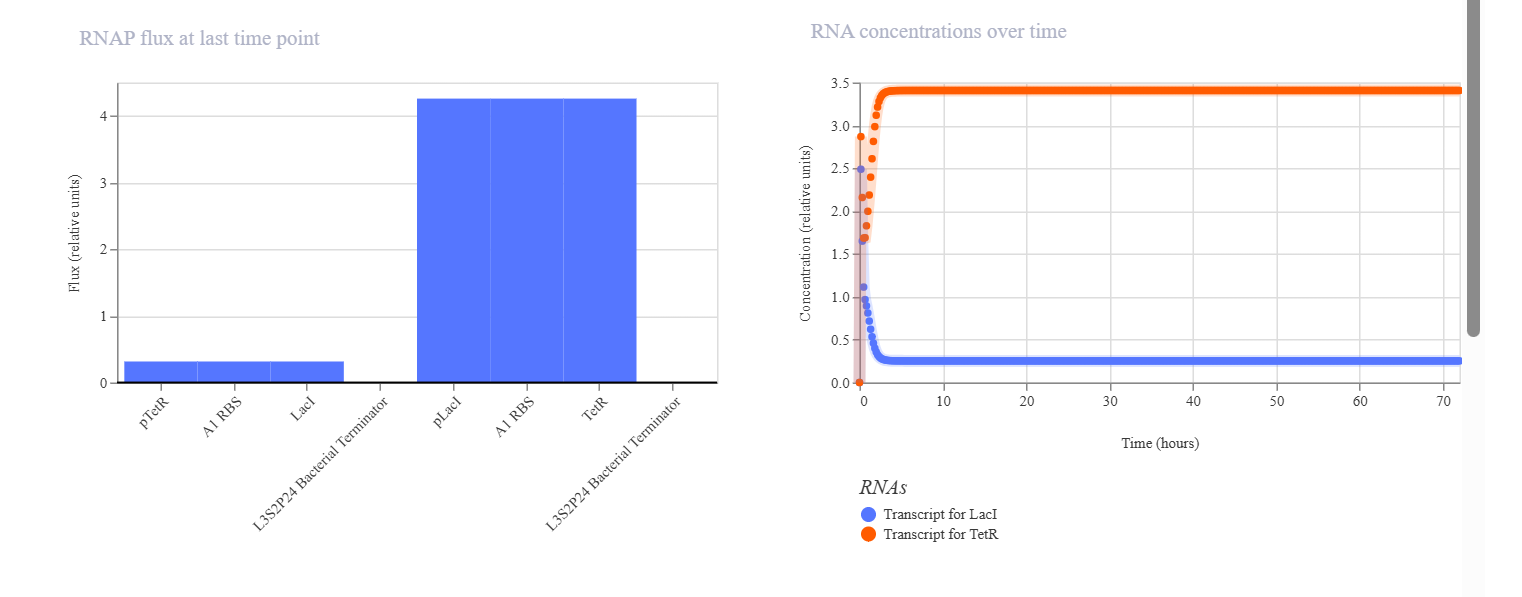
The goal of this construct was to make two proteins mutually inhibit each other so that only one would become dominant. In this system, LacI represses pLacI, while TetR represses pTetR, allowing the two proteins to compete with one another. The initial hypothesis was that the system would exhibit bistability, meaning that one protein would dominate while the other would be suppressed, and that the final state could depend on the initial concentration and simulation parameters. The simulation results and analysis showed that the toggle switch construct successfully produced bistable behavior. TetR became the dominant protein, maintaining a high and stable concentration, while LacI was suppressed to a low level. This indicates that the mutual repression between the two regulators worked effectively. TetR may have dominated because of stronger promoter activity, more effective repression, or an unbalanced initial condition. Adjusting simulation parameters such as promoter strength, degradation rate, and initial concentration may allow the alternative state, in which LacI dominates, to be observed.